


Create successful ePaper yourself
Turn your PDF publications into a flip-book with our unique Google optimized e-Paper software.
<strong>Crop</strong> <strong>Prospects</strong> and <strong>Food</strong> <strong>Situation</strong><br />
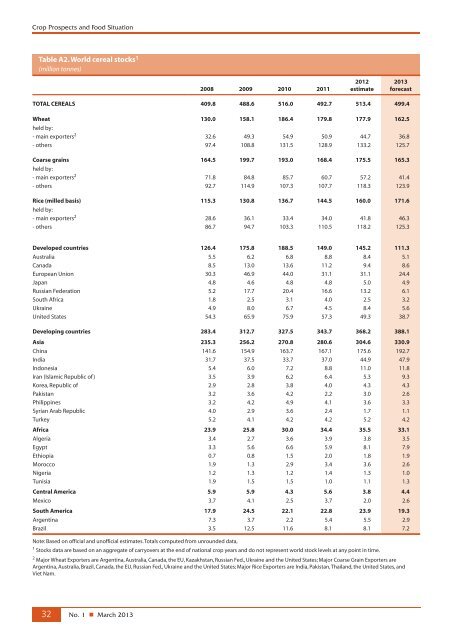
Table A2. World cereal stocks 1<br />
(million tonnes)<br />
32<br />
No. 1 n March 2013<br />
2008 2009 2010 2011<br />
2012<br />
estimate<br />
2013<br />
forecast<br />
TOTAL CEREALS 409.8 488.6 516.0 492.7 513.4 499.4<br />
Wheat 130.0 158.1 186.4 179.8 177.9 162.5<br />
held by:<br />
- main exporters 2 32.6 49.3 54.9 50.9 44.7 36.8<br />
- others 97.4 108.8 131.5 128.9 133.2 125.7<br />
Coarse grains 164.5 199.7 193.0 168.4 175.5 165.3<br />
held by:<br />
- main exporters 2 71.8 84.8 85.7 60.7 57.2 41.4<br />
- others 92.7 114.9 107.3 107.7 118.3 123.9<br />
Rice (milled basis) 115.3 130.8 136.7 144.5 160.0 171.6<br />
held by:<br />
- main exporters 2 28.6 36.1 33.4 34.0 41.8 46.3<br />
- others 86.7 94.7 103.3 110.5 118.2 125.3<br />
Developed countries 126.4 175.8 188.5 149.0 145.2 111.3<br />
Australia 5.5 6.2 6.8 8.8 8.4 5.1<br />
Canada 8.5 13.0 13.6 11.2 9.4 8.6<br />
European Union 30.3 46.9 44.0 31.1 31.1 24.4<br />
Japan 4.8 4.6 4.8 4.8 5.0 4.9<br />
Russian Federation 5.2 17.7 20.4 16.6 13.2 6.1<br />
South Africa 1.8 2.5 3.1 4.0 2.5 3.2<br />
Ukraine 4.9 8.0 6.7 4.5 8.4 5.6<br />
United States 54.3 65.9 75.9 57.3 49.3 38.7<br />
Developing countries 283.4 312.7 327.5 343.7 368.2 388.1<br />
Asia 235.3 256.2 270.8 280.6 304.6 330.9<br />
China 141.6 154.9 163.7 167.1 175.6 192.7<br />
India 31.7 37.5 33.7 37.0 44.9 47.9<br />
Indonesia 5.4 6.0 7.2 8.8 11.0 11.8<br />
Iran (Islamic Republic of ) 3.5 3.9 6.2 6.4 5.3 9.3<br />
Korea, Republic of 2.9 2.8 3.8 4.0 4.3 4.3<br />
Pakistan 3.2 3.6 4.2 2.2 3.0 2.6<br />
Philippines 3.2 4.2 4.9 4.1 3.6 3.3<br />
Syrian Arab Republic 4.0 2.9 3.6 2.4 1.7 1.1<br />
Turkey 5.2 4.1 4.2 4.2 5.2 4.2<br />
Africa 23.9 25.8 30.0 34.4 35.5 33.1<br />
Algeria 3.4 2.7 3.6 3.9 3.8 3.5<br />
Egypt 3.3 5.6 6.6 5.9 8.1 7.9<br />
Ethiopia 0.7 0.8 1.5 2.0 1.8 1.9<br />
Morocco 1.9 1.3 2.9 3.4 3.6 2.6<br />
Nigeria 1.2 1.3 1.2 1.4 1.3 1.0<br />
Tunisia 1.9 1.5 1.5 1.0 1.1 1.3<br />
Central America 5.9 5.9 4.3 5.6 3.8 4.4<br />
Mexico 3.7 4.1 2.5 3.7 2.0 2.6<br />
South America 17.9 24.5 22.1 22.8 23.9 19.3<br />
Argentina 7.3 3.7 2.2 5.4 5.5 2.9<br />
Brazil 3.5 12.5 11.6 8.1 8.1 7.2<br />
Note: Based on official and unofficial estimates. Totals computed from unrounded data,<br />
1 Stocks data are based on an aggregate of carryovers at the end of national crop years and do not represent world stock levels at any point in time.<br />
2 Major Wheat Exporters are Argentina, Australia, Canada, the EU, Kazakhstan, Russian Fed., Ukraine and the United States; Major Coarse Grain Exporters are<br />
Argentina, Australia, Brazil, Canada, the EU, Russian Fed., Ukraine and the United States; Major Rice Exporters are India, Pakistan, Thailand, the United States, and<br />
Viet Nam.