


You also want an ePaper? Increase the reach of your titles
YUMPU automatically turns print PDFs into web optimized ePapers that Google loves.
Table 14. Far East cereal production and anticipated trade in 2012/13 1<br />
(thousand tonnes)<br />
Avg 5-yrs<br />
(2007/08 to<br />
2011/12) 2011/12 2012/13<br />
average. In Sri Lanka, floods during November-December in the<br />
North Western, Northern, Eastern and Uva provinces are forecast<br />
to reduce the main season (Maha) paddy crop to 2.6-2.8 million<br />
tonnes, compared to the 3 million tonnes harvested in 2012.<br />
The 2012 aggregate regional cereal harvest<br />
estimated at a record level<br />
Harvesting of the 2012 main season cereal crops, mostly paddy<br />
and coarse grains, was completed towards the end of the year<br />
in most countries. With most official estimates now available,<br />
FAO puts the subregion’s 2012 aggregate production of cereals<br />
at a record level of 1 214 million tonnes (rice in paddy terms) or<br />
some 3 percent up from the previous year’s record output, mainly<br />
reflecting larger crops in China (+22 million tonnes) and Indonesia<br />
2012/13 over<br />
2011/12<br />
(%)<br />
2012/13 over<br />
5-yr avg<br />
(%)<br />
Cereals - Exports 33 169 37 185 43 063 15.8 29.8<br />
Cereals - Imports 82 889 95 900 89 112 -7.1 7.5<br />
Cereals - Production 902 494 961 533 994 439 3.4 10.2<br />
Rice-millled - Exports 25 676 29 265 28 575 -2.4 11.3<br />
Rice-millled - Imports 9 206 11 763 10 049 -14.6 9.2<br />
Rice-millled - Production 414 972 435 885 440 005 0.9 6.0<br />
Wheat - Exports 2 646 2 427 9 610 296.0 263.2<br />
Wheat - Imports 31 425 36 679 35 333 -3.7 12.4<br />
Wheat - Production 221 414 232 758 244 027 4.8 10.2<br />
1 Marketing year July/June for most countries. Rice trade figures are for the second year shown.<br />
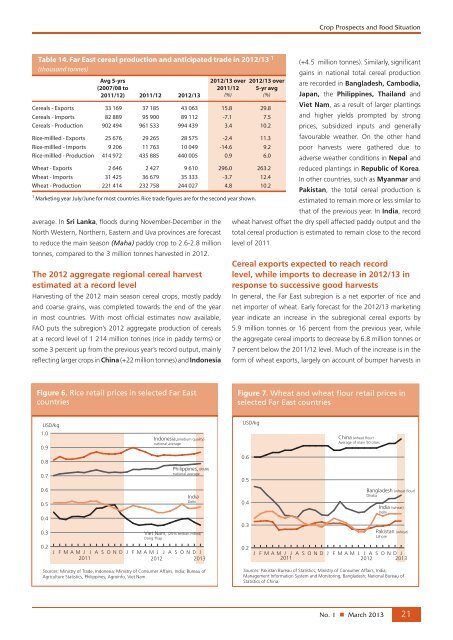
Figure 6. Rice retail prices in selected Far East<br />
countries<br />
USD/kg<br />
1.0<br />
0.9<br />
0.8<br />
0.7<br />
0.6<br />
0.5<br />
0.4<br />
0.3<br />
0.2<br />
Indonesia,(medium quality)<br />
national average<br />
Philippines, (RMR)<br />
national average<br />
India<br />
Delhi<br />
Viet Nam, (25% broken milled)<br />
Dong Thap<br />
J F M A M J J A S O N D J F M A M J J A S O N D J<br />
2011<br />
2012<br />
2013<br />
Sources: Ministry of Trade, Indonesia; Ministry of Consumer Affairs, India; Bureau of<br />
Agriculture Statistics, Philippines; Agroinfo, Viet Nam.<br />
<strong>Crop</strong> <strong>Prospects</strong> and <strong>Food</strong> <strong>Situation</strong><br />
(+4.5 million tonnes). Similarly, significant<br />
gains in national total cereal production<br />
are recorded in Bangladesh, Cambodia,<br />
Japan, the Philippines, Thailand and<br />
Viet Nam, as a result of larger plantings<br />
and higher yields prompted by strong<br />
prices, subsidized inputs and generally<br />
favourable weather. On the other hand<br />
poor harvests were gathered due to<br />
adverse weather conditions in Nepal and<br />
reduced plantings in Republic of Korea.<br />
In other countries, such as Myanmar and<br />
Pakistan, the total cereal production is<br />
estimated to remain more or less similar to<br />
that of the previous year. In India, record<br />
wheat harvest offset the dry spell affected paddy output and the<br />
total cereal production is estimated to remain close to the record<br />
level of 2011.<br />
Cereal exports expected to reach record<br />
level, while imports to decrease in 2012/13 in<br />
response to successive good harvests<br />
In general, the Far East subregion is a net exporter of rice and<br />
net importer of wheat. Early forecast for the 2012/13 marketing<br />
year indicate an increase in the subregional cereal exports by<br />
5.9 million tonnes or 16 percent from the previous year, while<br />
the aggregate cereal imports to decrease by 6.8 million tonnes or<br />
7 percent below the 2011/12 level. Much of the increase is in the<br />
form of wheat exports, largely on account of bumper harvests in<br />
Figure 7. Wheat and wheat flour retail prices in<br />
selected Far East countries<br />
USD/kg<br />
0.6<br />
0.5<br />
0.4<br />
0.3<br />
0.2<br />
China (wheat flour)<br />
Average of main 50 cities<br />
Bangladesh (wheat flour)<br />
Dhaka<br />
India (wheat)<br />
Delhi<br />
Pakistan (wheat)<br />
Lahore<br />
J F M A M J J A S O N D J F M A M J J A S O N D J<br />
2011<br />
2012 2013<br />
Sources: Pakistan Bureau of Statistics; Ministry of Consumer Affairs, India;<br />
Management Information System and Monitoring, Bangladesh; National Bureau of<br />
Statistics of China.<br />
No. 1 n March 2013 21