Anemia - Amgen
Anemia - Amgen
Anemia - Amgen

You also want an ePaper? Increase the reach of your titles
YUMPU automatically turns print PDFs into web optimized ePapers that Google loves.
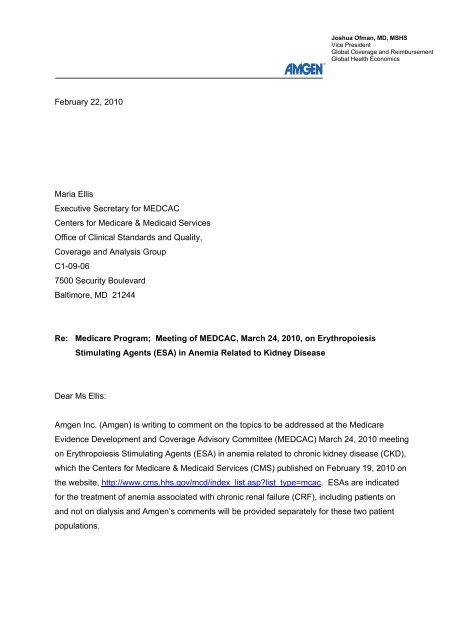
February 22, 2010<br />
Maria Ellis<br />
Executive Secretary for MEDCAC<br />
Centers for Medicare & Medicaid Services<br />
Office of Clinical Standards and Quality,<br />
Coverage and Analysis Group<br />
C1-09-06<br />
7500 Security Boulevard<br />
Baltimore, MD 21244<br />
Re: Medicare Program; Meeting of MEDCAC, March 24, 2010, on Erythropoiesis<br />
Stimulating Agents (ESA) in <strong>Anemia</strong> Related to Kidney Disease<br />
Dear Ms Ellis:<br />
Joshua Ofman, MD, MSHS<br />
Vice President<br />
Global Coverage and Reimbursement<br />
Global Health Economics<br />
<strong>Amgen</strong> Inc. (<strong>Amgen</strong>) is writing to comment on the topics to be addressed at the Medicare<br />
Evidence Development and Coverage Advisory Committee (MEDCAC) March 24, 2010 meeting<br />
on Erythropoiesis Stimulating Agents (ESA) in anemia related to chronic kidney disease (CKD),<br />
which the Centers for Medicare & Medicaid Services (CMS) published on February 19, 2010 on<br />
the website, http://www.cms.hhs.gov/mcd/index_list.asp?list_type=mcac. ESAs are indicated<br />
for the treatment of anemia associated with chronic renal failure (CRF), including patients on<br />
and not on dialysis and <strong>Amgen</strong>’s comments will be provided separately for these two patient<br />
populations.
As a science-based, patient-care driven company, <strong>Amgen</strong> is committed to using science and<br />
innovation to dramatically improve people’s lives and is vitally interested in improving access to<br />
innovative drugs and biologicals for Medicare beneficiaries.<br />
Attached you will find our detailed written submission addressing the use of ESAs in anemia<br />
related to CKD. In particular, we call your attention to Appendix 4 which specifically addresses<br />
the voting questions posted on the CMS website February 19, 2010. <strong>Amgen</strong> appreciates this<br />
opportunity to provide important information and we look forward to the opportunity to discuss<br />
the evidence for ESAs in patients with chronic kidney disease at the upcoming MEDCAC. If<br />
you have any questions or would like to discuss further, then please do not hesitate to contact<br />
me at<br />
Regards,<br />
Joshua J. Ofman, MD, MSHS<br />
Vice President,<br />
Global Coverage and Reimbursement and Global Health Economics
Table of Contents<br />
Page 1<br />
INTRODUCTION............................................................................................................... 4<br />
1. CKD PATIENTS ON DIALYSIS ............................................................................... 7<br />
1.1 Treatment of <strong>Anemia</strong> in Dialysis Patients Prior to ESAs .............................. 7<br />
1.2 Adverse Sequelae of RBC Transfusion Therapy ......................................... 7<br />
1.3 Development of ESAs and their Impact on Dialysis Patients ..................... 10<br />
1.4 Current ESA Approved Indications............................................................. 12<br />
1.5 Characteristics of the US Dialysis Population ............................................ 13<br />
1.6 Overview of ESA use in General Dialysis Clinical Practice........................ 15<br />
1.7 10 g/dL as the Lower Threshold for ESA Treatment in Dialysis<br />
Patients ...................................................................................................... 17<br />
1.8 Attempts to Improve CV Outcomes in Dialysis Patients by<br />
Targeting Hemoglobin Levels Outside the FDA-Approved Range<br />
(13 g/dL or higher)...................................................................................... 19<br />
1.9 Association of Higher Achieved Hemoglobin and Clinical<br />
Outcome..................................................................................................... 21<br />
1.10 Association of ESA Dose and Adverse Events: Contribution of<br />
Confounding Factors in Dialysis Patients................................................... 21<br />
1.11 New Data from a CV Outcomes Trial Targeting Hemoglobin<br />
Levels above 12 g/dL ................................................................................. 24<br />
1.12 CONCLUSION: ESA THERAPY IS AN ESSENTIAL<br />
TREATMENT FOR DIALYSIS PATIENTS ................................................. 24<br />
2. CKD PATIENTS NOT ON DIALYSIS (CKD-NOD)................................................. 26<br />
2.1 Transfusion Therapy in CKD-NOD Patients............................................... 26<br />
2.2 Adverse Sequelae of Transfusion Therapy ................................................ 27<br />
2.3 Benefits of ESA Therapy in CKD-NOD Patients ........................................ 27<br />
2.4 <strong>Anemia</strong> and CV Outcomes in CKD-NOD ................................................... 30<br />
2.5 Overview of ESA use in General CKD-NOD Clinical Practice ................... 31<br />
2.6 Trial to Reduce Cardiovascular Events with Aranesp ® Therapy<br />
(TREAT) Trial in Diabetic CKD-NOD Patients............................................ 32<br />
2.7 CONCLUSION: ESA THERAPY IN CKD-NOD PATIENTS IS<br />
AN IMPORTANT TREATMENT OPTION IN THOSE FOR<br />
WHOM TRANSFUSION AVOIDANCE IS A MEANINGFUL<br />
CLINICAL BENEFIT ................................................................................... 34<br />
REFERENCES................................................................................................................ 35<br />
Technical Appendix 1 – Evidence Tables ....................................................................... 40<br />
Technical Appendix 2 - Literature References................................................................ 71<br />
Technical Appendix 3 – PI for Aranesp and EPOGEN ..................................................159<br />
Technical Appendix 4 – Response to Voting Questions ................................................217
List of Tables<br />
Page 2<br />
Table 1. Results from the studies evaluating the association between<br />
EPOGEN ® dose and mortality using methods to address<br />
confounding-by-indication........................................................................ 23<br />
List of Figures<br />
Figure 1. (a) Relationship between the number of transfusions and the risk of<br />
allo-sensitization (measured as panel reactive antibody [PRA]<br />
> 50%; PRA measures anti-human antibodies in the blood) 18 ,<br />
(b) The median time spent on the transplant wait list by the<br />
level of allo-sensitization (measured as PRA < 10% versus<br />
> 10%) and (c) The likelihood of dying while waiting for<br />
transplant 2 .................................................................................................. 8<br />
Figure 2. (a) Long-term (10-year) graft survival of cadaver kidney transplants<br />
according to pre-transplant allo-sensitization (measured as<br />
PRA), and (b) 10-year follow-up of kidney grafts from HLAidentical<br />
sibling donors 20 ............................................................................ 9<br />
Figure 3. Time to transplantation and death among patients 60 years of age<br />
and older on the transplant wait-list 21 ....................................................... 10<br />
Figure 4. Percent of patients receiving a transfusion at baseline and in weeks<br />
1-12 and 13-24 for patients randomized to Epoetin alfa and<br />
placebo treatment (<strong>Amgen</strong>, data on file).................................................. 11<br />
Figure 5. Improvements in exercise tolerance and physical function observed<br />
when hemoglobin levels were increased to a mean of 10.2<br />
g/dL and 11.8 g/dL with EPOGEN ® compared to placebotreated<br />
patients (<strong>Amgen</strong>, data on file; EPOGEN ® Prescribing<br />
information [PI]) ....................................................................................... 12<br />
Figure 6. Forest plot of pre-versus post-ESA comparison studies of VO2 23 .................. 13<br />
Figure 7. Transfusion rate in US dialysis patients over time expressed as<br />
percent of patients receiving transfusions in each quarter-year<br />
period 2 . Note: PMMIS and Medicare claims represent all<br />
outpatient transfusion events occurring in the dialysis unit...................... 14<br />
Figure 8. Hemoglobin levels and transfusion rates between 1991 and 2007 2 ............... 14<br />
Figure 9. Mortality rate and hemoglobin levels preceding and following the<br />
introduction of EPOGEN ®27 28 .................................................................. 15<br />
Figure 10. Percentage of hemoglobin measurements in specific ranges for<br />
the dialysis patient population (<strong>Amgen</strong> data on file; this data is<br />
shared with CMS on an ongoing basis) ................................................... 17<br />
Figure 11. Transfusion risk by the previous month’s hemoglobin level in the<br />
lower arm of the Normal Hematocrit Cardiac Trial (NHCT)<br />
(<strong>Amgen</strong>, data on file) ............................................................................... 17
Page 3<br />
Figure 12. Transfusion rates by the number of months with an outpatient<br />
hemoglobin below 10 g/dL, and separately below 11 g/dL, in<br />
approximately 160,000 US hemodialysis patients in 2004 34 .................... 18<br />
Figure 13. Percentage of patients with hemoglobin > 13 g/dL for ≥ 3<br />
months 32 .................................................................................................. 20<br />
Figure 14. The risk of transfusion by hemoglobin levels in anemic CKD-NOD<br />
patients treated with ESAs and iron and among those not<br />
receiving treatment (n = 97,636) 66 ........................................................... 27<br />
Figure 15. Transfusion rate among ESA treated CKD-NOD patients with<br />
anemia over time 64 ................................................................................... 28<br />
Figure 16. Hemoglobin levels and associated Kidney Disease Questionnaire<br />
(KDQ) scores for physical symptoms, fatigue, depression,<br />
relationship with others, frustration, and overall KDQ 74<br />
(Clinically meaningful change in KDQ is 0.2-0.5 75 )................................. 29<br />
Figure 17. A meta-analysis of the difference in SF-36 physical function and<br />
vitality scores between higher and lower hemoglobin levels in<br />
CKD-NOD patients; WMD = weighted mean difference 76 ........................ 30<br />
Figure 18. Percentage of hemoglobin measurements in specific ranges for<br />
the CKD-NOD patient population (<strong>Amgen</strong> data on file; these<br />
data are shared with CMS on an ongoing basis)..................................... 32
Page 4<br />
INTRODUCTION<br />
The approval of the first recombinant erythropoiesis-stimulating agent (ESA), Epoetin<br />
alfa, in 1989 represented an important scientific breakthrough in medicine and<br />
revolutionized the care of patients with anemia of chronic renal failure (CRF). <strong>Amgen</strong><br />
Inc. (<strong>Amgen</strong>), the United States (US) license holder of Epoetin alfa and darbepoetin alfa,<br />
developed erythropoiesis-stimulating agents (ESAs) as supportive therapies to stimulate<br />
red blood cell (RBC) production in order to elevate and maintain hemoglobin<br />
concentrations in patients with CRF and anemia in order to avoid RBC transfusions and<br />
improve patient reported outcomes (PRO). The ability to produce erythropoietin (the<br />
hormone produced by the kidneys to stimulate RBC formation) is impaired in chronic<br />
kidney disease (CKD) patients and this impairment is the primary cause of anemia in this<br />
disease. In the US, Epoetin alfa is marketed under the trade names EPOGEN ® by<br />
<strong>Amgen</strong> for the treatment of anemia in dialysis, and PROCRIT ® by Centocor Ortho<br />
Biotech Inc. for the treatment of anemia in CKD not on dialysis (NOD). Darbepoetin alfa<br />
is marketed under the trade name Aranesp ® by <strong>Amgen</strong> for both CKD-NOD and dialysis.<br />
<strong>Amgen</strong> will focus its comments on the use of EPOGEN ® in dialysis and Aranesp ® in<br />
CKD-NOD, while Centocor Ortho Biotech Inc. will provide comments on PROCRIT ® . In<br />
this document, the term chronic renal failure (CRF) will be used when referring to the US<br />
Food and Drug Administration (FDA)-approved label; otherwise the more commonly<br />
employed term, CKD, will be used. Additionally, the term ESA will be used when<br />
referring to this class of drugs.<br />
ESAs are used to elevate or maintain RBC levels (as manifested by the hemoglobin or<br />
hematocrit determinations) and to decrease the need for RBC transfusions. EPOGEN ®<br />
and Aranesp ® are approved for the treatment of anemia associated with CRF, which<br />
includes patients receiving and not receiving dialysis. <strong>Amgen</strong> has prepared this<br />
document in response to the Medicare Evidence Development and Coverage Advisory<br />
Committee (MEDCAC) meeting scheduled by the Centers for Medicare and Medicaid<br />
Services (CMS) to review the available evidence on the use of erythropoiesis-stimulating<br />
agents (ESAs) to manage anemia in patients who have chronic kidney disease. Since<br />
the regulatory approval of ESAs for the treatment of anemia in CKD, safety concerns<br />
have been raised based on the results of randomized controlled trials (RCTs) designed<br />
to evaluate the potential for cardiovascular (CV) and survival benefit when normalizing<br />
hemoglobin with ESAs. These trials treated patients to higher hemoglobin targets—
above the current labeled range (hemoglobin 10-12 g/dL); the hemoglobin targets<br />
evaluated in these studies do not reflect how ESAs are used in clinical practice.<br />
Page 5<br />
There are significant differences in the characteristics of dialysis and CKD-NOD patients,<br />
including demographic characteristics, the extent of morbidity and mortality, and the<br />
intensity of clinical management required for their treatment 1, 2 . Most notable among<br />
these differences is that dialysis patients have significantly more co-morbid conditions,<br />
such as: diabetes, hypertension, heart failure, infectious complications, and a more<br />
profound erythropoietin deficiency. These patients are subject to continuous blood loss<br />
from the dialysis procedure, which results in more profound anemia that is nearly<br />
universal in the absence of treatment. Dialysis patients depend on regular dialysis<br />
treatments to sustain life; typically, death ensues within two weeks when dialysis<br />
treatment is withdrawn 3 .<br />
In dialysis patients, ESAs are an important therapy in the management of anemia and<br />
have a positive benefit to risk profile when used according to the FDA-approved label to<br />
reduce the need for RBC transfusions. ESAs are effective at increasing hemoglobin<br />
levels in order to reduce the need for transfusions and to improve physical function and<br />
exercise tolerance in dialysis patients. Transfusion avoidance protects against<br />
cumulative hazards, especially allo-sensitization, which is the generation of antibodies to<br />
foreign antigens that may impair or preclude eligibility for renal transplant, and increase<br />
the likelihood of transplant rejection. Even the recent technique of removing white cells<br />
from blood prior to transfusion (leuko-reduction) does not decrease the hazard of allosensitization<br />
4 . Clinical trials and observational data have demonstrated that the risk of<br />
transfusion increases substantially when hemoglobin levels fall below 10 g/dL; this<br />
supports 10 g/dL as the appropriate lower limit for clinical benefit and aligns with the<br />
labeled range. With increasing hemoglobin, the transfusion benefit continuously<br />
improves through the labeled hemoglobin range of 12 g/dL. Because of the intrinsic<br />
hemoglobin variability seen in dialysis patients, a 2 g/dL range is appropriate, thus<br />
supporting the upper hemoglobin level of 12 g/dL, aligning with the label. The<br />
hemoglobin target range accommodates hemoglobin variability and allows physicians to<br />
treat individual patients to attain the hemoglobin level necessary to avoid transfusion.<br />
Additionally, near-complete surveillance of the dialysis population has not provided<br />
evidence of an increased rate of death when patients are treated to the FDA-approved<br />
ESA labeled hemoglobin range. The evidence supports that the labeled hemoglobin
Page 6<br />
range of 10 to 12 g/dL is necessary and prudent to maximize the benefit of transfusion<br />
avoidance in a way that recognizes and minimizes the risk of cardiovascular (CV) events<br />
that have been observed in trials of high hemoglobin targets (≥ 13 g/dL). This range<br />
allows physicians to manage anemia in dialysis patients effectively.<br />
In CKD-NOD patients, while the prevalence of anemia is lower, anemia can be severe<br />
in some patients and transfusions are more common than has been appreciated.<br />
Among those with severe anemia, the administration of ESAs is appropriate to avoid the<br />
risks of transfusion, and, in particular, the risk of allo-sensitization, which can reduce<br />
both transplant eligibility and graft survival. ESA therapy should be initiated when<br />
hemoglobin levels decline below 10 g/dL and patients are iron replete. The<br />
demonstrated benefit of transfusion reduction with ESA use is observed when<br />
hemoglobin levels are treated to above 10 g/dL. ESA therapy should be individualized<br />
to achieve and maintain hemoglobin between 10 and 12 g/dL. As with dialysis patients,<br />
CKD-NOD patients demonstrate intrinsic hemoglobin variability and the practical<br />
limitations of managing hemoglobin require the use of a hemoglobin range in order to<br />
administer ESAs to maximize the clinical benefit for each patient. A hemoglobin level of<br />
12 g/dL as the upper end of the hemoglobin range will allow physicians the necessary<br />
discretion to manage individual patients so as to reduce transfusions. Avoiding a<br />
hemoglobin target > 12 g/dL provides a safety margin against the higher hemoglobin<br />
target in the Trial to Reduce Cardiovascular Events with Aranesp ® Therapy (TREAT)<br />
(≥ 13.0 g/dL) and the Correction of Hemoglobin and Outcomes in Renal Insufficiency<br />
(CHOIR) (~13.5 g/dL) where risks have been identified. The evidence supports that<br />
ESAs are an important therapy for anemic CKD-NOD patients in whom transfusion<br />
avoidance is a meaningful clinical goal and that ESAs have a positive benefit to risk<br />
profile when used according to the FDA-approved labeling in these patients.<br />
Nonetheless, in response to the results of the TREAT trial, <strong>Amgen</strong> is working with global<br />
regulatory authorities on potential changes to labeling to provide more detailed guidance<br />
to physicians on optimizing dosing to achieve hemoglobin levels within the target range.<br />
In addition, safety warnings have been strengthened; further labeling changes are likely.<br />
In this evidence review and accompanying supporting documents, the use of ESAs in<br />
CKD patients on dialysis and CKD-NOD patients are presented separately. There is a<br />
technical summary at the end of the review which includes a) relevant citations including<br />
those reporting the results of the registrational trials, and b) evidence tables
summarizing the published literature on transfusion patterns, costs of transfusions,<br />
hemoglobin variability, hospitalization, health resource utilization and patient reported<br />
outcomes in CKD patients. These evidence tables include the most commonly cited<br />
references; a systematic review was not conducted.<br />
Page 7<br />
1. CKD PATIENTS ON DIALYSIS<br />
In 2007 in the US, there were over 527,000 patients with end-stage renal disease<br />
(ESRD) who required either dialysis or a kidney transplant for survival 2 . Typically,<br />
patients receive dialysis treatments three times per week. During each dialysis session,<br />
their blood is circulated through a dialyzer that removes solutes (such as urea and<br />
accumulated fluids that are normally removed by the kidney) and restores electrolyte<br />
balance. Dialysis treatment, while life sustaining, compounds the anemia 5 caused by<br />
deceased erythropoietin levels 6, 7 . Blood is lost during each dialysis procedure 5 , from<br />
frequent blood sampling to monitor laboratory parameters, and from increased bleeding<br />
tendency attributable to anticoagulation (heparin) therapy administered during the<br />
dialysis. There is also an increased risk of gastrointestinal bleeding and re-bleeding<br />
after therapy in dialysis patients 8, 9 . Blood loss is estimated to be between 2.5 and 5.1 L<br />
(5-10 Units) of blood annually 5 , up to double the normal circulating blood volume. Thus,<br />
there are many factors contributing to the anemia in dialysis patients, and, in the<br />
absence of ESA therapy, anemia is often times very severe.<br />
1.1 Treatment of <strong>Anemia</strong> in Dialysis Patients Prior to ESAs<br />
Prior to the development of ESAs, the treatment options for anemia were limited to RBC<br />
transfusions, and to a smaller extent, androgen and iron therapy 10 . Androgens and iron<br />
therapy had only modest efficacy and substantial side effects, leaving RBC transfusions<br />
as the mainstay of anemia therapy in the pre-ESA era. Data from the pre-ESA era<br />
indicate that patients had a mean hemoglobin of approximately 7 g/dL 11 .<br />
1.2 Adverse Sequelae of RBC Transfusion Therapy<br />
RBC transfusions are by their nature only transiently effective in a population that is<br />
chronically unable to produce sufficient RBCs 12 . They carry a range of hazards including<br />
transmission of blood borne viral diseases, transfusion reactions, acute volume and<br />
potassium overload, and more chronically, iron overload 10, 13-16 . In the pre-ESA era, 55-<br />
60% of dialysis patients received transfusions to avoid severe anemia 11 (<strong>Amgen</strong>, data on<br />
file).
Page 8<br />
Perhaps the RBC transfusion risk that has the greatest impact on the lives of dialysis<br />
patients is the potential for allo-sensitization to foreign antigens 2, 17, 18 , as development of<br />
such antibodies can delay or preclude kidney transplantation and impair the function of<br />
kidney transplants that do occur 2, 19 (Figure 1a-1c).<br />
Figure 1. (a) Relationship between the number of transfusions and the risk of allosensitization<br />
(measured as panel reactive antibody [PRA] > 50%; PRA measures<br />
anti-human antibodies in the blood) 18 , (b) The median time spent on the transplant<br />
wait list by the level of allo-sensitization (measured as PRA < 10% versus > 10%)<br />
and (c) The likelihood of dying while waiting for transplant 2 .<br />
Early research suggested that a single transfusion event could result in sensitization in<br />
~33% of patients 4 . More recent evidence using enhanced methods for detecting allosensitization<br />
(methods that are now being adopted by the United Network of Organ<br />
Sharing [UNOS]) suggest that as many as 75% of patients are sensitized after a single<br />
transfusion (D Tynan, personal communication; <strong>Amgen</strong>, data on file). Sensitization by<br />
transfusion is avoidable in these patients; the other two mechanisms that can cause<br />
sensitization, pregnancy and previous transplant 17 are not readily mitigated. The risk of<br />
transfusion and allo-sensitization may be reduced but not eliminated by leuko-reduction 4 .<br />
Allo-sensitization may result in a decline in graft survival 17 among cadaveric<br />
transplanted patients who are sensitized (Figure 2a) and also among HLA-identical<br />
sibling donors (Figure 2b) 20 . This last finding is notable because these transplants are<br />
expected to have lower immunological barriers to transplantation and greatest overall<br />
success.
Page 9<br />
Figure 2. (a) Long-term (10-year) graft survival of cadaver kidney transplants<br />
according to pre-transplant allo-sensitization (measured as PRA), and (b) 10-year<br />
follow-up of kidney grafts from HLA-identical sibling donors 20 .<br />
Kidney transplant is the preferred ESRD treatment modality because successfully<br />
transplanted patients have superior survival and quality of life and significantly reduced<br />
health resource utilization and cost 2 . Receiving a transfusion can limit a dialysis<br />
patient’s likelihood of receiving a transplant by prolonging their wait for a matching<br />
kidney. Patients who wait longer for a transplant are more likely to die rather than<br />
receive a kidney 19 . The effect of prolonged waiting time on the risk of death is most<br />
pronounced among patients 60 years and older. Recent estimates suggest that nearly<br />
50% will die within 5 years if they have not received a transplant 21 (Figure 3).
Page 10<br />
Figure 3. Time to transplantation and death among patients 60 years of age and<br />
older on the transplant wait-list 21 .<br />
In the pre-ESA era, while necessary for management of anemia, the risks related to<br />
transfusion limited their use, and as a result, hemoglobin levels were maintained at a<br />
level of approximately 7 g/dL 11 . Since patients were maintained at these low hemoglobin<br />
levels, they experienced persistent, severe fatigue and had restrictions on physical<br />
functioning—all of which contributed to a poor quality of life.<br />
1.3 Development of ESAs and their Impact on Dialysis Patients<br />
The primary registration trials (five studies) used for the approval of Epoetin alfa<br />
demonstrated correction of anemia and virtual elimination of transfusions (>90%<br />
reduction) in patients treated with ESAs to a mean hemoglobin of 11.7 g/dL (within the<br />
target range of 10.7 to 12.7 g/dL). In placebo treated patients, hemoglobin levels<br />
remained low (< 7 g/dL) and these patients continued to receive multiple transfusions,<br />
while the Epoetin alfa treated group became nearly transfusion independent (<strong>Amgen</strong><br />
Clinical Study Report, data on file) (Figure 4).
Page 11<br />
Figure 4. Percent of patients receiving a transfusion at baseline and in weeks 1-12<br />
and 13-24 for patients randomized to Epoetin alfa and placebo treatment (<strong>Amgen</strong>,<br />
data on file).<br />
The original registration studies also evaluated the impact of raising hemoglobin levels<br />
with ESA therapy on physical functioning and quality of life. Exercise tolerance (meters<br />
walked) and physical function improved compared to placebo in patients receiving<br />
Epoetin alfa with both achieved hemoglobin levels of 10.2 g/dL as well as 11.7 g/dL at 6<br />
months 22 . These improvements were statistically significantly different compared to<br />
placebo, as well as clinically meaningful (Figure 5). Exercise tolerance and physical<br />
function were significantly improved with ESA treatment, rising by approximately 30%<br />
after 6 months of treatment as defined by the meters walked 11, 22 .
Page 12<br />
Figure 5. Improvements in exercise tolerance and physical function observed<br />
when hemoglobin levels were increased to a mean of 10.2 g/dL and 11.8 g/dL with<br />
EPOGEN ® compared to placebo-treated patients (<strong>Amgen</strong>, data on file; EPOGEN ®<br />
Prescribing information [PI])<br />
1.4 Current ESA Approved Indications<br />
EPOGEN ® and Aranesp ® are approved for the treatment of anemia associated with<br />
CRF, which includes patients receiving and not receiving dialysis. ESAs are used to<br />
elevate or maintain RBC levels (as manifested by the hemoglobin or hematocrit<br />
determinations) and to decrease the need for transfusions in these patients. The<br />
EPOGEN ® label also includes a quality of life benefit (improved exercise tolerance and<br />
physical functioning) as demonstrated in the Canadian Erythropoietin Study Group 22<br />
(<strong>Amgen</strong>, data on file). The benefit on patient reported outcomes, including improvement<br />
in energy, physical function and exercise tolerance (as measured by VO2 max), resulting<br />
from treatment with ESAs to hemoglobin levels greater than 10 g/dL, has been shown<br />
consistently in subsequent open-label and observational studies and summarized in a<br />
recent meta-analysis 23 (Figure 6).
Figure 6. Forest plot of pre-versus post-ESA comparison studies of VO2 23<br />
Page 13<br />
1.5 Characteristics of the US Dialysis Population<br />
In the US, extensive data on the health care provided to the majority of dialysis patients<br />
(Medicare primary insurer) is captured by the US Renal Data System (USRDS).<br />
Consequently, dialysis patients are subject to near complete surveillance; patient care<br />
information including medications, biochemical parameters and morbidity and mortality<br />
outcomes are systematically collected. This pharmacovigilance system is unique among<br />
disease states. Since USRDS has been in continuous operation for over 20 years, the<br />
evaluation of trends in treatments and outcomes in the dialysis population is possible.<br />
In the pre-ESA era, a substantial fraction of transfusions were administered for chronic<br />
anemia in the outpatient dialysis unit. Almost immediately following the introduction of
EPOGEN ® into clinical practice (June 1989), the transfusion rate among US<br />
hemodialysis patients fell sharply (Figure 7).<br />
Page 14<br />
Figure 7. Transfusion rate in US dialysis patients over time expressed as percent<br />
of patients receiving transfusions in each quarter-year period 2 . Note: PMMIS and<br />
Medicare claims represent all outpatient transfusion events occurring in the<br />
dialysis unit.<br />
By 1992 almost 90% of US dialysis patients received ESA therapy and this treatment<br />
prevalence continues today 24 . In 1994, the EPOGEN ® label was changed to expand the<br />
10 to 11 g/dL hemoglobin range to 10 to 12 g/dL, a change that was supported by<br />
clinical practice guidelines. Between 1992, when the mean population hemoglobin was<br />
~9.8 g/dL, and 2000, when, with increased treatment intensity, the mean population<br />
hemoglobin had risen to ~11.2 g/dL, the total transfusion rate (inpatient plus outpatient)<br />
was again halved 25 (Figure 8).<br />
Figure 8. Hemoglobin levels and transfusion rates between 1991 and 2007 2<br />
Mean Hb (g/dL)<br />
13.00<br />
12.00<br />
11.00<br />
10.00<br />
9.00<br />
1991 1993 1995 1997 1999 2001 2003 2005 2007<br />
Year<br />
Mean Hb<br />
Transfusions<br />
16.00<br />
12.00<br />
8.00<br />
4.00<br />
0.00<br />
Transfusion (% pateints/quarter)
Page 15<br />
These data provided important surveillance information on clinical practice and<br />
population level blood supply utilization supporting the label range (10-12 g/dL) as an<br />
effective strategy for reducing RBC transfusions in outpatient dialysis facilities. The<br />
decline in transfusions was primarily in the outpatient setting; the majority of remaining<br />
transfusions occur in the inpatient setting (75%) 26 .<br />
As part of the routine surveillance of US dialysis patients by USRDS, important clinical<br />
outcomes such as mortality are evaluated annually. These data indicate that since the<br />
introduction of EPOGEN ® into clinical practice and its wide spread adoption as the<br />
primary treatment for anemia over the past 20 years, the overall mortality rate in the<br />
dialysis population has not increased (Figure 9).<br />
Figure 9. Mortality rate and hemoglobin levels preceding and following the<br />
®27 28<br />
introduction of EPOGEN<br />
Thus, there is evidence of an important and tangible clinical benefit of transfusion<br />
avoidance, and no evidence of an overt safety signal when patients are treated<br />
according to the FDA-approved label in general clinical practice.<br />
1.6 Overview of ESA use in General Dialysis Clinical Practice<br />
The goals of the use of medicines in clinical practice are to maximize benefit and<br />
minimize risk consistent with FDA-approved labeling. Reimbursement policies have<br />
been designed, in many respects, to enable physicians to treat individual patients<br />
consistent with the approved label. For ESAs, the current policy allows physicians to<br />
individualize treatment to achieve and maintain hemoglobin levels between 10 and<br />
12 g/dL so as to reduce the need of RBC transfusions and avoid sustained high<br />
hemoglobin levels. Research over the past 10 years has described the considerable
Page 16<br />
variation in hemoglobin levels in dialysis patients 29-31 and has highlighted the difficulty of<br />
maintaining patients within a narrow hemoglobin range. The current CMS payment<br />
policy is clinically-based and takes into account the transient fluctuations in hemoglobin<br />
levels that commonly occur in the dialysis patient population.<br />
Reimbursement policies for ESAs have been dynamic over the last two decades,<br />
reflecting changes in label and practice guidelines for the treatment of anemia in CKD<br />
and the appropriate administration of ESAs with regard to the safety and efficacy profile.<br />
Changes made to the EMP effective January 1, 2008 have had the desired effect in<br />
decreasing the occurrence of excessive hemoglobin levels in dialysis patients; the mean<br />
population hemoglobin has also decreased. Recently published data indicate that mean<br />
hemoglobin levels in the dialysis patient population has decreased from 12.08 g/dL (SD<br />
1.48) in June 2006 to 11.71 g/dL (SD 1.35) in November 2008 32 . Additional surveillance<br />
data on ~87% of dialysis centers in the US indicates that as of December 2009, the<br />
mean hemoglobin continues to decline and is approximately 11.54 g/dL (<strong>Amgen</strong> data on<br />
file). Analysis of surveillance data also indicates that the majority of physicians (98%)<br />
are acting to appropriately reduce ESA doses when hemoglobin levels exceed the FDAapproved<br />
target range 33 . Examining specific hemoglobin categories, the percentage of<br />
patients with a monthly hemoglobin value greater than 12 g/dL has declined (from 53.1<br />
to 34.1%) and the proportion within the labeled range has increased from 40.7 to 56.8%.<br />
(<strong>Amgen</strong> data on file) (Figure 10). <strong>Amgen</strong> routinely shares this surveillance data with<br />
CMS on an ongoing basis.
Page 17<br />
Figure 10. Percentage of hemoglobin measurements in specific ranges for the<br />
dialysis patient population (<strong>Amgen</strong> data on file; this data is shared with CMS on<br />
an ongoing basis)<br />
1.7 10 g/dL as the Lower Threshold for ESA Treatment in Dialysis<br />
Patients<br />
As demonstrated in both clinical trials in dialysis patients and in observational data, the<br />
risk of transfusion rises significantly as the outpatient hemoglobin in the preceding month<br />
falls below 10 g/dL and this risk increases when hemoglobin levels drop further (<strong>Amgen</strong>,<br />
data on file) (Figure 11).<br />
Figure 11. Transfusion risk by the previous month’s hemoglobin level in the lower<br />
arm of the Normal Hematocrit Cardiac Trial (NHCT) (<strong>Amgen</strong>, data on file)<br />
Hazard Ratio (95% CI)<br />
8<br />
7<br />
6<br />
5<br />
4<br />
3<br />
2.5<br />
2<br />
1.5<br />
1.2<br />
1<br />
0.8<br />
0.6<br />
0.4<br />
The Risk of Transfusion by the Previous Month's Hemoglobin Level<br />
< 9 9 - < 10 10 - < 11 11 - < 12 >=12<br />
Data Source: NHCT study, data on file<br />
Hemoglobin level (g/dL)
Page 18<br />
An analysis of nearly 160,000 US hemodialysis patients in Medicare data further indicate<br />
that the risk of transfusion increases substantially the longer hemoglobin levels remain<br />
below 10 g/dL 34 (Figure 12).<br />
Figure 12. Transfusion rates by the number of months with an outpatient<br />
hemoglobin below 10 g/dL, and separately below 11 g/dL, in approximately<br />
160,000 US hemodialysis patients in 2004 34 .<br />
The majority of the evidence from RCTs, as well as observational data, have strongly<br />
supported that maintaining hemoglobin levels above 10 g/dL is essential for avoiding<br />
transfusion, fatigue and decline in physical function. The importance of maintaining<br />
hemoglobin levels above 10 g/dL is recognized by the nephrology community as well as<br />
CMS, and is currently incorporated as a quality metric by which dialysis units are<br />
evaluated 35 . However, because hemoglobin levels are known to vary within individuals<br />
over time (intra-patient variability) 29, 31 , and because of the delayed response between<br />
ESA dosing and hemoglobin changes 36 , it is extremely difficult to maintain hemoglobin<br />
levels within a narrow range in many, if not most, patients 29 .<br />
In the early registration trials, variation in hemoglobin levels was observed in both<br />
placebo-treated and ESA-treated patients (the mean intra-patient standard deviation<br />
[SD] in hemoglobin levels was 0.6 g/dL) 37 ; this degree of variability continues to be<br />
observed in more recent clinical trials. In current clinical practice, the population mean<br />
intra-patient hemoglobin SD is near 0.9 g/dL and accounts for ~80% of the total<br />
variability (1.4 g/dL) that is observed in cross-sectional evaluations of hemoglobin in the<br />
entire US dialysis population 34 .
Page 19<br />
Both the original registration trials and the current FDA-approved ESA labels refer to a<br />
2 g/dL hemoglobin range. The need for this range is based on the following: (i) the<br />
recognized need to maintain hemoglobin levels above 10 g/dL to avoid transfusion; (ii)<br />
the inherent variability in patient hemoglobin levels over time; and (iii) the continued<br />
reduction in transfusions that is observed up to a hemoglobin level of 12 g/dL. Using this<br />
range, physicians are effectively managing hemoglobin levels according to patient needs<br />
in order to avoid unnecessary RBC transfusions.<br />
The influence of hemoglobin variability on the management of anemia in dialysis patients<br />
is well recognized by CMS and has been incorporated into their National Claims<br />
Monitoring Policy for ESAs in hemodialysis patients (EMP). The EMP recognizes that in<br />
administering ESAs to achieve and maintain the 10-12 g/dl hemoglobin range, their<br />
reimbursement policy should account for this inherent variability 38 .<br />
1.8 Attempts to Improve CV Outcomes in Dialysis Patients by Targeting<br />
Hemoglobin Levels Outside the FDA-Approved Range (13 g/dL or<br />
higher)<br />
A number of observational studies had evaluated the association between anemia and<br />
increased risk of CV outcomes in CKD patients 39-41 . Using the available surveillance<br />
data in USRDS, studies have consistently shown that hemoglobin levels below 10 g/dL<br />
are associated with increased rates of hospitalization and death and greater healthcare<br />
resource utilization 42, 43 , and patients who are able to achieve higher hemoglobin levels<br />
(10-12 g/dL) had lower hospitalization and mortality rates. To date, no study has<br />
evaluated CV morbidity and mortality, or healthcare resource utilization benefits when<br />
treating with ESAs to within the labeled range. However, studies were undertaken to<br />
test the hypothesis that normalization or near normalization of hemoglobin levels<br />
(hemoglobin of 13.5 and 14 g/dL) in CKD would result in decreased CV morbidity and<br />
mortality; the results of these RCTs did not confirm this hypothesis and hazard, instead<br />
of benefit, was demonstrated.<br />
The first and only randomized controlled CV outcome trial to address this issue in<br />
dialysis patients, the Normal Hematocrit Cardiac Trial (NHCT), was conducted in<br />
subjects with pre-existing CV disease or heart failure and anemia 44 . The second trial<br />
was in CKD-NOD patients, the Correction of Hemoglobin and Outcomes in Renal<br />
Insufficiency (CHOIR) 45 . NHCT was stopped for futility and CHOIR was stopped for<br />
hazard before the planned study completion. Although CHOIR was conducted in CKD-<br />
NOD patients, it is described here as part of a full discussion of safety with respect to
Page 20<br />
ESA use. Both studies evaluated higher-than-approved hemoglobin targets: (i) NHCT<br />
compared the impact of a hemoglobin target of 14.0 g/dL to a target of 10.0 g/dL on the<br />
time to mortality or nonfatal myocardial infarction and found an excess of events in the<br />
high target arm (hazard ratio [HR] = 1.3, 95% confidence interval [CI]: 0.9-1.8); (ii)<br />
CHOIR compared the impact of a hemoglobin target of 13.5 g/dL to a target of 11.3 g/dL<br />
on the composite endpoint of death, myocardial infarction, hospitalization for congestive<br />
heart failure (without renal replacement therapy) and stroke, and found an excess of<br />
events in the high target arm (HR = 1.34, 95%CI: 1.03 – 1.74).<br />
Based on the results of the NHCT trial, the United States PI 46 for ESAs was revised in<br />
1996 to highlight the observed risks and to caution against normalization of hemoglobin<br />
levels in CKD. Following the publication of the CHOIR results in 2006, the US<br />
prescribing information (USPI) for ESAs were updated in 2007 to include the risks<br />
reported in the study and a Boxed Warning.<br />
It is important to note that the mean achieved hemoglobin level in general clinical<br />
practice (11.7 g/dL in 2008) 32 is much lower than the mean achieved hemoglobin level of<br />
patients in the high target arm of NHCT (13.5 g/dL). Moreover, the proportion of dialysis<br />
patients with a hemoglobin level persistently above 13 g/dL for three consecutive months<br />
decreased to only 2.2% n 2008 32 (Figure 13).<br />
Figure 13. Percentage of patients with hemoglobin > 13 g/dL for ≥ 3 months 32
Page 21<br />
1.9 Association of Higher Achieved Hemoglobin and Clinical Outcome<br />
Patients with lower hemoglobin levels have worse clinical outcomes and quality of life 23,<br />
43<br />
, and this may be due in part to the extent of their comorbidity and other clinical factors<br />
that may cause low hemoglobin. Safety information from RCTs (CHOIR and NHCT)<br />
consistently demonstrates higher hazard associated with randomization to higher<br />
hemoglobin targets. At the same time, analyses of these same trials 28, 44 as well as<br />
surveillance data, suggest that patients who are able to achieve higher hemoglobin<br />
levels experience better clinical outcomes. This paradox of different clinical outcomes<br />
between targeting, as opposed to being able to achieve higher hemoglobin levels, points<br />
out the confounding effect of patients’ health status on the clinical outcomes related to<br />
anemia management.<br />
1.10 Association of ESA Dose and Adverse Events: Contribution of<br />
Confounding Factors in Dialysis Patients<br />
The totality of the evidence informing the benefit and risks of ESAs in CKD patients was<br />
reviewed at the September 2007 joint meeting between the FDA Cardiovascular and<br />
Renal Drugs Advisory Committee (CRDAC) & Drug Safety and Risk Management<br />
Advisory Committee, which included results from CHOIR as well as a review of the<br />
evidence regarding the role of ESA dose on outcomes. In the NHCT, higher ESA doses<br />
were required to achieve the higher target hemoglobin level 44 . This raised the concern<br />
that the risks seen in this high hemoglobin target study were, in part, attributable to ESA<br />
dose. Additional evidence suggesting that higher ESA doses increased mortality risk<br />
was provided by two different analyses of US hemodialysis patients using USRDS data<br />
and found that higher ESA doses were associated with a significantly elevated mortality<br />
risk across all hemoglobin levels 47, 48 . <strong>Amgen</strong> undertook an extensive evaluation of the<br />
data from RCTs and observational studies to better understand the potential contribution<br />
of ESA dose on mortality and CV and/or thromboembolic risk. These analyses indicate<br />
that there are three important considerations when examining the relationship between<br />
ESA dose and clinical outcomes:<br />
• ESA dose and hemoglobin are strongly correlated because ESA dose is<br />
titrated in response to specific hemoglobin levels.<br />
• Hemoglobin response to ESAs is influenced by the patient's overall health<br />
status; sicker patients require higher doses of ESAs to maintain hemoglobin.
Page 22<br />
• Hemoglobin response to ESAs is not static, but rather, changes within each<br />
individual over time.<br />
In the course of clinical management of dialysis patients, ESA dosing decisions are<br />
made based on a patient’s preceding hemoglobin concentration 33 . Thus, there is a tight<br />
correlation between hemoglobin and ESA dose. This relationship is further complicated<br />
because each patient’s overall health status influences their hemoglobin response to<br />
ESA dosing changes 49 . Since ESA dosing is administered chronically, the hemoglobindose<br />
relationship can change over time 50 , and thus, the dose that is necessary to<br />
maintain a hemoglobin concentration varies over time. An analogous situation exists in<br />
the case of insulin dose and glucose control in the critical care setting. While<br />
prospective randomized trials targeting blood glucose to lower levels using intensive<br />
insulin therapy have demonstrated a significant reduction in mortality 51 , analysis of blood<br />
glucose levels and administered insulin doses has shown a consistent association<br />
between higher insulin doses and greater mortality, regardless of the prevailing blood<br />
glucose level 52 . The authors of this latter investigation recognized the complexity of<br />
targeting blood glucose levels and considered that the control of glucose levels, rather<br />
than insulin doses, was the important determinant of the beneficial effects observed with<br />
lower target blood glucose levels.<br />
This same conceptual view can be applied to ESA therapy and the clinical practice in<br />
which the physician attempts to maintain hemoglobin concentrations within a specified<br />
range over time. It was acknowledged at the 2007 CRDAC meeting that the excess<br />
mortality risk seen in patients receiving high ESA doses was likely related to their<br />
inability to respond to increased ESA doses (referred to as ESA hyporesponsiveness),<br />
rather than the dose itself 53, 54 . Thus, in 2007 following the CRDAC meeting, the concept<br />
of hyporesponsiveness and its management was introduced into the USPI.<br />
Following the 2007 CRDAC meeting, the EPOGEN ® and Aranesp ® labels were further<br />
revised:<br />
• An update was made to the Boxed Warning<br />
• The hemoglobin range of 10 to 12 g/dL was maintained<br />
• Guidance was added for the treatment of patients who did not attain a<br />
hemoglobin level within the range of 10 to 12 g/dL despite the use of<br />
appropriate EPOGEN ® dose titrations over a 12-week period
Page 23<br />
Since 2007, additional analyses have been conducted to further understand the interrelationship<br />
between hyporesponsiveness, EPOGEN ® dosing and adverse clinical<br />
outcomes in dialysis patients. It is now more widely understood that these initial<br />
observations of excess risk observed in patients who require greater EPOGEN ® doses<br />
are largely attributable to patient characteristics, worsening clinical status and poor<br />
hemoglobin response rather than EPOGEN ® dose 53-55 . Patients with the highest<br />
EPOGEN ® doses are those most likely to have low hemoglobin levels, greater CV<br />
disease burden, more inflammation and malnutrition, increased hospitalization<br />
frequency, and are more likely to be dialyzing with a catheter (which promotes infection<br />
and is associated with increased mortality) rather than a permanent vascular access 55-<br />
57 .<br />
The prevalence of higher EPOGEN ® doses in patients with worse overall prognosis<br />
results in confounding-by-indication and can produce biased results attributing risk to<br />
higher doses 50 . Several studies using different analytical techniques to address this<br />
confounding have shown that EPOGEN ® dose is not an independent predictor of<br />
mortality 53, 58-60 60 (Table 1). Importantly, in subsequent analyses with more rigorous<br />
control for confounding, the lead investigators (Zhang, Thamer and Cotter) who originally<br />
suggested that higher EPOGEN ® doses increase mortality risk 48 , no longer demonstrated<br />
this association 59 .<br />
Table 1. Results from the studies evaluating the association between EPOGEN ®<br />
dose and mortality using methods to address confounding-by-indication<br />
Author N Comparison HR (95% CI)<br />
Limited baseline adjustment<br />
Zhang 2004 48 94,569 >22K vs. 40K vs. 20-30K U/wk 0.91 (0.67, 1.22)<br />
Bradbury 2008 55 22,955 Log EPO dose 1.01 (0.99, 1.03)<br />
Wang 2010 60 27,791 >49K vs. 37.5% vs. 0-12.5%^ 0.86 (0.69, 1.08)<br />
^ Average monthly dose change over 3 months among patients with low hemoglobin levels
Page 24<br />
1.11 New Data from a CV Outcomes Trial Targeting Hemoglobin Levels<br />
above 12 g/dL<br />
Since the review of the totality of the evidence at FDA CRDAC 2007, the results of<br />
TREAT, a large <strong>Amgen</strong>-sponsored phase III prospective randomized clinical trial, have<br />
become available 61 . TREAT was a study designed in 2002, and conducted between<br />
2004 and 2009, to address the hypothesis that correction of anemia in CKD-NOD<br />
patients with mild anemia (hemoglobin < 11 g/dL at enrollment) and type 2 diabetes<br />
would improve CV morbidity and mortality. The detailed results for TREAT are<br />
described in the CKD-NOD section. In brief, the study did not meet the primary objective<br />
of showing an improvement in CV morbidity and mortality (HR = 1.05, 95% CI: 0.94 –<br />
1.17). Patients in the Aranesp ® treated arm experienced an almost two-fold increased<br />
risk of stroke compared with the placebo group (HR = 1.92, 95% CI: 1.38-2.68 with an<br />
annualized incidence rate of 1.1% in the placebo arm and 2.1% in the Aranesp ® treated<br />
arm. Consistent with <strong>Amgen</strong>’s previous response to safety signals identified in clinical<br />
trials, <strong>Amgen</strong> has proactively revised the EPOGEN ® and Aranesp ® labels to include this<br />
risk.<br />
1.12 CONCLUSION: ESA THERAPY IS AN ESSENTIAL TREATMENT FOR<br />
DIALYSIS PATIENTS<br />
ESAs are an essential therapy in the management of anemia in dialysis patients and<br />
have a positive benefit to risk profile when used according to the FDA-approved label.<br />
ESAs are effective at increasing hemoglobin levels in order to avoid transfusions and to<br />
improve physical function and exercise tolerance in dialysis patients. Transfusion<br />
avoidance protects against cumulative hazards—especially allo-sensitization to foreign<br />
antigens—and improves the eligibility for and outcome of renal transplant. This is a<br />
particularly relevant issue for many potential transplant candidates who often times<br />
spend many years on dialysis, thereby increasing both their exposure to the risks of<br />
transfusions as well as their mortality rates from having been on dialysis. A lower<br />
hemoglobin limit of 10.7 g/dL was studied in the original registrational clinical trials.<br />
Subsequently, additional clinical trials and observational data have demonstrated that<br />
the risk of transfusion increases substantially when hemoglobin levels fall below 10 g/dL;<br />
this supports 10 g/dL as the appropriate lower limit of the labeled range. The transfusion<br />
benefit continuously improves through the labeled hemoglobin range of 12 g/dL, and<br />
because of the intrinsic hemoglobin variability seen in dialysis patients; a 2 g/dL range is<br />
appropriate with an upper hemoglobin level of 12 g/dL. Additionally, the near-complete
Page 25<br />
surveillance of the US dialysis population by USRDS has not provided evidence of an<br />
increased rate of death when patients are treated to the FDA-approved ESA labeled<br />
hemoglobin range. Thus, the labeled hemoglobin range of 10 to 12 g/dL is necessary<br />
and prudent to maximize the benefit of transfusion avoidance and minimize the risk of<br />
CV events associated with high hemoglobin targets (≥ 13 g/dL), and allows physicians to<br />
effectively manage anemia in dialysis patients.
Page 26<br />
2. CKD PATIENTS NOT ON DIALYSIS (CKD-NOD)<br />
There are an estimated 26 million people in the US with CKD-NOD, of which,<br />
approximately 22 million have moderate to severe loss of kidney function (estimated<br />
glomerular filtration rate [eGFR] 15 to 60 mL/min/1.73 m 2 ) 62 . As renal function<br />
decreases and endogenous erythropoietin production declines, anemia develops 7 .<br />
While anemia is ubiquitous and severe in dialysis patients (in the absence of treatment),<br />
the prevalence of anemia is lower in CKD-NOD. However, it is estimated that > 50% of<br />
Medicare CKD-NOD patients have some degree of anemia 2 ; the prevalence of anemia<br />
increases with the stage of CKD 63 . The difference in the prevalence of anemia in CKD-<br />
NOD relative to dialysis is a key distinguishing clinical characteristic between these two<br />
populations.<br />
2.1 Transfusion Therapy in CKD-NOD Patients<br />
While the prevalence of anemia in CKD-NOD is lower than in patients who are on<br />
dialysis, the anemia in CKD-NOD can be severe and the transfusion burden in these<br />
patients is surprisingly high. In Medicare patients with CKD-NOD and chronic anemia,<br />
the annual transfusion rate ranged from 17% to 25% between 1992 and 2004, and the<br />
risk was three-fold higher than in CKD-NOD patients without anemia, and 10 fold higher<br />
than those without CKD 64 . In 2004 there were approximately 400,000 anemic CKD-NOD<br />
patients covered by Medicare; this roughly translates to 60,000 to 100,000 transfusion<br />
events annually in the Medicare population alone. In the Veteran’s Administration (VA)<br />
healthcare system, transfusion rates are similarly elevated in the anemic CKD-NOD<br />
population 65 . Transfusions are significantly more common in non-treated patients when<br />
compared to patients receiving ESAs and iron, and increase markedly when hemoglobin<br />
levels fall below 10 g/dL 66 (Figure 14).
Page 27<br />
Figure 14. The risk of transfusion by hemoglobin levels in anemic CKD-NOD<br />
patients treated with ESAs and iron and among those not receiving treatment (n =<br />
97,636) 66<br />
2.2 Adverse Sequelae of Transfusion Therapy<br />
RBC transfusions carry a range of hazards including transmission of viral disease and<br />
transfusion reactions. As with dialysis patients, transfusion related complications such<br />
as acute volume and potassium overload, and more chronically, iron overload. can be<br />
problematic for CKD-NOD patients 10, 13-16 . Finally, and of unique importance to CKD<br />
patients, RBC transfusions can result in allo-sensitization to foreign antigens 2, 19 that can<br />
delay or preclude kidney transplantation 2 and impact overall graft survival in transplanted<br />
patients 20 . Currently, 15% of transplants occur in CKD-NOD patients before they initiate<br />
dialysis 2 and the numbers are growing. USRDS projects that ~700,000 patients will be<br />
receiving dialysis or be transplanted by the year 2020 2 . The largest group progressing to<br />
dialysis is projected to be 45-64 year-olds, all of whom will become Medicare<br />
beneficiaries upon developing ESRD; these patients will likely be prime candidates for<br />
renal transplantation. Avoidance of transfusion to maintain transplant eligibility is of<br />
critical importance because kidney transplant is the preferred treatment modality for<br />
ESRD. Successfully transplanted patients have superior survival and quality of life and<br />
incur lower health care costs 2 .<br />
2.3 Benefits of ESA Therapy in CKD-NOD Patients<br />
The clinical benefit of transfusion avoidance in anemic dialysis patients was<br />
demonstrated by the registrational clinical trials with EPOGEN ® and established<br />
hemoglobin as the key outcome for approval of ESAs in the non-dialysis setting. The
Page 28<br />
Aranesp ® clinical trial program evaluated hemoglobin response in CKD-NOD subjects<br />
and demonstrated that hemoglobin levels could be raised and maintained within targeted<br />
hemoglobin range; approval for this indication was granted by the FDA in 2001 67 . In the<br />
original registration studies with EPOGEN ® in dialysis patients, transfusion avoidance<br />
occurred when hemoglobin levels were raised above 10 g/dL 68 , and the same efficacy<br />
was demonstrated in an open-label single-arm study of anemic CKD-NOD patients 69 . In<br />
this study, transfusion events were reduced by ~70% when hemoglobin levels were<br />
raised above 10 g/dL. This benefit has also been seen in general clinical practice. In<br />
the Medicare population with CKD-NOD and anemia, transfusion rates have declined<br />
from 30 to 15% among patients treated with ESAs between 1995 and 2004 64 (Figure<br />
15).<br />
Figure 15. Transfusion rate among ESA treated CKD-NOD patients with anemia<br />
over time 64<br />
There has been, and continues to be, significant interest in the nephrology community<br />
toward better understanding the effects of treatment with ESAs to hemoglobin levels<br />
above 10 g/dL on CKD-NOD patients’ symptoms and functioning from the patient’s<br />
perspective; treatment of these patient reported domains is not an approved indication<br />
for Aranesp ® . A number of trials, including double-blind placebo-controlled, open-label<br />
randomized controlled trials as well as single-arm and observational studies have been<br />
conducted to study this question. In summary, all of these studies suggest<br />
improvements in patient-reported outcomes, although the degree of benefit varies
Page 29<br />
across studies. Studies which compare achieved hemoglobin levels below 10 g/dL to<br />
those above 10g/dL demonstrate more improvement than those which compare<br />
improvements in patient reported outcomes between high and low hemoglobin targets.<br />
For example, in an open-label RCT, SF-36 scores decreased in the untreated arm<br />
(achieved hemoglobin of 8.9 g/dL) for both physical function and energy while there was<br />
a significant increase in these subscale scores in the treated arm (achieved hemoglobin<br />
of 10.5 g/dL) 70 . Similar improvements have been demonstrated in fatigue, and activity<br />
levels 71-73 . A variety of studies have shown that there is a clinically meaningful<br />
improvement in physical function and vitality scores, as measured by various patientreported<br />
outcome instruments, as hemoglobin levels rise above 10 g/dL 74 (Figure 16).<br />
Figure 16. Hemoglobin levels and associated Kidney Disease Questionnaire<br />
(KDQ) scores for physical symptoms, fatigue, depression, relationship with<br />
others, frustration, and overall KDQ 74 (Clinically meaningful change in KDQ is 0.2-<br />
0.5 75 )<br />
A recent meta-analysis showed that there was a modest difference in physical function<br />
and vitality scores in the SF-36 when scores for patients treated to higher hemoglobin
Page 30<br />
targets (approximately 12.0 – 15 g/dL across studies) were compared to those treated to<br />
lower hemoglobin targets (approximately 9.5 – 11.5 g/dL across studies) 76 (Figure 17).<br />
Figure 17. A meta-analysis of the difference in SF-36 physical function and vitality<br />
scores between higher and lower hemoglobin levels in CKD-NOD patients; WMD =<br />
weighted mean difference 76<br />
2.4 <strong>Anemia</strong> and CV Outcomes in CKD-NOD<br />
As previously discussed, a number of observational studies demonstrated an<br />
association between anemia and an increased risk of adverse CV outcomes in CKD-<br />
NOD patients 77, 78 . Based on these studies, RCTs were undertaken to test the<br />
hypothesis that normalization or near normalization of hemoglobin levels in CKD-NOD<br />
patients would result in decreased CV morbidity and mortality. The NHCT in dialysis<br />
subjects with pre-existing CV disease or heart failure and anemia 44 and the CHOIR<br />
study in CKD-NOD subjects with anemia 45 , addressed this question. Although NHCT<br />
was conducted in dialysis patients, it is described here as part of a full discussion of<br />
safety with respect to ESA use. The detailed results of these studies and the<br />
subsequent revisions to the ESA labels were discussed in the previous section. In brief,<br />
both studies evaluated higher-than-approved hemoglobin targets and found an excess of<br />
events in the high target arm: (1) NHCT hazard ratio [HR] = 1.3, 95% confidence interval<br />
[CI]: 0.9-1.8; (2) CHOIR HR = 1.34, 95%CI: 1.03 – 1.74). Based on the results of the<br />
NHCT trial, the USPI for ESAs were revised in 1996 to highlight the observed risks and<br />
to caution against normalization of hemoglobin levels in CKD. Following the publication
of the CHOIR results in 2006, the USPI for ESAs was updated in 2007 to include the<br />
risks reported in the study including a Boxed Warning.<br />
Page 31<br />
The totality of the evidence informing the benefit and risks of ESA in CKD patients was<br />
reviewed at the September 2007 joint meeting between the FDA CRDAC & Drug Safety<br />
and Risk Management Advisory Committee, which included results from CHOIR.<br />
Following the CRDAC meeting, the ESA labels were further revised to highlight the<br />
following safety information:<br />
• The Boxed Warning was updated<br />
• The hemoglobin range of 10 to 12 g/dL was maintained<br />
• Dosing guidance language was added on how to treat patients who did not<br />
attain a hemoglobin level within the range of 10 to 12 g/dL despite the use of<br />
appropriate Aranesp ® dose titrations over a 12-week period<br />
2.5 Overview of ESA use in General CKD-NOD Clinical Practice<br />
Nephrologists have responded to the findings in these well-publicized clinical trials by<br />
treating to lower achieved hemoglobin levels; doses have also declined. The proportion<br />
of ESA-treated CKD-NOD patients with hemoglobin levels > 12 g/dL has dropped<br />
significantly (30% to 9%) and the proportion within the 10 to 12 g/dL hemoglobin range is<br />
nearly 70% (<strong>Amgen</strong> data on file) (Figure 18). As of June 2009, the average hemoglobin<br />
level among ESA-treated CKD-NOD patients was 10.7 g/dL 79 . Additionally, the average<br />
monthly Aranesp ® dose in clinical practice in 2009 was 134 mcg.
Page 32<br />
Figure 18. Percentage of hemoglobin measurements in specific ranges for the<br />
CKD-NOD patient population (<strong>Amgen</strong> data on file; these data are shared with CMS<br />
on an ongoing basis).<br />
2.6 Trial to Reduce Cardiovascular Events with Aranesp ® Therapy<br />
(TREAT) Trial in Diabetic CKD-NOD Patients<br />
In 2009, the results of TREAT, a large <strong>Amgen</strong>-sponsored phase III prospective<br />
randomized clinical trial, became available 61 . TREAT was designed in 2002, and<br />
conducted between 2004 and 2009, to explore whether there were benefits with ESA<br />
treatment beyond the supportive care indication for which ESAs were approved. The<br />
rationale for this study was based on the observation that patients with higher achieved<br />
hemoglobin levels experienced lower CV morbidity and mortality 77, 78 . The specific<br />
objective of the study was to show that, when compared to placebo, treatment with<br />
Aranesp ® could reduce time to first occurrence of death, CV morbidity or end-stage renal<br />
disease; although it also assessed other endpoints such as quality of life. TREAT<br />
enrolled diabetic, early-stage CKD-NOD patients (eGFR < 60 mL/min/1.73 m 2 ) with mild<br />
anemia (hemoglobin < 11 g/dL). TREAT was a 4,038 patient, randomized, double-blind,<br />
placebo-controlled study that examined treatment with ESA to a hemoglobin target of<br />
13 g/dL compared to placebo (with Aranesp ® as rescue therapy when hemoglobin fell<br />
below 9 g/dL). The median achieved hemoglobin in the Aranesp ® treated arm was 12.5<br />
g/dL and the median achieved hemoglobin in the placebo arm was 10.6 g/dL.<br />
TREAT did not demonstrate a reduction in the risk of the primary composite endpoint<br />
(time to first event of death, myocardial infarction, hospitalization for congestive heart<br />
failure, stroke and myocardial ischemia) (HR = 1.05, 95% CI: 0.94-1.17). Patients in the<br />
Aranesp ® treated arm experienced an almost two-fold increased risk of stroke compared
Page 33<br />
with the placebo group (HR = 1.92, 95% CI: 1.38-2.68 with an annualized incidence rate<br />
of 1.1% in the placebo arm and 2.1% in the Aranesp ® treated arm). In December 2009,<br />
consistent with <strong>Amgen</strong>’s previous response to safety signals identified in clinical trials,<br />
<strong>Amgen</strong> proactively revised the ESA labels to include the risk of stroke observed in<br />
TREAT, including enhancement of the Boxed Warning language and the Warnings and<br />
Precautions section.<br />
<strong>Amgen</strong> has undertaken a number of analyses to further understand the increased risk of<br />
stroke (<strong>Amgen</strong> data on file). To date, analyses did not identify an association between<br />
achieved hemoglobin or baseline characteristics (with the exception of a nominally<br />
significant interaction with baseline aspirin use), and the risk of stroke. Within either the<br />
Aranesp ® or placebo group, there was no difference in mean hemoglobin between<br />
subjects who developed stroke and subjects who did not develop stroke. For subjects in<br />
both treatment groups, systolic and diastolic blood pressure was higher in subjects who<br />
developed stroke compared with subjects who did not develop stroke. Consistent with<br />
the post-hoc analyses of other RCTs (NHCT, CHOIR) and observational studies, higher<br />
achieved hemoglobin levels were associated with a lower risk of CV and mortality<br />
events.<br />
TREAT also assessed the association of treatment with ESAs with patient reported<br />
outcomes in this mildly anemic CKD-NOD population. A modest improvement was seen<br />
in the mean change in the FACT-Fatigue subscale score for subjects in the Aranesp ® -<br />
treated group from baseline to week 25 (4.2 points for the Aranesp ® -treated group and<br />
2.8 points for the placebo group), with a difference between the two groups of 1.33 (95%<br />
CI: 0.64, 2.02; p < 0.0001). No statistically significant changes were seen between the<br />
two groups in the SF-36 physical function and energy subscale scores.<br />
While not an endpoint in the study, TREAT provides valuable information on the impact<br />
of ESAs on transfusions in CKD-NOD. Subjects randomized to the Aranesp ® arm had<br />
approximately half the rate of RBC transfusions compared to placebo-treated patients<br />
(22.8 per 100 patient-years for placebo-treated versus 13.1 per 100 patient-years in the<br />
Aranesp ® -treated arm; annualized rates). Additionally, analyses of the transfusion data<br />
in TREAT demonstrated a continuous increase in the risk of transfusion as hemoglobin<br />
levels decline (HR = 0.56, 95% CI 0.49-0.65) 61 . In general clinical practice, there is a<br />
strong relationship between declining hemoglobin levels and increased transfusion risk<br />
and this risk is particularly elevated when hemoglobin levels drop below 10 g/dL 65, 66 .
Page 34<br />
TREAT was not a study designed to assess the optimal hemoglobin target range for<br />
treatment in CKD-NOD and does not provide evidence to support the use of ESAs<br />
beyond transfusion reduction in the population studied. During the treatment phase, the<br />
median hemoglobin in the arm randomized to receive Aranesp ® was 12.5 g/dL and the<br />
median hemoglobin in the arm randomized to receive placebo with rescue therapy (at<br />
9 g/dL) was 10.6 g/dL. TREAT only enrolled patients with hemoglobin < 11 g/dL; the<br />
median baseline hemoglobin in TREAT was 10.4 g/dL. In current clinical practice, most<br />
of the patients enrolled in TREAT would not receive ESA therapy; CKD-NOD patients<br />
are currently initiated on therapy when hemoglobin declines to below 10 g/dL (<strong>Amgen</strong>,<br />
data on file). Furthermore, the mean hemoglobin in anemic CKD-NOD patients who are<br />
currently receiving ESA therapy in the US is approximately 10.7 g/dL 79 , which is similar<br />
to the placebo arm of TREAT and considerably less than the target hemoglobin of<br />
13 g/dL.<br />
2.7 CONCLUSION: ESA THERAPY IN CKD-NOD PATIENTS IS AN<br />
IMPORTANT TREATMENT OPTION IN THOSE FOR WHOM<br />
TRANSFUSION AVOIDANCE IS A MEANINGFUL CLINICAL BENEFIT<br />
Although the prevalence of anemia is lower in CKD-NOD, anemia can be severe and<br />
transfusions are frequent. Anemic CKD-NOD patients are vulnerable to the risks of<br />
transfusions, particularly the risk of allo-sensitization, and its potential impact on<br />
transplant eligibility and graft survival. ESA therapy should be initiated when hemoglobin<br />
declines below 10 g/dL because the demonstrated benefit of transfusion reduction with<br />
ESA use is observed when hemoglobin levels are treated to above 10 g/dL. ESA<br />
therapy should be individualized to achieve and maintain hemoglobin between 10 and<br />
12 g/dL. As with dialysis patients, the intrinsic hemoglobin variability seen in CKD-NOD<br />
and the practical limitations of managing hemoglobin, require the use of a hemoglobin<br />
range to administer ESAs to maximize the clinical benefit for each patient. A<br />
hemoglobin level of 12.0 g/dL as the upper end of the hemoglobin range will allow<br />
physicians to manage patients so as to reduce transfusions. Avoiding a hemoglobin<br />
target > 12 g/dL provides a safety margin against the higher hemoglobin target<br />
(≥ 13.0 g/dL) in TREAT where risks have been identified. Evidence supports that ESAs<br />
are an important therapy for anemic CKD-NOD patients in whom transfusion avoidance<br />
is a meaningful clinical goal and believes that ESAs have a positive benefit to risk profile<br />
when used according to the FDA-approved label in these patients.
REFERENCES<br />
Page 35<br />
1. Go AS, Chertow GM, Fan D, McCulloch CE and Hsu CY: Chronic kidney disease<br />
and the risks of death, cardiovascular events, and hospitalization. The New England<br />
journal of medicine. 2004;351: 1296-1305.<br />
2. USRDS: USRDS 2009 Annual data report: atlas of end-stage renal disease in the<br />
United States. Bethesda, MD, National Institutes of Health, National Institute of<br />
Diabetes and Digestive Kidney Diseases, 2009<br />
3. Birmele B, Francois M, Pengloan J, et al.: Death after withdrawal from dialysis: the<br />
most common cause of death in a French dialysis population. Nephrol Dial<br />
Transplant. 2004;19: 686-691.<br />
4. Karpinski M, Pochinco D, Dembinski I, Laidlaw W, Zacharias J and Nickerson P:<br />
Leukocyte reduction of red blood cell transfusions does not decrease<br />
allosensitization rates in potential kidney transplant candidates. J Am Soc Nephrol.<br />
2004;15: 818-824.<br />
5. Sargent JA and Acchiardo SR: Iron requirements in hemodialysis. Blood purification.<br />
2004;22: 112-123.<br />
6. Caro J, Brown S, Miller O, Murray T and Erslev AJ: Erythropoietin levels in uremic<br />
nephric and anephric patients. The Journal of laboratory and clinical medicine.<br />
1979;93: 449-458.<br />
7. Erslev AJ and Besarab A: Erythropoietin in the pathogenesis and treatment of the<br />
anemia of chronic renal failure. Kidney international. 1997;51: 622-630.<br />
8. Cheung J, Yu A, LaBossiere J, Zhu Q and Fedorak RN: Peptic ulcer bleeding<br />
outcomes adversely affected by end-stage renal disease. Gastrointestinal<br />
endoscopy. 2010;71: 44-49.<br />
9. Wasse H, Gillen DL, Ball AM, et al.: Risk factors for upper gastrointestinal bleeding<br />
among end-stage renal disease patients. Kidney international. 2003;64: 1455-1461.<br />
10. Eschbach JW and Adamson JW: <strong>Anemia</strong> of end-stage renal disease (ESRD). Kidney<br />
international. 1985;28: 1-5.<br />
11. Churchill DN, Taylor DW, Cook RJ, et al.: Canadian Hemodialysis Morbidity Study.<br />
Am J Kidney Dis. 1992;19: 214-234.<br />
12. Eschbach JW, Egrie JC, Downing MR, Browne JK and Adamson JW: Correction of<br />
the anemia of end-stage renal disease with recombinant human erythropoietin.<br />
Results of a combined phase I and II clinical trial. The New England journal of<br />
medicine. 1987;316: 73-78.<br />
13. Beauregard P and Blajchman MA: Hemolytic and pseudo-hemolytic transfusion<br />
reactions: an overview of the hemolytic transfusion reactions and the clinical<br />
conditions that mimic them. Transfusion medicine reviews. 1994;8: 184-199.<br />
14. Despotis GJ, Zhang L and Lublin DM: Transfusion risks and transfusion-related proinflammatory<br />
responses. Hematol Oncol Clin North Am. 2007;21: 147-161.<br />
15. Dodd RY, Notari EPt and Stramer SL: Current prevalence and incidence of infectious<br />
disease markers and estimated window-period risk in the American Red Cross blood<br />
donor population. Transfusion. 2002;42: 975-979.<br />
16. Simon GE and Bove JR: The potassium load from blood transfusion. Postgraduate<br />
medicine. 1971;49: 61-64.<br />
17. Hardy S, Lee S-H and Terasaki PI: Sensitization 2001, in PI, CJaT (ed): Clinical<br />
Transplants 2001, UCLA, 2001<br />
18. USRDS: USRDS 2004 Annual data report: atlas of end-stage renal disease in the<br />
United States. Bethesda, MD, National Institutes of Health, National Institute of<br />
Diabetes and Digestive Kidney Diseases, 2004
Page 36<br />
19. UNOS: United Network for Organ Sharing. Accessed at: 4http://www.unos.org/ .<br />
Accessed on Feb 12, 2010.,<br />
20. Opelz G: Non-HLA transplantation immunity revealed by lymphocytotoxic antibodies.<br />
Lancet. 2005;365: 1570-1576.<br />
21. Schold J, Srinivas TR, Sehgal AR and Meier-Kriesche HU: Half of kidney transplant<br />
candidates who are older than 60 years now placed on the waiting list will die before<br />
receiving a deceased-donor transplant. Clin J Am Soc Nephrol. 2009;4: 1239-1245.<br />
22. CESG: Association between recombinant human erythropoietin and quality of life<br />
and exercise capacity of patients receiving haemodialysis. Canadian Erythropoietin<br />
Study Group. BMJ. 1990;300: 573-578.<br />
23. Johansen KL, Finkelstein FO, Revicki DA, Gitlin M, Evans C and Mayne TJ:<br />
Systematic Review and Meta-analysis of Exercise Tolerance and Physical<br />
Functioning in Dialysis Patients Treated With Erythropoiesis-Stimulating Agents. Am<br />
J Kidney Dis. 2010;In press.<br />
24. Pisoni RL, Bragg-Gresham JL, Young EW, et al.: <strong>Anemia</strong> management and<br />
outcomes from 12 countries in the Dialysis Outcomes and Practice Patterns Study<br />
(DOPPS). Am J Kidney Dis. 2004;44: 94-111.<br />
25. USRDS: USRDS 2007 Annual data report: atlas of end-stage renal disease in the<br />
United States. Bethesda, MD, National Institutes of Health, National Institute of<br />
Diabetes and Digestive Kidney Diseases, 2007<br />
26. Ibrahim HN, Ishani A, Foley RN, Guo H, Liu J and Collins AJ: Temporal trends in red<br />
blood transfusion among US dialysis patients, 1992-2005. Am J Kidney Dis. 2008;52:<br />
1115-1121. .<br />
27. USRDS: USRDS 2003 Annual data report: atlas of end-stage renal disease in the<br />
United States. Bethesda, MD, National Institutes of Health, National Institute of<br />
Diabetes and Digestive Kidney Diseases, 2003<br />
28. <strong>Amgen</strong>: Background information for the joint meeting between the Cardiovascular<br />
and Renal Drugs Advisory Committee & Drug Safety and Risk Management Advisory<br />
Committee. Accessed at: 4http://www.fda.gov/ohrms/dockets/ac/07/briefing/2007-<br />
4315b1-04-AMGEN.pdf, 2007<br />
29. Ebben JP, Gilbertson DT, Foley RN and Collins AJ: Hemoglobin level variability:<br />
associations with comorbidity, intercurrent events, and hospitalizations. Clin J Am<br />
Soc Nephrol. 2006;1: 1205-1210. .<br />
30. Fishbane S and Berns JS: Hemoglobin cycling in hemodialysis patients treated with<br />
recombinant human erythropoietin. Kidney Int. 2005;68: 1337-1343.<br />
31. Lacson E, Jr., Ofsthun N and Lazarus JM: Effect of variability in anemia<br />
management on hemoglobin outcomes in ESRD. Am J Kidney Dis. 2003;41: 111-<br />
124.<br />
32. Spiegel DM, Khan I, Krishnan M and Mayne TJ: Changes in hemoglobin level<br />
distribution in US dialysis patients from June 2006 to November 2008. Am J Kidney<br />
Dis. 2009;55: 113-120.<br />
33. Collins AJ, Brenner RM, Ofman JJ, et al.: Epoetin alfa use in patients with ESRD: an<br />
analysis of recent US prescribing patterns and hemoglobin outcomes. Am J Kidney<br />
Dis. 2005;46: 481-488.<br />
34. Medicare: Analysis conducted by the Chronic Disease Research Group of the<br />
Minneapolis Medical Research Foundation under DUA #16234 and #16235 with the<br />
Centers For Medicare and Medicaid Services,<br />
35. Medicare: Dialysis facility compare. Accessed at:<br />
4http://www.medicare.gov/Dialysis/Include/DataSection/Questions/SearchCriteria.asp<br />
?version=default&browser=IE%7C6%7CWin2000&language=English&defaultstatus=<br />
0&pagelist=Home,
Page 37<br />
36. Uehlinger DE, Gotch FA and Sheiner LB: A pharmacodynamic model of<br />
erythropoietin therapy for uremic anemia. Clinical pharmacology and therapeutics.<br />
1992;51: 76-89.<br />
37. Feng A and Comstock T: Within-subject hemoglobin variability in placebo-controlled<br />
Epoetin alfa studies of patients on hemodialysis with anemia. J Am Soc Nephrol<br />
[abstract]. 2009;20: 168A.<br />
38. CMS: CMS Manuap System. Pub 100-04 Medicare Claims Processing. Transmittal<br />
751, Change Request 4135, DHHS CMS 11-10-2005. National monitoring policy for<br />
EPO and Aranesp for end stage renal disease (ESRD) patients treated in renal<br />
dialysis facilities 2005<br />
39. Cannella G, La Canna G, Sandrini M, et al.: Reversal of left ventricular hypertrophy<br />
following recombinant human erythropoietin treatment of anaemic dialysed uraemic<br />
patients. Nephrol Dial Transplant. 1991;6: 31-37.<br />
40. Wizemann V, Kaufmann J and Kramer W: Effect of erythropoietin on ischemia<br />
tolerance in anemic hemodialysis patients with confirmed coronary artery disease.<br />
Nephron. 1992;62: 161-165.<br />
41. Pascual J, Teruel JL, Moya JL, Liano F, Jimenez-Mena M and Ortuno J: Regression<br />
of left ventricular hypertrophy after partial correction of anemia with erythropoietin in<br />
patients on hemodialysis: a prospective study. Clinical nephrology. 1991;35: 280-<br />
287.<br />
42. Collins AJ, Li S, St Peter W, et al.: Death, hospitalization, and economic associations<br />
among incident hemodialysis patients with hematocrit values of 36 to 39%. J Am Soc<br />
Nephrol. 2001;12: 2465-2473.<br />
43. Volkova N and Arab L: Evidence-based systematic literature review of<br />
hemoglobin/hematocrit and all-cause mortality in dialysis patients. Am J Kidney Dis.<br />
2006;47: 24-36.<br />
44. Besarab A, Bolton WK, Browne JK, et al.: The effects of normal as compared with<br />
low hematocrit values in patients with cardiac disease who are receiving<br />
hemodialysis and epoetin. N Engl J Med. 1998;339: 584-590.<br />
45. Singh AK, Szczech L, Tang KL, et al.: Correction of anemia with epoetin alfa in<br />
chronic kidney disease. N Engl J Med. 2006;355: 2085-2098.<br />
46. <strong>Amgen</strong>: EPOGEN (R) (Epoetin alfa) Prescribing Information. <strong>Amgen</strong> Inc., Thousand<br />
Oaks, CA.<br />
47. Cotter DJ, Stefanik K, Zhang Y, Thamer M, Scharfstein D and Kaufman J:<br />
Hematocrit was not validated as a surrogate end point for survival among epoetintreated<br />
hemodialysis patients. Journal of clinical epidemiology. 2004;57: 1086-1095.<br />
48. Zhang Y, Thamer M, Stefanik K, Kaufman J and Cotter DJ: Epoetin requirements<br />
predict mortality in hemodialysis patients. Am J Kidney Dis. 2004;44: 866-876.<br />
49. Bradbury BD, Critchlow CW, Weir MR, Stewart R, Krishnan M and Hakim RH:<br />
Impact of elevated C-reactive protein levels on erythropoiesis- stimulating agent<br />
(ESA) dose and responsiveness in hemodialysis patients. Nephrol Dial Transplant.<br />
2009;24: 919-925.<br />
50. Bradbury BD, Brookhart MA, Winkelmayer WC, et al.: Evolving statistical methods to<br />
facilitate evaluation of the causal association between erythropoiesis-stimulating<br />
agent dose and mortality in nonexperimental research: strengths and limitations. Am<br />
J Kidney Dis. 2009;54: 554-560.<br />
51. van den Berghe G, Wouters P, Weekers F, et al.: Intensive insulin therapy in the<br />
critically ill patients. The New England journal of medicine. 2001;345: 1359-1367.<br />
52. Finney SJ, Zekveld C, Elia A and Evans TW: Glucose control and mortality in<br />
critically ill patients. JAMA. 2003;290: 2041-2047.
Page 38<br />
53. Bradbury BD, Danese MD, Gleeson M and Critchlow CW: Effect of epoetin alfa dose<br />
changes on hemoglobin and mortality in hemodialysis patients with hemoglobin<br />
levels persistently below 11 g/dL. Clin J Am Soc Nephrol. 2009;4: 630-637.<br />
54. Kilpatrick RD, Critchlow CW, Fishbane S, et al.: Greater epoetin alfa responsiveness<br />
is associated with improved survival in hemodialysis patients. Clin J Am Soc<br />
Nephrol. 2008;3: 1077-1083.<br />
55. Bradbury BD, Wang O, Critchlow CW, et al.: Exploring relative mortality and epoetin<br />
alfa dose among hemodialysis patients. Am J Kidney Dis. 2008;51: 62-70.<br />
56. Kalantar-Zadeh K and Aronoff GR: Hemoglobin variability in anemia of chronic<br />
kidney disease. J Am Soc Nephrol. 2009;20: 479-487.<br />
57. Solid CA, Foley RN, Gilbertson DT and Collins AJ: Perihospitalization hemoglobinepoetin<br />
associations in U.S. hemodialysis patients, 1998 to 2003. Hemodial Int.<br />
2007;11: 442-447.<br />
58. Bradbury BD, Do TP, Winkelmayer WC, Critchlow CW and Brookhart MA: Greater<br />
Epoetin alfa (EPO) doses and short-term mortality risk among hemodialysis patients<br />
with hemoglobin levels less than 11 g/dL. Pharmacoepidemiol Drug Saf. 2009;18:<br />
932-940.<br />
59. Zhang Y, Thamer M, Cotter D, Kaufman J and Hernan MA: Estimated effect of<br />
epoetin dosage on survival among elderly hemodialysis patients in the United States.<br />
Clin J Am Soc Nephrol. 2009;4: 638-644.<br />
60. Wang O, Kilpatrick RD, Critchlow CW, et al.: Relationship between Epoetin alfa dose<br />
and mortality: findings from a marginal structural model. Clin J Am Soc Nephrol.<br />
2010;In press.<br />
61. Pfeffer MA, Burdmann EA, Chen CY, et al.: A trial of darbepoetin alfa in type 2<br />
diabetes and chronic kidney disease. The New England journal of medicine.<br />
2009;361: 2019-2032.<br />
62. Coresh J, Selvin E, Stevens LA, et al.: Prevalence of chronic kidney disease in the<br />
United States. JAMA. 2007;298: 2038-2047.<br />
63. Astor BC, Muntner P, Levin A, Eustace JA and Coresh J: Association of kidney<br />
function with anemia: the Third National Health and Nutrition Examination Survey<br />
(1988-1994). Arch Intern Med. 2002;162: 1401-1408.<br />
64. Ibrahim HN, Ishani A, Guo H and Gilbertson DT: Blood transfusion use in nondialysis-dependent<br />
chronic kidney disease patients aged 65 years and older. Nephrol<br />
Dial Transplant. 2009;24: 3138-3143.<br />
65. Lawler EV, Gagnon DR, Fink J, et al.: Initiation of anaemia management in patients<br />
with chronic kidney disease not on dialysis in the Veterans Health Administration.<br />
Nephrol Dial Transplant. 2010;In press.<br />
66. Lawler EV, Bradbury BD, Fonda JR, Gaziano JM and Gagnon DR: Transfusion<br />
burden among patients with chronic kidney disease and anemia. Clin J Am Soc<br />
Nephrol. 2010;In press.<br />
67. <strong>Amgen</strong>: Aranesp (R) (Epoetin alfa) Prescribing Information. <strong>Amgen</strong> Inc., Thousand<br />
Oaks, CA.<br />
68. Eschbach JW, Abdulhadi MH, Browne JK, et al.: Recombinant human erythropoietin<br />
in anemic patients with end-stage renal disease. Results of a phase III multicenter<br />
clinical trial. Annals of internal medicine. 1989;111: 992-1000.<br />
69. Provenzano R, Garcia-Mayol L, Suchinda P, et al.: Once-weekly epoetin alfa for<br />
treating the anemia of chronic kidney disease. Clin Nephrol. 2004;61: 392-405.<br />
70. Revicki DA, Brown RE, Feeny DH, et al.: Health-related quality of life associated with<br />
recombinant human erythropoietin therapy for predialysis chronic renal disease<br />
patients. Am J Kidney Dis. 1995;25: 548-554.
Page 39<br />
71. Benz R, Schmidt R, Kelly K and Wolfson M: Epoetin alfa once every 2 weeks is<br />
effective for initiation of treatment of anemia of chronic kidney disease. Clin J Am<br />
Soc Nephrol. 2007;2: 215-221. .<br />
72. Kleinman KS, Schweitzer SU, Perdue ST, Bleifer KH and Abels RI: The use of<br />
recombinant human erythropoietin in the correction of anemia in predialysis patients<br />
and its effect on renal function: a double-blind, placebo-controlled trial. Am J Kidney<br />
Dis. 1989;14: 486-495.<br />
73. Alexander M, Kewalramani R, Agodoa I and Globe D: Association of anemia<br />
correction with health related quality of life in patients not on dialysis. Curr Med Res<br />
Opin. 2007;23: 2997-3008.<br />
74. Lefebvre P, Vekeman F, Sarokhan B, Enny C, Provenzano R and Cremieux PY:<br />
Relationship between hemoglobin level and quality of life in anemic patients with<br />
chronic kidney disease receiving epoetin alfa. Curr Med Res Opin. 2006;22: 1929-<br />
1937.<br />
75. Jaeschke R, Singer J and Guyatt GH: Measurement of health status. Ascertaining<br />
the minimal clinically important difference. Controlled clinical trials. 1989;10: 407-<br />
415.<br />
76. Clement FM, Klarenbach S, Tonelli M, Johnson JA and Manns BJ: The impact of<br />
selecting a high hemoglobin target level on health-related quality of life for patients<br />
with chronic kidney disease: a systematic review and meta-analysis. Archives of<br />
internal medicine. 2009;169: 1104-1112.<br />
77. Al-Ahmad A, Rand WM, Manjunath G, et al.: Reduced kidney function and anemia<br />
as risk factors for mortality in patients with left ventricular dysfunction. Journal of the<br />
American College of Cardiology. 2001;38: 955-962.<br />
78. Sarnak MJ, Tighiouart H, Manjunath G, et al.: <strong>Anemia</strong> as a risk factor for<br />
cardiovascular disease in The Atherosclerosis Risk in Communities (ARIC) study.<br />
Journal of the American College of Cardiology. 2002;40: 27-33.<br />
79. Regidor D, McClellan WM, Kewalramani R, Sharma A and Bradbury BD: Changes in<br />
erythropoiesis stimulating agent (ESA) dosing and hemoglobin levels in U.S. nondialysis<br />
chronic kidney disease patients between 2005 and 2009. submitted (under<br />
review). 2010.
Technical Appendix 1 – Evidence Tables Page 40<br />
Technical Appendix 1 – Evidence Tables<br />
Table 1a: Transfusion Burden in CKD Patients<br />
STUDY OBJECTIVE STUDY POPULATION TRANSFUSION OUTCOME<br />
Retrospective observational<br />
Gilbertson<br />
(2009) 1<br />
Describe the influence of anemia<br />
management interventions (ESA, Iron,<br />
HD patients receiving ESAs<br />
Hb variability groups:<br />
• Increased time below 11 g/dL is associated with increased<br />
risk of transfusions<br />
and transfusions) on Hb variability • Patients with Hb < 11 for six • Transfusion rate was 21.6 per 100 for patients with Hb<br />
months (L-L), N=2,165<br />
fluctuating between < 11 g/dL and 11-12.5 g/dL over 6<br />
• Patients with Hb 11-12.5 for six months<br />
consecutive months (I-I),<br />
• Transfusion rate was 121.7 per 100 for patients with Hb<br />
N=9,646<br />
persistently below 11 g/dL for six consecutive months<br />
• Patients with Hb > 12.5 for six<br />
consecutive months (H-H),<br />
N=3,750<br />
• Patients with Hb fluctuating<br />
between < 11 and 11-12.5 over<br />
six months (L-I), N=29,222<br />
• Patients with Hb > 11 for six<br />
consecutive months (I-H),<br />
N=50,680<br />
• Patients with Hb levels across<br />
Hb distribution (L-H), N=64,257<br />
Ibrahim (2008) 2 Retrospective cohort study to address<br />
patterns and trends in red blood cell<br />
(RBC) transfusions in US hemodialysis<br />
patients (1992-2005)<br />
Ibrahim (2009) 3 Retrospective cohort study to address<br />
patterns and trends in red blood cell<br />
(RBC) transfusions in the CKD and non-<br />
CKD population in Medicare between<br />
1992 to 2004<br />
All Medicare HD patients between<br />
1992 and 2005<br />
N=77,347 (1992)<br />
N=164,933 (2005)<br />
> 90% of hemodialysis received ESA<br />
treatment during this period<br />
All Medicare beneficiaries with CKD<br />
between 1992 and 2004<br />
Total CKD N=301,000<br />
N=14,057 (1992)<br />
N=42,225 (2004)<br />
Total CKD with anemia N=118,895<br />
N=4371 (1992)<br />
• Mean population hemoglobin increased from 9.7 g/dL in 1992<br />
to 11.8 g/dL in 2004<br />
• The total transfusion rate declined from 535.33 per 1000<br />
patient-years in 1992 to 263.65 per 1000 patient-years in<br />
2005<br />
• For transfusions occurring in the outpatient setting only,<br />
transfusions declined from 225.63 per 1000 patient-years in<br />
1992 to 66.66 per 1000 patient-years in 2005<br />
• The proportion of CKD patients receiving ESA therapy<br />
increased from 0.8% in 1992 to 7.5% in 2004<br />
• The total transfusion among anemic CKD patients not<br />
receiving ESA therapy was 249.2 per 1000 patient-years in<br />
1992 and 174.7 per 1000 patient-years in 2004<br />
• The total transfusion among anemic CKD patients who<br />
received ESA therapy was 572.9 per 1000 patient-years in
Technical Appendix 1 – Evidence Tables Page 41<br />
STUDY OBJECTIVE STUDY POPULATION TRANSFUSION OUTCOME<br />
N=18,579 1992 and 200.1 per 1000 patient-years in 2004<br />
Lawler (2010) 4 Estimate the burden of transfusion by<br />
anemia treatment and Hb level in CKD-<br />
NOD patients<br />
Lawler (2010) 5<br />
Examine initiation of anemia management<br />
among anemic CKD-NOD patients<br />
CKD-NOD (CKD ≥ Stage 3)<br />
Hb< 11 g/dL<br />
No anemia treatment, N=35,364<br />
Iron treatment only, N=35,420<br />
ESA treatment only, N=16,439<br />
ESA + Iron treatment, N=10,413<br />
CKD-NOD patients (eGFR 15-<br />
Technical Appendix 1 – Evidence Tables Page 42<br />
Table 1b: Cost of Red Blood Cell Transfusion<br />
STUDY OBJECTIVE STUDY POPULATION* OUTCOME<br />
Prospective Observational<br />
Agrawal et al, (2006) 1<br />
Assess direct costs of blood Hospital<br />
Average blood transfusion of 2 units to £546.12. (2004)<br />
(UK)<br />
transfusion through a time<br />
and motion study<br />
Blood cost, staff time, blood-bank cost,<br />
disposables, overnight stay, transfusion<br />
related complications<br />
Glenngard (2005) 12<br />
Assess direct costs of blood Societal<br />
Swedish kronor (SEK) 6330 for filtered allogeneic RBCs and<br />
(Sweden)<br />
transfusion through interviews<br />
with hospital staff and<br />
published data<br />
Acquisition, Typing, Testing, Preparation,<br />
Compatibility testing, Administration at the<br />
ward, Materials at the ward, Cell saver costs.<br />
SEK 5394 for autologous<br />
RBCs for surgery patients per 2-unit transfusion (2003)<br />
Ueno et al (2006) 23<br />
(US)<br />
Assess direct and indirect<br />
costs of blood transfusion<br />
through interviews,<br />
prospective time and motion<br />
and retrospective chart review<br />
Minuk et al (2008) 3 Assess indirect costs of blood<br />
transfusion through a<br />
prospective, observational<br />
study<br />
Retrospective Observational<br />
Amin (2004) 4<br />
(Canada)<br />
Assess direct costs of blood<br />
transfusion using a coststructure<br />
analysis,<br />
observational<br />
Hospital<br />
RBC acquisition/preparation, testing, and<br />
administration costs<br />
N=20<br />
Patients receiving RBC transfusion in a<br />
tertiary-care cancer center.<br />
N=1,279<br />
Societal<br />
Cost of blood collection, production, and<br />
distribution<br />
Cost of hospital transfusion service<br />
processing RBC transfusion. Transfusion<br />
reaction management<br />
/RBC unit<br />
Direct Costs: One unit costs: US$582/RBC unit<br />
Two unit costs: US$1,139/2-unit transfusion<br />
(2005)<br />
Indirect Costs: The mean (SD) time duration was 98.5 (12.7)<br />
and 92.5 (21.2) minutes for the first and second units, of blood<br />
transfusion, respectively.<br />
Transfusions are also related to increased number of physician<br />
visits<br />
A patient receiving 1 RBC unit spent a total of 109 + 19<br />
minutes (mean + SD) , independent of the time consumed by<br />
activities pre- and post- transfusion.<br />
US$264.81<br />
(95% CI, $256.29-<br />
$275.65)<br />
(2002)
Technical Appendix 1 – Evidence Tables Page 43<br />
STUDY OBJECTIVE STUDY POPULATION* OUTCOME<br />
Cremieux (2000) 5<br />
Assess direct costs of blood Provider<br />
Total: US$491.00/RBC unit (1998)<br />
(US)<br />
transfusion using<br />
retrospective chart review,<br />
observational<br />
Total direct costs<br />
Norum (2008) 6<br />
(Norway)<br />
Assess direct costs of blood<br />
transfusion using<br />
retrospective, observational<br />
Societal<br />
Health care, infections, patient, family, other<br />
sectors<br />
€1069<br />
(2005)<br />
These evidence tables include the most commonly cited references; a systematic review was not conducted.<br />
1. Agrawal S, Davidson N, Walker Mc, Gibson S, et al. Assessing the total costs of blood delivery to hospital oncology and haematology patients. Current Medical<br />
Research and Opinion. 2006. Vol. 22(10):1903–1909.<br />
2. Glenngard AH, Persson U and Soderman C: Costs associated with blood transfusions in Sweden--the societal cost of autologous, allogeneic and perioperative RBC<br />
transfusion. Transfus Med. 2005;15: 295-306.<br />
3. Ueno W, Beveridge RA and Kales AN: Costs of outpatient red blood cell transfusions. J Support Oncol. 2006;4: 494-495.<br />
4. Minuk L, Chin-Yee I, Hibbert A, Chan D and Xenocostasn A: Red blood cell transfusion and chemotherapy administration: a study of resource utilization. Community<br />
Oncology;5: 598-603.<br />
5. Cremieux PY, Barrett B, Anderson K and Slavin MB: Cost of outpatient blood transfusion in cancer patients. J Clin Oncol. 2000;18: 2755-2761.<br />
6. Norum J and Moen MA: Practice and costs of red blood cell (RBC) transfusion in an oncological unit. Anticancer Res. 2008;28: 459-464.
Technical Appendix 1 – Evidence Tables Page 44<br />
Table 2. Impact of Transfusion on Allo-Sensitization (Panel Reactive Antibodies [PRA]) and Transplantation<br />
STUDY OBJECTIVE STUDY POPULATION STUDY RESULTS<br />
Retrospective observational<br />
Bucin (1988) 1 To determine the effect of pre-transplant<br />
transfusions on long-term transplant<br />
survival<br />
Buscaroli<br />
(1992) 2<br />
Cardarelli<br />
(2005) 3<br />
To determine the association of<br />
intermediate PRA levels (30-60%) on<br />
transplant outcomes<br />
Examine the prevalence and significance<br />
of anti-HLA and donor-specific antibody<br />
(DSA) long term after renal transplantation<br />
Cecka (1988) 4 To determine effect of peak PRA on time<br />
to transplant<br />
Deierhoi (1989) 5 Determine incidence of renal transplant by<br />
PRA pattern<br />
Primary renal transplants, treated<br />
with azathioprine or prednisolone<br />
Subgroups:<br />
pre-transplant transfusions, N=79<br />
no pre-transplant transfusions, N=37<br />
241 renal transplant patients with<br />
peak PRA 12 months prior to<br />
transplant<br />
Low PRA 60%<br />
1) Persistently high: sustaining high<br />
PRA (> 60%), N=46<br />
2) Persistently low: 1 peak and<br />
decline ≤ 30%, N=22<br />
3) Variable PRA: ≥ 2 PRA peaks and<br />
• Decreased 2-year graft survival in patients with pre-transplant<br />
transfusions.<br />
• 2-year cumulative graft survival:<br />
• Transfused: 81%<br />
• No transfusion: 97% (p < 0.05)<br />
• Better graft survival 1 year post transplant for patients in the<br />
lower PRA group compared to the higher PRA group (90%<br />
vs. 79%, p
Technical Appendix 1 – Evidence Tables Page 45<br />
STUDY OBJECTIVE STUDY POPULATION STUDY RESULTS<br />
decline ≤ 30%), N=24<br />
Study follow-up period was not<br />
Hardy (2001) 6 Describe graft survival by transfusion<br />
history and PRA level<br />
Katznelson<br />
(1997) 7<br />
Describe association between highest<br />
pre-transplant PRA and transplant<br />
survival<br />
Lietz (2003) 8 Describe association between highest<br />
pre-transplant PRA and transplant<br />
survival<br />
Nicol (1993) 9 Determine effect of PRA, transfusions and<br />
other donor/recipient factors on transplant<br />
survival<br />
Opelz (2005) 10 Assess the association between the<br />
presence of lymphocytotoxic antibodies<br />
before transplantation and the outcome of<br />
kidney grafts for a) HLA identical sibling<br />
and b) cadaveric kidney transplants<br />
Soosay (2003) 11 Characterize the impact of transfusion on<br />
sensitization and time to transplant<br />
provided<br />
Transplanted UNOS registrants<br />
PRA ≤10%, N=27,787<br />
PRA>10%, N=7,447<br />
Cadaveric transplants in UNOS<br />
registrants<br />
Patients with PRA ≤20%, N=20,924<br />
Patients with PRA >20%, N=5,570<br />
Transplanted kidney survival ≥ 6<br />
months<br />
Groups:<br />
ESA, N=235<br />
Transfusion, N=207<br />
No treatment, N=60<br />
Renal transplant patients<br />
Graft failure attributed to rejection,<br />
N=48<br />
Control (functioning graft at 3 years),<br />
N=300<br />
PRA levels from the last pretransplant<br />
serum level<br />
HLA Living relative Subgroup:<br />
PRA 0 N=3001<br />
PRA 1-50 N=803<br />
PRA > 50 N=244<br />
PRA levels from the last pretransplant<br />
serum level<br />
Cadaveric Kidney Transplant<br />
Subgroup:<br />
No PRA N=116562<br />
PRA 1-50 N=36314<br />
PRA > 50 N=7610<br />
Patients on renal transplant wait list<br />
stratified by PRA<br />
N=244<br />
PRA categorized as:<br />
PRA 0−9%<br />
• Lower 3-year kidney transplant survival as transfusion<br />
burden increased<br />
• At two years graft survival among patients with<br />
PRA>20% was 76%<br />
• At two years graft survival among patients with PRA<br />
Technical Appendix 1 – Evidence Tables Page 46<br />
STUDY OBJECTIVE STUDY POPULATION STUDY RESULTS<br />
UNOS 12 Transplant registry<br />
Scientific Registry of Transplant<br />
Recipients (SRTR), annual report for<br />
transplant patients.<br />
USRDS<br />
(2009) 13<br />
Surveillance data assessing treatment<br />
patterns among ESRD patients<br />
Vella (1998) 14 Determine transfusion burden, PRA<br />
levels, and reason for sensitization in<br />
patients on the renal transplant waitlist in<br />
the pre compared to post ESA era (1989<br />
compared 1994)<br />
Zhou (1991) 15 Describe effects of sensitization on<br />
waiting time and graft survival<br />
PRA 10−59%<br />
PRA 60−79%<br />
PRA 80−100%<br />
CKD patients receiving a living donor<br />
kidney transplant by PRA level.<br />
PRA levels by graft survival 3<br />
months, 1 year, 5 years, and 10<br />
years.<br />
ESRD patients<br />
Patients 18 and older listed for a firsttime<br />
kidney-only transplant in the<br />
given year.<br />
Patients on renal transplant waitlist<br />
Year 1989, patients N=205 (pre ESA)<br />
Year 1994 patients N=126 (post ESA)<br />
Nonsensitized=PRA 50%, N=2,615<br />
These evidence tables include the most commonly cited references; a systematic review was not conducted.<br />
• Higher PRA levels increase time to transplant<br />
• Patients with PRA 0 – 9% waited 7 months on average<br />
• Patients with PRA 80 – 100% waited >35 months on<br />
average<br />
• Despite graft survival being highest in recipients of living<br />
donor kidneys, 2006 survival rates at 3 months, 1 year, 5<br />
years, and 10 years show marked reduction in survival as<br />
PRA level increases<br />
• PRA = 0-9% graft survival was 97.9% at 3 mos, 96% at 1<br />
yr, 81% at 5 years and 57.5% at 10 years<br />
• PRA = 10-79% graft survival was 97.4% at 3 mos, 95.2%<br />
at 1 yr, 76.3% at 5 years and 51.6% at 10 years<br />
• PRA > 80% graft survival was 93.8% at 3 mos, 90.9% at<br />
1 yr, 67.4% at 5 years and 45.4% at 10 years<br />
• Wait time for transplant continues to increase nationwide<br />
• Higher sensitized patients (PRA ≥ 10%) wait twice as<br />
long (>4 yrs vs. >2 yrs) as patients with PRA < 10%<br />
• Patients on the transplant waitlist longer have a higher<br />
likelihood of death<br />
• PRA levels were lower the in 1994 cohort vs. 1989 cohort in<br />
each of the three different PRA categories (p=0.008)<br />
• 49.8% of 1989 cohort had PRA = 0-9% compared to<br />
63.5% in the 1994 cohort<br />
• 25.9% of the 1989 cohort had PRA = 10-79% compared<br />
to 12.7% in the 1994 cohort<br />
• 24.4% of the 1989 cohort had PRA > 80% compared to<br />
23.8% of the 1994 cohort<br />
• At one year graft survival among patients with PRA 0-10%<br />
was 79%<br />
• At one year graft survival among patients with PRA 10-50%<br />
was 78%<br />
• At one year graft survival among patients with PRA > 50%<br />
was 72%
Technical Appendix 1 – Evidence Tables Page 47<br />
1. Besarab A, Bolton WK, Browne JK, et al.: The effects of normal as compared with low hematocrit values in patients with cardiac disease who are receiving<br />
hemodialysis and epoetin. N Engl J Med. 1998;339: 584-590.<br />
2. Pfeffer MA, Burdmann EA, Chen CY, et al.: A trial of darbepoetin alfa in type 2 diabetes and chronic kidney disease. The New England journal of medicine.<br />
2009;361: 2019-2032.<br />
3. Provenzano R, Garcia-Mayol L, Suchinda P, et al.: Once-weekly epoetin alfa for treating the anemia of chronic kidney disease. Clin Nephrol. 2004;61: 392-405.<br />
4. Boelaert JR, Daneels RF, Schurgers ML, Matthys EG, Gordts BZ and Van Landuyt HW: Iron overload in haemodialysis patients increases the risk of bacteraemia:<br />
a prospective study. Nephrol Dial Transplant. 1990;5: 130-134.<br />
5. Churchill DN, Taylor DW, Cook RJ, et al.: Canadian Hemodialysis Morbidity Study. Am J Kidney Dis. 1992;19: 214-234.<br />
6. Ibrahim HN, Ishani A, Foley RN, Guo H, Liu J and Collins AJ: Temporal trends in red blood transfusion among US dialysis patients, 1992-2005. Am J Kidney Dis.<br />
2008;52: 1115-1121. .<br />
7. Ibrahim HN, Ishani A, Guo H and Gilbertson DT: Blood transfusion use in non-dialysis-dependent chronic kidney disease patients aged 65 years and older.<br />
Nephrol Dial Transplant. 2009;24: 3138-3143.<br />
8. Seliger: Timing of ESA initiation and adverse outcomes in non-dialysis dependent CKD: a propensity matched observational cohort study. Clin J Am Soc Nephrol.<br />
2010;In press.
Technical Appendix 1 – Evidence Tables Page 48<br />
Table 3: Transfusion Reduction with ESA Treatment<br />
STUDY<br />
Randomized trial<br />
OBJECTIVE STUDY POPULATION OUTCOMES<br />
<strong>Amgen</strong> study Double-blind, partial cross over<br />
8701 (data on<br />
file)<br />
Correction of anemia with intravenous<br />
EPOGEN ® HD patients, Hb ≤ 10 g/dL<br />
in HD patients and estimate<br />
Target Hb 10.7-12.7 g/dL<br />
N=68<br />
reduction in transfusions.<br />
Treatment duration 24 weeks<br />
Correction phase, 12 weeks<br />
Placebo, N=32<br />
EPOGEN<br />
Maintenance phase: 12 weeks<br />
® • For patients randomized to receive EPOGEN<br />
treated, N=36<br />
® , transfusions<br />
were reduced from 58% at baseline to 17% at 12 weeks and<br />
to 0% at 24 weeks.<br />
• 72% of patients randomized to placebo received transfusion<br />
at baseline and this persisted at 12 weeks (63%). At this<br />
point, patients were switched to EPOGEN ® and by 24 weeks<br />
only 17% were receiving transfusion.<br />
<strong>Amgen</strong> 8904<br />
(data on file)<br />
Double-blind, partial cross over<br />
Estimate correction of anemia with<br />
subcutaneous EPOGEN ® and reduction in<br />
transfusions, PRO<br />
Target Hb 10.7-12.7<br />
Treatment duration 24 weeks<br />
Correction phase, 12 weeks<br />
Maintenance phase: 12 weeks<br />
Besarab (1998) 1 Open label<br />
To examine the risks and benefits of<br />
normalizing the hematocrit in patients with<br />
cardiac disease who were undergoing<br />
hemodialysis.<br />
Pfeffer (2009) 2<br />
and <strong>Amgen</strong> data<br />
on file<br />
Single Arm Trial<br />
Provenzano<br />
(2004) 3<br />
Randomized, double-blind, placebocontrolled<br />
In patients with Type 2 Diabetes and<br />
Chronic Kidney Disease that does not<br />
require dialysis and concomitant anemia,<br />
increasing Hb levels with the use of<br />
Darbepoetin alfa to lower the rates of<br />
death, cardiovascular events and endstage<br />
renal disease<br />
Prospective, multi-center, open-label<br />
study<br />
To study the safety and efficacy with<br />
changes in health-related quality of life.<br />
PD patients, Hb ≤ 10 g/dL<br />
Target Hb 10 10.7-12.7 g/dL<br />
N=152<br />
Placebo, N=74<br />
EPOGEN® treated, N=78<br />
HD Patients with congestive heart failure or<br />
ischemic heart disease; serum transferring<br />
saturation of ≥ 20%. Patients treated to:<br />
High target Hb arm (14 g/dL), N=618<br />
Low target Hb arm (10 g/dL), N=615<br />
Median treatment duration: 14 months<br />
Diabetic CKD-NOD patients (20 to<br />
60 mL/min/1.73 m 2 ) with anemia<br />
(Hb ≤ 11 g/dL).<br />
Treated arm, N=2012<br />
Placebo arm, N=2025<br />
Anemic CKD-NOD patients<br />
N=1557 (enrolled)<br />
N=1338 (efficacy)<br />
16-week study<br />
• Patients receiving SC EPOGEN ® were able to achieve target<br />
Hb with almost complete elimination of need of transfusion by<br />
12 weeks.<br />
• Over the course of the study, 21% of the patients in the high<br />
Hb target arm received a transfusions compared to 31% in<br />
the low Hb target arm received transfusion (p
Technical Appendix 1 – Evidence Tables Page 49<br />
STUDY OBJECTIVE STUDY POPULATION OUTCOMES<br />
Mean baseline Hb=9.1 g/dL<br />
Mean follow-up Hb=11.6 g/dL (at 16 weeks)<br />
Prospective observational<br />
Boelaert (1990) 4 Examine the increased risk of bacteremia<br />
with transfusional iron overload in patients<br />
on hemodialysis<br />
Churchill<br />
(1992) 5<br />
Determine the transfusion practices prior<br />
to the availability of EPOGEN ®<br />
Retrospective observational<br />
Ibrahim (2008) 6 Retrospective cohort study to address<br />
patterns and trends in red blood cell<br />
(RBC) transfusions in US hemodialysis<br />
patients (1992-2005)<br />
Ibrahim (2009) 7 Retrospective cohort study to address<br />
patterns and trends in red blood cell<br />
(RBC) transfusions in the CKD and non-<br />
CKD population in Medicare between<br />
1992 to 2004<br />
HD adult patients who have received<br />
transfusion in the past, and stratified by iron<br />
level:<br />
Ferretin < 500<br />
Ferritin 500-1000<br />
Ferritin ≥1000<br />
N=158<br />
Incident HD patients (after one month on<br />
dialysis) and prevalent patients who remained<br />
on dialysis for 6 months<br />
N=1158<br />
All Medicare HD patients between 1992 and<br />
2005<br />
N=77,347 (1992)<br />
N=164,933 (2005)<br />
> 90% of hemodialysis received ESA<br />
treatment during this period<br />
All Medicare beneficiaries with CKD between<br />
1992 and 2004<br />
Total CKD N=301,000<br />
N=14,057 (1992)<br />
N=42,225 (2004)<br />
Total CKD with anemia N=118,895<br />
N=4371 (1992)<br />
N=18,579<br />
• Acquired transfusional iron overload in hemodialysis patients<br />
is associated with a greater risk of bacteremia<br />
• The bacterimic incidence was 2.92 times higher in the Ferritin<br />
> 1000 than in the Ferritin < 1000 and was independent of<br />
age or dialysis vintage<br />
• Mean pre-transfusion Hb 6.87 g/dL<br />
• 639 patients (55.2%) received at least 1 unit RBC transfusion<br />
(8.1 units/pt yr)<br />
o 7% had at least one transfusion reaction<br />
o The probability of surviving 12 months without receiving<br />
a blood transfusion was 47.2% for males and 27.5% for<br />
females<br />
• Mean population Hb increased from 9.7 g/dL in 1992 to<br />
11.8 g/dL in 2004<br />
• The total transfusion rate declined from 535.33 per 1000<br />
patient-years in 1992 to 263.65 per 1000 patient-years in<br />
2005<br />
• For transfusions occurring in the outpatient setting only,<br />
transfusions declined from 225.63 per 1000 patient-years in<br />
1992 to 66.66 per 1000 patient-years in 2005<br />
• The proportion of CKD patients receiving ESA therapy<br />
increased from 0.8% in 1992 to 7.5% in 2004<br />
• The total transfusion among anemic CKD patients not<br />
receiving ESA therapy was 249.2 per 1000 patient-years in<br />
1992 and 174.7 per 1000 patient-years in 2004<br />
• The total transfusion among anemic CKD patients who<br />
received ESA therapy was 572.9 per 1000 patient-years in<br />
1992 and 200.1 per 1000 patient-years in 2004
Technical Appendix 1 – Evidence Tables Page 50<br />
STUDY OBJECTIVE STUDY POPULATION OUTCOMES<br />
Seliger (2010) 8<br />
Determine the association of timing of<br />
ESA initiation with clinical outcomes<br />
Patient with CKD-NOD (CKD<br />
< 60 mL/min/1.73 m<br />
among CKD-NOD population<br />
2 ) and anemia (excluded<br />
• Transfusion incidence rate was 19.5 per 100 person-years<br />
among the delayed ESA treatment initiation patients and 13.4<br />
patients with ESRD, hematological<br />
per 100 person-years among the early ESA treatment<br />
malignancy, on chemotherapy, hospitalized for<br />
have gastrointestinal bleeding)<br />
initiation patients (HR=0.71, 95% CI: 0.59-0.97)<br />
Early ESA treatment initiation (Hb 10-11 g/dL)<br />
N=705<br />
Delayed ESA treatment initiation<br />
(Hb < 10 g/dL)<br />
N=705<br />
Early and delayed treatment patients were<br />
propensity score matched<br />
These evidence tables include the most commonly cited references; a systematic review was not conducted<br />
1. Besarab A, Bolton WK, Browne JK, et al.: The effects of normal as compared with low hematocrit values in patients with cardiac disease who are receiving<br />
hemodialysis and epoetin. N Engl J Med. 1998;339: 584-590.<br />
2. Pfeffer MA, Burdmann EA, Chen CY, et al.: A trial of darbepoetin alfa in type 2 diabetes and chronic kidney disease. The New England journal of medicine.<br />
2009;361: 2019-2032.<br />
3. Provenzano R, Garcia-Mayol L, Suchinda P, et al.: Once-weekly epoetin alfa for treating the anemia of chronic kidney disease. Clin Nephrol. 2004;61: 392-405.<br />
4. Boelaert JR, Daneels RF, Schurgers ML, Matthys EG, Gordts BZ and Van Landuyt HW: Iron overload in haemodialysis patients increases the risk of bacteraemia:<br />
a prospective study. Nephrol Dial Transplant. 1990;5: 130-134.<br />
5. Churchill DN, Taylor DW, Cook RJ, et al.: Canadian Hemodialysis Morbidity Study. Am J Kidney Dis. 1992;19: 214-234.<br />
6. Ibrahim HN, Ishani A, Foley RN, Guo H, Liu J and Collins AJ: Temporal trends in red blood transfusion among US dialysis patients, 1992-2005. Am J Kidney Dis.<br />
2008;52: 1115-1121. .<br />
7. Ibrahim HN, Ishani A, Guo H and Gilbertson DT: Blood transfusion use in non-dialysis-dependent chronic kidney disease patients aged 65 years and older.<br />
Nephrol Dial Transplant. 2009;24: 3138-3143.<br />
8. Seliger: Timing of ESA initiation and adverse outcomes in non-dialysis dependent CKD: a propensity matched observational cohort study. Clin J Am Soc Nephrol.<br />
2010;In press.
Technical Appendix 1 – Evidence Tables Page 51<br />
Table 4: Patient Reported Outcomes (PROs) in Dialysis Patients<br />
STUDY PRO INSTRUMENT TREATMENT N BASELINE Hb<br />
MEAN (SD) or<br />
Mean (95% CI)<br />
(g/dL)<br />
RCT<br />
Furuland<br />
(2003) 1<br />
48-76 weeks<br />
N=416<br />
Foley<br />
(2001) 2<br />
48 weeks<br />
N=104<br />
(13.5 g/dL<br />
arm, n=60;<br />
10 g/dL arm,<br />
n=54)<br />
KDQ-physical<br />
symptoms<br />
KDQ- Fatigue<br />
KDQ- Depression<br />
KDQ- Frustration<br />
KDQ- Relations<br />
KDQ-fatigue<br />
Normal Hb with EA 129 10.9±1.1<br />
Sub normal Hb with EA 124 11.0±0.9<br />
Normal Hb with EA 129<br />
10.9±1.1<br />
Sub normal Hb with EA 124 11.0±0.9<br />
Normal Hb with EA 129 10.9±1.1<br />
Sub normal Hb with EA 124 11.0±0.9<br />
Normal Hb with EA 129 10.9±1.1<br />
Sub normal Hb with EA 124 11.0±0.9<br />
Normal Hb with EA 129 10.9±1.1<br />
Sub normal Hb with EA 124 11.0±0.9<br />
EA target 13.5 g/dL<br />
(Concentric LV<br />
hypertrophy)<br />
EA target 13.5 g/dL<br />
(LV dilation)<br />
EA target 10 g/dL<br />
(Concentric LV<br />
hypertrophy)<br />
EA target 10 g/dL<br />
(LV dilation)<br />
34 12.2 (11.9,12.5)<br />
39 12.3 (12.0,12.5)<br />
36<br />
36<br />
10.4 (10.2,10.6)<br />
10.4 (10.2,10.6)<br />
BASELINE<br />
PRO<br />
3.83<br />
(1.67–7.00)<br />
4.00<br />
(1.00–7.00)<br />
4.67<br />
(1.17–7.00)<br />
5.00<br />
(1.00–7.00)<br />
5.40<br />
(1.40–7.00)<br />
5.60<br />
(1.60–7.00)<br />
6.00<br />
(3.00–7.00)<br />
6.00<br />
(1.00–7.00)<br />
5.17<br />
(1.83–6.67)<br />
5.00<br />
(1.17–6.83)<br />
4.41<br />
(4.10,4.73)<br />
4.53<br />
(4.15,4.91)<br />
Hb (g/dL)/Hct(%)<br />
LEVELS or<br />
CHANGE IN Hb<br />
(g/dL)/Hct (%)<br />
LEVELS<br />
2.2-3.7<br />
0.3-0.8<br />
2.2-3.7<br />
0.3-0.8<br />
2.2-3.7<br />
0.3-0.8<br />
2.2-3.7<br />
0.3-0.8<br />
2.2-3.7<br />
0.3-0.8<br />
NR<br />
NR<br />
CHANGE IN PRO STAT<br />
SIGNIF<br />
Median (Min-Max)<br />
0.66<br />
(–1.17–3.00)<br />
0.25<br />
(–1.17–2.66)<br />
0.16<br />
(–2.50–2.34)<br />
-0.33<br />
(-3.17–2.00)<br />
0.00<br />
(-4.00–2.60)<br />
-0.40<br />
(-2.40–2.20)<br />
0.00<br />
(-1.67–2.34)<br />
0.00<br />
(-2.00–2.00)<br />
0.00<br />
(-2.66–2.67)<br />
0.00<br />
(-2.67–2.33)<br />
Mean (95%CI)<br />
to week 24:<br />
0.46 (0.17,0.75)<br />
to week 48:<br />
0.25 (-0.05,0.55)<br />
To week 24:<br />
-0.04 (-0.22,0.14)<br />
To week 48:<br />
-0.01 (-0.30,0.29)<br />
0.02<br />
0.05<br />
0.01<br />
0.05<br />
0.19<br />
To week<br />
24:<br />
P=0.004<br />
To week<br />
48:<br />
P=0.22
Technical Appendix 1 – Evidence Tables Page 52<br />
STUDY PRO INSTRUMENT TREATMENT N BASELINE Hb<br />
MEAN (SD) or<br />
Mean (95% CI)<br />
(g/dL)<br />
KDQ-depression<br />
KDQ-relationships<br />
KDQ-physical<br />
symptoms<br />
KDQ—Frustration<br />
EA target 13.5 g/dL<br />
(Concentric LV<br />
hypertrophy)<br />
EA target 13.5 g/dL<br />
(LV dilation)<br />
EA target 10 g/dL<br />
(Concentric LV<br />
hypertrophy)<br />
EA target 10 g/dL<br />
(LV dilation)<br />
EA target 13.5 g/dL<br />
(Concentric LV<br />
hypertrophy)<br />
EA target 13.5 g/dL<br />
(LV dilation)<br />
EA target 10 g/dL<br />
(Concentric LV<br />
hypertrophy)<br />
EA target 10 g/dL(LV<br />
dilation)<br />
EA target 13.5 g/dL<br />
(Concentric LV<br />
hypertrophy)<br />
EA target 13.5 g/dL<br />
(LV dilation)<br />
EA target 10 g/dL<br />
(Concentric LV<br />
hypertrophy)<br />
EA target 10 g/dL(LV<br />
dilation)<br />
EA target 13.5 g/dL<br />
(Concentric LV<br />
hypertrophy)<br />
34<br />
39<br />
12.2 (11.9,12.5)<br />
12.3 (12.0,12.5)<br />
36 10.4 (10.2,10.6)<br />
36<br />
10.4 (10.2,10.6)<br />
34 12.2 (11.9,12.5)<br />
39 12.3 (12.0,12.5)<br />
36<br />
36<br />
10.4 (10.2,10.6)<br />
10.4 (10.2,10.6)<br />
34 12.2 (11.9,12.5)<br />
39 12.3 (12.0,12.5)<br />
36 10.4 (10.2,10.6)<br />
36 10.4 (10.2,10.6)<br />
34 12.2 (11.9,12.5)<br />
EA target 13.5 g/dL 39 12.3 (12.0,12.5)<br />
BASELINE<br />
PRO<br />
5.02<br />
(4.69,5.35)<br />
5.20<br />
(4.81,5.59)<br />
5.04<br />
(4.78,5.29)<br />
4.96<br />
(4.49,5.32)<br />
3.49<br />
(3.17,3.81)<br />
3.68<br />
(3.28,4.08)<br />
4.93<br />
(4.57,5.30)<br />
Hb (g/dL)/Hct(%)<br />
LEVELS or<br />
CHANGE IN Hb<br />
(g/dL)/Hct (%)<br />
LEVELS<br />
NR<br />
NR<br />
NR<br />
NR<br />
NR<br />
NR<br />
NR<br />
CHANGE IN PRO STAT<br />
SIGNIF<br />
To week 24:<br />
0.30 (0.06,0.53)<br />
To week 48:<br />
0.05 (-0.28,0.37)<br />
To week 24:<br />
0.00 (-0.23,0.24)<br />
To week 48:<br />
0.20 (-0.11,0.51)<br />
To week 24: 0.31<br />
(0.15,0.48)<br />
To week 48:<br />
-0.07 (-0.38,0.24)<br />
To week 24:<br />
-0.04 (-0.31,0.23)<br />
To week 48:<br />
0.20 (-0.15,0.46)<br />
To week 24:<br />
0.79 (0.39,1.20)<br />
To week 48:<br />
1.10 (0.55,1.64)<br />
To week 24:<br />
0.71 (0.38,1.04)<br />
To week 48:<br />
1.17 (0.76,1.57)<br />
To week 24:<br />
0.16 (-0.08,0.39)<br />
To week 48:<br />
-0.07 (-0.38,0.24)<br />
Week<br />
24:<br />
P=0.083<br />
Week<br />
48:<br />
P=0.49<br />
Week<br />
24:<br />
P=0.025<br />
Week<br />
48:<br />
P=0.31<br />
Week<br />
24:<br />
P=0.76<br />
WEEK<br />
48:<br />
P=0.84<br />
Week<br />
24:<br />
P=0.36<br />
Week
Technical Appendix 1 – Evidence Tables Page 53<br />
STUDY PRO INSTRUMENT TREATMENT N BASELINE Hb<br />
MEAN (SD) or<br />
Mean (95% CI)<br />
(g/dL)<br />
Muirhead<br />
(1992) 3<br />
(SC Epoetin<br />
alfa vs IV<br />
Epoetin alfa)<br />
24 weeks<br />
Physical<br />
Fatigue<br />
Relationship<br />
Depression<br />
(LV dilation)<br />
EA target 10 g/dL<br />
(Concentric LV<br />
hypertrophy)<br />
EA target 10 g/dL<br />
(LV dilation)<br />
SC 45<br />
IV 36<br />
SC 45<br />
IV 36<br />
SC 45<br />
IV 36<br />
36 10.4 (10.2,10.6)<br />
36 10.4 (10.2,10.6)<br />
After run-in:<br />
8.01±1.37<br />
After run-in:7.74<br />
±1.53<br />
After run-in:<br />
8.01±1.37<br />
After run-in:7.74<br />
±1.53<br />
After run-in:<br />
8.01±1.37<br />
After run-in:7.74<br />
±1.53<br />
BASELINE<br />
PRO<br />
5.07<br />
(4.66,5.08)<br />
4.3±1.2<br />
4.3±1.1<br />
4.5±1.4<br />
4.3±1.4<br />
5.2±1.0<br />
4.9±1.2<br />
Hb (g/dL)/Hct(%)<br />
LEVELS or<br />
CHANGE IN Hb<br />
(g/dL)/Hct (%)<br />
LEVELS<br />
NR<br />
Mean (SD)<br />
After stabilization:<br />
11.8±0.81;<br />
24 week:<br />
10.93±1.05<br />
After stabilization<br />
11.5±0.8<br />
24 week:<br />
11.2±1.1<br />
After stabilization:<br />
11.7±0.81;<br />
24 week:<br />
10.93±1.05<br />
After stabilization<br />
11.5±0.8<br />
24 week:<br />
11.2±1.1<br />
After stabilization:<br />
11.7±0.81;<br />
24 week:<br />
10.93±1.05<br />
After stabilization<br />
11.5±0.8<br />
24 week:<br />
11.2±1.1<br />
SC 45 After run-in: 5.1±1.4 After stabilization:<br />
CHANGE IN PRO STAT<br />
SIGNIF<br />
To week 24:<br />
-0.01 (-0.31,0.27)<br />
To week 48:<br />
0.15 (-0.15,0.46)<br />
48:<br />
P=0.31<br />
After stabilization: 0.53±0.890*;<br />
week 8<br />
0.70±1.0*;<br />
week 16<br />
0.55±1.1*;<br />
week 24<br />
0.69±1.2*<br />
(*p
Technical Appendix 1 – Evidence Tables Page 54<br />
STUDY PRO INSTRUMENT TREATMENT N BASELINE Hb<br />
MEAN (SD) or<br />
Mean (95% CI)<br />
(g/dL)<br />
Frustration<br />
Global physical<br />
Global emotional<br />
Non-randomized controlled studies<br />
IV 36<br />
SC 45<br />
IV 36<br />
SC 45<br />
IV 36<br />
SC 45<br />
IV 36<br />
BASELINE<br />
PRO<br />
Hb (g/dL)/Hct(%)<br />
LEVELS or<br />
CHANGE IN Hb<br />
(g/dL)/Hct (%)<br />
LEVELS<br />
8.01±1.37 11.7±0.81;<br />
24 week:<br />
10.93±1.05<br />
After run-in:7.74<br />
±1.53<br />
After run-in:<br />
8.01±1.37<br />
After run-in:7.74<br />
±1.53<br />
After run-in:<br />
8.01±1.37<br />
After run-in:7.74<br />
±1.53<br />
After run-in:<br />
8.01±1.37<br />
After run-in:7.74<br />
±1.53<br />
5.0±1.4<br />
5.3±1.3<br />
4.9±1.5<br />
4.5±1.2<br />
4.4±1.2<br />
5.2±1.1<br />
4.9±1.2<br />
After stabilization<br />
11.5±0.8<br />
24 week:<br />
11.2±1.1<br />
After stabilization:<br />
11.7±0.81;<br />
24 week:<br />
10.93±1.05<br />
After stabilization<br />
11.5±0.8<br />
24 week:<br />
11.2±1.1<br />
After stabilization:<br />
11.7±0.81;<br />
24 week:<br />
10.93±1.05<br />
After stabilization<br />
11.5±0.8<br />
24 week:<br />
11.2±1.1<br />
After stabilization:<br />
11.7±0.81;<br />
24 week:<br />
10.93±1.05<br />
After stabilization<br />
11.5±0.8<br />
24 week:<br />
11.2±1.1<br />
CHANGE IN PRO STAT<br />
SIGNIF<br />
0.15±0.94<br />
0.00±0.97<br />
0.07±0.98<br />
0.07±0.86<br />
0.03±0.94<br />
-0.06±0.98<br />
-0.02±0.98<br />
0.46±0.75*<br />
0.54±0.92*<br />
0.35±1.1*<br />
0.46±1.1*<br />
0.12±0.69<br />
0.11±0.76<br />
0.01±0.83<br />
0.08±0.82
Technical Appendix 1 – Evidence Tables Page 55<br />
STUDY PRO INSTRUMENT TREATMENT N BASELINE Hb<br />
MEAN (SD) or<br />
Mean (95% CI)<br />
(g/dL)<br />
Barany<br />
(1993) 4<br />
Physical activities,<br />
physical symptoms,<br />
sleep, sexual<br />
adjustment, emotional<br />
wellbeing<br />
Open-label single arm studies<br />
Evans<br />
(1990) 5<br />
NR<br />
24(EPO)<br />
8 (control)<br />
BASELINE<br />
PRO<br />
Kamotsky Index EA 333 NR 3.30 (1.33)<br />
Hb (g/dL)/Hct(%)<br />
LEVELS or<br />
CHANGE IN Hb<br />
(g/dL)/Hct (%)<br />
LEVELS<br />
CHANGE IN PRO STAT<br />
SIGNIF<br />
NR NR NR NR P
Technical Appendix 1 – Evidence Tables Page 56<br />
STUDY PRO INSTRUMENT TREATMENT N BASELINE Hb<br />
MEAN (SD) or<br />
Mean (95% CI)<br />
(g/dL)<br />
BASELINE<br />
PRO<br />
Hb (g/dL)/Hct(%)<br />
LEVELS or<br />
CHANGE IN Hb<br />
(g/dL)/Hct (%)<br />
LEVELS<br />
CHANGE IN PRO STAT<br />
SIGNIF<br />
Social isolation 19.3% 13.6%; 14.2% 0.032<br />
mobility 21.1% 16.3%;19.0% 0.263<br />
Job or work 37.1% 24.4%; 28.9% 0.080<br />
home 55.0% 41.6%; 42.4% 0.010<br />
Social life 46.9% 36%; 40.8% 0.160<br />
Personal relationship 28.4% 21%; 21.3% 0.160<br />
Sex life 49.2% 40.9%; 35.7% 0.004<br />
hobbies 51.1% 33.1%; 32.9% 0.001<br />
Holidays 63.6% 57.9%; 64.6% 0.780<br />
Well-being EA 333 NR 11.24 (3.13)<br />
Psychological affect 5.05 (1.35)<br />
Life satisfaction 5.63 (1.77)<br />
Average hematocrit<br />
1 st follow-up (mean<br />
4.4 months): 0.35;<br />
2 nd follow-up (mean<br />
10.3 months): 0.34<br />
These evidence tables include the most commonly cited references; a systematic review was not conducted<br />
11.81 (2.66);<br />
11.87 (2.70)<br />
5.30 (1.07); 5.25<br />
(1.20)<br />
5.92 (1.61); 6.02<br />
(1.59)<br />
1. Furuland H, Linde T, Ahlmen J, Christensson A, Strombom U and Danielson BG: A randomized controlled trial of haemoglobin normalization with epoetin alfa in<br />
pre-dialysis and dialysis patients. Nephrol Dial Transplant. 2003;18: 353-361.<br />
2. Foley RN, Parfrey PS, Morgan J, et al.: Effect of hemoglobin levels in hemodialysis patients with asymptomatic cardiomyopathy. Kidney international. 2000;58:<br />
1325-1335.<br />
3. Muirhead N, Laupacis A and Wong C: Erythropoietin for anaemia in haemodialysis patients: results of a maintenance study (the Canadian Erythropoietin Study<br />
Group). Nephrol Dial Transplant. 1992;7: 811-816.<br />
4. Barany P, Pettersson E and Konarski-Svensson JK: Long-term effects on quality of life in haemodialysis patients of correction of anaemia with erythropoietin.<br />
Nephrol Dial Transplant. 1993;8: 426-432.<br />
5. Evans RW, Rader B and Manninen DL: The quality of life of hemodialysis recipients treated with recombinant human erythropoietin. Cooperative Multicenter EPO<br />
Clinical Trial Group. JAMA. 1990;263: 825-830.<br />
0.004<br />
0.003<br />
0.017
Technical Appendix 1 – Evidence Tables Page 57<br />
Table 5: Cardiovascular and All-cause Morbidity/Mortality Outcomes Related to Target and Achieved Hemoglobin Levels<br />
STUDY OBJECTIVE STUDY POPULATION OUTCOMES<br />
Randomized trials<br />
Besarab (1998) 1<br />
Open label<br />
To examine the risks and benefits of<br />
normalizing the hematocrit in patients with<br />
cardiac disease who were undergoing<br />
hemodialysis.<br />
Drueke (2006) 2 Open label<br />
Determine effect of treating with ESA to a<br />
high Hb target of 13-15 g/dL compared to<br />
a low Hb target of 10.5 – 11.5 g/dL on CV<br />
events on patients with Stage IV CKD<br />
patients.<br />
Singh (2006) 3 Open label<br />
Determine effect of treating with ESA to a<br />
high Hb target of 13.5 g/dL compared to a<br />
low Hb target of less than 11.3 g/dL on CV<br />
events and mortality<br />
Parfrey (2005) 9 Randomized double blind<br />
Determine effect of treating with ESA to a<br />
high Hb target of 13.5 – 14.5 g/dL<br />
compared to a low Hb target of less than<br />
9.5 - 11.5 g/dL on left ventricular volume<br />
index<br />
Pfeffer (2009) 4 Randomized, double-blind, placebocontrolled<br />
Determine effect of treating with ESA to a<br />
target of 13 g/dL on composite CV<br />
morbidity and mortality compared to<br />
placebo (with rescue at Hb
Technical Appendix 1 – Evidence Tables Page 58<br />
STUDY OBJECTIVE STUDY POPULATION OUTCOMES<br />
Retrospective observational studies<br />
Collins (2001) 5 To assess mortality, hospitalization, and<br />
Medicare allowable expenditures in<br />
incident hemodialysis patients<br />
Ofsthun (2003) 6<br />
Li (2004) 7<br />
To determine the association between<br />
hemoglobin level and risk of mortality and<br />
hospitalization.<br />
To determine the association between Hct<br />
and cardiac risk<br />
Regidor (2006) 8 Determine the association between<br />
achieved hemoglobin level and CV/all<br />
cause mortality<br />
Incident HD patients<br />
Time frame: January 1, 1996 and June 30,<br />
1998<br />
N: 66,761<br />
HD patients in Fresenius Medical Care-North<br />
America facilities<br />
N:44,550<br />
Time frame: July 1, 1998~June 30, 2000<br />
Incident HD patients<br />
At least 9 months f/u<br />
N: 50,579<br />
Time frame: Jan 1, 1998 ~Dec 31, 1999.<br />
HD patients in DaVita database<br />
N=58,058<br />
Twelve categories of blood hemoglobin (< 9<br />
g/dL, ≥ 14 g/dl, and 10 g/dL, increments of<br />
0.5 g/dL in between)<br />
These evidence tables include the most commonly cited references; a systematic review was not conducted.<br />
• Relative risk of death and all-cause, cardiovascular, and<br />
infectious hospitalizations increased significantly with<br />
declining Hb (HCT).<br />
• There is an increased risk of death with decreasing Hb,<br />
comparing Hb 39% to 33-36%<br />
• Compared to a time-varying hemoglobin of 11.5-12 g/dL, a<br />
time-varying hemoglobin of 9.5-
Technical Appendix 1 – Evidence Tables Page 59<br />
Table 6: Relationship Between Achieved Hemoglobin (Hematocrit) and the Risk of Hospitalization and Healthcare Resource<br />
Utilization (HRU)<br />
STUDY OBJECTIVE STUDY POPULATION HOSPITALIZATION AND HRU OUTCOME SUMMARY<br />
Retrospective data analysis<br />
Xia (1999) 1<br />
To evaluate the association<br />
between hematocrit level and<br />
risk of hospitalization<br />
Collins (2001) 2 To evaluate the association<br />
between baseline hematocrit<br />
level and the risk of<br />
hospitalization and death<br />
Ofsthun (2003) 3<br />
Li (2004) 4<br />
To evaluate the association<br />
between hemoglobin level and<br />
hospitalization burden and<br />
length of stay<br />
To evaluate the association<br />
between hematocrit and risk of<br />
hospitalization<br />
Seliger (2010) 5 To evaluate the association<br />
between the timing of ESA<br />
treatment initiation and the risk<br />
of hospitalization<br />
US HD patients<br />
N=71,717<br />
Time frame: July 1993-December 1994<br />
Incident US HD patients<br />
N=66,761<br />
Time frame: 1996 - 1998<br />
Follow-up period: 1 year<br />
US HD patients<br />
N=44,550<br />
Time frame: July 1998-June 2000.<br />
Incident US HD patients with at least 9 months of<br />
follow-up.<br />
N=50,579<br />
Time frame: January, 1998- December, 1999.<br />
CKD-NOD patients<br />
(eGFR 15-
Technical Appendix 1 – Evidence Tables Page 60<br />
STUDY OBJECTIVE STUDY POPULATION HOSPITALIZATION AND HRU OUTCOME SUMMARY<br />
Prospective Data Analysis<br />
Churchill<br />
(1995) 6<br />
To evaluate the effect of ESA<br />
use on utilization of hospital<br />
Multicenter Canadian prospective cohort study in<br />
HD patients<br />
• There were 58 hospitalizations in the EPO group vs. 97 in the nontreated<br />
group.<br />
resources in hemodialysis N=67 EPO treated hemodialysis patients<br />
• Average days hospitalized per admission: 15.3 days (EPO treated) vs.<br />
patients<br />
Baseline Hb 78.6 g/L<br />
N=67 non-treated matched patient<br />
Baseline Hb 74.0 g/L<br />
23.2 (non-treated)<br />
These evidence tables include the most commonly cited references; a systematic review was not conducted<br />
1. Xia H, Ebben J, Ma JZ and Collins AJ: Hematocrit levels and hospitalization risks in hemodialysis patients. J Am Soc Nephrol. 1999;10: 1309-1316.<br />
2. Collins AJ, Li S, St Peter W, et al.: Death, hospitalization, and economic associations among incident hemodialysis patients with hematocrit values of 36 to 39%. J<br />
Am Soc Nephrol. 2001;12: 2465-2473.<br />
3. Ofsthun N, Labrecque J, Lacson E, Keen M and Lazarus JM: The effects of higher hemoglobin levels on mortality and hospitalization in hemodialysis patients.<br />
Kidney Int. 2003;63: 1908-1914.<br />
4. Li S, Foley RN and Collins AJ: <strong>Anemia</strong>, hospitalization, and mortality in patients receiving peritoneal dialysis in the United States. Kidney Int. 2004;65: 1864-1869.<br />
5. Seliger: Timing of ESA initiation and adverse outcomes in non-dialysis dependent CKD: a propensity matched observational cohort study. Clin J Am Soc Nephrol.<br />
2010;In press.<br />
6. Churchill DN, Muirhead N, Goldstein M, et al.: Effect of recombinant human erythropoietin on hospitalization of hemodialysis patients. Clinical nephrology.<br />
1995;43: 184-188.
Technical Appendix 1 – Evidence Tables Page 61<br />
Table 7: Hemoglobin Variability in CKD Patients<br />
STUDY OBJECTIVE STUDY POPULATION OUTCOMES<br />
Randomized prospective trial<br />
West (2007) 1 Open-label, single-center<br />
To characterize Hb variability<br />
using functional data analysis<br />
Retrospective data analysis<br />
Fishbane<br />
(2005) 2<br />
Lacson (2003) 3<br />
To describe hemoglobin cycling in<br />
ESA-treated HD patients; to analyze<br />
etiologic factors; assess Hb<br />
fluctuations on iron storage; and to<br />
study factors associated with a<br />
greater degree of cycling.<br />
To quantify Hb level variability and<br />
the likelihood of falling within the Hb<br />
level goal range of 11 to 12 g/dL.<br />
Ebben (2006) 4 To characterize hemoglobin level<br />
variability in US dialysis patients<br />
Ad-hoc analysis of data from prevalent<br />
HD patients, iron-replete<br />
N=151<br />
HD Patients on chronic maintenance<br />
outpatient hemodialysis in a single center<br />
N=281<br />
Time frame: 1998-2003<br />
US HD patients in Fresenius Medical Care<br />
N=65,009<br />
Time frame: Jan 1-Dec 31, 2000<br />
US HD patients<br />
N=159,720<br />
Assess variability of 6-month period based<br />
on patterns of hemoglobin change using the<br />
categories<br />
• < 11 g/dL<br />
• 11-12.5 g/dL<br />
• For majority of patients, Hb instability was small, typified<br />
by the overall mean value of 0.63 g/dL per mo<br />
• The data show trajectories that vary widely and form a<br />
continuum, rather than obvious subsets<br />
• The quantitative analysis of individual responses within<br />
the system revealed a continuous spectrum of measurable<br />
Hb instability, overlapping for each treatment group<br />
• Greater than 90% of patients experienced Hb cycling defined as<br />
one or more annual, full, extended cycle of amplitude >1.5 Hb<br />
g/dL of a duration more than 8 weeks<br />
• A subpopulation of patients was identified with more frequent<br />
cycling (>2 cycles per year). No clinical factors were identified in<br />
this group other than they were more responsive to ESA than<br />
other patients (ERI 1036 ± 659 U/week/g Hb compared to 1992 ±<br />
701 U/week/g Hb respectively) (p=0.02)<br />
• 38.4% patients had Hb 11~12 g/dL. In only 8% did Hb levels<br />
consistently remain less than 11 g/dL, and in 18%, greater than 12<br />
g/dL all year. 29% (18,633 patients) moved from below to above<br />
target range or vice versa. The average individual patient is<br />
expected to have a±1.4-g/dL fluctuation in 3-month rolling average<br />
Hgb levels per year.<br />
• Greater mean facility Hb level correlated with a greater<br />
percentage of patients with Hb levels greater than 10 g/dL<br />
(R 2 =0.49) and greater than 12.5 g/dL (R 2 =0.61).<br />
• Despite increased mean Hb levels and EPO and iron use, the<br />
spread of the Hb distribution curve remained unchanged in the<br />
last 6 years.<br />
• 1.8% of patients had Hb < 11 for six consecutive months<br />
• 6.5% of patients had Hb 11-12.5 for six consecutive months<br />
• 2.0% of patients had Hb > 12.5 for six consecutive months<br />
• 21.3% of patients had Hb fluctuations between < 11 and 11-12.5<br />
over six months<br />
• 28.9% of patients had Hb fluctuations between 11-12.5 and ><br />
12.5 g/dL over six months
Technical Appendix 1 – Evidence Tables Page 62<br />
STUDY OBJECTIVE STUDY POPULATION OUTCOMES<br />
• > 12.5 g/dL<br />
• 39.5% of patients had Hb < 11 and > 12.5 g/dL over six months<br />
• Hospitalization events, comorbidity and intercurrent events were<br />
association with persistently low (Hb < 11 for six months) and<br />
transiently low (Hb < 11 and between 11 and 12.5) hemoglobin<br />
levels<br />
Gilbertson<br />
(2008) 5<br />
To evaluate association between<br />
hemoglobin variability groups and<br />
US HD patients receiving ESAs<br />
N=159,720<br />
• Patients with Hb < 11 for six consecutive months had<br />
significantly elevated risk of mortality compared to those with Hb<br />
mortality<br />
Time frame: 2004<br />
11-12.5 for six months (HR 2.18; 95%CI:1.93-2.45)<br />
Hemoglobin variability groups:<br />
• Patients with Hb < 11 and 11-12.5 had an elevated risk of death<br />
• Patients with Hb < 11 for six months<br />
(HR=1.44, 95% CI: 1.33-1.56)<br />
• Patients with Hb 11-12.5 for six<br />
consecutive months<br />
• Patients with Hb > 12.5 for six<br />
consecutive months<br />
• Patients with Hb fluctuating between <<br />
11 and 11-12.5 over six months<br />
• Patients with Hb > 11 for six<br />
consecutive months<br />
• Patients with Hb levels across Hb<br />
distribution<br />
Spiegel (2009) 6<br />
To evaluate the impact of recent<br />
events on ESA dosing patterns and<br />
consequently on hemoglobin (Hb)<br />
distribution characteristics in dialysis<br />
patients.<br />
Yang (2007) 7 To evaluate the association between<br />
hemoglobin variability and mortality<br />
Minutolo (2009) 8 To evaluate whether intensity of<br />
epoetin therapy affects hemoglobin<br />
variability and renal survival in CKD-<br />
HD patients from ~87% of dialysis centers in<br />
the US.<br />
N: 743,000<br />
Time frame: June 2006-November 2008<br />
HD patients have ≥3 Hb measurements, no<br />
drop-out in exposure window<br />
N=19,150<br />
Hb variability measured by:<br />
• absolute level of Hb (intercept),<br />
• temporal trend in Hb (slope)<br />
• Hb variability (residual standard<br />
deviation).<br />
Adult CKD-NOD patients with anemia<br />
patients receiving epoetin<br />
N: 137 patients (1,198 visits)<br />
• Mean Hb level decreased by 0.37 g/dL during the indicated period<br />
• standard deviation (SD) of the population Hb level distribution<br />
decreased by 0.14 g/dL and skewness increased by -0.10<br />
• Hb measurements in specific ranges changed as follows: >12<br />
g/dL, decreased by 11.3 percentage points; 10-12 g/dL, increased<br />
by 9.4 percentage points; and 13<br />
g/dL for ≥3 months decreased by 2.9 percentage points<br />
• Survival analyses indicated that each 1g/dL increase in the<br />
residual standard deviation was associated with a 33% increase<br />
in rate of death, even after adjusting for multiple baseline<br />
covariates<br />
• Patient characteristics accounted for very little of the variation in<br />
hemoglobin variability metric<br />
• Limitation: hospitalizations and other acute events were not<br />
included in the model used<br />
• Lower hemoglobin response to first epoetin dosage was an<br />
independent predictor of higher therapeutic index(TI) (difference<br />
between rates of visits that required EPO dosage change and
Technical Appendix 1 – Evidence Tables Page 63<br />
STUDY OBJECTIVE STUDY POPULATION OUTCOMES<br />
NOD patients. Time frame: April 30, 2002~October 31,<br />
2005<br />
These evidence tables include the most commonly cited references; a systematic review was not conducted.<br />
those with effective EPO change) (P = 0.002)<br />
• From lower to higher tertile of TI, Hb variability increased, as<br />
shown by the reduction of time with Hb at target (time in target,<br />
from 9.2 ±2.0 to 3.0±2.2 mo; p < 0.0001) and the wider values of<br />
within-patient Hb standard deviation (from 0.70 to 0.96; P = 0.005)<br />
and Hb fluctuations across target (p < 0.0001)<br />
• Lack of adjustment of EPO worsens Hb variability in CKD. Hb<br />
variability may be associated with renal survival, but further<br />
studies are needed to explore the association versus causal<br />
relationship<br />
1. West RM, Harris K, Gilthorpe MS, Tolman C and Will EJ: Functional data analysis applied to a randomized controlled clinical trial in hemodialysis patients<br />
describes the variability of patient responses in the control of renal anemia. J Am Soc Nephrol. 2007;18: 2371-2376.<br />
2. Fishbane S and Berns JS: Hemoglobin cycling in hemodialysis patients treated with recombinant human erythropoietin. Kidney Int. 2005;68: 1337-1343.<br />
3. Lacson E, Jr., Ofsthun N and Lazarus JM: Effect of variability in anemia management on hemoglobin outcomes in ESRD. Am J Kidney Dis. 2003;41: 111-124.<br />
4. Ebben JP, Gilbertson DT, Foley RN and Collins AJ: Hemoglobin level variability: associations with comorbidity, intercurrent events, and hospitalizations. Clin J Am<br />
Soc Nephrol. 2006;1: 1205-1210. .<br />
5. Gilbertson DT, Ebben JP, Foley RN, Weinhandl ED, Bradbury BD and Collins AJ: Hemoglobin level variability: associations with mortality. Clin J Am Soc Nephrol.<br />
2008;3: 133-138.<br />
6. Spiegel DM, Khan I, Krishnan M and Mayne TJ: Changes in hemoglobin level distribution in US dialysis patients from June 2006 to November 2008. Am J Kidney<br />
Dis. 2009;55: 113-120.<br />
7. Yang W, Israni RK, Brunelli SM, Joffe MM, Fishbane S and Feldman HI: Hemoglobin variability and mortality in ESRD. J Am Soc Nephrol. 2007;18: 3164-3170.<br />
8. Minutolo R, Chiodini P, Cianciaruso B, et al.: Epoetin therapy and hemoglobin level variability in nondialysis patients with chronic kidney disease. Clin J Am Soc<br />
Nephrol. 2009;4: 552-559.
Technical Appendix 1 – Evidence Tables Page 64<br />
Table 8: Patient Reported Outcomes (PROs) in CKD-NOD Patients<br />
STUDY DESIGN CHANGE<br />
IN PRO<br />
Mean<br />
(SD)<br />
Double-blind RCT – Energy/Vitality/Activity<br />
Kleinman (1989) 1 *****<br />
Energy (Single item VAS)<br />
N = 14<br />
PRO FU=12 weeks<br />
Pfeffer (2009) 2<br />
Energy/Vitality subscale of<br />
the SF-36<br />
N= 4047<br />
PRO FU= 25 weeks<br />
Singh (2006) 3<br />
LASA Energy score<br />
N= 1432<br />
PRO FU= NR<br />
The US Recombinant<br />
Human Erythropoietin<br />
Predialysis Study Group<br />
(1991) 4 ***<br />
Energy (5-point Likert<br />
Scale)<br />
N= 117<br />
PRO FU=8 weeks<br />
Treated (target<br />
Hct: 38 – 40 %<br />
Placebo NR<br />
STAT<br />
SIG §<br />
EFFECT SIZE MCID BASELINE Hb<br />
OR HCT<br />
Hb OR<br />
Hct AT<br />
STUDY<br />
END<br />
CHANGE IN<br />
Hb OR Hct<br />
PER UNIT<br />
CHANGE IN<br />
ENERGY /<br />
VITALITY /<br />
ACTIVITY**<br />
NR NE NE NR NR 7.7% (Hct) NE<br />
NR*<br />
NE NE NR NR -0.1% (Hct) NE<br />
DA (High Hb<br />
Target: 13 g/dL)<br />
+2.6(9.9)<br />
p = 0.20<br />
0.234 No 10.4 (9.8-10.8) 12.5 g/dL 2.1 g/dL 1.2<br />
Placebo +2.1(9.7)<br />
0.190 No 10.4 (9.8-10.8) 10.6 g/dL 0.2 g/dL 10.5<br />
High Hb Target<br />
(13.5 g/dL)<br />
Low Hb Target<br />
(11.3 g/dL)<br />
<strong>Anemia</strong> corrected<br />
[Target Hct: 40%<br />
(men) and 37%<br />
(women)]<br />
Open-label RCTs - Energy/Vitality/Activity<br />
+16.6<br />
(23.7) *<br />
+15.5<br />
(23.1) *<br />
+1.45<br />
(NR)<br />
P = 0.7<br />
0.70<br />
(Moderate)<br />
0.67<br />
(Moderate)<br />
p
Technical Appendix 1 – Evidence Tables Page 65<br />
Drueke (2006) 5<br />
Energy/Vitality subscale of<br />
the SF-36<br />
N =603<br />
PRO FU= 12 months<br />
MacDougall (2008) 6<br />
Energy/Vitality subscale of<br />
the SF-36<br />
N = 297<br />
PRO FU=29 weeks<br />
High Hb Target<br />
(13.0 – 15.0 g/dL)<br />
Low Hb Target<br />
(10.5 – 11.5 g/dL)<br />
Darbepoetin alfa<br />
CERA<br />
+3.8<br />
(NR)<br />
-0.5<br />
(NR)<br />
+7.5<br />
(NR)<br />
+11.2<br />
(NR)<br />
STUDY DESIGN CHANGE<br />
IN PRO<br />
Mean<br />
(SD)<br />
Revicki (1995) 7<br />
Energy/Vitality subscale of<br />
the SF-36<br />
N= 83<br />
Untreated N=40<br />
ESA treated N=43<br />
PRO FU= 48 weeks<br />
Treated<br />
(target Hct: 36 %<br />
Untreated<br />
+5.8<br />
(3.6) *<br />
-3.1<br />
(2.0)<br />
p< 0.001<br />
NR ***<br />
STAT<br />
SIG §<br />
p = 0.04<br />
NE No 11.6 (0.6) g/dL 13.5 g/dL 1.9 g/dL 2.0<br />
NE No 11.6 (0.6) g/dL 11.6 g/dL 0.0 g/dL NE<br />
NE Yes 10.2 (0.7) g/dL 12.2 g/dL 2.02 g/dL 3.7<br />
NE Yes 10.2 (0.6) g/dL 12.3 g/dL 2.12 g/dL 5.3<br />
EFFECT SIZE MCID BASELINE Hb<br />
OR HCT<br />
Hb OR<br />
Hct AT<br />
STUDY<br />
END<br />
CHANGE IN<br />
Hb OR HCT<br />
PER UNIT<br />
CHANGE IN<br />
ENERGY /<br />
VITALITY /<br />
ACTIVITY**<br />
1.90 (Large) Yes 26.8%(4.5) 31.5% 4.7 % (Hct) 1.2<br />
-0.84 (Large) No 26.8% (3.6) 25.8% -1.0 % (Hct) 3.1
Technical Appendix 1 – Evidence Tables Page 66<br />
Rossert (2006) 8<br />
Energy/Vitality subscale of<br />
the SF-36<br />
N= 224<br />
PRO FU=16 weeks<br />
Singh (2006) 3<br />
Energy/Vitality subscale of<br />
the SF-36<br />
N= 1432<br />
PRO FU= NR<br />
Singh (2006) 3<br />
LASA Activity Score<br />
N=1432<br />
PRO FU= NR<br />
High Hb Target<br />
(13.0 – 15.0 g/dL)<br />
Low Hb Target<br />
(11.0 – 12.0 g/dL)<br />
High Hb Target<br />
(13.5 g/dL)<br />
Low Hb Target<br />
(11.3 g/dL)<br />
High Hb Target<br />
(13.5 g/dL)<br />
Low Hb Target<br />
(11.3 g/dL)<br />
NR p = 0.04<br />
+10.0<br />
(22.6) *<br />
+8.2<br />
(22.4) *<br />
+15.0(39.<br />
9) *<br />
+13.3(29<br />
.8) *<br />
Open-label single-arm studies – Energy/Vitality/Activity<br />
Alexander (2007) 9<br />
Energy/Vitality subscale of<br />
the SF-36<br />
N= 48<br />
PRO FU=16 weeks<br />
Benz (2007) 10<br />
Energy/Vitality subscale of<br />
the SF-36<br />
N= 67<br />
PRO FU=16 weeks<br />
+14.9<br />
(3.2)<br />
+14.1<br />
(23.9)<br />
p = 0.6<br />
p
Technical Appendix 1 – Evidence Tables Page 67<br />
Benz (2007) 10<br />
LASA Activity Score<br />
N=67<br />
PRO FU=16 weeks<br />
+17.0(21.<br />
9)<br />
STUDY DESIGN CHANGE<br />
IN PRO<br />
Mean<br />
(SD)<br />
Benz (2007) 10<br />
LASA Energy Score<br />
N= 67<br />
PRO FU=16 weeks<br />
Provenzano (2004) 11<br />
LASA Activity Score<br />
N=1184<br />
PRO FU=16 weeks<br />
Provenzano (2004) 11<br />
LASA Energy Score<br />
N= 1184<br />
PRO FU=16 weeks<br />
Provenzano (2005) 12<br />
LASA Activity Score<br />
Parallel groups<br />
N= 519<br />
PRO FU=16 weeks<br />
Double-blind RCT – Physical Function<br />
DA (High Hb<br />
Pfeffer (2009) Target: 13 g/dL)<br />
2<br />
Subscale of the SF-36<br />
N= 4047<br />
PRO FU= 25 weeks<br />
Placebo<br />
+20.6<br />
(21.8)<br />
+24.5(24.<br />
9)<br />
+27.9<br />
(23.4)<br />
+5.4<br />
(22.3)<br />
p
Technical Appendix 1 – Evidence Tables Page 68<br />
Drueke (2006) 5<br />
Subscale of the SF-36<br />
N=603<br />
PRO FU=12 months<br />
MacDougall (2008) 6<br />
Subscale of the SF-36<br />
N=297<br />
PRO FU=29 weeks<br />
Revicki (1995) 7<br />
Subscale of the SF-36<br />
N=83; PRO FU 48 weeks<br />
Untreated N=40<br />
ESA treated N=43<br />
High Hb Target<br />
(13.0 – 15.0 g/dL)<br />
Low Hb Target<br />
(10.5 – 11.5 g/dL)<br />
DA<br />
CERA<br />
Treated<br />
(target Hct: 36 %<br />
+3.3 (NR) p
Technical Appendix 1 – Evidence Tables Page 69<br />
Abu-Alfa (2008) 14<br />
SF-36 Physical Composite<br />
Score<br />
N=277<br />
PRO FU=52 weeks<br />
Alexander (2007) 9<br />
Subscale of the SF-36<br />
N=48<br />
PRO FU=16 weeks<br />
Benz (2007) 10<br />
Subscale of the SF-36<br />
N=67<br />
PRO FU=16 weeks<br />
Islam (2005) 15<br />
Nottingham Scale<br />
N=45<br />
PRO FU=6 months<br />
Kleinman (1989) 16<br />
Single item VAS<br />
N=14<br />
PRO FU=12 weeks<br />
Single arm +3.3 (8.7) P
Technical Appendix 1 – Evidence Tables Page 70<br />
** Change in PRO divided by change in Hb (or change in Hematocrit)<br />
***The US Recombinant Human Erythropoietin Predialysis Study Group (1991) randomized patients to one of four treatment groups, including placebo. Quality of life results were reported<br />
by two groups, anemia corrected and anemia not corrected.<br />
****The US Recombinant Human Erythropoietin Predialysis Study Group (1991) reports the percent of patients in each arm showing at least 6% change in hematocrit.<br />
***** Kleinman (1989) reports “quality of life improvement” in treated patients, but not in patients in placebo group.<br />
These evidence tables include the most commonly cited references; a systematic review was not conducted.<br />
1. Kleinman KS, Schweitzer SU, Perdue ST, Bleifer KH and Abels RI: The use of recombinant human erythropoietin in the correction of anemia in predialysis patients<br />
and its effect on renal function: a double-blind, placebo-controlled trial. Am J Kidney Dis. 1989;14: 486-495.<br />
2. Pfeffer MA, Burdmann EA, Chen CY, et al.: A trial of darbepoetin alfa in type 2 diabetes and chronic kidney disease. The New England journal of medicine.<br />
2009;361: 2019-2032.<br />
3. Singh AK, Szczech L, Tang KL, et al.: Correction of anemia with epoetin alfa in chronic kidney disease. N Engl J Med. 2006;355: 2085-2098.<br />
4. The US Recombinant Human Erythropoietin Predialysis Study Group. Double-blind, placebo-controlled study of the therapeutic use of recombinant human<br />
erythropoietin for anemia associated with chronic renal failure in predialysis patients. Am J Kidney Dis. 1991;18: 50-59.<br />
5. Drueke TB, Locatelli F, Clyne N, et al.: Normalization of hemoglobin level in patients with chronic kidney disease and anemia. N Engl J Med. 2006;355: 2071-2084.<br />
6. Macdougall IC, Walker R, Provenzano R, et al.: C.E.R.A. corrects anemia in patients with chronic kidney disease not on dialysis: results of a randomized clinical<br />
trial. Clin J Am Soc Nephrol. 2008;3: 337-347.<br />
7. Revicki DA, Brown RE, Feeny DH, et al.: Health-related quality of life associated with recombinant human erythropoietin therapy for predialysis chronic renal<br />
disease patients. Am J Kidney Dis. 1995;25: 548-554.<br />
8. Rossert J, Levin A, Roger SD, et al.: Effect of early correction of anemia on the progression of CKD. Am J Kidney Dis. 2006;47: 738-750.<br />
9. Alexander M, Kewalramani R, Agodoa I and Globe D: Association of anemia correction with health related quality of life in patients not on dialysis. Curr Med Res<br />
Opin. 2007;23: 2997-3008.<br />
10. Benz R, Schmidt R, Kelly K and Wolfson M: Epoetin alfa once every 2 weeks is effective for initiation of treatment of anemia of chronic kidney disease. Clin J Am<br />
Soc Nephrol. 2007;2: 215-221. .<br />
11. Provenzano R, Garcia-Mayol L, Suchinda P, et al.: Once-weekly epoetin alfa for treating the anemia of chronic kidney disease. Clin Nephrol. 2004;61: 392-405.<br />
12. Provenzano R, Bhaduri S and Singh AK: Extended epoetin alfa dosing as maintenance treatment for the anemia of chronic kidney disease: the PROMPT study.<br />
Clinical nephrology. 2005;64: 113-123.<br />
13. Roger SD, McMahon LP, Clarkson A, et al.: Effects of early and late intervention with epoetin alpha on left ventricular mass among patients with chronic kidney<br />
disease (stage 3 or 4): results of a randomized clinical trial. J Am Soc Nephrol. 2004;15: 148-156.<br />
14. Abu-Alfa AK, Sloan L, Charytan C, et al.: The association of darbepoetin alfa with hemoglobin and health-related quality of life in patients with chronic kidney<br />
disease not receiving dialysis. Curr Med Res Opin. 2008;24: 1091-1100.<br />
15. Islam S, Rahman H and Rashid HU: Effect rHuEpo on predialysis CRF patients: study of 45 cases. Bangladesh Medical Research Council bulletin. 2005;31: 83-<br />
87.<br />
16. Kleinman KS, Schweitzer SU, Perdue ST, Bleifer KH and Abels RI: The use of recombinant human erythropoietin in the correction of anemia in predialysis patients<br />
and its effect on renal function: a double-blind, placebo-controlled trial. Am J Kidney Dis. 1989;14: 486-495.
Technical Appendix 2 – Literature References Page 71<br />
Technical Appendix 2 – Literature References
584<br />
·<br />
August 27, 1998<br />
The New England Journal of Medicine<br />
THE EFFECTS OF NORMAL AS COMPARED WITH LOW HEMATOCRIT VALUES<br />
IN PATIENTS WITH CARDIAC DISEASE WHO ARE RECEIVING HEMODIALYSIS<br />
AND EPOETIN<br />
ALLEN<br />
ANATOLE<br />
BESARAB,<br />
M.D., W. KLINE<br />
BOLTON,<br />
M.D., J<br />
R. NISSENSON,<br />
M.D., DOUGLAS<br />
M. OKAMOTO,<br />
PH.D.,<br />
S<br />
ABSTRACT<br />
Background In patients with end-stage renal disease,<br />
anemia develops as a result of erythropoietin<br />
deficiency, and recombinant human erythropoietin<br />
(epoetin) is prescribed to correct the anemia partially.<br />
We examined the risks and benefits of normalizing<br />
the hematocrit in patients with cardiac disease<br />
who were undergoing hemodialysis.<br />
Methods We studied 1233 patients with clinical evidence<br />
of congestive heart failure or ischemic heart<br />
disease who were undergoing hemodialysis: 618 patients<br />
were assigned to receive increasing doses of<br />
epoetin to achieve and maintain a hematocrit of 42<br />
percent, and 615 were assigned to receive doses of<br />
epoetin sufficient to maintain a hematocrit of 30 percent<br />
throughout the study. The median duration of<br />
treatment was 14 months. The primary end point was<br />
the length of time to death or a first nonfatal myocardial<br />
infarction.<br />
Results After 29 months, there were 183 deaths<br />
and 19 first nonfatal myocardial infarctions among<br />
the patients in the normal-hematocrit group and 150<br />
deaths and 14 nonfatal myocardial infarctions among<br />
those in the low-hematocrit group (risk ratio for the<br />
normal-hematocrit group as compared with the lowhematocrit<br />
group, 1.3; 95 percent confidence interval,<br />
0.9 to 1.9). Although the difference in event-free<br />
survival between the two groups did not reach the<br />
prespecified statistical stopping boundary, the study<br />
was halted. The causes of death in the two groups<br />
were similar. The mortality rates decreased with increasing<br />
hematocrit values in both groups. The patients<br />
in the normal-hematocrit group had a decline<br />
in the adequacy of dialysis and received intravenous<br />
iron dextran more often than those in the low-hematocrit<br />
group.<br />
Conclusions In patients with clinically evident<br />
congestive heart failure or ischemic heart disease<br />
who are receiving hemodialysis, administration of<br />
epoetin to raise their hematocrit to 42 percent is not<br />
recommended. (N Engl J Med 1998;339:584-90.)<br />
©1998, Massachusetts Medical Society.<br />
ADVANCED kidney failure usually leads to<br />
anemia, primarily as a result of deficient<br />
renal erythropoietin production. Most patients<br />
undergoing hemodialysis are treated<br />
with recombinant human erythropoietin (epoetin)<br />
to stimulate erythropoiesis and correct the anemia<br />
partially. In a random sample of 940 patients at 188<br />
U.S. hemodialysis centers obtained before the initi-<br />
EFFREY<br />
TEVE<br />
K. BROWNE,<br />
PH.D.,<br />
J<br />
J. SCHWAB,<br />
M.D.,<br />
AND<br />
OAN<br />
C. EGRIE<br />
DAVID<br />
, PH.D.,<br />
A. GOODKIN,<br />
M.D.<br />
ation of this study, we found that 69 percent of the<br />
patients had hematocrits of 27 to 33 percent, 15<br />
percent had values below 27 percent, and 16 percent<br />
had values above 33 percent (unpublished data). Yet<br />
the normal ranges for hematocrit values are 37 to 48<br />
percent for women and 42 to 52 percent for men,<br />
prompting the question of whether increasing the<br />
doses of epoetin would benefit patients who are<br />
undergoing hemodialysis. Cerebral oxygen delivery<br />
among patients with ischemic cerebrovascular disease,<br />
for example, is maximal when the hematocrit is<br />
40 to 45 percent. 2<br />
Cardiac disease is the most common cause of death<br />
among patients who are regularly receiving dialysis. 3<br />
Among these patients, partial correction of anemia<br />
reduces exercise-induced cardiac ischemia4,5<br />
and ameliorates<br />
the left ventricular hypertrophy4,6-9<br />
that predisposes<br />
patients to death and cardiac-related morbidity.<br />
10-12 In two pilot studies of patients who were<br />
receiving hemodialysis who maintained a normal hem-<br />
atocrit value<br />
13<br />
(and unpublished data), there were no<br />
increases in blood pressure, thrombosis of the vascular<br />
access site, seizures, or cardiovascular events, and<br />
normal hematocrit values were associated with an<br />
improved quality of life, shorter hospitalizations, and<br />
increased exercise performance. The present trial was<br />
designed to examine the benefits and risks of a normal<br />
hematocrit in a large group of patients with cardiac<br />
disease who were undergoing hemodialysis.<br />
METHODS<br />
Study Subjects<br />
In this randomized, prospective, open-label trial, we studied<br />
1233 patients with congestive heart failure or ischemic heart disease<br />
who were undergoing hemodialysis at 51 centers (see the Appendix).<br />
The institutional review boards at all centers approved the<br />
protocol, and all the patients gave written, informed consent. All<br />
the patients had end-stage renal disease and were undergoing longterm<br />
hemodialysis, and they had hematocrit values of 27 to 33<br />
percent while receiving epoetin during the four weeks before enrollment.<br />
Ninety percent of the patients received epoetin intrave-<br />
From the Division of Nephrology and Hypertension, Henry Ford Hospital,<br />
Detroit (A.B.); the Department of Internal Medicine, Division of Nephrology,<br />
University of Virginia Health Sciences Center, Charlottesville<br />
(W.K.B.); <strong>Amgen</strong>, Thousand Oaks, Calif. (J.K.B., J.C.E., D.M.O., D.A.G.);<br />
the Department of Medicine, Division of Nephrology, University of California<br />
at Los Angeles, Los Angeles (A.R.N.); and the Department of Medicine,<br />
Nephrology Division, Duke University Medical Center, Durham,<br />
N.C. (S.J.S.). Address reprint requests to Dr. Goodkin at Clinical Research,<br />
<strong>Amgen</strong>, 1 <strong>Amgen</strong> Center Dr., Thousand Oaks, CA 91320.<br />
Downloaded from www.nejm.org at <strong>Amgen</strong>, Inc. on September 2, 2008 .<br />
Copyright © 1998 Massachusetts Medical Society. All rights reserved.<br />
Page 72<br />
1
NORMAL VS. LOW HEMATOCRIT IN PATIENTS WITH CARDIAC DISEASE RECEIVING HEMODIALYSIS AND EPOETIN<br />
nously, and 88 percent received it three times per week. According<br />
to the protocol, all patients had to have documented congestive<br />
heart failure (defined as the need for hospitalization or nonroutine<br />
ultrafiltration for congestive heart failure in the preceding two<br />
years) or ischemic heart disease (defined as angina pectoris requiring<br />
medication in the preceding two years, coronary artery disease<br />
documented by cardiac catheterization, or prior myocardial infarction)<br />
and a serum transferrin saturation of 20 percent or higher.<br />
Exclusion criteria included a diastolic blood pressure of 100 mm<br />
Hg or more; a life expectancy of less than six months; severe cardiac<br />
disability (New York Heart Association class IV); myocardial<br />
infarction, percutaneous transluminal coronary angioplasty, or coronary-artery<br />
bypass grafting in the three months before the study<br />
began; pericardial disease; cardiac valvular disease likely to require<br />
surgery; cardiac amyloidosis; and androgen therapy.<br />
Study Protocol<br />
The patients were randomly assigned to one of two groups.<br />
One was a normal-hematocrit group, in which the patients received<br />
increasing doses of epoetin alfa (Epogen, <strong>Amgen</strong>, Thousand<br />
Oaks, Calif.) to achieve and maintain hematocrit values of<br />
42 percent (±3 percentage points). The other was a low-hematocrit<br />
group, in which the patients received doses of epoetin sufficient<br />
to maintain the hematocrit at 30 percent (±3 percentage<br />
points). The planned duration of the study was three years after<br />
the enrollment of the last patient. The epoetin was administered<br />
intravenously or subcutaneously, according to the route of administration<br />
at base line, and at the same frequency per week as<br />
before the study. In the normal-hematocrit group, the dose was<br />
increased by a factor of 1.5 on study entry. Subsequently, doses<br />
were increased by 25 percent of the base-line dose if the hematocrit<br />
had not increased by at least 2 percentage points during the<br />
preceding two weeks. If the hematocrit increased by more than<br />
4 percentage points in a two-week period, the dose was reduced<br />
by 25 U per kilogram of body weight. Iron status (as determined<br />
by the serum transferrin saturation and serum ferritin concentration)<br />
was reevaluated in patients who had no responses to increases<br />
in the dose of epoetin. In the low-hematocrit group, the dose<br />
was adjusted by 10 to 25 U per kilogram at two-week intervals,<br />
when needed, to maintain a hematocrit of 30 percent. To avoid<br />
spuriously elevated hematocrit values that result from swelling of<br />
red cells during transport to the central laboratory, we calculated<br />
the hematocrit values (in percentage points) by multiplying the<br />
hemoglobin concentrations (in grams per deciliter) by 3, and all<br />
hematocrit values after randomization are expressed in this way.<br />
Evaluations<br />
All adverse events, hospitalizations, coronary-artery bypass graft<br />
or percutaneous transluminal coronary angioplasty procedures,<br />
thromboses at vascular access sites or any change or procedure involving<br />
a vascular access site, transfusions, and deaths were recorded.<br />
Serial records were kept of the patients’ hemodialysis regimens;<br />
blood pressure; hematologic, chemical, and coagulation<br />
profiles; serum transferrin saturation; and concomitant drug therapy.<br />
We also recorded Kt/V, a unitless measure of the adequacy<br />
of hemodialysis therapy, where K is the rate of urea clearance by<br />
the artificial kidney, t is the duration of each hemodialysis session,<br />
V is the volume of distribution of urea within the patient, and<br />
1.20 is considered to be the minimal recommended value, although<br />
the measurement technique varied among the centers and<br />
was estimated from the urea reduction ratio for the small number<br />
of patients treated at centers that did not calculate Kt/V. Blood<br />
specimens for laboratory analyses were drawn just before hemodialysis.<br />
Quality of life was assessed at base line and every six<br />
months thereafter with the 36-item Medical Outcomes Study<br />
Short-Form Health Survey, 14 which evaluates eight health-related<br />
aspects: physical function, social function, physical role, emotional<br />
role, mental health, energy, pain, and general health perceptions.<br />
Each portion of the test is scored on a scale that ranges<br />
from 0 (severe limitation) to 100 (no limitation).<br />
The primary end point was the length of time to death or a<br />
first nonfatal myocardial infarction. A myocardial infarction was<br />
considered to be fatal if death occurred within 24 hours after the<br />
infarction; the event was then counted as a death in tabulating the<br />
primary end point. Three criteria were required for the diagnosis<br />
of myocardial infarction: clinical suspicion of acute myocardial infarction,<br />
a peak serum creatine kinase concentration that was<br />
more than 1.5 times the upper limit of the normal range, and a<br />
high fraction of creatine kinase MB. Secondary end points were<br />
congestive heart failure requiring hospitalization, angina pectoris<br />
requiring hospitalization, coronary-artery bypass grafting, percutaneous<br />
transluminal coronary angioplasty, hospitalization for all<br />
causes, change in cardiovascular drugs, red-cell transfusion, and<br />
changes in the quality-of-life scores.<br />
Statistical Analysis<br />
We estimated that 1000 patients were required to provide the<br />
study with a power of 90 percent to detect a 20 percent difference<br />
in primary event-free survival after three years at an overall<br />
a level of 0.05 for two-sided tests, for a risk ratio of 1.3 with the<br />
log-rank test used to compare Kaplan–Meier curves. We used a<br />
Lan–DeMets procedure for group-sequential testing with an<br />
O’Brien–Fleming boundary. 15 The trial was stopped at the third<br />
interim analysis. We report the risk ratio, with 95 percent confidence<br />
intervals adjusted for the previous interim analyses, using<br />
the method of repeated confidence intervals. 16 Analyses were conducted<br />
on an intention-to-treat basis (data on patients who discontinued<br />
the study regimen, switched to peritoneal dialysis, underwent<br />
kidney transplantation, or died before receiving study<br />
medication were included). We compared the adjusted event-free<br />
times to death or myocardial infarction using Cox proportionalhazards<br />
regression analysis with 11 prespecified covariates. 17 We<br />
also assessed mortality using one prospectively defined subgroup<br />
analysis that excluded patients in the normal-hematocrit group<br />
who did not attain the target hematocrit value. Cumulative incidences<br />
were calculated for other secondary end points.<br />
RESULTS<br />
A total of 1233 patients were enrolled between<br />
October 27, 1993, and March 31, 1996; 618 were<br />
assigned to the normal-hematocrit group, and 615<br />
to the low-hematocrit group. The study period ranged<br />
from 4 days to 30 months (median, 14 months).<br />
Concern about safety at the third interim analysis<br />
prompted the independent data monitoring committee<br />
to recommend that the study be stopped.<br />
The interim results of the study did not reach the<br />
prespecified stopping boundary corresponding to an<br />
overall 5 percent level of significance, complicating<br />
the reporting and interpretation of P values.<br />
The base-line characteristics of the two groups,<br />
including the mean hematocrit values and mean epoetin<br />
doses, were similar (Table 1). By six months the<br />
mean hematocrit in the normal-hematocrit group<br />
had increased to the target range. To maintain their<br />
hematocrit values in the target range these patients<br />
required approximately three times as much epoetin<br />
as before the study (Fig. 1). Although the mean<br />
hematocrit values were stable in the low-hematocrit<br />
group throughout the study and in the normalhematocrit<br />
group after six months, the values varied<br />
considerably in individual patients, often in association<br />
with intercurrent illnesses.<br />
The probability of the primary end point (death<br />
Downloaded from www.nejm.org at <strong>Amgen</strong>, Inc. on September 2, 2008 .<br />
Copyright © 1998 Massachusetts Medical Society. All rights reserved.<br />
Volume 339 Number 9<br />
Page 73<br />
·<br />
585
or a first nonfatal myocardial infarction) is shown in<br />
Figure 2. After 29 months, there were 183 deaths<br />
and 19 first nonfatal myocardial infarctions among<br />
the patients in the normal-hematocrit group and<br />
150 deaths and 14 nonfatal myocardial infarctions<br />
among the patients in the low-hematocrit group<br />
(risk ratio for the normal-hematocrit group as compared<br />
with the low-hematocrit group, 1.3; 95 percent<br />
confidence interval, 0.9 to 1.9). Increasing age,<br />
the presence of peripheral vascular disease, New<br />
York Heart Association class III cardiac disability,<br />
and the absence of hypertension at base line were<br />
significant risk factors for death or a first nonfatal<br />
myocardial infarction for both groups combined,<br />
whereas sex, race, the type of vascular access, Kt/V,<br />
and the presence of congestive heart failure, ischemic<br />
heart disease, and diabetes mellitus were not. These<br />
11 prespecified base-line characteristics do not explain<br />
the differences in outcomes in the two groups, because<br />
adjustment for these factors did not change<br />
the risk ratio for the normal-hematocrit group as<br />
586<br />
TABLE<br />
1. BASE-LINE<br />
CHARACTERISTICS<br />
OF THE PATIENTS.*<br />
CHARACTERISTIC<br />
·<br />
August 27, 1998<br />
The New England Journal of Medicine<br />
NORMAL-<br />
HEMATOCRIT<br />
GROUP<br />
(N=618)<br />
LOW-<br />
HEMATOCRIT<br />
GROUP<br />
(N=615)<br />
Age (yr)<br />
65±12 64±12<br />
35<br />
Female sex (%)<br />
Race or ethnic group (%)<br />
50<br />
52<br />
White<br />
Black<br />
45<br />
41<br />
42<br />
44<br />
30<br />
Low-hematocrit group<br />
Hispanic<br />
8<br />
9<br />
Other<br />
6<br />
5<br />
Duration of dialysis (yr)<br />
Cause of renal failure (%)<br />
3.2±3.6 3.1±3.3<br />
25<br />
Diabetes mellitus<br />
Hypertension<br />
42<br />
28<br />
46<br />
27<br />
0 10<br />
20<br />
30<br />
Glomerulonephritis<br />
Other<br />
7<br />
23<br />
8<br />
19<br />
700<br />
Type of vascular access (%)<br />
Graft<br />
66<br />
67<br />
600<br />
Natural fistula<br />
23<br />
23<br />
Catheter<br />
10<br />
10<br />
500<br />
Not specified<br />
2<br />
0<br />
Hypertension (%)<br />
Diabetes mellitus (%)<br />
71<br />
54<br />
69<br />
58<br />
400<br />
Normal-hematocrit group<br />
Peripheral vascular disease (%)<br />
Cardiac-related hospitalization (%)<br />
39 38<br />
300<br />
Angina pectoris<br />
32<br />
28†<br />
Congestive heart failure<br />
Myocardial infarction<br />
44<br />
25<br />
47<br />
23<br />
200<br />
Coronary-artery bypass graft<br />
Percutaneous transluminal coronary<br />
angioplasty<br />
20<br />
10<br />
19<br />
9<br />
100<br />
Low-hematocrit group<br />
New York Heart Association class (%)<br />
0<br />
I<br />
II<br />
29<br />
51<br />
31<br />
52<br />
0 10 20<br />
30<br />
III<br />
Hematocrit (%)<br />
19<br />
30.5±3.0<br />
15<br />
30.5±2.9<br />
Months<br />
Epoetin dose (U/kg/wk) 146±103 153±119 Figure 1. Mean Monthly Hematocrit Values and Epoetin Doses<br />
*Plus–minus values are means ±SD. Because of rounding, not all percentages<br />
total 100.<br />
†P=0.04.<br />
during the Study in the Normal-Hematocrit and Low-Hematocrit<br />
Groups.<br />
Both the mean hematocrit values and the mean doses were<br />
significantly different between the two groups from one month<br />
onward (P
NORMAL VS. LOW HEMATOCRIT IN PATIENTS WITH CARDIAC DISEASE RECEIVING HEMODIALYSIS AND EPOETIN<br />
Probability of Death or<br />
Myocardial Infarction (%)<br />
NO. AT RISK<br />
Normal hematocrit<br />
Low hematocrit<br />
Figure 2. Kaplan–Meier Estimates of the Probability of Death or a First Nonfatal Myocardial Infarction<br />
in the Normal-Hematocrit and Low-Hematocrit Groups.<br />
ing hospitalization, congestive heart failure requiring<br />
hospitalization, coronary-artery bypass grafting,<br />
or percutaneous transluminal coronary angioplasty<br />
(Table 3). During the study, 129 patients in the<br />
normal-hematocrit group (21 percent) received redcell<br />
transfusions, as compared with 192 patients in<br />
the low-hematocrit group (31 percent) (P
CAUSE<br />
OF DEATH<br />
*Because of rounding, percentages do not total 100.<br />
March 31, 1996, decreased at higher hematocrit values,<br />
but the mortality rate in the normal-hematocrit<br />
group was higher than that in the low-hematocrit<br />
group for any given range of hematocrit values (Fig.<br />
3). When the average hematocrit replaced group assignment<br />
in the Cox regression analysis of the pre-<br />
588<br />
·<br />
TABLE<br />
2. CAUSES<br />
OF DEATH.*<br />
August 27, 1998<br />
The New England Journal of Medicine<br />
NORMAL-<br />
HEMATOCRIT<br />
GROUP<br />
(N=195)<br />
no. (%)<br />
LOW-<br />
HEMATOCRIT<br />
GROUP<br />
(N=160)<br />
Cardiovascular causes<br />
125 (64) 112 (70)<br />
Cardiac arrest 30 (15) 24 (15)<br />
Acute myocardial infarction 22 (11) 28 (18)<br />
Arrhythmia 19 (10) 14 (9)<br />
Unwitnessed death 18 (9) 9 (6)<br />
Cerebrovascular accident 14 (7) 9 (6)<br />
Coronary artery disease 6 (3) 7 (4)<br />
Cardiomyopathy 5 (3) 6 (4)<br />
Ischemic bowel 3 (2) 2 (1)<br />
Congestive heart failure 2 (1) 2 (1)<br />
Valvular heart disease 1 (1) 3 (2)<br />
Cardiogenic shock 1 (1) 0<br />
Other 4 (2) 8 (5)<br />
Noncardiovascular causes<br />
70 (36) 48 (30)<br />
Sepsis or infection 32 (16) 22 (14)<br />
Voluntary withdrawal from dialysis 11 (6) 7 (4)<br />
Cancer 4 (2) 3 (2)<br />
Hemorrhage 4 (2) 2 (1)<br />
Encephalopathy 3 (2) 2 (1)<br />
Hyperkalemia 3 (2) 2 (1)<br />
Hepatic failure 0 3 (2)<br />
Other 13 (7) 7 (4)<br />
TABLE<br />
3. INCIDENCE<br />
OF SEVEN<br />
SECONDARY<br />
END<br />
POINTS.<br />
END<br />
POINT<br />
NORMAL-<br />
HEMATOCRIT<br />
GROUP<br />
(N=618)<br />
no. (%)<br />
LOW-<br />
HEMATOCRIT<br />
GROUP<br />
(N=615)<br />
*The P values were calculated with Fisher’s exact test.<br />
P<br />
VALUE*<br />
Red-cell transfusion 129 (21) 192 (31)
NORMAL VS. LOW HEMATOCRIT IN PATIENTS WITH CARDIAC DISEASE RECEIVING HEMODIALYSIS AND EPOETIN<br />
who survived received an average of 152±150 mg of<br />
iron dextran per four-week period and those who<br />
died received an average of 214±190 mg per fourweek<br />
period (P
590 · August 27, 1998<br />
APPENDIX<br />
The following principal investigators participated in the study: M. Allon,<br />
Birmingham, Ala.; G. Appel, New York; R. Benz, Wynnewood, Pa.; J.<br />
Berns, Philadelphia; K. Bleifer, Van Nuys, Calif.; J. Bower, Jackson, Miss.;<br />
W. Cleveland, Atlanta; I. Cruz, Washington, D.C.; D. Domoto, St. Louis;<br />
S. Fishbane, Mineola, N.Y.; D. Gentile, Orange, Calif.; L. Glowacki, Dallas;<br />
J. Goldman, Philadelphia; J. Hertel, Augusta, Ga.; D. Hoffman, Miami; H.<br />
Karp, Somers Point, N.J.; C. Kaupke, Orange, Calif.; K. Kleinman, Tarzana,<br />
Calif.; S. Korbet, Chicago; A. Lauer, Brockton, Mass.; V. Lim, Iowa<br />
City, Iowa; J. Lindberg, New Orleans; M. Linsey, Pasadena, Calif.; J. Mac-<br />
Laurin, Columbus, Ohio; T. Marbury, Orlando, Fla.; S. Mischel, Hammond,<br />
Ind.; D. Molony, Houston; J. Navarro, Tampa, Fla.; E. Paganini,<br />
Cleveland; D. Price, Boston; R. Raja, Philadelphia; J. Reiter, Missoula,<br />
Mont.; J. Rimmer, Burlington, Vt.; P. Schoenfeld, San Francisco; W. Smith,<br />
New Orleans; D. Spiegal, Denver; M. Stegman, Memphis, Tenn.; K. Stenzel,<br />
New York; J. Sugihara, Honolulu; G. Ting, Mountain View, Calif.; N.<br />
Vaziri, Orange, Calif.; M. Walczyk, Portland, Oreg.; D. Van Wyck, Tucson,<br />
Ariz.; S. Wen, Madison, Wis.; B. Wilkes, Manhasset, N.Y.; M. Weiner, Lancaster,<br />
Pa.; and B. Wood, Kansas City, Mo. Data monitoring committee:<br />
P. Parfrey (chairman), St. John’s, Newf., Canada; W. Bennett, Portland,<br />
Oreg.; T. Fleming, Seattle; D. Levy, Framingham, Mass.; N. Muirhead,<br />
London, Ont., Canada; M. Pfeffer, Boston; C. Winearls, Oxford, England.<br />
REFERENCES<br />
1. Case Records of the Massachusetts General Hospital: normal reference<br />
laboratory values. N Engl J Med 1992;327:718-24.<br />
2. Kusunoki M, Kimura K, Nakamura M, Isaka Y, Yoneda S, Abe H. Effects<br />
of hematocrit variations on cerebral blood flow and oxygen transport<br />
in ischemic cerebrovascular disease. J Cereb Blood Flow Metab 1981;1:<br />
413-7.<br />
3. Rostand SG, Rutsky EA. Cardiac disease in dialysis patients. In: Nissenson<br />
AR, Fine RN, Gentile DE, eds. Clinical dialysis. 2nd ed. Norwalk,<br />
Conn.: Appleton & Lange, 1990:409-46.<br />
4. Macdougall IC, Lewis NP, Saunders MJ, et al. Long-term cardiorespiratory<br />
effects of amelioration of renal anaemia by erythropoietin. Lancet<br />
1990;335:489-93. [Erratum, Lancet 1990;335:614.]<br />
5. Wizemann V, Kaufmann J, Kramer W. Effect of erythropoietin on ischemia<br />
tolerance in anemic hemodialysis patients with confirmed coronary<br />
artery disease. Nephron 1992;62:161-5.<br />
6. Cannella G, La Canna G, Sandrini M, et al. Reversal of left ventricular<br />
hypertrophy following recombinant human erythropoietin treatment of<br />
anaemic dialysed uraemic patients. Nephrol Dial Transplant 1991;6:31-7.<br />
7. Pascual J, Teruel JL, Moya JL, Liano F, Jimenez-Mena M, Ortuno J.<br />
Regression of left ventricular hypertrophy after partial correction of anemia<br />
with erythropoietin in patients on hemodialysis: a prospective study. Clin<br />
Nephrol 1991;35:280-7.<br />
8. Goldberg N, Lundin AP, Delano B, Friedman EA, Stein RA. Changes<br />
in left ventricular size, wall thickness, and function in anemic patients treated<br />
with recombinant human erythropoietin. Am Heart J 1992;124:424-<br />
7.<br />
9. Zehnder C, Zuber M, Sulzer M, et al. Influence of long-term amelioration<br />
of anemia and blood pressure control on left ventricular hypertrophy<br />
in hemodialyzed patients. Nephron 1992;61:21-5.<br />
10. Silberberg JS, Barre PE, Prichard SS, Sniderman AD. Impact of left<br />
ventricular hypertrophy on survival in end-stage renal disease. Kidney Int<br />
1989;36:286-90.<br />
11. Parfrey PS, Griffiths SM, Harnett JD, et al. Outcome of congestive<br />
heart failure, dilated cardiomyopathy, hypertrophic hyperkinetic disease,<br />
and ischemic heart disease in dialysis patients. Am J Nephrol 1990;10:213-<br />
21.<br />
12. Parfrey PS, Harnett JD, Barre PE. The natural history of myocardial<br />
disease in dialysis patients. J Am Soc Nephrol 1991;2:2-12.<br />
13. Eschbach JW, Glenny R, Robertson T, et al. Normalizing the hematocrit<br />
(HCT) in hemodialysis patients (HDP) with EPO improves quality<br />
of life (Q/L) and is safe. J Am Soc Nephrol 1993;4:425. abstract.<br />
14. McHorney CA, Ware JE Jr, Raczek AE. The MOS 36-Item Short-<br />
Form Health Survey (SF-36). II. Psychometric and clinical tests of validity<br />
in measuring physical and mental health constructs. Med Care 1993;31:<br />
247-63.<br />
The New England Journal of Medicine<br />
15. Lan KKG, DeMets DL. Discrete sequential boundaries for clinical trials.<br />
Biometrika 1983;70:659-63.<br />
16. Jennison C, Turnbull BW. Statistical approaches in interim monitoring<br />
of medical trials: a review and commentary. Stat Sci 1990;5:299-317.<br />
17. Cox DR. Regression models and life-tables. J R Stat Soc [B] 1972;34:<br />
187-220.<br />
18. Eschbach JW, Abdulhadi MH, Browne JK, et al. Recombinant human<br />
erythropoietin in anemic patients with end-stage renal disease: results of a<br />
phase III multicenter clinical trial. Ann Intern Med 1989;111:992-1000.<br />
19. Evans RW, Rader B, Manninen DL, Cooperative Multicenter EPO<br />
Clinical Trial Group. The quality of life of hemodialysis recipients treated<br />
with recombinant human erythropoietin. JAMA 1990;263:825-30.<br />
20. Beusterien KM, Nissenson AR, Port FK, Kelly M, Steinwald B, Ware<br />
JE Jr. The effects of recombinant human erythropoietin on functional<br />
health and well-being in chronic dialysis patients. J Am Soc Nephrol 1996;<br />
7:763-73.<br />
21. Marsh JT, Brown WS, Wolcott D, et al. rHuEPO treatment improves<br />
brain and cognitive function of anemic dialysis patients. Kidney Int 1991;<br />
39:155-63.<br />
22. Lundin AP, Akerman MJ, Chesler RM, et al. Exercise in hemodialysis<br />
patients after treatment with recombinant human erythropoietin. Nephron<br />
1991;58:315-9.<br />
23. Braumann KM, Nonnast-Daniel B, Böning D, Böcker A, Frei U. Improved<br />
physical performance after treatment of renal anemia with recombinant<br />
human erythropoietin. Nephron 1991;58:129-34.<br />
24. Veys N, Vanholder R, Ringoir S. Correction of deficient phagocytosis<br />
during erythropoietin treatment in maintenance hemodialysis patients. Am<br />
J Kidney Dis 1992;19:358-63.<br />
25. Sennesael JJ, Van der Niepen P, Verbeelen DL. Treatment with recombinant<br />
human erythropoietin increases antibody titers after hepatitis B vaccination<br />
in dialysis patients. Kidney Int 1991;40:121-8.<br />
26. Collins A, Ma J, Umen A. Hematocrit as a time-dependent risk factor.<br />
J Am Soc Nephrol 1994;5:439. abstract.<br />
27. Lowrie EG, Ling J, Lew NL. The anemia of ESRD and related<br />
thoughts about iron and EPO therapy. Waltham, Mass.: National Medical<br />
Care, August 10, 1995 (memorandum).<br />
28. Canadian Erythropoietin Study Group. Association between recombinant<br />
human erythropoietin and quality of life and exercise capacity of patients<br />
receiving haemodialysis. BMJ 1990;300:573-8.<br />
29. Eschbach JW. Erythropoietin is not a cause of access thrombosis. Semin<br />
Dial 1993;6:180-4.<br />
30. Muirhead N. Erythropoietin is a cause of access thrombosis. Semin<br />
Dial 1993;6:184-8.<br />
31. Nissenson AR, Pickett JL, Theberge DC, Brown WS, Schweitzer SV.<br />
Brain function is better in hemodialysis (HD) patients (PTS) when hematocrit<br />
is normalized with erythropoietin (rHuEPO). J Am Soc Nephrol<br />
1996;7:1459. abstract.<br />
32. Bárány P, Svendenhag J, Katzarski K, et al. Physiological effects of correcting<br />
anemia in hemodialysis patients (HD pts) to a normal HB. J Am<br />
Soc Nephrol 1996;7:1472. abstract.<br />
33. Benz RL, Pressman MR, Hovick ET, Peterson DD. Relationship between<br />
anemia of chronic renal failure (ACRF) and sleep, sleep disorders<br />
and daytime alertness: benefits of normalizing hematocrit (the Sleepo Trial).<br />
J Am Soc Nephrol 1996;7:1473. abstract.<br />
34. Renal Data System. USRDS 1996 annual data report. Bethesda, Md.:<br />
National Institute of Diabetes and Digestive and Kidney Diseases, April<br />
1996:23.<br />
35. Salonen JT, Nyyssonen K, Korpela H, Tuomilehto J, Seppanen R, Salonen<br />
R. High stored iron levels are associated with excess risk of myocardial<br />
infarction in eastern Finnish men. Circulation 1992;86:803-11.<br />
36. Sullivan JL. Iron and the sex difference in heart disease risk. Lancet<br />
1981;1:1293-4.<br />
37. Tielemans CL, Lenclud CM, Wens R, Collart FE, Dratwa M. Critical<br />
role of iron overload in the increased susceptibility of haemodialysis patients<br />
to bacterial infections: beneficial effects of desferrioxamine. Nephrol<br />
Dial Transplant 1989;4:883-7.<br />
38. Hoen B, Kessler M, Hestin D, Mayeux D. Risk factors for bacterial<br />
infections in chronic haemodialysis adult patients: a multicentre prospective<br />
survey. Nephrol Dial Transplant 1995;10:377-81.<br />
39. Collins A, Ebben J, Ma J. Frequent IV iron dosing is associated with<br />
higher infectious deaths. J Am Soc Nephrol 1997;8:190A. abstract.<br />
Downloaded from www.nejm.org at <strong>Amgen</strong>, Inc. on September 2, 2008 .<br />
Copyright © 1998 Massachusetts Medical Society. All rights reserved.<br />
Page 78
Members of the Canadian<br />
Erythropoietin Study Group<br />
are given at the end of this<br />
paper.<br />
Correspondence and<br />
requests for reprints to:<br />
Dr Andreas Laupacis,<br />
Robarts Research Institute,<br />
PO Box 5015, London,<br />
Ontario N6A 5KB, Canada.<br />
BrMed3 1990;300:573-8<br />
BMJ VOLUME 300 3 MARCH 1990<br />
Association between recombinant human erythropoietin and quality<br />
of life and exercise capacity of patients receiving haemodialysis<br />
Canadian Erythropoietin Study Group<br />
Abstract<br />
Objective-To determine whether recombinant<br />
human erythropoietin improves the quality of life<br />
and exercise capacity of anaemic patients receiving<br />
haemodialysis.<br />
Design-A double blind, randomised, placebo<br />
controlled study.<br />
Setting-Eight Canadian university haemodialysis<br />
centres.<br />
Patients-118 Patients receiving haemodialysis<br />
aged 18-75 with haemoglobin concentrations<br />
and a data clerk and was responsible for adjusting the<br />
dose of erythropoietin, prescribing iron supplements<br />
or transfusions, and sending haematological data to the<br />
coordinating centre. The blinded team consisted of<br />
nurses in the dialysis unit and our study group and all<br />
doctors in the dialysis unit other than those in the<br />
unblinded team; this team carried out routine clinical<br />
care and recorded adverse reactions and other clinical<br />
events but did not have access to the results of<br />
haematological tests or know the dose of erythropoietin<br />
or placebo that each patient was receiving. The nurses<br />
in the study group administered tests to assess quality<br />
of life and exercise capacity.<br />
All patients were followed up for six months, and<br />
outcome measures were assessed before randomisation<br />
and at two, four, and six months. The two main<br />
outcomes assessed were quality of life and exercise<br />
capacity. We thought that quality of life would be<br />
most effectively assessed by a questionnaire aimed<br />
specifically at patients receiving haemodialysis. To put<br />
the results into perspective, however, we included two<br />
global measures of quality of life.<br />
We thus developed a kidney disease questionnaire<br />
using the methods suggested by Guyatt et al.' We also<br />
used the sickness impact profile, which assesses health<br />
state based on behaviour and has been used in the<br />
national kidney dialysis and kidney transplant study,9<br />
and the time trade off technique described by Churchill<br />
et al," from which a "utility" is derived for each<br />
patient. These three measures of quality of life are<br />
described in more detail in the appendix.<br />
To assess exercise capacity we used the six minute<br />
walk test and an exercise stress test. The six minute<br />
walk was conducted in enclosed corridors that were<br />
between 25 and 40 m long. Patients were instructed to<br />
walk from end to end, covering as much ground as<br />
possible in the allotted time. We gave patients an<br />
exercise stress test using a modified Naughton<br />
protocol2 conducted in 11 two minute stages, with the<br />
speed of the treadmill increasing from 1 -6 to 5 5 km/h<br />
and the incline increasing from 0 to 16%. If the patient<br />
was able to exercise for 22 minutes the test was<br />
continued for a further eight minutes at a speed of<br />
5 5 km/h and a gradual increase in the incline from 16%<br />
to 25%. Standard encouragement was given during<br />
both exercise tests.<br />
We calculated the size of sample that would ensure<br />
that a clinically important difference among the three<br />
groups at six months would be detected with the time<br />
trade off technique, sickness impact profile, and six<br />
minute walk test (the only outcome measures for which<br />
TABLE i-Characteristics ofpatients at beginning ofstudy into effects oflow and high doses of erythropoietin.<br />
Values are means (SD) unless stated otherwise<br />
Placebo Low ervthropoietin High ervthropoietin<br />
group group group<br />
(n =40) (n =40) n-38)<br />
Age (years) 48 (16) 44 (16) 43 (15)<br />
No of men 25 19 26<br />
No who were anephric 6 13 10<br />
Nowho had had a transplant 14 16 12<br />
Duration of haemodialysis (years)* 25 (3 1) 46(47) 44 51)<br />
No of transfusions during previous year 7-3 (8 3) 6 6 (6 8) 5 6 (7 4)<br />
No dependent on transfusiont 19 19 11<br />
Systolic blood pressure (mm Hg)t 143 (19) 137 (22) 143 (21)<br />
Diastolic blood pressure (mm Hg)# 80 (12) 78 (14) 78 12))<br />
No receiving antihypertensive drugs 10 13 12<br />
Haemoglobin (g/l) 71 (9) 69 (10) 71 (12)<br />
Serum iron ([tmol/l) 19 (14) 18 (9) 22 (15)<br />
Serum ferritin (ug/l) 703 (866) 1044 (1690) 1273 (2303)<br />
Median serum ferritin ([g/l) 318 406 345<br />
Serum creatinine (4imolI1) 1057 (246) 1090 (260) 1076 290)<br />
Serum urea (mmol/l) 28-0 (6 0) 27-3 (7 0) 27 8 (7 2)<br />
Serum potassium (mmol/l) 5-0 (0 6) 5-1 (0 6) 51 (0-7)<br />
*p=0 07 Among groups.<br />
tPatients who had received dialysis for one or more years were considered to be dependent on transfusion if they<br />
received six or more units of blood in the year before randomisation. Patients who had received dialyzsis for less than<br />
one year were considered to be dependent on transfusion if they had received more than two units of blood in the<br />
three months before randomisation.<br />
tPlacebo group n= 37; low erythropoietin group n= 39; high ervthropoietin group n= 37.<br />
574<br />
Page 80<br />
data on variance were available before the studv). " We<br />
required 30 patients in each group (two tailed (C of 0 05<br />
and a power of 90o). Assuming a withdrawal rate of<br />
25% due to renal transplantation, adverse effects, and<br />
concomitant events, this meant that we needed a<br />
sample of 120 patients.<br />
The outcome variables were analysed only for<br />
patients who had completed all four evaluations<br />
(before randomisation and at two, four, and six<br />
months). Analysis of variance for repeated measures<br />
was used. The main hypothesis tested was that the<br />
mean response profiles of v . rariables evaluated at the<br />
four time points were the same among the tl-iree<br />
groups.4 In addition to the overall comparison among<br />
the three treatment groups, two orthogonal contrasts<br />
were specified to compare the patients receiving<br />
placebo with the patients treated with erythropoietin<br />
(both groups) and the patients in the low erythropoietin<br />
group with those in the high erythropoietin group.<br />
Pearson's correlation coefficient was computed<br />
to examine the relation between the change in<br />
haemoglobin concentration and the change in qualitv<br />
of life and exercise capacity. Kendall's T statistic<br />
and the corresponding p values were computed to<br />
detect any significant associations between the<br />
incidence of side effects and treatment with<br />
erythropoietin.<br />
Results<br />
PATIENT CHARACTERISTICS<br />
Forty patients were randomised to receive placebo,<br />
40 low dose erythropoietin, and 38 high dose erythropoietin.<br />
Renal failure was due to glomerulonephritis<br />
(50 patients), pyelonephritis or interstitial nephritis<br />
(24), polycystic kidney disease (14), renal vascular<br />
disease (seven), chronic renal failure of unknown cause<br />
(three), nephritis induced by drugs (two), and other<br />
causes ( 18). Table I shows the characteristics of<br />
patients in the three groups at the beginning of the<br />
study; the three groups were comparable. Patients<br />
receiving placebo had been treated by dialysis for a<br />
shorter time than the two other groups (p=0 07).<br />
When age, duration of dialysis, whether patients had<br />
received a transplant or were anephric, dependence on<br />
transfusion, and antihypertensive treatment at the<br />
time of randomisation were examined with effect of<br />
treatment in the analysis the results of the unadjusted<br />
analysis were hardly affected.<br />
WITHDRAWALS FROM STUI)Y<br />
Nineteen patients were withdrawn during the study:<br />
eight in the placebo group (because of transplarntation<br />
(five), non-compliance (one), reaction to transfusion<br />
(one), seizure and death (one)); six in the low erythropoietin<br />
group (transplantation (two), hypertension<br />
(one), hypertension and seizure (one), subarachnoid<br />
haemorrhage and seizure (one), pregnancy (one)); and<br />
five in the high erythropoietin group (transplantation<br />
(three), hypertension (two)). Six patients were<br />
withdrawn before the follow up at two months, and the<br />
13 others were withdrawn before the follow up at four<br />
months. The patient who became pregnant continued<br />
to receive erythropoietin but had a spontaneous<br />
miscarriage at 11- 1 2 weeks' gestation.<br />
CHANGES IN HAEMOGLOBIN CONCENTRATION<br />
Figure 1 shows the changes in haemoglobin<br />
concentration in the three groups. The mean (SD)<br />
haemoglobin concentration at six months was 74<br />
(12) g/l in the placebo group, 102 (10) g/l in the low<br />
erythropoietirl group, and 117 (14) g/l in the high<br />
erythropoietin group. The mean haemoglobin<br />
concentration reached the target range by six weeks in<br />
patients in the low erythropoietin group and by<br />
BMJ VOLUME 300 3 MARCH 1990
IABLE I- Scores for qualitv of liJe and exercise capacity obtained for patienits wzith end stage renal disease before and two and six months aflter start of treatment with placebo or low or<br />
high doses of ervthropoietin<br />
Kidney disease questionnaire:<br />
Phvsical*<br />
Fatigue<br />
Relationships<br />
Depression<br />
Frustration<br />
Sickness impact profilet:<br />
Global<br />
Physical<br />
Psychosocial<br />
Time trade off technique<br />
Exercise stress test: (minutes walkedl<br />
Six minute walk test' distance walked m<br />
*Placebo group n= 31.<br />
tLowest score represents best quality of life.<br />
Placebo group<br />
(n=32<br />
Low ervthropoietin group<br />
n =34)<br />
High erythropoietin group<br />
(n = 33)<br />
At At At At At At<br />
Before 2 months 6 months Before 2 months 6 months Before 2 months 6 months<br />
tPlacebo group n= 29; low ervthropoietin group n= 31; high ers thropoietin group n= 27.<br />
,Placebo group n= 31; low erythropoietin group n 32; high erv thropoietin group n= 30.<br />
Significance of<br />
difference<br />
Among the Ervthropoietin High dose v<br />
three z} low dose<br />
groups placebo ervthropoletin<br />
TABLE III-Symptoms defined by patients as being a problem associated with end stage renal disease before and two and six months after start of treatment with placebo or low or high<br />
doses of erythropozetin<br />
Fatigue<br />
Decreased strength<br />
Sleeping abnormalities<br />
Aching legs and bones<br />
Shortness of breath<br />
SexualitV<br />
100<br />
No<br />
of<br />
patients<br />
67<br />
45<br />
45<br />
35<br />
20<br />
18<br />
Placebo group<br />
At At<br />
Before 2 months 6 months Before<br />
4 1<br />
4 1<br />
4 0<br />
3 6<br />
3-6<br />
4-6<br />
4 6<br />
4.7<br />
4.3<br />
4.4<br />
4.7<br />
4-6<br />
4 1<br />
4-2<br />
4.5<br />
4.3<br />
4.4<br />
5 .2<br />
Low ervthropoietin group High erythropoietin group<br />
3-1<br />
2-8<br />
3 8<br />
3 0<br />
4.3<br />
3 0<br />
At At At At<br />
2 months 6 months Before 2 months 6 months<br />
4 3<br />
4-0<br />
4-0<br />
4 2<br />
5.4<br />
4 2<br />
5 4<br />
5 3<br />
4 0<br />
4.4<br />
5.9<br />
4 2<br />
High<br />
erythropoietin<br />
group<br />
. Low<br />
erythropoietin<br />
group<br />
37 4.9 50<br />
4-0 5 3 5 3<br />
4.3 5 3 56<br />
4-0 5-0 5.7<br />
4-2 5 8 5-8<br />
3-0 3.9 5.0<br />
Significance of diffeience<br />
Among the Erythropoietin High dose z'<br />
three Z) low dose<br />
groups placebo ervthropoietin<br />
TABLE Iv-Mean blood pressure (mm Hg) in the three treatment groups before (time 0) and two, four, and six months after start of treatment<br />
Placebo group (n = 29) Low ervthropoietin group n =31) High erythropoietin group (n =32) Significance of difference<br />
Among the Erythropoietin High dose V lOw dose<br />
0 2 4 6 0 2 4 6 0 2 4 6 three groups v placebo erythropoietin<br />
Sy'stolic 147 144 142 143 137 138 140 137 144 146 141 144 NS NS NS<br />
Diastolic 80 78 77 79 76 79 80 78 78 84 83 85 0-023
phosphorus, calcium, urea, and creatinine or white<br />
cell count among the groups throughout the study. At<br />
six months the platelet count had fallen by a mean (SD)<br />
of 5 (39) x 109/1 in the placebo group and increased by<br />
25 (64)x 109/l in the low erythropoietin group and<br />
23 (47) x 109/1 in the high erythropoietin group<br />
(p=0005, placebo v both erythropoietin groups<br />
throughout study).<br />
BLINDING<br />
At the end of the study all patients were asked<br />
whether they thought they had received erythropoietin<br />
or placebo. Nineteen patients in the placebo group<br />
and 52 patients receiving erythropoietin correctly<br />
identified their treatment. Six of the placebo group<br />
thought that they had received erythropoietin while<br />
two of the patients receiving erythropoietin believed<br />
that they had been given placebo. The other patients<br />
could not say which they had received.<br />
Discussion<br />
Treatment with erythropoietin corrected the<br />
anaemia associated with end stage renal disease in<br />
patients being treated by haemodialysis. Generally,<br />
patients receiving erythropoietin were much less<br />
fatigued, complained of less severe physical symptoms,<br />
and had increased exercise tolerance compared with<br />
patients given placebo. There was no significant<br />
difference in quality of life or exercise tolerance<br />
between patients receiving low and high doses of<br />
erythropoietin. A significant correlation was found<br />
between changes in haemoglobin concentration and<br />
changes in quality of life and exercise capacity, but<br />
the correlation coefficient was modest. Although<br />
erythropoietin caused a significant improvement in<br />
quality of life and exercise capacity, many other<br />
factors, such as uraemia, bone disease, and the<br />
psychological burdens of haemodialysis, also adversely<br />
affect the wellbeing of such patients, and these factors<br />
may not be improved by erythropoietin.<br />
The effect of erythropoietin on psychosocial<br />
function was less impressive than that on fatigue,<br />
physical symptoms, and exercise tolerance. Some<br />
significant (but moderate) improvements were seen in<br />
responses to the kidney disease questionnaire but not<br />
in the sickness impact profile. As the kidney disease<br />
questionnaire was developed for patients with renal<br />
failure it is not surprising that it was more responsive in<br />
our patients.<br />
The two measures of overall quality of life yielded<br />
different results, an improved quality of life being<br />
detected in patients treated with erythropoietin by the<br />
sickness impact profile but not by the time trade<br />
off technique. The time trade off technique allows<br />
patients to give their own weighting to the physical,<br />
social, and emotional factors that affect their quality of<br />
life, while the sickness impact profile applies fixed<br />
weights that may not precisely have reflected the<br />
concerns of our patients. The time trade off technique,<br />
which asks patients how many years of their current<br />
health state they would be willing to give up to receive<br />
erythropoietin is a rigorous test; the fact that the time<br />
trade off score did not change in patients taking<br />
erythropoietin probably indicates that despite the drug<br />
many of the patients receiving dialysis still had several<br />
adverse effects from their disease. The time trade off<br />
technique has been successfully used to detect changes<br />
in quality of life,'6 and complete insensitivity of the test<br />
is therefore unlikely to be the reason for the fairly<br />
constant scores in our study.<br />
We examined several outcome measures, and thus<br />
multiple testing may possibly have caused some results<br />
to appear significant by chance. We expected the effect<br />
of erythropoietin on fatigue, however, to be the largest,<br />
Page 83<br />
and the high levels of significance we obtained make it<br />
extremely unlikely that the results occurred by chance<br />
alone.<br />
It is difficult to recommend confidently a target<br />
haemoglobin concentration for patients treated with<br />
erythropoietin. In general, the patients' quality of life<br />
and exercise capacity rose with increasing haemoglobin<br />
concentration, but patients in the high erythropoietin<br />
group had a greater incidence of hypertension (and<br />
perhaps clotting of the vascular access) than patients in<br />
the other groups. Decisions on each patient's target<br />
haemoglobin concentration should be made clinically<br />
taking into account not only increased quality of life<br />
and exercise capacity but also the patient's likelihood<br />
of developing hypertension or thrombosis.<br />
The ultimate clinical role of erythropoietin in the<br />
treatment of anaemic patients receiving haemodialysis<br />
will depend on the patient's need for transfusion,<br />
the ability of erythropoietin to prevent anti-HLA<br />
sensitisation, the cost of the drug, and the drug's<br />
efficacy and side effects in other populations receiving<br />
haemodialysis.<br />
Appendix<br />
KIDNEY DISEASE QUESTIONNAIRE<br />
The kidney disease questionnaire is specific for<br />
patients with end stage renal disease and was developed<br />
from the methods described by Guyatt et al.8 We<br />
interviewed patients receiving haemodialysis and<br />
health care staff and reviewed existing quality of life<br />
variables. This generated a list of 130 items that could<br />
potentially have an adverse affect on the quality of life<br />
of the patients. Fifty patients receiving haemodialysis<br />
were then asked to rank these items in terms of their<br />
importance.<br />
The items that were ranked most frequently and<br />
judged to be most important by the patients were<br />
included in the questionnaire. The final questionnaire<br />
consisted of 26 questions divided into five sections:<br />
physical symptoms, fatigue, depression, relationships,<br />
and frustration. In the section on physical symptoms<br />
each patient was asked to identify those physical<br />
symtoms or problems that most affected his or her life,<br />
and these were used for that patient throughout the<br />
study.<br />
All questions were scored on a seven point Likert<br />
scale (7 = no problem, 1= a severe problem). For<br />
example, a question from the fatigue section, "How<br />
often in the past two weeks have you felt low in<br />
energy?" was accompanied by a choice of answers: (1)<br />
All the time; (2) most of the time; (3) a good bit of the<br />
time; (4) some of the time; (5) a little of the time;<br />
(6) hardly any of the time; and (7) none of the time.<br />
A change in mean score of 0 5 in each section<br />
represented a minimal, clinically important difference,<br />
and a mean change of 1 0 represented a large clinical<br />
change. 17<br />
SICKNESS IMPACT PROFILE<br />
The sickness impact profile is a questionnaire based<br />
on behaviour that contains 136 statements about<br />
dysfunction related to health in 12 types of activity:<br />
sleep and rest, eating, work, home management,<br />
recreation and pastimes, ambulation, mobility, body<br />
care and movement, social interaction, alertness,<br />
emotional behaviour, and communication.9 Some of<br />
these can be aggregated to give a physical score (body<br />
care and movement, mobility, and ambulation) and<br />
a psychosocial score (emotional behaviour, social<br />
interaction, ambulation, and communication). An<br />
overall score combining all questions can also be<br />
derived.<br />
When answering the questionnaire the patients were<br />
asked to think about themselves that day and to<br />
BMJ VOLUME 300 3 MARCH 1990 577
Department of Community<br />
Medicine and General<br />
Practice, Radcliffe<br />
Infirmary, Oxford<br />
OX2 6HE<br />
E M I Williams, MB, senior<br />
registrar<br />
L Jones, BA, computer scientist<br />
M P Vessey, FFCM, professor<br />
K McPherson, PHD, lecturer<br />
Correspondence to: Dr<br />
E M I Williams, Oxford<br />
Regional Health Authority,<br />
Old Road, Headington,<br />
Oxford OX3 7LF.<br />
Br,1edj 1990;300:578-9<br />
determine which statements described them and were<br />
related to their health. The patient could answer only<br />
yes or no to each question. An example of a question<br />
about sleep and rest is, "I spend much of the day lying<br />
down in order to rest."<br />
TIME TRADE OFF TECHNIQUE<br />
The time trade off technique is used to derive<br />
a "utility," a score between 0 and 1, in which<br />
1 represents perfect health and 0 a state in which the<br />
patient is indifferent between life and death. " With the<br />
help of visual aids patients were asked how many years<br />
of their current health they would be willing to forgo to<br />
achieve perfect health. For example, if a 36 year old<br />
patient stated that she was unable to choose between<br />
four years of perfect health and 40 years of her current<br />
health the utility of her current health state was<br />
4/40=0 10 (she would be willing to give up 36 years of<br />
her current health to achieve four years of perfect<br />
health).<br />
The Canadian Erythropoietin Study Group comprises the<br />
following groups. Executive committee: David Churchill,<br />
Paul Keown (chairman), Andreas Laupacis, Norman<br />
Muirhead, Dalice Sim, David Slaughter. Management<br />
committee: Paul Keown, Andreas Laupacis (chairman),<br />
Norman Muirhead, Beth Sarazin, Denise Short, Dalice Sim,<br />
David Slaughter, Cindy Wong. Study centres: Victoria<br />
General Hospital, Halifax, Nova Scotia (Allan Cohen,* David<br />
Hirsch, Kailash Jindal); Royal Victoria Hospital, Montreal,<br />
Quebec (Paul Barre,* Andrew Gonda, Tom Hutchinson,<br />
Sarah Prichard, Denis Roy); Ottawa Civic Hospital and<br />
Ottawa General Hospital, Ottawa, Ontario (Andrew<br />
Lazarovits,* Steven Nadler,* Gerald Posen, Eli Rabin); St<br />
Joseph's Hospital, Hamilton, Ontario (Colin Barnes, David<br />
Churchill,* Sandra Donnelly, David Ludwin, Kinsey<br />
Smith); University Hospital and Victoria Hospital, London,<br />
Ontario, and Laurentian Hospital, Sudbury, Ontario<br />
(William Fay, David Hollomby, Tony Jevnikar, Paul<br />
Keown, Norman Muirhead*); Health Sciences Centre and St<br />
Boniface Hospital, Winnipeg, Manitoba (Keevin Bernstein,<br />
Adrian Fine, John McKenzie,* Brian Penner, Brent<br />
Schacler, Ashley Thomson); Foothills Hospital, Calgary,<br />
Alberta (Ellen Burgess, Allan Jones, Henry Mandin*); St<br />
Paul's and Vancouver General Hospitals, Vancouver,<br />
Short term increase in risk of<br />
breast cancer associated with<br />
full term pregnancy<br />
E M I Williams, L Jones, M P Vessey,<br />
K McPherson<br />
Women who have their first full term pregnancy after<br />
age 35 are at higher risk of breast cancer than<br />
nulliparous women,' and the proportion of young<br />
women with breast cancer who have had children is<br />
higher than expected.7 These and other findings<br />
suggest that women who have full term pregnancies<br />
have a transiently increased risk of breast cancer that is<br />
followed by long term protection.) We applied the<br />
analysis described by Bruzzi et al3 to data obtained<br />
from an investigation which explored the relation<br />
between lifestyle factors and risk of breast cancer.4<br />
Patients, methods, and results<br />
Briefly, we recruited 1996 married women aged 25-<br />
59 between 1980 and 1984 from seven hospitals. They<br />
comprised 998 patients with newly diagnosed breast<br />
cancer that had been confirmed histologically and 998<br />
controls, who had been admitted electively with<br />
conditions not originally related to breast cancer.<br />
British Columbia (Anthony Chiu, Gershon Growe, David<br />
Landsberg, John Price, John Shepherd, Roger Sutton,*<br />
Linda Vickers, Ronald Werb). *=Principal investigators.<br />
We thank the study nurses, data coordinators, and<br />
pharmacists at each of the centres; the support staff of Robarts<br />
Research Institute; Ulrike Kuprath, Patricia Laplante,<br />
Angela Mongul, David Slaughter, and other staff at Ortho<br />
Pharmaceutical (Canada) Ltd; and the patients. We also<br />
thank Janice Coffey for secretarial help.<br />
1 Eschbach JW, Egrie JC, Downing MR, Browne JK, Adamson JW<br />
Correction of thc anicmia of end-stage renal disease with recombinant human<br />
crythropoictin. Engl.ViMed 1987;316:73-8.<br />
2 Winearls C(G, P'ippard AIj, t)owning MR, Oliver DO, Reid C, Cotes PMN.<br />
Ef'fect of htuman erythropoietin derived from recombinant DNA on the<br />
anaemia of patients tnaintaitted by chronic haemodialysis. Latncet<br />
1986;ii: 1 175-7.<br />
3 Canadian Ersthropoietin Study Group. A prospective, randomized,<br />
douLble-blind stuLds of recombittant erythropoietin (r-Hu-EPO)0 in chronic<br />
hemodialv sis [Abstract]. Kidsne Iti 1988;33:218A.<br />
4 Eschbach JVI. 'rhc ancmia ot' chronic renal failure: pathophvsiologv and the<br />
effect of recombinant crsthropoietin. Kidnicesv Int 1989;35:134-48.<br />
5 Ltindin AP. Qualits ot' life: subjective and objectise improvements with<br />
recombinant htuman crs thropoictin therapy. Semin Nephrol 1989;9:22-9.<br />
6 Schacfer RAM, Kokot F, Wlcrnze H, Geiger H, Heidland A. Impros-ed sexual<br />
funictioni in hcmodialssis patients on rccombinant erythropoietiit: a possible<br />
role for prolactin. Clin .\' phrol 1989;31:1-5.<br />
7 Guvatt GH, Sullisan M1J, Fhompson P1, ct al. The 6-minute walk: a new<br />
measure of excrcise capacits in patients with chronic hcart failure. Can Med<br />
Assocj 1985;132:919-23.<br />
8 Guyatt GH, Bombardier C, I'ugwell P. Measuring disease-specific quality of<br />
life in clinical trials. Can Med .Assoc7 1986;134:889-95.<br />
9 Bergner M, Bobbitt RA, Carter WB, Gilson BS. The sickniess impact profile:<br />
deselopment anid final res-ision of a health status measure. Med Care<br />
1981;19:787-805.<br />
10 Hart LG, Evans RW. The functional status of ESRD patients as measured by<br />
the sickness impact profile. ] Chronic Dis 1987;40(suppl 1): I 17-30S.<br />
11 Churchill DN, Torrance GW, Taylor DX', et al. ieasurement of quality of'lifc<br />
in end-stage renal disease: the time trade-off approach. Clin Invest Med<br />
1987;10: 14-20.<br />
12 Naughton J, Sevelius G, Balke B. Physiological responses otf' normal and<br />
pathological subjects to a modified work capacity test. J Sports Med P/s's<br />
Fitness 1963;3:201-7.<br />
13 Schwartz D, Flamant R, Lellouch J. Clinical trio/ls. New York: Academic<br />
Press, 1980:137.<br />
14 Winer BS. Statistitcal prnciples in experimental design. New York: MSc(Graw-<br />
Hill, 1971:518-39.<br />
15 Gibbons J[). NnparantietrIc statistical inference. Ncw Ytork: MIcGraw-Hill,<br />
1971:2209-26.<br />
16 Mohiide EA, Torrance GW, Streitter D)t, ltrittgle l)Ni, Gilbert R. MNeasuring<br />
the wcllbeing of family caregis-crs usitag thc timc trade-otff technique.<br />
Cl/inical Epidemiots/s 1988;41:475-82.<br />
17 Jacschkc R, Singer J, Guyatt G, Health status mcasuremcnt: ascertaining the<br />
minimal clinically important diff'ercncc. CAontrolled C/in Irials 1989;10:407-<br />
15.<br />
(Accepte7d 19 IJecenther /989<br />
Page 84<br />
Patients and controls were matched for admitting<br />
hospital and within five year age groups but not for<br />
parity. The present analysis aimed at detecting any<br />
increase in the risk of breast cancer shortly after a full<br />
term pregnancy. The interval between the date of<br />
diagnosis of breast cancer and the last term birth was<br />
studied. As this is related to age, age at first term birth,<br />
and parity these variables were adjusted for in the<br />
analysis.<br />
Only women under 50 with two or more children<br />
were included to accord with the analysis by Bruzzi et<br />
al,' and this resulted in the study becoming unmatched<br />
(422 cases and 447 controls). The generalised interactive<br />
modelling (GLIM) package was used to estimate<br />
the maximum likelihood of effects. Graduated levels of<br />
exposure were assessed by linear trend tests.<br />
The two groups were comparable in terms of centre<br />
of recruitment, which was ignored in subsequent<br />
analyses. An increased risk of breast cancer was<br />
associated with decreasing interval since last term birth<br />
(p=0-021), increasing age at first term birth (p=0 006),<br />
and decreasing parity (p=0 -002) (table). When women<br />
aged under 40 and 40-49 were considered separately<br />
the trends were broadly similar, although not all were<br />
significant.<br />
Comment<br />
Our results suggest that a transient increase in the<br />
risk of breast cancer occurs after full term pregnancy.<br />
578 BMJ VOLUME 300 3 MARCH 1990
Page 85
Page 86
Page 87
Page 88
Page 89
Page 90
Page 91
Page 92
Page 93
Nephrol Dial Transplant (2009) 24: 3138–3143<br />
doi: 10.1093/ndt/gfp213<br />
Advance Access publication 18 May 2009<br />
Blood transfusion use in non-dialysis-dependent chronic kidney<br />
disease patients aged 65 years and older<br />
Hassan N. Ibrahim 1,2 , Areef Ishani 1,2,3 , Haifeng Guo 1 and David T. Gilbertson 1<br />
1 Chronic Disease Research Group, Minneapolis Medical Research Foundation, 2 Department of Medicine, University of Minnesota<br />
and 3 Section of Nephrology, Department of Medicine, Minneapolis Veterans Affairs Medical Center, Minneapolis, MN, USA<br />
Correspondence and offprint requests to: Hassan N. Ibrahim; E-mail: ibrah007@umn.edu<br />
Abstract<br />
Background. Erythropoiesis stimulating agents (ESA)<br />
have alleviated the need for blood transfusions in dialysis<br />
patients. Their impact on transfusion frequency in<br />
elderly chronic kidney disease (CKD) patients aged<br />
65 years and older with non-dialysis-dependent CKD has<br />
not been studied.<br />
Methods. We conducted a retrospective cohort study of<br />
Medicare beneficiaries with CKD, point prevalent as of<br />
1 January of each calendar year 1992–2004 (n = 301 000),<br />
and a concurrent group of beneficiaries without CKD (n =<br />
15 772 039). During the entry year, we used administrative<br />
claim data to assemble a comorbidity profile for each participant.<br />
Transfusion event rates, ESA use and parenteral<br />
iron use were of primary interest.<br />
Results. CKD patients were at least four times more likely<br />
than non-CKD patients to receive transfusions. Transfusion<br />
rates adjusted for case mix fell from 194.2 transfusions per<br />
1000 patient-years in 1992 to 112.2 in 2004. The decline<br />
in transfusions was highest for anaemic CKD patients receiving<br />
ESAs, which were given to 0.8% of CKD patients<br />
in 1992 and to 7.5% in 2004.<br />
Conclusions. Transfusion use in non-dialysis-dependent<br />
CKD patients has decreased considerably but continues<br />
to be common. ESA use and possibly changed attitudes<br />
towards transfusion use explain most of the reduction<br />
noted.<br />
Keywords: chronic kidney disease; erythropoiesis stimulating agents;<br />
transfusions.<br />
Introduction<br />
Anaemia is a classic consequence of reduced renal function,<br />
and its prevalence is almost universal by the time<br />
chronic kidney disease (CKD) progresses to end-stage renal<br />
disease (ESRD) (1–2). The introduction of erythropoiesis<br />
stimulating agents (ESAs) has improved the quality of life<br />
for CKD patients, including those on dialysis (3–6). We<br />
recently showed reduced transfusion frequency in a large<br />
cohort of dialysis patients studied between 1992 and 2004<br />
(7). Surprisingly, little is known regarding the effect of ESA<br />
use on the frequency of blood transfusions in CKD patients<br />
who are not on dialysis.<br />
Therefore, we compared the transfusion experience of a<br />
large cohort of Medicare beneficiaries with non-dialysisdependent<br />
CKD to the experience of beneficiaries without<br />
CKD. We also compared ESA use and parenteral iron use in<br />
beneficiaries with and without CKD. We tested the hypothesis<br />
that ESA use is responsible for most of the observed<br />
reduction in transfusion frequency in elderly anaemic CKD<br />
patients.<br />
Subjects and methods<br />
C○ The Author [2009]. Published by Oxford University Press on behalf of ERA-EDTA. All rights reserved.<br />
For Permissions, please e-mail: journals.permissions@oxfordjournals.org<br />
Page 94<br />
Study cohorts<br />
We studied 301 000 general Medicare beneficiaries who entered the Part<br />
A and Part B programmes from 1992 through 2004. Medicare Part A reimburses<br />
health care providers for services to Medicare beneficiaries during<br />
hospitalizations, and it covers facility costs. Medicare Part B covers services<br />
provided by hospital outpatient departments, rural health clinics,<br />
dialysis facilities, outpatient rehabilitation services and community mental<br />
health centres. Most citizens or permanent residents of the United<br />
States aged 65 years or older are eligible for Part A coverage if they are<br />
eligible for Social Security benefits. Before age 65 years, Medicare coverage<br />
is available only to people with disabilities or with ESRD. Anyone<br />
eligible for Medicare Part A can enrol in Part B by paying a monthly<br />
premium.<br />
Included patients entered the Medicare programme before 1 January<br />
of each year, were aged 65 years or older at the beginning of each year,<br />
survived and remained in the programme through 31 December of each<br />
year and had non-dialysis-dependent CKD diagnosed in each year (entry<br />
year). Henceforth in this report, ‘CKD’ means ‘non-dialysis-dependent<br />
CKD’. Patients enrolled in health maintenance organizations, with Medicare<br />
as secondary payer, diagnosed with ESRD, or not residing in the<br />
50 US states, the District of Columbia, Puerto Rico or the Territories<br />
during each year were excluded. Patients with evidence of cancer or<br />
blood dyscrasias during the 12-month entry period for each year were<br />
also excluded, as these patients can be hyporesponsive to ESA therapy<br />
and may require multiple transfusions not directly related to anaemia<br />
of CKD. The relevant exclusions with International Classification of<br />
Diseases, Ninth Edition, Clinical Modification (ICD-9-CM) codes are<br />
shown in Table 1. Patients who did not survive the entry period were also<br />
excluded.<br />
CKD and comorbid conditions were defined during the 12-month entry<br />
period. Conditions were defined by the presence of one inpatient Part A<br />
claim or two outpatient Part B or one Part A and one Part B claims.<br />
ICD-9-CM codes used to define CKD and relevant comorbid conditions<br />
used to describe the cohort are listed in Table 1.
Transfusions and chronic kidney disease 3139<br />
Table 1. International Classification of Diseases, Ninth Edition, Clinical<br />
Modification (ICD-9-CM) codes used to define chronic kidney disease<br />
and identify excluded and comorbid conditions<br />
Condition ICD-9-CM codes<br />
CKD 016.0, 095.4, 189.0, 189.9, 223.0,<br />
236.91, 250.4, 271.4, 274.1, 283.11,<br />
403.x1, 404.x2, 404.x3, 440.1, 442.1,<br />
447.3, 572.4, 580–588, 591, 642.1,<br />
646.2, 753.12–753.17, 753.19, 753.2<br />
and 794.4<br />
Excluded conditions<br />
Cancer 140.xx–172.xx, 174.xx–208.xx,<br />
230.xx–231.xx<br />
Haemolytic anaemias 282.x, 283.x<br />
Aplastic anaemia 284.x<br />
Coagulation defects 286.x<br />
Myeloma 203.0x<br />
Myelofibrosis 289.89<br />
Myelodysplasia 238.7<br />
Comorbid conditions<br />
ASHD 410.xx–414.xx, V45.18–V45.82<br />
CHF 398.91, 422.xx, 425.xx, 428.xx, 402.x1,<br />
404.x1, 404.x3, V42.1<br />
CVA 430.xx–438.xx<br />
PVD 440.xx–444.xx, 447.xx, 451.xx-453.xx,<br />
557.xx<br />
Other CVD 420.xx–421.xx, 423.xx–424.xx, 429.xx,<br />
785.0–785.3, V42.2, V43.3<br />
COPD 491.xx–494.xx, 496.xx, 510.xx<br />
GI disorders 456.0–456.2, 530.7, 531.xx–534.xx,<br />
569.84, 569.85, 578<br />
Liver disease 570.xx, 571.xx, 572.1, 572.4,<br />
573.1–573.3, V42.7<br />
Dysrhythmia 426.xx–427.xx, V45.0, V53.30<br />
Diabetes 250.xx, 357.2, 362.0x, 366.41<br />
Hypertension 362.11, 401.x–405.x, 437.2<br />
Anaemia 280.xx–285.xx<br />
ASHD, atherosclerotic heart disease; CHF, congestive heart failure; CKD,<br />
chronic kidney disease; CVA, cerebrovascular accident; PVD, peripheral<br />
vascular disease; CVD, cardiovascular disease; COPD, chronic obstructive<br />
pulmonary disease; GI, gastrointestinal.<br />
Based on claim source (inpatient or outpatient/Part B claims), CKD<br />
and comorbid conditions were further classified as follows: inpatient<br />
claim source if the inpatient claim occurred before the second Part B<br />
or outpatient claim, or in the absence of a Part B or outpatient claim;<br />
outpatient claim source if the second outpatient or Part B claim occurred<br />
before an inpatient claim or in the absence of an inpatient claim. Transfusions<br />
billed by outpatient facilities and those administered during inpatient<br />
hospital stays were obtained from Part A files using code files for both<br />
whole and packed cell transfusions. Those obtained from Part B files included<br />
whole and packed red blood cell transfusions, regardless of whether<br />
these were leukocyte reduced, irradiated or deglycerolized. ESA use was<br />
defined during the entry period by Healthcare Common Procedure Coding<br />
System (HCPCS) codes. Anaemia was defined the same way that<br />
CKD was defined, using ICD-9-CM codes 280.xx–285.xx, encompassing<br />
all haemolytic, non-haemolytic and bone-marrow-failure-related anaemia<br />
(see Table 1).<br />
A non-CKD cohort including 15 772 039 patients was also studied from<br />
1992 through 2004, applying similar methodology and exclusions.<br />
Analysis<br />
Categorical variables are presented as percentages. Patients were followed<br />
from 1 January of each year to 31 December of the next year for blood<br />
transfusions and were censored at death, ESRD diagnosis and payer status<br />
change. Raw transfusion rates were calculated by the total number of<br />
transfusions over total follow-up time. Adjusted transfusion rates were<br />
calculated by the Poisson model. Seven models were fitted by adjusting<br />
for the following covariates:<br />
Model 1: age, sex, race.<br />
Model 2: age, sex, race and ESA use in the entry year.<br />
Model 3: age, sex, race and ESA use and hospital stays in the entry<br />
year.<br />
Model 4: age, sex, race and comorbid conditions in the entry year.<br />
Model 5: age, sex, race and ESA use, hospital stays and comorbid<br />
conditions in the entry year.<br />
Model 6: age, sex, race and ESA use, hospital stays and CKD and<br />
comorbid condition claim source (inpatient or outpatient) in the entry<br />
year. Adjustment for some of these comorbid conditions was done<br />
due to their potential to cause anaemia directly (e.g. gastrointestinal<br />
disorders) or to be associated with anaemia of CKD. The 1992 cohort<br />
was used as the reference group for these six models. An additional<br />
model, model 7, was similar to model 6 but used 2004 as the reference<br />
year. As the adjusted models gave comparable results, only results<br />
from model 7 are presented.<br />
Results<br />
Page 95<br />
General Characteristics of CKD and Non-CKD cohorts<br />
We studied 301 000 Medicare patients with CKD, 1992–<br />
2004. The number of patients rose steadily, from 14 057<br />
in 1992 to 42 225 in 2004 (Table 2), and the increase was<br />
uniform across all age groups (ages 65–74, 75–84 and ≥85<br />
years). In 2004, women constituted 55.2% of the CKD cohort<br />
and white patients 82.6%. Approximately a third of<br />
CKD patients were hospitalized at least once for an average<br />
of 1–7 days during the observation period. Interestingly,<br />
the proportion of CKD patients hospitalized for 8<br />
or more days fell from 35.8% in 1992 to 27.2% in 2004.<br />
Claims related to ASHD were present for approximately<br />
half the CKD cohort during the observation period, claims<br />
related to CHF for 40% and claims related to CVA/TIA<br />
for 20%. The proportions of patients with these three conditions<br />
changed little from 1992 to 2004. The prevalence<br />
of diabetes, PVD, hypertension and COPD rose steadily<br />
over the study period. In 2004, the reported diabetes prevalence<br />
was 48.4% and the hypertension prevalence 89.0%.<br />
The anaemia prevalence increased from 31.1% in 1992 to<br />
44.0% in 2004, paralleled by a steady increase in ESA use<br />
by almost 10-fold from 0.8% in 1992 to 7.5% in 2004.<br />
We also found a steady, though small, increase in parenteral<br />
iron use in the entry year. In 1992, only 0.1% of<br />
CKD patients received parenteral iron, rising to 1.0% in<br />
2004.<br />
The non-CKD cohort included 15 772 039 Medicare patients<br />
(Table 3). In this cohort, 13.2% were aged older than<br />
85 years compared with 20.6% in the CKD cohort. The<br />
proportion of African Americans was also lower, 7.3%<br />
compared with 12.9% in the CKD cohort. A substantially<br />
lower proportion (17.5%) than in the CKD cohort<br />
were hospitalized in the entry period, and the comorbidity<br />
burden, especially ASHD, CHF, CVA/TIA, diabetes<br />
and hypertension was lower. The anaemia prevalence was<br />
also much lower, at 9.0% versus 39.5% in the CKD cohort.<br />
ESA and iron use was negligible in the non-CKD<br />
cohort.
3140 H. N. Ibrahim et al.<br />
Table 2. Chronic kidney disease patient characteristics, 1992–2004<br />
Cohort year<br />
All 1992 1993 1994 1995 1996 1997 1998 1999 2000 2001 2002 2003 2004<br />
N 301 000 14 057 14 381 15 539 15 976 17 147 18 315 19 588 21 209 24 187 28 252 32 748 37 376 42 225<br />
Age (years)<br />
65–74 36.5 37.9 38.3 38.4 38.3 38.1 37.0 36.9 36.5 36.4 36.1 35.4 35.5 35.1<br />
75–84 42.9 41.6 41.4 40.6 41.4 41.6 42.5 42.1 42.6 43.1 43.9 44.1 44.1 44.0<br />
≥85 20.6 20.5 20.3 21.0 20.4 20.2 20.5 21.0 20.9 20.5 20.0 20.5 20.5 20.9<br />
Women 55.1 54.9 54.6 55.7 55.5 55.3 55.6 55.2 54.8 54.9 55.2 55.1 54.5 55.2<br />
White 82.1 82.2 81.6 81.3 81.6 81.6 81.7 81.7 81.9 82.2 82.0 82.6 82.7 82.6<br />
African American 12.9 14.1 14.7 14.4 14.0 13.6 13.5 13.0 12.8 12.4 12.6 12.3 12.2 12.1<br />
Other race 5.0 3.6 3.9 4.3 4.4 4.8 4.9 5.4 5.3 5.4 5.4 5.2 5.1 5.3<br />
ASHD 47.8 44.5 44.0 46.5 47.3 47.0 47.6 48.1 48.5 48.6 49.0 49.0 48.5 48.2<br />
CHF 41.7 42.1 42.5 43.5 43.8 43.1 43.3 43.5 42.9 42.5 41.7 40.7 39.6 39.0<br />
CVA/TIA 21.3 21.2 20.4 21.4 23.2 22.7 22.2 21.7 21.6 21.5 21.4 21.2 20.4 20.2<br />
Dysrhythmia 33.8 30.5 30.4 33.8 33.9 33.0 33.7 33.9 33.8 34.0 34.1 34.7 34.7 34.3<br />
Other cardiac 29.3 26.0 26.3 28.8 29.4 29.1 30.0 29.7 29.6 29.4 29.7 30.1 29.8 29.6<br />
Diabetes 44.3 35.6 36.8 37.5 39.3 40.6 42.0 43.9 44.9 45.9 46.9 47.7 47.5 48.4<br />
PVD 31.0 25.6 26.6 29.2 30.3 31.2 31.0 30.6 31.6 31.3 32.1 32.0 32.2 32.2<br />
Hypertension 80.4 65.3 67.4 70.5 72.7 74.5 76.2 77.6 79.7 82.1 84.2 85.4 87.2 89.0<br />
COPD 24.4 21.6 22.4 23.4 24.2 24.9 24.6 23.9 24.5 24.7 24.8 24.8 25.0 25.3<br />
Hospital stay, entry year<br />
No 38.9 30.4 31.7 31.6 32.7 35.2 37.3 38.3 39.6 39.5 40.3 42.1 43.1 43.8<br />
1–7 days 28.7 33.7 35.5 25.3 27.2 27.2 27.2 28.2 27.3 27.6 29.2 28.6 28.9 29.1<br />
≥8 days 32.4 35.8 32.8 43.1 40.2 37.6 35.6 33.5 33.2 32.9 30.5 29.4 28.0 27.2<br />
Anaemia 39.5 31.1 32.2 35.0 35.0 35.7 37.6 39.1 39.2 39.7 41.0 42.9 43.1 44.0<br />
ESA use, entry year 3.9 0.8 0.9 1.3 1.8 1.8 2.1 2.5 3.1 3.8 4.5 5.0 6.3 7.5<br />
Iron use, entry year 0.5 0.1 0.2 0.1 0.2 0.2 0.2 0.3 0.3 0.3 0.5 0.6 0.7 1.0<br />
Results are expressed as percentage of the cohort in each year.<br />
ASHD, atherosclerotic heart disease; CHF, congestive heart failure; COPD, chronic obstructive pulmonary disease; CVA/TIA, cerebrovascular accident/transient<br />
ischaemic attack; PVD, peripheral vascular disease.<br />
Transfusion rates<br />
Raw transfusion rates for CKD patients fell from 139.8 per<br />
1000 patient-years in 1992 to 112.2 in 2004 (Table 4), a<br />
decline that was observed in both inpatient and outpatient<br />
claims. Results from the adjusted models echoed the decline<br />
seen with raw rates. In the most comprehensive model that<br />
adjusted for age, sex, race, ESA use, hospital stay and CKD<br />
and comorbid condition claim source, the transfusion rate<br />
fell from 194.2 transfusions per 1000 patient-years in 1992<br />
to 112.2 in 2004. Non-CKD patients were four to five times<br />
less likely than CKD patients to receive transfusions, and<br />
these rates also decreased from 46.5 transfusions per 1000<br />
patient-years in 1992 to 25.7 in 2004 (Table 4).<br />
ESA use and transfusions<br />
In 1992, 0.8% of CKD patients received ESAs, rising to<br />
7.5% in 2004 (Table 5). The raw transfusion rate for CKD<br />
patients who received ESAs was 538.6 transfusions per<br />
1000 patient-years in 1992 and 198.6 in 2004. In contrast,<br />
for CKD patients who did not receive ESAs, the raw transfusion<br />
rate was 137.4 transfusions per 1000 patient-years in<br />
1992 and 105.5 in 2004. Adjusted rates followed a similar<br />
pattern, with most of the decline in transfusions occurring<br />
for patients who received ESAs in the entry period. A similar<br />
analysis of non-CKD patients showed no ESA use in<br />
1992, 1993 or 1994; 0.3% of the population received ESAs<br />
in 1995 and 0.7% in 2004. In 1992, the raw transfusion rate<br />
for non-CKD patients receiving ESAs was 2066.9 transfu-<br />
Page 96<br />
sions per 1000 patient-years, declining to 262.1 by 2004.<br />
For non-CKD patients with no ESA use in the entry period,<br />
the rate changed minimally from 1992 to 2004. The adjusted<br />
models, particularly for non-CKD patients receiving<br />
ESAs, revealed similar results. Expressed differently, we<br />
found that relative risk of receiving a transfusion for patients<br />
receiving ESAs decreased from 2.47 (95% confidence interval<br />
1.78–3.41) in 1992 to 1.35 (95% CI 1.22–1.48) in<br />
2004. This reduction was observed for both inpatient and<br />
outpatient transfusion risk (data not shown).<br />
We next assessed transfusion exposure according to the<br />
presence of anaemia and ESA use. Comparing transfusion<br />
rates for CKD patients with and without anaemia in the<br />
same entry period, we found that adjusted transfusion rates<br />
for CKD patients with anaemia fell from 199.1 transfusions<br />
per 1000 patient-years in 1992 to 129.3 in 2004. For CKD<br />
patients without anaemia in the entry period, rates fell from<br />
101.2 transfusions per 1000 patient-years in 1992 to 63.1 in<br />
2004. Assessing raw transfusion rates for CKD patients by<br />
both presence of anaemia and ESA use in the entry period,<br />
we found that the rates for CKD patients with anaemia<br />
who received ESAs in the entry period fell from 572.9<br />
transfusions per 1000 patient-years in 1992 to 200.1 in<br />
2004 (Table 6). For CKD patients with anaemia but no<br />
prior ESA use, the rates fell from 249.2 transfusions per<br />
1000 patient-years in 1992 to 174.7 in 2004. The rates for<br />
non-anaemic CKD patients who received ESAs fell from<br />
313.3 transfusions per 1000 patient-years in 1992 to 113.0<br />
in 2004. Transfusion rates for non-anaemic CKD patients<br />
followed a similar trend.
Table 3. Non-chronic kidney disease patient characteristics, 1992–2004<br />
Cohort year<br />
All 1992 1993 1994 1995 1996 1997 1998 1999 2000 2001 2002 2003 2004<br />
N 15 772 039 1 275 841 1 268 213 1 281 813 1 258 494 1 220 702 1 186 056 1 153 571 1 142 879 1 146 071 1 176 330 1 208 940 1 225 370 1 227 759<br />
Age (years)<br />
65–74 49.1 52.6 52.4 51.9 51.0 49.9 49.0 48.1 47.3 46.9 47.0 47.0 47.1 47.3<br />
75–84 37.7 35.6 35.7 35.8 36.4 37.2 37.7 38.3 38.8 39.1 39.0 39.0 38.9 38.6<br />
≥85 13.2 11.9 11.9 12.2 12.6 12.9 13.3 13.7 13.9 14.0 14.0 13.9 14.1 14.1<br />
Women 60.4 60.9 60.4 60.8 60.8 60.6 60.8 60.8 60.6 60.4 60.1 59.7 59.5 59.3<br />
White 88.8 88.6 89.5 89.1 89.1 89.1 89.0 88.9 88.8 88.7 88.5 88.4 88.2 88.2<br />
African American 7.3 7.3 7.4 7.4 7.4 7.2 7.2 7.2 7.2 7.2 7.3 7.4 7.4 7.4<br />
Other race 3.9 4.1 3.1 3.4 3.6 3.7 3.9 3.9 4.0 4.1 4.2 4.3 4.4 4.5<br />
ASHD 17.5 15.4 15.6 16.2 16.7 17.3 17.8 17.9 18.0 18.2 18.4 18.5 18.6 18.8<br />
CHF 8.5 7.2 7.5 7.8 8.1 8.6 9.0 9.2 9.1 9.0 8.9 8.7 8.6 8.5<br />
CVA/TIA 7.3 6.0 6.2 6.5 7.0 7.5 7.7 7.6 7.6 7.7 7.7 7.7 7.7 7.6<br />
Dysrhythmia 12.2 9.5 9.8 10.5 11.1 11.8 12.5 12.8 12.9 13.2 13.4 13.6 13.8 14.0<br />
Other cardiac 9.1 7.1 7.3 7.8 8.2 8.8 9.3 9.4 9.6 9.7 9.9 10.3 10.4 10.6<br />
Diabetes 14.5 11.2 11.6 12.1 12.5 13.0 13.8 14.4 15.0 15.7 16.4 17.1 17.7 18.5<br />
PVD 8.2 6.6 6.9 7.5 7.8 8.3 8.4 8.5 8.4 8.5 8.7 8.9 9.1 9.4<br />
Hypertension 40.5 29.9 31.4 33.2 34.8 36.6 38.2 40.0 41.7 44.0 46.3 48.4 50.6 52.8<br />
COPD 10.2 8.4 8.9 9.1 9.5 9.9 10.2 10.4 10.7 10.6 10.9 11.1 11.2 11.4<br />
Hospital stay, entry year<br />
No 82.5 83.0 83.0 82.9 82.7 82.6 82.4 82.3 82.1 82.1 82.0 82.3 82.5 82.8<br />
1–7 days 11.6 10.8 11.2 10.1 10.7 11.2 11.5 11.9 12.2 12.1 12.6 12.4 12.4 12.3<br />
≥ 8 days 5.8 6.2 5.8 7.0 6.6 6.3 6.0 5.8 5.8 5.8 5.4 5.3 5.1 4.9<br />
Anaemia 9.0 6.3 6.6 8.1 7.4 8.1 9.1 9.7 9.9 10.0 10.4 10.9 10.9 11.3<br />
ESA use, entry year 0.3 0.0 0.0 0.0 0.3 0.2 0.1 0.2 0.3 0.4 0.5 0.5 0.6 0.7<br />
Iron use, entry year 0.1 0.1 0.1 0.1 0.1 0.1 0.1 0.1 0.1 0.1 0.1 0.1 0.1 0.1<br />
Results are expressed as percentage of the cohort in each year.<br />
ASHD, atherosclerotic heart disease; CHF, congestive heart failure; COPD, chronic obstructive pulmonary disease; CVA/TIA, cerebrovascular accident/transient ischaemic attack; PVD, peripheral vascular<br />
disease.<br />
Transfusions and chronic kidney disease 3141<br />
Page 97
3142 H. N. Ibrahim et al.<br />
Discussion<br />
Our data demonstrate that transfusion rates for non-dialysisdependent<br />
CKD patients are 4- to 5-fold higher than rates<br />
for non-CKD patients. Transfusion rates declined markedly<br />
between 1992 and 2004, with the largest decline for anaemic<br />
CKD patients who received ESAs. Paralleling the decrease<br />
in blood transfusions, increases in the frequency of ESA<br />
use and, to a lesser extent, parenteral iron use were noted.<br />
CKD patients who received transfusions were more likely<br />
to receive ESAs, reflecting a high comorbidity burden.<br />
While blood transfusion use has declined, transfusions<br />
remain frequent. Undoubtedly, ESA use accounts for a<br />
proportion of the reduction; however, transfusion avoidance<br />
during the study period, as suggested by the decline in<br />
transfusions in the non-CKD population, may play a role.<br />
Transfusion rates in 2004 of 200.1 per 1000 patient-years<br />
Table 4. Transfusion rates a for chronic kidney disease and non-chronic<br />
kidney disease patients<br />
Raw rates Adjusted rates<br />
Year Non-CKD CKD Non-CKD CKD<br />
1992 26.9 139.8 46.5 194.2<br />
1993 25.9 132.3 41.8 199.0<br />
1994 24.7 128.8 37.4 152.7<br />
1995 25.4 126.1 31.8 153.6<br />
1996 27.9 133.1 35.7 149.5<br />
1997 29.1 138.3 35.9 158.0<br />
1998 30.0 146.4 34.7 160.2<br />
1999 30.6 145.5 34.5 158.0<br />
2000 31.6 142.5 34.5 152.1<br />
2001 32.2 130.9 34.0 132.5<br />
2002 31.7 137.7 32.7 139.5<br />
2003 29.5 121.4 30.0 122.5<br />
2004 25.7 112.2 25.7 112.2<br />
CKD, chronic kidney disease.<br />
a Per 1000 patient-years, including inpatient and outpatient transfusions.<br />
Table 5. Transfusion rates a by erythropoiesis stimulating agent use<br />
CKD patients Non-CKD patients<br />
for anaemic CKD patients receiving ESAs and 174.7 transfusions<br />
per 1000 patient-years for anaemic CKD patients<br />
not receiving ESAs demonstrate how common transfusions<br />
remain, despite the encouraging reductions in transfusions<br />
over time. Why these anaemic CKD patients were not receiving<br />
ESAs is unclear from this analysis. Possibly, the<br />
transfusions were given for an indication other than anaemia<br />
of CKD. A transfusion rate for non-anaemic CKD patients<br />
of only 63 per 1000 patient-years (in contrast to 174.7 for<br />
anaemic CKD patients not on ESAs) suggests but does not<br />
prove that anaemia, in addition to the many comorbid conditions<br />
borne by CKD patients, was the major reason for these<br />
transfusions. Possibly, patients with CKD and mild anaemia<br />
may receive transfusions during acute events when their<br />
haemoglobin levels are close to the threshold level physicians<br />
generally employ to transfuse patients. Comparing<br />
transfusion rates in this cohort of CKD patients to a cohort<br />
Table 6. Raw transfusion rates a for chronic kidney disease patients by<br />
anaemia status and erythropoiesis stimulating agent use<br />
Anaemia No Anaemia<br />
ESA No ESA ESA No ESA<br />
Year<br />
1992 572.9 249.2 313.3 91.5<br />
1993 739.7 242.8 180.7 79.6<br />
1994 345.5 237.4 401.8 73.1<br />
1995 466.7 222.9 231.9 73.2<br />
1996 367.5 239.2 0.0 77.0<br />
1997 505.7 235.4 163.0 77.8<br />
1998 487.1 254.2 282.6 75.4<br />
1999 391.4 241.7 152.3 82.7<br />
2000 445.5 238.8 143.6 73.9<br />
2001 266.6 216.1 128.7 72.7<br />
2002 277.6 220.2 135.5 75.8<br />
2003 217.5 192.1 153.8 68.8<br />
2004 200.1 174.7 113.0 63.0<br />
ESA, erythropoiesis stimulating agent<br />
a Per 1000 patient-years, including inpatient and outpatient transfusions.<br />
Raw rates Adjusted rates Raw rates Adjusted rates<br />
Year ESA use, % ESA No ESA ESA No ESA ESA use, % ESA No ESA ESA No ESA<br />
1992 0.8 538.6 137.4 399.2 161.8 0 2066.9 26.8 656.3 32.0<br />
1993 0.9 668.4 128.6 471.1 150.3 0 1862.5 25.6 511.0 29.9<br />
1994 1.3 347.7 126.8 201.7 137.5 0 1406.4 24.4 399.0 28.2<br />
1995 1.7 436.4 121.6 286.7 127.4 0.3 205.2 25.0 151.3 28.4<br />
1996 1.8 339.6 129.9 218.2 134.3 0.2 540.1 27.2 262.3 30.0<br />
1997 2.1 481.9 132.5 308.3 134.0 0.1 1079.7 28.2 326.9 29.5<br />
1998 2.5 474.7 139.5 300.2 136.9 0.2 871.7 28.8 264.8 29.6<br />
1999 3.1 381.8 139.1 240.6 141.3 0.3 841.0 28.9 261.5 29.6<br />
2000 3.8 433.5 132.6 268.9 133.1 0.4 755.5 29.6 232.3 30.3<br />
2001 4.5 262.4 125.4 170.2 124.1 0.4 734.3 29.7 227.3 30.0<br />
2002 5.0 274.5 131.1 184.5 129.7 0.5 580.3 29.4 182.0 29.5<br />
2003 6.3 216.2 115.4 152.9 115.4 0.6 443.0 27.4 150.4 27.5<br />
2004 7.5 198.6 105.5 142.0 105.5 0.7 262.1 24.3 97.7 24.3<br />
CKD, chronic kidney disease; ESA, erythropoiesis stimulating agent.<br />
a Per 1000 patient-years, including inpatient and outpatient transfusions.<br />
Page 98
Transfusions and chronic kidney disease 3143<br />
of dialysis patients we previously reported on, covering<br />
the same study period (1992–2005), reveals that transfusion<br />
rates were 2.7-fold higher for haemodialysis than for<br />
non-dialysis-dependent CKD patients in 1992 and 2.1-fold<br />
higher in 2005 (7).<br />
Red blood cell transfusions are not without risks, including<br />
transfusion reactions, transmission of infectious<br />
agents and iron overload (8). Before the widespread adoption<br />
of ESA therapy, 41% of dialysis patients were estimated<br />
to show evidence of iron overload incurred from<br />
multiple blood transfusions; this era has fortunately passed<br />
(9). Other concerns include associated costs and the potential<br />
adverse effect of blood transfusions on the development<br />
of allo-antibodies, which in turn can prolong time on the<br />
kidney transplant waiting list and possibly jeopardize the<br />
kidney transplant outcome (10). Continued efforts to minimize<br />
transfusion use, in accordance with the US Food and<br />
Drug Administration guidelines, will likely minimize the<br />
risks associated with transfusions. Identifying correctable<br />
causes of anaemia, using ESAs thoughtfully, providing adequate<br />
iron stores and improved understanding of reasons<br />
for blood transfusion use may help reduce that use.<br />
Our study is inherently limited by its retrospective design.<br />
Furthermore, we had no information on the numbers<br />
of or reasons for transfusions given to individual patients,<br />
as indications for giving transfusions are not available in<br />
claim data. Importantly, some non-anaemic CKD patients<br />
not receiving ESAs received transfusions. This most likely<br />
represents transfusions given due to trauma, surgical procedure<br />
or gastrointestinal bleeding. It may also reflect a<br />
general feeling in the medical community that sick patients,<br />
particularly those with heart disease, benefit from<br />
higher haemoglobin levels, despite lack of evidence to<br />
support such practice (11). This latter possibility needs<br />
to be substantiated. Also relevant is the unavailability of<br />
haemoglobin levels at which transfusions took place; this<br />
limits the ability to draw conclusions regarding whether the<br />
haemoglobin threshold at which clinicians transfuse CKD<br />
patients changed during this study period.<br />
Our study used administrative claim data to define blood<br />
transfusion occurrences. The accuracy of billing data for<br />
identifying blood transfusions is unknown, but is likely<br />
similar to the accuracy for other procedures, given that<br />
reimbursement is tied to accurate claim submission and<br />
erroneous claims are considered fraud. Finally, the temporal<br />
trends in blood transfusion use may not be causally<br />
related to increasing ESA use, but to other factors, such as<br />
a decreased role of blood transfusions in medical practice,<br />
as suggested by the decline in transfusion rates for nonanaemic<br />
non-CKD patients between 1992 and 2004. The<br />
former possibility, however, remains more likely.<br />
In conclusion, these data indicate an encouraging decline<br />
in transfusion rates for both CKD and non-CKD Medicare<br />
patients, and ESA use is largely responsible for the observed<br />
reduction in transfusion use in the setting of CKD. More<br />
research is needed to better identify potentially avoidable<br />
transfusions, as understanding the reasons for transfusion<br />
use may lead to thoughtful avoidance of those that are not<br />
absolutely necessary.<br />
Acknowledgements. The authors thank Chronic Disease Research Group<br />
colleagues Shane Nygaard, BA, for manuscript preparation, and Nan<br />
Booth, MSW, MPH, for manuscript editing.<br />
Conflicts of interest statement. This study was supported by a research<br />
contract from <strong>Amgen</strong> Inc., Thousand Oaks, CA, USA. The contract provides<br />
for the authors to have final determination of the content of this<br />
manuscript. D.T.G. has received consulting fees from <strong>Amgen</strong>. H.N.I. and<br />
A.I. consult for, and H.G. is employed by, the Chronic Disease Research<br />
Group.<br />
References<br />
Page 99<br />
1. Higgins MR, Grace M, Ulan RA et al. <strong>Anemia</strong> in hemodialysis patients.<br />
Arch Intern Med 1977; 137: 172–176<br />
2. Goodnough LT, Monk TG, Andriole GL. Erythropoietin therapy. N<br />
EnglJMed1997; 336: 933–938<br />
3. Jones M, Ibels L, Schenkel B et al. Impact of epoetin alfa on clinical<br />
end points in patients with chronic renal failure: a meta-analysis.<br />
Kidney Int 2004; 65: 757–767<br />
4. Ross SD, Fahrbach K, Frame D et al. The effect of anemia treatment on<br />
selected health-related quality-of-life domains: a systematic review.<br />
Clin Ther 2003; 25: 1786–1805<br />
5. Delano BG. Improvements in quality of life following treatment with<br />
r-HuEPO in anemic hemodialysis patients. Am J Kidney Dis 1989;<br />
14(Suppl 1): 14–18<br />
6. Beusterien KM, Nissenson AR, Port FK et al. The effects of recombinant<br />
human erythropoietin on functional health and wellbeing<br />
in chronic dialysis patients. J Am Soc Nephrol 1996; 7: 763–<br />
773<br />
7. Ibrahim H, Ishani A, Foley RN et al. Temporal trends in red blood<br />
transfusions among US dialysis patients, 1992–2005. Am J Kidney<br />
Dis 2008; 52: 1115–1121<br />
8. Kleinman S, Chan P, Robillard P. Risks associated with transfusion<br />
of cellular blood components in Canada. Transfus Med Rev 2003; 17:<br />
120–162<br />
9. Hakim RM, Stivelman JC, Schulman G et al. Iron overload and mobilization<br />
in long-term hemodialysis patients. AmJKidneyDis1987;<br />
10: 293–299<br />
10. Cardarelli F, Pascual M, Tolkoff-Rubin N et al. Prevalence and significance<br />
of anti-HLA and donor-specific antibodies long-term after<br />
renal transplantation. Transpl Int 2005; 18: 532–540<br />
11. Besarab A, Bolton WK, Browne JK et al. The effects of normal as<br />
compared with low hematocrit values in patients with cardiac disease<br />
who are receiving hemodialysis and epoetin. N Engl J Med 1998; 339:<br />
584–590<br />
Received for publication: 20.2.09; Accepted in revised form: 17.4.09
Temporal Trends in Red Blood Transfusion Among US Dialysis<br />
Patients, 1992-2005<br />
Hassan N. Ibrahim, MD, MS, 1,2 Areef Ishani, MD, MS, 1,2 Robert N. Foley, MB, 1 Haifeng Guo, MS, 1<br />
Jiannong Liu, PhD, 1 and Allan J. Collins, MD, FACP 1,2<br />
Background: Studies addressing patterns and trends in red blood cell transfusion use in US<br />
hemodialysis patients surprisingly have received little attention in the last decade.<br />
Study Design: Retrospective cohort study.<br />
Setting & Participants: Point prevalent (as of January 1 of each calendar year 1992 to 2005) dialysis<br />
patients with Medicare Part A and Part B as primary insurance (n � 77,347 in 1992, n � 164,933 in<br />
2005). The 6 months preceding January 1 of each year were used to assemble a comorbidity profile<br />
based on administrative claims data.<br />
Predictors: Hemoglobin levels, patient characteristics, comorbid conditions.<br />
Outcomes: Blood transfusion events obtained from Part A and Part B files using code files for both<br />
whole and packed red blood cell transfusions and hemoglobin levels.<br />
Measurements: Comorbid conditions were defined by the presence of 1 or more inpatient/outpatient<br />
institutional claims (inpatient hospitalization, skilled nursing facility, or home health agency), 2 or more<br />
outpatient or physician/supplier claims, or 1 or more outpatient and 1 or more physician/supplier claims<br />
for atherosclerotic heart disease, congestive heart failure, cerebrovascular accidents/transient ischemic<br />
attacks, peripheral vascular disease, other cardiovascular diseases, chronic obstructive pulmonary<br />
disease, gastrointestinal disorders, liver disease, arrhythmia, and diabetes mellitus.<br />
Results: Raw transfusion rates decreased in both outpatient and inpatient settings from 535.33/1,000<br />
patient-years for 1992 prevalent dialysis patients to 263.65/1,000 patient-years in 2005 (P for trend �<br />
0.001, 1992 versus 1999 and 1999 versus 2005). Adjusted rates decreased similarly. This phenomenon<br />
could not be explained by changes in case mix.<br />
Limitations: Cause, effect, and confounding cannot be separated in this observational study. The<br />
accuracy of blood transfusion billing data is unknown. Temporal trends may be related to factors other<br />
than erythropoiesis-stimulating agent use.<br />
Conclusion: Transfusion events in hemodialysis patients decreased more than 2-fold from 1992 to<br />
2005; most of the decrease occurred in the first 5 years after erythropoietin was introduced.<br />
Am J Kidney Dis 52:1115-1121. © 2008 by the National Kidney Foundation, Inc.<br />
INDEX WORDS: Erythropoiesis-stimulating agents; hemodialysis; transfusions.<br />
<strong>Anemia</strong>, almost a universal feature of endstage<br />
renal disease (ESRD), is caused<br />
largely by lack of erythropoietin production from<br />
the failed kidneys. 1,2 In 1989, epoetin alfa (EPO),<br />
the first erythropoiesis-stimulating agent (ESA),<br />
was approved by the US Food and Drug Administration<br />
for use in dialysis patients. The introduction<br />
of ESAs to the care of dialysis patients has<br />
been linked to improved quality of life and<br />
well-being. 3-6 However, concerns have emerged<br />
recently regarding the safety of exceeding recommended<br />
hemoglobin levels (ie, �13 g/dL) because<br />
ESAs have been linked to increased risk of<br />
cardiovascular events. 7,8 This concern prompted<br />
the Food and Drug Administration to include a<br />
black box warning on ESA package inserts stating<br />
“Patients experienced greater risk of death<br />
and serious cardiovascular events when administered<br />
erythropoiesis stimulating agents to target<br />
higher versus lower hemoglobin level . . .” and,<br />
“. . . the lowest dose needed to avoid red blood<br />
Page 100<br />
cell transfusions” should be used. 9,10 Although it<br />
commonly is held that the introduction of ESAs<br />
to the care of the ESRD population has resulted<br />
in decreased need for blood transfusions, there is<br />
no information about the impact of ESA therapy<br />
on the rate of blood transfusions in US dialysis<br />
patients beyond a single publication from 1 center.<br />
11 The 1995 US Renal Data System Annual<br />
From the 1 Chronic Disease Research Group, Minneapolis<br />
Medical Research Foundation; and 2 University of Minnesota,<br />
Minneapolis, MN.<br />
Received February 25, 2008. Accepted in revised form<br />
July 7, 2008. Originally published online as doi:<br />
10.1053/j.ajkd.2008.07.022 on September 29, 2008.<br />
Address correspondence to Hassan N. Ibrahim, MD, MS,<br />
Division of Renal Diseases and Hypertension, University of<br />
Minnesota, 717 Delaware St SE, Ste 353, MMC 1932,<br />
Minneapolis, MN 55414. E-mail: ibrah007@umn.edu<br />
© 2008 by the National Kidney Foundation, Inc.<br />
0272-6386/08/5206-0012$34.00/0<br />
doi:10.1053/j.ajkd.2008.07.022<br />
American Journal of Kidney Diseases, Vol 52, No 6 (December), 2008: pp 1115-1121 1115
1116<br />
Data Report provides the only large published<br />
evidence documenting a decrease in the fraction<br />
of dialysis patients receiving transfusions nationally<br />
in the outpatient dialysis setting during the<br />
period spanning the introduction of EPO. 12<br />
Considering the paucity of information quantifying<br />
the impact of ESAs on the frequency of<br />
blood transfusions in the dialysis population, we<br />
used US Renal Data System data to address this<br />
issue between 1992 and 2005.<br />
METHODS<br />
Study Population<br />
Point-prevalent dialysis patients with Medicare Part A and<br />
Part B as their primary insurance source were studied as of<br />
January 1 of each calendar year. The preceding 6 months<br />
were used to assemble a comorbidity profile based on<br />
administrative claims data. The first cohort consisted of<br />
point prevalent dialysis patients on January 1, 1992, and the<br />
last cohort consisted of point prevalent dialysis patients on<br />
January 1, 2005. Each annual cohort was followed up for<br />
transfusion events for 1 year.<br />
Excluded Patients<br />
Patients without Medicare Part A and Part B as their<br />
primary insurance at the beginning of each cohort year were<br />
excluded. We also excluded dialysis patients with evidence<br />
of cancer or blood dyscrasias during the 6-month entry<br />
period for each year because these patients can be hyporesponsive<br />
to ESA therapy and may require multiple transfusions<br />
not directly related to ESRD. Relevant diagnoses with<br />
International Classification of Diseases, Ninth Edition, Clinical<br />
Modification codes included cancer (140.xx to 172.xx,<br />
174.xx to 208.xx, 230.xx to 231.xx, and 233.xx to 234.xx),<br />
hereditary hemolytic anemia (282.x), acquired hemolytic<br />
anemia (codes 283.x), aplastic anemia and other bone marrow<br />
failure syndromes (284.x), coagulation defects (286.x),<br />
myeloma (203.0x), myelofibrosis (289.89), and myelodysplasia<br />
(238.7). Patients who did not survive the entry period<br />
were also excluded. After these exclusions, approximately<br />
85% of patients from each year constituted the final cohort.<br />
Including the excluded patients in the analysis did not alter<br />
results (data not shown).<br />
Measurements<br />
Comorbid conditions were defined by the presence of 1<br />
Part A or Part B claim for atherosclerotic heart disease<br />
(410.xx to 414.xx and V45.18 to V45.82), congestive heart<br />
failure (398.91, 422.xx, 425.xx, 428.xx, 402.x1, 404.x1,<br />
404.x3, and V42.1), cerebrovascular accident/transient ischemic<br />
attack (430.xx to 438.xx), peripheral vascular disease<br />
(440.xx to 44.xx, 447.xx, 451.xx to 453.xx, and 557.xx),<br />
other cardiovascular diseases (420.xx to 421.xx, 423.xx to<br />
424.xx, 429.xx, 785.0 to 785.3, V42.2, and V43.3), chronic<br />
obstructive pulmonary disease (491.xx to 494.xx, 496.xx,<br />
and 510.xx), gastrointestinal disorders (456.0 to 456.2, 530.7,<br />
531.xx to 534.xx, 569.84, 569.85, and 578), liver disease<br />
Page 101<br />
Ibrahim et al<br />
(570.xx, 571.xx, 572.1, 572.4, 573.1 to 573.3, and V42.7),<br />
arrhythmia (426.xx to 427.xx, V45.0, and V53.30), or diabetes<br />
mellitus (250.xx, 357.2, 362.0x, and 366.41).<br />
Outcomes<br />
Transfusions billed by dialysis facilities and those performed<br />
during inpatient hospital stays were obtained from<br />
Part A files by using code files for both whole and packed<br />
blood cell transfusions. Those obtained from Part B files<br />
included whole and packed red blood cell transfusions<br />
regardless of whether these were leukocyte reduced, irradiated,<br />
or deglycerolized. ESA use was defined by using<br />
Healthcare Common Procedure Coding System codes. For<br />
patients with more than 1 ESA claim in 1 month, average<br />
hemoglobin levels were obtained for that month. Hemoglobin<br />
levels greater than 18.3 g/dL or less than 3.3 g/dL were<br />
considered invalid and coded as missing (hemoglobin in<br />
g/dL may be converted to g/L by multiplying by 10).<br />
Analysis<br />
The transfusion event raw rate was calculated from total<br />
number of transfusion events divided by total follow-up<br />
time. Patients were censored at death, transplantation, loss to<br />
follow-up, or end of Medicare coverage. Poisson regression<br />
was used to determine the adjusted transfusion rates. The<br />
prevalent cohort from calendar year 1992 was used as the<br />
reference group. The Poisson model included the covariates<br />
age, sex, race, primary cause of ESRD, dialysis vintage, and<br />
the variables determined during the entry period for each<br />
cohort: average hemoglobin level, parenteral iron use, length<br />
of stay during hospital admissions, and comorbid conditions.<br />
Because some patients may appear in more than 1 year<br />
in the Poisson model, we compared transfusion rates in 1992<br />
with rates in 1999 and 1999 to 2005. Overlap thus was less<br />
than 10%, but we nevertheless accounted for the correlation<br />
of transfusion rates over time for the same patient.<br />
RESULTS<br />
The 1992 cohort included 77,347 prevalent<br />
dialysis patients (Table 1). The composition of<br />
the prevalent cohort changed considerably over<br />
time, including increases in mean age, proportion<br />
of the population older than 75 years, and<br />
number of patients initiating dialysis therapy<br />
because of diabetes. However, the most striking<br />
change was the increase in proportion of dialysis<br />
patients with multiple comorbid conditions, particularly<br />
cardiovascular disease.<br />
The percentage of patients with hemoglobin<br />
values less than 11 g/dL decreased steadily, from<br />
64.0% in 1992 to 11.9% in 2004 (Table 2). In<br />
parallel, the proportion of patients with hemoglobin<br />
values greater than 12 g/dL increased from<br />
0.5% in 1992 to 38.2% in 2004. Concurrent with<br />
the increasing fraction of patients with hemoglobin<br />
values greater than 12 g/dL, the proportion of
Table 1. Characteristics of Prevalent Dialysis Cohorts, 1992 to 2004 (even years shown)<br />
patients receiving more than 58,000 U/mo of<br />
ESA increased by almost 10-fold. Similarly, the<br />
fraction of dialysis patients receiving parenteral<br />
iron increased substantially, from just 0.3% in<br />
1992 to 71.6% in 2004.<br />
Figure 1 shows average hemoglobin levels in<br />
the 3 months preceding and 3 months after the<br />
transfusion month. The transfusion month, as<br />
expected, coincided with the lowest hemoglobin<br />
level of the study period in all cohorts studied.<br />
Interestingly, the hemoglobin threshold at which<br />
prevalent dialysis patients receive transfusions<br />
has steadily increased over the years. This threshold<br />
increased from 9.0 g/dL in 1992 to almost<br />
Cohort Year<br />
1992 1994 1996 1998 2000 2002 2004<br />
Page 102<br />
ESAs and Blood Transfusions 1117<br />
Characteristics (n � 77,347) (n � 89,815) (n � 100,540) (n � 109,685) (n � 121,133) (n � 140,227) (n � 157,960)<br />
Age (y) 57.9 � 16.0 58.4 � 16.1 58.9 � 16.0 59.3 � 15.9 59.8 � 15.8 60.2 � 15.7 60.6 � 15.6<br />
0-44 17,364 (22.5) 19,455 (21.7) 20,517 (20.4) 21,476 (19.6) 22,563 (18.6) 24,472 (17.5) 25,895 (16.4)<br />
44-64 28,256 (36.5) 32,180 (35.8) 36,636 (36.4) 40,468 (36.9) 44,999 (37.2) 53,420 (38.1) 61,684 (39.1)<br />
65-74 20,588 (26.6) 24,064 (26.8) 26,485 (26.3) 28,119 (25.6) 30,281 (25.0) 34,051 (24.3) 37,548 (23.8)<br />
�75 11,139 (14.4) 14,116 (15.7) 16,902 (16.8) 19,622 (17.9) 23,290 (19.2) 28,284 (20.2) 32,833 (20.8)<br />
Men 39,769 (51.4) 46,142 (51.4) 51,808 (51.5) 56,756 (51.7) 62,809 (51.9) 74,018 (52.8) 83,919 (53.1)<br />
Race<br />
White 43,759 (56.6) 49,310 (54.9) 55,542 (55.2) 58,240 (53.1) 63,136 (52.1) 74,697 (53.3) 83,588 (52.9)<br />
African American 31,045 (40.1) 37,056 (41.3) 40,626 (40.4) 45,790 (41.8) 51,382 (42.4) 57,182 (40.8) 64,657 (40.9)<br />
Asian/other 2,543 (3.3) 3,449 (3.8) 4,372 (4.4) 5,655 (5.2) 6,615 (5.5) 8,348 (6.0) 9,715 (6.2)<br />
Primary cause of ESRD<br />
Diabetes 21,316 (27.6) 27,244 (30.3) 33,487 (33.3) 39,579 (36.1) 46,402 (38.3) 56,434 (40.2) 66,279 (42.0)<br />
Hypertension 24,254 (31.4) 29,037 (32.3) 32,029 (31.9) 33,454 (30.5) 36,077 (29.8) 40,835 (29.1) 45,786 (29.0)<br />
Glomerulonephritis 14,076 (18.2) 15,355 (17.1) 16,397 (16.3) 17,021 (15.5) 17,912 (14.8) 19,528 (13.9) 20,559I (13.0)<br />
Cystic kidney disease 3,810 (4.9) 3,853 (4.3) 4,029 (4.0) 3,899 (3.6) 3,878 (3.2) 4,249 (3.0) 4,484 (2.8)<br />
Other urological 2,347 (3.0) 2,464 (2.7) 2,544 (2.5) 2,923 (2.7) 3,221 (2.7) 3,824 (2.7) 4,116 (2.6)<br />
Other cause 7,562 (9.8) 8,207 (9.1) 8,507 (8.5) 8,908 (8.1) 9,413 (7.8) 10,501 (7.5) 11,282 (7.1)<br />
Unknown cause 3,294 (4.3) 3,332 (3.7) 3,361 (3.3) 3,773 (3.4) 4,139 (3.4) 4,771 (3.4) 5,336 (3.4)<br />
Missing 688 (0.9) 323 (0.4) 186 (0.2) 128 (0.1) 91 (0.1) 85 (0.1) 118 (0.1)<br />
Vintage (y)<br />
�1 17,449 (22.6) 20,352 (22.7) 22,984 (22.9) 22,728 (20.7) 23,943 (19.8) 27,504 (19.6) 30,415 (19.3)<br />
1-5 31,554 (40.8) 38,258 (42.6) 43,301 (43.1) 48,935 (44.6) 54,251 (44.8) 63,179 (45.1) 72,183 (45.7)<br />
�5 28,344 (36.7) 31,205 (34.7) 34,255 (34.1) 38,022 (34.7) 42,939 (35.5) 49,544 (35.3) 55,362 (35.1)<br />
Hospital stay (d)<br />
0 47,779 (61.8) 56,360 (62.8) 62,654 (62.3) 68,822 (62.8) 75,143 (62.0) 86,494 (61.7) 97,731 (61.9)<br />
1-3 10,531 (13.6) 12,907 (14.4) 15,735 (15.7) 17,830 (16.3) 20,171 (16.7) 23,567 (16.8) 25,746 (16.3)<br />
4-6 7,316 (9.5) 8,189 (9.1) 9,475 (9.4) 10,137 (9.2) 11,201 (9.3) 13,171 (9.4) 15,418 (9.8)<br />
�6 11,721 (15.2) 12,359 (13.8) 12,676 (12.6) 12,896 (11.8) 14,618 (12.1) 16,995 (12.1) 19,065 (12.1)<br />
Comorbid conditions<br />
ASHD/CHF/dys/other 35,908 (46.4) 42,731 (47.6) 63,263 (62.9) 58,920 (53.7) 65,405 (54.0) 92,266 (65.8) 92,435 (58.5)<br />
CVA/TIA/PVD 21,129 (27.3) 28,437 (31.7) 34,662 (34.5) 38,280 (34.9) 42,412 (35.0) 50,902 (36.3) 60,000 (38.0)<br />
GI/liver disease 14,547 (18.8) 17,778 (21.2) 20,404 (22.7) 25,835 (27.6) 31,515 (26.0) 23,245 (16.6) 24,615 (15.6)<br />
COPD 5,930 (7.7) 8,046 (9.0) 10,073 (10.0) 11,958 (10.9) 14,009 (11.6) 17,826 (12.7) 23,052 (14.6)<br />
Diabetes 23,306 (30.1) 30,637 (34.1) 40,718 (40.5) 48,841 (44.5) 56,077 (46.3) 71,390 (50.9) 86,748 (54.9)<br />
Note: Values expressed as mean � SE or number (percent).<br />
Abbreviations: ASHD, atherosclerotic heart disease; CHF, congestive heart failure; COPD, chronic obstructive pulmonary<br />
disease; CVA, cerebrovascular accident; dys, dysrhythmia; ESRD, end-stage renal disease; GI, gastrointestinal; PVD,<br />
peripheral vascular disease; TIA, transient ischemic attack.<br />
10.3 g/dL in 2004. Most of the increase occurred<br />
between 1992 and 2000, from 9.0 to 10.0 g/dL.<br />
To simplify comparisons, we show trends in<br />
blood transfusions in relation to patient age, sex,<br />
race, primary cause of kidney disease, dialysis<br />
vintage, and comorbid conditions for 1992, 1999,<br />
and 2005 only (Table 3). Blood transfusion use<br />
decreased steadily for patients aged 0 to 44 years<br />
while increasing steadily for patients older than<br />
75 years. Women received more transfusions<br />
than men in each of the 3 years, and white<br />
patients received about 55% of all transfusions.<br />
In 2005, 45.2% of patients with diabetes as<br />
primary cause of ESRD received transfusions
1118<br />
Table 2. Hemoglobin, Erythropoiesis-Stimulating Agent, and Iron Use Trends, 1992 to 2004 (even years shown)<br />
compared with 30.4% in 1992. Conversely,<br />
only 16.2% of patients with glomerulonephritis<br />
as primary cause of ESRD received transfusions<br />
in 1992 compared with even fewer,<br />
11.4%, in 2005. Dialysis vintage in relation to<br />
transfusion use was fairly constant throughout<br />
the observation period. The largest increase in<br />
blood transfusion use was in patients with<br />
atherosclerotic heart disease or congestive heart<br />
failure.<br />
Raw transfusion rates decreased considerably<br />
over time, from 535.33 (95% confidence interval,<br />
528.48 to 542.27) transfusions/1,000 patientyears<br />
in 1992 to 263.65 (95% confidence interval,<br />
261.04 to 266.29) transfusions/1,000 patientyears<br />
in 2005 (Table 4). Multivariate analysis<br />
excluding hemoglobin level yielded similar results.<br />
However, additional adjustment for hemo-<br />
Cohort Year<br />
1992 1994 1996 1998 2000 2002 2004<br />
(n � 77,347) (n � 89,815) (n � 100,540) (n � 109,685) (n � 121,133) (n � 140,227) (n � 157,960)<br />
Hemoglobin (g/dL) 9.7 � 1.0 10.1 � 1.0 10.5 � 1.0 10.9 � 0.8 11.5 � 1.0 11.7 � 1.0 11.8 � 0.9<br />
0-�11 49,471 (64.0) 58,160 (64.8) 54,345 (54.1) 48,704 (44.4) 27,398 (22.6) 23,507 (16.8) 18,775 (11.9)<br />
�11-�12 4,453 (5.8) 10,411 (11.6) 23,452 (23.3) 40,642 (37.1) 49,005 (40.5) 60,484 (43.1) 65,070 (41.2)<br />
�12 404 (0.5) 1,071 (1.2) 3,194 (3.2) 4,599 (4.2) 30,482 (25.2) 42,073 (30.0) 60,336 (38.2)<br />
Missing/unknown<br />
Total ESA use/mo<br />
23,019 (29.8) 20,173 (22.5) 19,549 (19.4) 15,740 (14.4) 14,248 (11.8) 14,163 (10.1) 13,779 (8.7)<br />
None 23,125 (29.9) 19,988 (22.3) 18,973 (18.9) 15,506 (14.1) 14,244 (11.8) 14,085 (10.0) 13,631 (8.6)<br />
0-�28,000 units 31,676 (41.0) 31,786 (35.4) 29,336 (29.2) 32,791 (29.9) 28,866 (23.8) 33,586 (24.0) 36,514 (23.1)<br />
28,000-�58,000 units 18,884 (24.4) 27,234 (30.3) 31,298 (31.1) 35,219 (32.1) 36,086 (29.8) 41,957 (29.9) 46,233 (29.3)<br />
�58,000 units 3,662 (4.7) 10,807 (12.0) 20,933 (20.8) 26,169 (23.9) 41,937 (34.6) 50,599 (36.1) 61,582 (39.0)<br />
Iron use (yes) 258 (0.3) 22,601 (25.2) 36,781 (36.6) 63,678 (58.1) 75,385 (62.2) 83,718 (59.7) 113,03 (71.6)<br />
Note: Values expressed as mean � SE or number (percent). Hemoglobin in g/dL may be converted to g/L by<br />
multiplying by 10.<br />
Abbreviation: ESA, erythropoiesis-stimulating agent.<br />
Mean hemoglobin level in g/dL<br />
12.0<br />
11.5<br />
11.0<br />
10.5<br />
10.0<br />
9.5<br />
9.0<br />
1992 1994 1996 1998 2000 2002 2004<br />
-3 -2 -1 0 1 2 3<br />
Month<br />
Page 103<br />
Ibrahim et al<br />
globin levels showed that in more recent years,<br />
transfusion rates at any hemoglobin level had<br />
increased again. The difference between rates in<br />
1992 and 1999 and 1999 and 2005 and after<br />
accounting for patient correlation at these 2 times<br />
was significant; P for trend � 0.001 for both<br />
tests. Transfusion rates from the raw and the 2<br />
adjusted models are shown in Fig 2. The major<br />
decrease in transfusions occurred between 1992<br />
and 1997, but rates reached a plateau thereafter.<br />
DISCUSSION<br />
Our results show a dramatic decrease in blood<br />
transfusions in prevalent dialysis patients spanning<br />
the study period from 1992 to 2005. Associated<br />
with this decrease in blood transfusions was<br />
a simultaneous increase in average ESA dose<br />
administered to dialysis patients and average<br />
Figure 1. Mean hemoglobin<br />
levels at month of transfusion � 3<br />
months in prevalent dialysis patients<br />
from 1992 to 2004. Hemoglobin<br />
in g/dL may be converted to<br />
g/L by multiplying by 10.
Table 3. Characteristics of Prevalent Dialysis Patients Receiving Blood Transfusions, 1992, 1999, and 2005<br />
Characteristics<br />
reported hemoglobin concentration. Patients with<br />
atherosclerotic heart disease, congestive heart<br />
failure, or diabetes and those older than 75 years<br />
experienced the greatest increase in blood transfusion<br />
frequency. However, these temporal trends<br />
persisted in models accounting for differences in<br />
case mix.<br />
EPO was first introduced in 1989, with a<br />
primary indication for blood transfusion minimization<br />
in dialysis patients. Before the widespread<br />
adoption of ESA therapy in dialysis patients,<br />
anemia, blood transfusions, and consequently<br />
iron overload were common occurrences. Since<br />
Transfusions 1992 Transfusions 1999 Transfusions 2005<br />
No Yes No Yes No Yes<br />
No. of<br />
Patients %<br />
No. of<br />
Patients %<br />
No. of<br />
Patients %<br />
No. of<br />
Patients %<br />
No. of<br />
Patients %<br />
Page 104<br />
ESAs and Blood Transfusions 1119<br />
No. of<br />
Patients %<br />
All 57,869 74.8 19,478 25.2 96,490 84.0 18,340 16.0 139,114 84.4 25,819 15.7<br />
Age (y)<br />
0-44 13,298 76.6 4,066 23.4 18,654 85.5 3,174 14.5 22,734 85.8 3,771 14.2<br />
45-64 21,219 75.1 7,037 24.9 35,583 84.4 6,603 15.7 55,341 85.0 9,760 15.0<br />
65-74 15,173 73.7 5,415 26.3 24,346 83.1 4,946 16.9 32,258 83.1 6,557 16.9<br />
�75 8,179 73.4 2,960 26.6 17,907 83.2 3,617 16.8 28,781 83.4 5,731 16.6<br />
Sex<br />
Men 30,806 77.5 8,963 22.5 50,907 85.7 8526 14.4 75,456 85.6 12,693 14.4<br />
Women 27,063 72.0 10,515 28.0 45,583 82.3 9814 17.7 63,658 82.9 13,126 17.1<br />
Race<br />
White 32,970 75.3 10,789 24.7 50,569 83.9 9,685 16.1 73,077 83.7 14,219 16.3<br />
African American 22,941 73.9 8,104 26.1 40,823 84.1 7,694 15.9 57,206 85.2 9,966 14.8<br />
Asian 1,232 77.1 365 22.9 2,878 84.7 521 15.3 5,177 84.8 930 15.2<br />
Other 726 76.7 220 23.3 2,220 83.5 440 16.5 3,654 83.9 704 16.2<br />
Primary cause of ESRD<br />
Diabetes 15,393 72.2 5,923 27.8 35,384 82.4 7,576 17.6 58,644 83.4 11,678 16.6<br />
Hypertension 18,013 74.3 6,241 25.7 29,272 84.8 5,254 15.2 40,665 85.0 7,158 15.0<br />
Glomerulonephritis 10,927 77.6 3,149 22.4 14,980 85.9 2,466 14.1 17,709 85.8 2,944 14.3<br />
Other/missing/unknown 13,536 76.5 4,165 23.5 16,854 84.7 3,044 15.3 22,096 84.6 4,039 15.5<br />
Vintage (y)<br />
�1 12,911 74.0 4,538 26.0 19,544 84.3 3,643 15.7 26,531 85.0 4,695 15.0<br />
1-�5 23,492 74.5 8,062 25.6 42,975 83.9 8,272 16.1 63,609 84.2 11,953 15.8<br />
�5 21,466 75.7 6,878 24.3 33,971 84.1 6,425 15.9 48,974 84.2 9,171 15.8<br />
Comorbid conditions<br />
ASHD 11,524 69.0 5,174 31.0 37,254 80.7 8,927 19.3 64,840 81.5 14,686 18.5<br />
CHF 10,992 66.5 5,529 33.5 38,484 80.2 9,507 19.8 61,557 81.2 14,263 18.8<br />
CVA/TIA 4,343 66.8 2,160 33.2 11,418 79.0 3,029 21.0 19,983 79.5 5,151 20.5<br />
PVD 11,862 68.3 5,516 31.7 26,754 79.6 6,842 20.4 43,748 80.5 10,618 19.5<br />
Other cardiac 11,011 67.2 5,387 32.9 25,385 79.4 6,596 20.6 43,968 80.5 10,651 19.5<br />
COPD 4,032 68.0 1,898 32.0 9,988 78.7 2,699 21.3 19,862 79.7 5,054 20.3<br />
Gastrointestinal 3,690 61.2 2,340 38.8 7,188 74.7 2,429 25.3 10,080 75.6 3,251 24.4<br />
Liver disease 6,862 72.5 2,608 27.5 22,162 82.7 4,629 17.3 13,092 81.7 2,933 18.3<br />
Arrhythmia 8,879 68.8 4,023 31.2 18,597 80.0 4,645 20.0 31,492 80.3 7,744 19.7<br />
Diabetes 16,312 70.0 6,994 30.0 42,746 81.4 9,741 18.6 77,990 82.9 16,142 17.2<br />
Note: � 2 tests for comparing patients who received versus did not receive transfusions for all variables are significant<br />
except for race and vintage for 1999 (gray shaded cells).<br />
Abbreviations: ASHD, atherosclerotic heart disease; CHF, congestive heart failure; COPD, chronic obstructive pulmonary<br />
disease; CVA, cerebrovascular accident; ESRD, end-stage renal disease; PVD, peripheral vascular disease; TIA, transient<br />
ischemic attack.<br />
the introduction of ESAs, several observational<br />
and randomized studies have assessed different<br />
aspects of the risks and benefits of these therapies.<br />
3-8 Although firm conclusions regarding the<br />
risk-benefit ratio of ESA use are far from established,<br />
recent evidence has generated concern<br />
over targeting normal hemoglobin levels in patients<br />
with chronic kidney disease. 7,8<br />
Surprisingly few observational studies of transfusion<br />
use in dialysis populations have been performed,<br />
especially in more recent times. We are<br />
aware of only one previous study that assessed the<br />
impact of the introduction of EPO therapy on the
1120<br />
Table 4. Raw and Adjusted Transfusion Rates (per 1,000 patient-years), Prevalent Dialysis Patients, 1992 to 1995<br />
Year<br />
No. of<br />
Patients<br />
Raw Rates<br />
rate of blood transfusions in dialysis patients. 11<br />
This single-center study showed a substantial decrease<br />
in the rate of blood transfusions with the<br />
introduction of EPO (rates, 13.4/100 in 1988 and<br />
4.1/100 in 1991; P � 0.01). Our results, although<br />
observational, confirm the dramatic decrease in<br />
rate of blood transfusion during the past 14 years,<br />
with substantial increases in EPO therapy and average<br />
hemoglobin concentrations.<br />
Although blood transfusion use has decreased,<br />
it continues to be a frequent occurrence and, in<br />
recent years, has increased at any given hemoglobin<br />
concentration. The hemoglobin threshold at<br />
Transfusion Rates/1,000 Patient-Years<br />
Adjusted Rates, 1992 as Reference Year<br />
Page 105<br />
Ibrahim et al<br />
Hemoglobin Level Excluded Hemoglobin Level Included<br />
All Inpatient Outpatient All Inpatient Outpatient All Inpatient Outpatient<br />
1992 77,347 535.33 309.70 225.63 535.33 309.70 225.63 535.33 309.70 225.63<br />
1993 84,066 465.81 275.08 190.74 448.73 265.40 183.38 447.65 264.66 183.10<br />
1994 89,815 396.97 235.25 161.72 380.47 227.15 153.27 388.33 230.63 157.71<br />
1995 93,585 365.96 217.72 148.24 343.55 207.11 136.33 358.75 213.53 145.16<br />
1996 100,540 347.82 208.94 138.88 316.01 187.21 128.83 343.09 198.12 145.37<br />
1997 105,122 312.01 201.72 110.29 297.27 191.33 105.90 330.98 207.33 123.91<br />
1998 109,685 297.10 206.18 90.92 282.85 195.72 87.09 320.73 214.34 106.83<br />
1999 114,830 276.28 204.78 71.50 246.59 178.51 68.14 301.33 208.91 93.96<br />
2000 121,133 265.04 195.75 69.30 250.23 180.52 69.74 323.48 218.74 106.85<br />
2001 128,961 287.77 199.00 88.77 271.59 183.29 88.32 363.20 225.17 141.00<br />
2002 140,227 284.60 197.09 87.51 263.13 175.28 88.08 357.41 218.24 143.59<br />
2003 150,482 270.81 194.29 76.52 255.18 178.46 76.77 358.91 225.78 136.58<br />
2004 157,960 270.86 202.30 68.56 260.73 188.73 72.19 375.95 242.90 137.79<br />
2005 164,933 263.65 196.99 66.66 245.92 177.53 68.51 382.48 242.63 144.97<br />
Note: Prevalent dialysis patients in 1992 to 2005 with 90-day rule, initiated therapy at least 6 months before January 1 of<br />
each year, with Medicare Part A and Part B as primary payer as of December 31 of previous year. Patients are followed up<br />
until December 31 of each year and censored at death, transplantation, loss to follow-up, or payer status change.<br />
which transfusions occur has increased by about<br />
0.1 g/dL/y. This may be a direct consequence of<br />
the increasing comorbidity burden in dialysis<br />
patients and a general feeling in the medical<br />
community that sick patients, particularly those<br />
with heart disease, may benefit from higher hemoglobin<br />
levels despite lack of evidence to support<br />
such practice. 13 Red blood cell transfusions have<br />
intrinsic risks, including transfusion reactions,<br />
transmission of infectious agents, and iron overload.<br />
Before the widespread adoption of ESA<br />
therapy, 41% of dialysis patients were estimated<br />
to have iron overload, evidenced by ferritin level<br />
Figure 2. Transfusion event<br />
rates, prevalent dialysis patients,<br />
1992 to 2005; raw rates and adjusted<br />
rates including and excluding<br />
hemoglobin levels.
greater than 2,000 ng/mL (ferritin levels expressed<br />
in ng/mL and �g/L are equivalent). 14<br />
Other concerns include the costs associated with<br />
blood transfusions and the potential adverse effect<br />
of blood transfusions on the development of<br />
alloantibodies, which can prolong time on the<br />
kidney transplant waiting list and jeopardize the<br />
outcome of kidney transplantation. 15<br />
Our study has limitations. It is observational,<br />
with all the limitations associated with observational<br />
studies. In particular, cause, effect, and<br />
confounding cannot be separated. In addition,<br />
our study used administrative claims data to<br />
define the occurrence of blood transfusions. The<br />
accuracy of billing data for blood transfusions<br />
currently is unknown. However, claims data for<br />
blood transfusions likely are similar in accuracy<br />
to other procedures, given that reimbursement is<br />
tied to the accurate submission of claims and<br />
erroneous claims are considered fraud. Finally,<br />
the temporal trends in blood transfusions may<br />
not be causally related to increasing ESA use, but<br />
to other factors, such as a decreased role of blood<br />
transfusions in medical practice. However, if<br />
transfusions were decreasing solely because of a<br />
greater reluctance to administer transfusions, one<br />
would expect to observe a decrease in average<br />
hemoglobin values over time, but our results<br />
show the opposite phenomenon; average hemoglobin<br />
concentrations have increased during the<br />
past 13 years, and patients are administered transfusions<br />
at higher hemoglobin levels.<br />
Transfusion events in hemodialysis patients<br />
decreased more than 2-fold between 1992 and<br />
2005, with most of the decrease occurring in the<br />
first 5 years after ESA introduction.<br />
ACKNOWLEDGEMENTS<br />
The authors thank Chronic Disease Research Group colleagues<br />
Shane Nygaard, BA, for manuscript preparation,<br />
and Nan Booth, MSW, MPH, for manuscript editing.<br />
Support: Information for funding sources is listed in the<br />
financial disclosure.<br />
Financial Disclosure: This study was supported by a<br />
research contract from <strong>Amgen</strong> Inc, Thousand Oaks, CA, the<br />
manufacturer of a proprietary epoetin alfa. The contract<br />
provides for the authors to have final determination of the<br />
content of this manuscript. Dr Foley and Dr Collins have<br />
received consulting fees from <strong>Amgen</strong> and Roche.<br />
REFERENCES<br />
Page 106<br />
ESAs and Blood Transfusions 1121<br />
1. Goodnough LT, Monk TG, Andriole GL: Erythropoietin<br />
therapy. N Engl J Med 336:933-938, 1997<br />
2. Higgins MR, Grace M, Ulan RA, et al: <strong>Anemia</strong> in<br />
hemodialysis patients. Arch Intern Med 137:172-176, 1977<br />
3. Jones M, Ibels L, Schenkel B, et al: Impact of epoetin<br />
alfa on clinical end points in patients with chronic renal<br />
failure: A meta-analysis. Kidney Int 65:757-767, 2004<br />
4. Ross SD, Fahrbach K, Frame D, et al: The effect of<br />
anemia treatment on selected health-related quality-of-life domains:<br />
A systematic review. Clin Ther 25:1786-1805, 2003<br />
5. Delano BG: Improvements in quality of life following<br />
treatment with r-HuEPO in anemic hemodialysis patients.<br />
Am J Kidney Dis 14:14-18, 1989<br />
6. Beusterien KM, Nissenson AR, Port FK, et al: The<br />
effects of recombinant human erythropoietin on functional<br />
health and well-being in chronic dialysis patients. J Am Soc<br />
Nephrol 7:763-773, 1996<br />
7. Singh AK, Szczech L, Tang KL, et al: Correction of<br />
anemia with epoetin alfa in chronic kidney disease. N Engl<br />
J Med 355:2085-2098, 2006<br />
8. Drueke TB, Locatelli F, Clyne N, et al: Normalization<br />
of hemoglobin level in patients with chronic kidney disease<br />
and anemia. N Engl J Med 355:2071-2084, 2006<br />
9. Fishbane S, Nissenson AR: The new FDA label for<br />
erythropoietin treatment: How does it affect hemoglobin<br />
target? Kidney Int 72:806-813, 2007<br />
10. <strong>Amgen</strong>: Aranesp [package insert]. Thousand Oaks,<br />
CA, <strong>Amgen</strong>, 2007<br />
11. Goodnough LT, Strasburg D, Riddell J, et al: Has<br />
recombinant human erythropoietin therapy minimized redcell<br />
transfusions in hemodialysis patients? Clin Nephrol<br />
41:303-307, 1994<br />
12. US Renal Data System: USRDS 1995 Annual Data<br />
Report. The National Institutes of Health, National Institute<br />
of Diabetes and Digestive and Kidney Diseases, Bethesda,<br />
MD, 1995<br />
13. Besarbe A, Bolton K, Browne J, et al: The effects of<br />
normal as compared with low hematocrit values in patients<br />
with cardiac disease who are receiving hemodialysis and<br />
epoetin. N Engl J Med 339:584-590, 1989<br />
14. Hakim RM, Stivelman JC, Schulman G: Iron overload<br />
and mobilization in long-term hemodialysis patients.<br />
Am J Kidney Dis 10:293-299, 1987<br />
15. Cardarelli F, Pascual M, Tolkoff-Rubin N, et al:<br />
Prevalence and significance of anti-HLA and donor-specific<br />
antibodies long-term after renal transplantation. Transpl Int<br />
18:532-540, 2005
Kidney International, Vol. 60 (2001), pp. 741–747<br />
Novel erythropoiesis stimulating protein for treatment of<br />
anemia in chronic renal insufficiency<br />
FRANCESCO LOCATELLI, JESÚS OLIVARES, ROWAN WALKER, MARTIN WILKIE, BARBARA JENKINS,<br />
CLAIRE DEWEY, and STEPHEN J. GRAY, on behalf of the EUROPEAN/AUSTRALIAN<br />
NESP 980202 STUDY GROUP 1<br />
Divisione di Nefrologia e Dialisi, Ospedale A. Manzoni, Lecco, Italy; Servicio de Nefrología, Hospital General Universitario de<br />
Alicante, Alicante, Spain; Department of Nephrology, Royal Melbourne Hospital, Parkville Victoria, Australia; Sheffield Kidney<br />
Institute, Northern General Hospital NHS Trust, Sheffield, and <strong>Amgen</strong> Limited, Cambridge, England, United Kingdom<br />
1 In addition to the authors, the European/Australian NESP 980202<br />
Study Group consists of the following individuals (in alphabetical or-<br />
der): J. Braun (KfH Kuratorium für Dialyse und Neirentransplantation<br />
Novel erythropoiesis stimulating protein for treatment of<br />
anemia in chronic renal insufficiency.<br />
Background. Novel erythropoiesis stimulating protein (NESP)<br />
is a glycoprotein with a threefold longer terminal half-life than<br />
recombinant human erythropoietin (rHuEPO) in humans. The<br />
aim of this study was to determine whether NESP is effective<br />
for the treatment of anemia at a reduced dosing frequency<br />
relative to rHuEPO in patients with chronic renal failure not<br />
e.V., Nürnberg, Germany), Jacques Chanard (Hôpital Maison Blanche, yet on dialysis [chronic renal insufficiency (CRI)].<br />
Reims, France), Naomi Clyne (Karolinska Hospital, Stockholm, Sweden),<br />
Gerry A. Coles (University Hospital of Wales, Cardiff, Wales, UK),<br />
José M. Cruz (Hospital Universitario La Fe, Valencia, Spain), Marc<br />
De Broe (UZ Antwerpen, Edegen, Belgium), Angel M. Luis de Fran-<br />
cisco (Hospital de Valdecilla, Santander, Spain), Max Dratwa (Hôpital<br />
Universitaire Brugmann, Brussels, Belgium), Ram Gokal (Manchester<br />
Royal Infirmary, Manchester, England, UK ), Carola Grönhagen-Riska<br />
Methods. This was a multicenter, randomized, open-label<br />
study. A total of 166 rHuEPO-naive patients with CRI were<br />
randomized in a 3:1 ratio to receive NESP (0.45 �g/kg once<br />
weekly) or rHuEPO (50 U/kg twice weekly) administered<br />
subcutaneously for up to 24 weeks. Dose adjustments were<br />
made as necessary to achieve a hemoglobin response, defined<br />
(Helsinki University Hospital, Helsinki, Finland), Helmut Graf (Kran- as an increase �1.0 g/dL from baseline and a concentration<br />
kenanstalt Rudolfstiftung, Vienna, Austria), Levi Guerra (Hospital de<br />
São João, Porto, Portugal), Thierry Hannedouche (Hospices Civils,<br />
Strasbourg, France), David Harris (Westmead Hospital, Westmead, New<br />
South Wales, Australia), Carmel Hawley (Princess Alexandra Hospital,<br />
Woolloongabba, Queensland, Australia), Herwig Holzer (Medizinische<br />
Universitatklinik Graz, Graz, Austria), Michel Jadoul (UCL St. Luc,<br />
�11.0 g/dL.<br />
Results. During the 24-week treatment period, 93% (95%<br />
CI, 87 to 97%) of patients receiving NESP and 92% (95% CI, 78<br />
to 98%) of patients receiving rHuEPO achieved a hemoglobin<br />
response. The median time to response was seven weeks (range<br />
Brussels, Belgium), Peter Kerr (Monash Medical Centre, Clayton, Vic- of 3 to 25 weeks) in both groups. After correction of anemia,<br />
toria, Australia), W. Kösters (Dialyseninstitut, Vielingen-Schwenningen,<br />
Germany), Jean-Louis Lacombe (Clinique Saint-Exupéry, Toulouse,<br />
France), Norbert Lameire (UZ Ghent, Ghent, Belgium), J. Mann<br />
(Schwabing General Hospital, Munich, Germany), Paolo Marai (Ospe-<br />
dale A. Manzoni, Lecco, Italy), Maria Joao Pais (Hospital de Santa Cruz,<br />
Carnaxide, Portugal), Luis Piera (Hospital Universitario Vall D’Hebrón,<br />
mean hemoglobin concentrations were maintained within the<br />
target range of 11.0 to 13.0 g/dL for the remainder of the 24week<br />
treatment period. The safety profiles of NESP and rHuEPO<br />
were similar, and no antibodies were detected to either drug.<br />
Conclusions. These results demonstrate that NESP safely<br />
Barcelona, Spain), Pedro Ponce (Hospital Garcia da Orta, Almada, Por- and effectively corrects and maintains hemoglobin concentratugal),<br />
E. Quellhorst (Nephrologisches Zentrum Niedersachsen, Hannoversch-Münden,<br />
Germany), Emilio Rivolta (IRCCS Ospedale Maggiore<br />
di Milano, Milano, Italy), R.M. Schäfer (Medizinische Poliklinik, Mun-<br />
ster, Germany), G. Stein (Klinikum der Friedrich-Schiller-Universität,<br />
Jena, Germany), Marinus A. van den Dorpel (St. Clara Hospital, Rotterdam,<br />
The Netherlands), Christopher Winearls (Oxford Renal Unit, Ox-<br />
tions at a reduced dosing frequency relative to rHuEPO in<br />
patients with CRI, providing a potential benefit to patients and<br />
health care providers.<br />
ford, England, UK), and Carmine Zoccali (Azienda Ospedaliera Bianchi,<br />
Melacrino e Morelli, Reggio Calabria, Italy).<br />
Patients with chronic renal failure (CRF) frequently<br />
experience anemia, which can significantly affect their<br />
Key words: anemia, novel erythropoiesis stimulating factor, hemoglo-<br />
bin, recombinant human erythropoietin, red blood cell, and chronic<br />
renal insufficiency.<br />
morbidity, mortality, and quality of life. Recombinant<br />
human erythropoietin (rHuEPO) is effective for the treat-<br />
Received for publication December 19, 2000<br />
and in revised form February 23, 2001<br />
ment of anemia in CRF based on its ability to increase<br />
hemoglobin, virtually eliminate the need for red blood<br />
Accepted for publication March 1, 2001 cell transfusions, mitigate symptoms associated with ane-<br />
© 2001 by the International Society of Nephrology<br />
mia, and improve energy and physical functioning [1, 2].<br />
741<br />
Page 107
742<br />
Locatelli et al: NESP treatment in CRI<br />
Page 108<br />
However, in most patients, administration is required androgen therapy within eight weeks of the first planned<br />
two or three times per week.<br />
dose of study drug.<br />
Previous research on rHuEPO has indicated that its<br />
carbohydrate content significantly affects its half-life and Study design<br />
biological activity in vivo (abstract; Egrie, Glycoconj J This was a multicenter, randomized, open-label study.<br />
10:263, 1993). Novel erythropoiesis stimulating protein All patients completed a screening period within two<br />
(NESP; ARANESP�) is a glycoprotein that was de- weeks before the first dose of study drug. Eligible patients<br />
signed by introducing five amino acid changes into the were then randomized by a centralized system to receive<br />
primary sequence of rHuEPO to create two extra con- NESP or rHuEPO in a 3:1 ratio, respectively. NESP was<br />
sensus N-linked glycosylation sites. Consequently, NESP administered subcutaneously at a starting dose of 0.45<br />
has five N-linked carbohydrate chains, whereas rHuEPO �g/kg once weekly, and rHuEPO was administered sub-<br />
has only three. The increased carbohydrate content of cutaneously at a starting dose of 50 U/kg twice weekly.<br />
NESP results in a terminal half-life in humans that is The dose and frequency of NESP were chosen based on<br />
approximately threefold longer than that of rHuEPO experience in treating anemia in dialysis patients [5]. The<br />
after intravenous administration (25.3 hours vs. 8.5 hours, dose of rHuEPO was chosen to approximate the starting<br />
respectively) and at least twofold longer after subcutane- dose of NESP, based on a peptide mass conversion factor<br />
ous administration (48.8 hours vs. 18 to 24 hours, respec- (1.0 �g/kg NESP � 200 U/kg rHuEPO), and the fre-<br />
tively) [3, 4]. This unique pharmacokinetic profile allows quency of rHuEPO administration was chosen to reflect<br />
for a reduced dosing frequency, representing a potential the most commonly used frequency at the participating<br />
clinical advantage over rHuEPO [5].<br />
centers. Study drug dose was adjusted by 25% of the<br />
Preliminary studies have indicated that NESP, at a starting dose as necessary to achieve a hemoglobin instarting<br />
dose of 0.45 to 0.75 �g/kg, is safe and effective for crease of �1.0 g/dL from baseline and to maintain hemo-<br />
the treatment of anemia in patients with CRF receiving globin concentrations within a range of 11.0 to 13.0 g/dL.<br />
dialysis [5]. However, the effects of NESP have not been Additionally, if a patient’s hemoglobin increased by �2.0<br />
evaluated in patients with CRF not yet on dialysis [chronic g/dL during any four-week period, study drug doses were<br />
renal insufficiency (CRI)]. This multicenter, randomized, reduced by 25% of the starting dose. If a patient’s hemo-<br />
open-label study was designed to evaluate the efficacy globin concentration increased to �14.0 g/dL, study drug<br />
and safety of NESP in this patient population. The was withheld until the hemoglobin concentration fell<br />
rHuEPO treatment group was included to provide a below 12.0 g/dL and was restarted at a dose 25% lower<br />
reference reflecting current medical practice.<br />
than the previous dose. Patients received the first dose<br />
of study drug within seven days of randomization and<br />
METHODS<br />
Patients<br />
continued treatment for 24 weeks. After 24 weeks, patients<br />
receiving NESP could continue treatment, and<br />
patients receiving rHuEPO ended the study.<br />
Our study was approved by each institution’s indepen- The primary measure of efficacy was the proportion<br />
dent ethics committee, and all patients gave written in- of patients achieving a hemoglobin response during the<br />
formed consent before participation. Patients 18 years 24-week treatment period, defined as an increase in he-<br />
of age or older with a diagnosis of CRI were enrolled moglobin of �1.0 g/dL from baseline and a hemoglobin<br />
at 32 dialysis centers in Europe and 4 in Australia. Pa- concentration of �11.0 g/dL. For this assessment, hemotients<br />
were not receiving dialysis and were rHuEPO na- globin measurements were taken at two-week intervals<br />
ive (that is, had not received treatment with rHuEPO through the end of the 24-week treatment period. The<br />
within 12 weeks before the first planned dose of study efficacy of NESP was also evaluated by assessing the time<br />
drug). Additional entry criteria included a hemoglobin required to achieve a hemoglobin response, hemoglobin<br />
concentration �11.0 g/dL, adequate iron stores (as deter- concentration over time, the dose of study drug at the<br />
mined by serum ferritin �100 �g/L), serum vitamin B12 time of hemoglobin response and at week 24, and the<br />
and folate levels above the lower limit of the normal number of patients receiving red blood cell transfusions.<br />
range, and a creatinine clearance of �30 mL/min (as Measurements to evaluate hemoglobin concentration<br />
estimated by the Cockcroft-Gault equation). Exclusion over time were taken at four-week intervals (that is, at<br />
criteria included uncontrolled hypertension (diastolic weeks 5, 9, 13, 17, 21, and 25).<br />
blood pressure �100 mm Hg); congestive heart failure Safety was assessed by monitoring adverse events, lab-<br />
(New York Heart Association Class III or IV); hematooratory variables (hematology, biochemistry, and iron<br />
logic disorders that could cause anemia, systemic infec- status), vital signs, and antibody formation to NESP or<br />
tion or inflammatory disease; or other disorders that rHuEPO. In addition, the ability to increase hemoglobin<br />
could interfere with the response to NESP or rHuEPO. levels safely was evaluated by the maximum increase in<br />
Patients had not received a red blood cell transfusion or hemoglobin within any four-week period and the num-
Page 109<br />
Locatelli et al: NESP treatment in CRI 743<br />
ber of increases in hemoglobin �2.0, �2.5, or �3.0 g/dL<br />
within any four-week period. Hematology parameters<br />
Table 1. Patient demographic and baseline characteristics in novel<br />
erythropoiesis stimulating protein (NESP)- or recombinant human<br />
erythropoietin (rHuEP)-treated patientsa and vital signs were evaluated every two weeks throughout<br />
the study. Biochemistry parameters and antibody<br />
formation were evaluated every 12 weeks, and iron status<br />
was evaluated every four weeks.<br />
NESP rHuEPO<br />
(N � 129) (N � 37)<br />
Sex<br />
Men 70 (54%) 19 (51%)<br />
Study medications<br />
Women<br />
Race<br />
59 (46%) 18 (49%)<br />
Novel erythropoiesis stimulating protein was supplied<br />
by <strong>Amgen</strong> Inc. (Thousand Oaks, CA, USA). Recombi-<br />
Asian<br />
Black<br />
White<br />
3 (2%)<br />
3 (2%)<br />
123 (95%)<br />
1 (3%)<br />
0 (0%)<br />
36 (97%)<br />
Age years b nant human erythropoietin (Epoetin alfa) was obtained<br />
from commercial sources and provided by the pharmacy<br />
at each study center. To ensure adequate support of the<br />
Primary cause of renal failure<br />
Diabetes<br />
Hypertension<br />
60.4 (15.0)<br />
32 (25%)<br />
15 (12%)<br />
60.6 (15.7)<br />
8 (22%)<br />
1 (3%)<br />
erythropoietic response to study drug, intravenous iron<br />
therapy was required to be administered to patients with<br />
serum ferritin values �100 �g/L. The intravenous iron<br />
Glomerulonephritis<br />
Polycystic kidney disease<br />
Other urologic<br />
Other<br />
24 (19%)<br />
6 (5%)<br />
5 (4%)<br />
32 (25%)<br />
10 (27%)<br />
2 (5%)<br />
0 (0%)<br />
11 (30%)<br />
dosing regimen used for patients with serum ferritin val- Unknown<br />
Hemoglobin g/dL<br />
15 (12%) 5 (14%)<br />
b ues �100 �g/L or �100 �g/L was determined by the Serum ferritin lg/L<br />
9.3 (1.0) 9.8 (1.1)<br />
c Creatinine clearance mL/min<br />
168 (30–1420) 151 (31–899)<br />
b individual center’s treatment policy.<br />
15.7 (6.6) 15.7 (6.4)<br />
Statistical analysis<br />
a Baseline is defined as the closest measurement taken before the first dose<br />
of study drug<br />
All patients who received at least one dose of the<br />
study drug were included in the analyses of efficacy and<br />
safety. An additional, prospectively defined “per-protocol”<br />
analysis of efficacy was conducted in those patients<br />
b Mean (SD)<br />
c Median (range)<br />
who completed 24 weeks of treatment, had at least 75% tients receiving NESP or rHuEPO were diabetes mellitus<br />
of the postbaseline hemoglobin measurements, and re- and glomerulonephritis. Hypertension was the most<br />
ceived within �25% of their total prescribed dose of common medical condition among patients in both the<br />
study drug, no more than one incorrect dose of study NESP and rHuEPO groups at baseline (91 and 84%,<br />
drug, and no red blood cell transfusions before achieving respectively). The mean baseline hemoglobin concentra-<br />
a hemoglobin response. tion was lower in the NESP group (9.3 g/dL, range of<br />
Descriptive statistics were summarized for all end 6.6 to 11.0) than in the rHuEPO group (9.8 g/dL, range<br />
points according to the treatment group. This study was of 6.1 to 11.5; Table 1). Median baseline serum ferritin<br />
powered to evaluate whether a clinically meaningful pro- levels (168 and 151 �g/L in the NESP and rHuEPO<br />
portion of patients receiving NESP achieved a hemoglobin<br />
response, which was considered to be 50% of patients,<br />
but was not designed to compare NESP and<br />
rHuEPO. The sample size of at least 120 NESP patients<br />
was chosen to give a power of �99% for demonstrating<br />
groups, respectively) indicated that most patients were<br />
iron replete [6, 7]. Mean creatinine clearance was similar<br />
in the NESP (15.7 mL/min; range of 7 to 44) and rHuEPO<br />
(15.7 mL/min, range of 4 to 33) groups.<br />
that the response rate for NESP exceeds 50% (that is, Efficacy<br />
the lower limit of the confidence interval for the NESP<br />
response rate is �50%).<br />
A hemoglobin response (defined as an increase of<br />
�1.0 g/dL from baseline and a concentration �11.0 g/dL)<br />
was achieved by 93% (95% CI, 87 to 97%) of patients<br />
RESULTS receiving NESP during the 24-week treatment period.<br />
Patient characteristics<br />
Similarly, 92% (95% CI, 78 to 98%) of patients achieved<br />
Patients were randomized to receive NESP (129 pa-<br />
tients) or rHuEPO (37 patients). All 166 patients were<br />
included in the efficacy and safety analyses. The per-<br />
protocol analysis set included 105 NESP patients and 29<br />
a response in the rHuEPO group. These findings were<br />
supported by the per-protocol analysis, in which 94% of<br />
the NESP patients (95% CI, 88 to 98%) and 100% of<br />
the rHuEPO patients (95% CI, 88 to 100%) achieved a<br />
rHuEPO patients. Overall, 54% of patients were men, hemoglobin response. The percentage of patients achiev-<br />
and most were white (96%). The mean age was 61 years, ing a hemoglobin increase of �1.0 g/dL from baseline<br />
with a range of 19 to 87 years. Demographic characteris- also was comparable between the NESP (99%; 95% CI,<br />
tics were similar between the two treatment groups (Ta- 96 to 100%) and rHuEPO (95%; 95% CI, 82 to 99%)<br />
ble 1). The most frequent causes of renal failure in pa- groups. In both treatment groups, the median time to
744<br />
Locatelli et al: NESP treatment in CRI<br />
Page 110<br />
Fig. 1. Mean (95% CI) hemoglobin concentrations<br />
at four-week intervals. The shaded<br />
area indicates target range. Symbols are the patients<br />
receiving: (�) recombinant human erythropoietin<br />
(rHuEPO); (�) novel erythropoiesis<br />
stimulating protein (NESP). Abbreviations are:<br />
E, number of patients receiving rHuEPO; N,<br />
number of patients receiving NESP.<br />
achieve a hemoglobin response was seven weeks (range The percentage of patients with dose reductions to levels<br />
of 3 to 25 weeks).<br />
below their starting dose up to week 24 was similar in<br />
Mean hemoglobin concentrations increased over the the NESP (68%) and rHuEPO (70%) groups. In patients<br />
initial 12 weeks for patients in both groups and were who continued to receive NESP after the 24-week treat-<br />
maintained within the target range of 11.0 to 13.0 g/dL ment period, the median weekly weight-adjusted dose<br />
for the remainder of the 24-week treatment period. In at week 48 was 0.30 �g/kg (range of 0.1 to 1.7).<br />
patients continuing to receive NESP after the 24-week Few patients required a red blood cell transfusion in<br />
treatment period, the mean hemoglobin concentration the NESP or rHuEPO treatment groups (5 and 8%,<br />
remained within the target range for up to 48 weeks respectively). Only three NESP-treated patients and two<br />
(Fig. 1). The difference in hemoglobin levels observed rHuEPO-treated patients received a red blood cell transbetween<br />
the NESP and rHuEPO patients at baseline fusion before achieving a hemoglobin response.<br />
appeared to remain constant throughout the study; thus,<br />
no difference in the change in hemoglobin from baseline Safety<br />
between the two treatment groups was evident. After The safety profiles of NESP and rHuEPO were similar.<br />
the initial four weeks of treatment, the two groups had A total of 107 of 129 NESP patients (83%) and 24 of 37<br />
comparable increases in mean hemoglobin concentra- rHuEPO patients (65%) experienced at least one ad-<br />
tions: 1.38 g/dL (95% CI, 1.21 to 1.55) in the NESP group verse event during the study, most of which were mild<br />
and 1.40 g/dL (95% CI, 1.07 to 1.72) in the rHuEPO to moderate in severity. The interpretation of differences<br />
group. Mean changes in hemoglobin from baseline were between the treatment groups is confounded by the<br />
very similar between the treatment groups up to 24 weeks. open-label design of the study and the potential over-<br />
Fifty-eight percent of NESP patients and 59% of attribution of adverse events to a novel agent (NESP)<br />
rHuEPO patients did not require any dose adjustment compared with an established therapy. Adverse events<br />
before achieving a hemoglobin response. A similar per- occurring in more than 10% of patients in either treatcentage<br />
of patients receiving NESP or rHuEPO had a ment group are presented in Table 2. The most frequently<br />
dose increase (35 and 32%, respectively) or a dose de- reported adverse events in the NESP and rHuEPO groups<br />
crease (7 and 9%, respectively) before achieving a hemo- were hypertension (32 and 22%, respectively) and pe-<br />
globin response. At the time of hemoglobin response, ripheral edema (13 and 11%, respectively). Most of these<br />
the median weekly weight-adjusted dose of NESP was events were attributed to concurrent medical conditions<br />
0.46 �g/kg (range of 0.3 to 2.3 �g/kg), and the corre- and were consistent with events expected in this patient<br />
sponding dose of rHuEPO was 100 U/kg (range of 75 population. Adverse events that were considered by the<br />
to 175 U/kg). Both doses were nearly identical to those investigator to be treatment related were reported with<br />
at the beginning of the study. At week 24, median study the same frequency in each treatment group (30% NESP<br />
drug doses had decreased to 0.34 �g/kg (range of 0.0 to and 27% rHuEPO). Hypertension was the most common<br />
1.3 �g/kg) in patients receiving NESP and to 56.9 U/kg of these events (21% NESP and 19% rHuEPO).<br />
(range of 19 to 250 U/kg) in patients receiving rHuEPO. There were six reported deaths (4% NESP and 3%
Page 111<br />
Locatelli et al: NESP treatment in CRI 745<br />
Table 2. Adverse events occurring in �10% of novel erythropoiesis Table 3. Deaths during the study or within 28 days after withdrawal<br />
stimulating protein (NESP)- or recombinant human erythropoietin in novel erythropoiesis stimulating protein (NESP)- or<br />
(rHuEPO)-treated patients recombinant human erythropoietin (rHuEPO)-treated patients<br />
a<br />
NESP rHuEPO Treatment<br />
Adverse event (N � 129) (N � 37) group Age/sex Study week Primary cause of death<br />
Hypertension 41 (32%) 8 (22%) rHuEPO 75/M 7 Cardiac arrest<br />
Peripheral edema 17 (13%) 4 (11%) NESP 64/M 16 Cardiac arrest<br />
Fatigue 16 (12%) 0 (0%) NESP 75/F 13a Cachexia<br />
NESP 53/M 10a Diarrhea 14 (11%) 3 (8%)<br />
Multi-organ failure<br />
Headache 14 (11%) 4 (11%) NESP 64/M 22 Cardiac arrest<br />
Nausea 11 (9%) 5 (14%) NESP 64/F 23 Hematemesis<br />
Pruritis 7 (5%) 4 (11%) a Occurred within 28 days after withdrawal from the study<br />
a Data are presented as the number of patients (%) experiencing each adverse<br />
event.<br />
rHuEPO) during the 24-week treatment period or within<br />
28 days after withdrawal from the study (Table 3). The<br />
deaths were largely due to cardiovascular failure and<br />
occurred in patients with a history of cardiovascular disease.<br />
Increases in hemoglobin were well controlled in pa-<br />
tients receiving NESP or rHuEPO. The mean of the<br />
maximum increase in hemoglobin over any four-week<br />
interval was 1.99 g/dL (95% CI, 1.88 to 2.11) in the<br />
NESP group and 2.13 g/dL (95% CI, 1.88 to 2.39) in<br />
the rHuEPO group. The percentage of patients with a<br />
hemoglobin increase of �2.0 g/dL over any four-week<br />
interval was 51% in the NESP group and 60% in the<br />
rHuEPO group. In addition, a lower percentage of pavalues<br />
were 155 � 19 and 81 � 11 mm Hg, respectively,<br />
at baseline and 146 � 20 and 79 � 12 mm Hg, respec-<br />
tively, at week 25. In the rHuEPO group, values were<br />
141 � 21 and 79 � 10 mm Hg at baseline and 143 � 23<br />
and 79 � 8 mm Hg at week 25.<br />
No clinically meaningful changes in laboratory values<br />
were evident, and values were similar between the NESP<br />
and rHuEPO groups. Mean � SD creatinine clearance<br />
values were 15.7 � 6.6 mL/min in the NESP group and<br />
15.7 � 6.4 mL/min in the rHuEPO group at baseline,<br />
and 14.1 � 6.7 mL/min and 13.7 � 7.6 mL/min, respectively,<br />
after 24 weeks of treatment. No antibody forma-<br />
tion to NESP or rHuEPO was detected for any patient<br />
during the study.<br />
tients in the NESP group relative to the rHuEPO group DISCUSSION<br />
had a hemoglobin increase of �2.5 g/dL (21 and 32%,<br />
respectively) or �3.0 g/dL (9 and 14%, respectively) over<br />
any four-week period. In patients who had study drug<br />
In patients with chronic renal failure, anemia is associ-<br />
ated with an increased risk of cardiovascular morbidity<br />
and mortality and a reduction in quality of life. Correcwithheld<br />
for hemoglobin concentrations �14.0 g/dL tion of hemoglobin and hematocrit levels has been shown<br />
(24% NESP and 35% rHuEPO), the median time re- to reduce cardiovascular risk factors such as left ventricuquired<br />
for hemoglobin levels to return to �12.0 g/dL lar hypertrophy and improve energy and physical funcwas<br />
similar in the NESP (7 weeks, range of 2 to 13) and tioning, emphasizing the importance of treating anemia<br />
rHuEPO (9 weeks, range of 6 to 13) groups (Fig. 2). in this population [2, 8, 9].<br />
After four weeks of treatment, median serum ferritin This is the first report of the administration of NESP<br />
concentrations had decreased in the NESP and rHuEPO to patients with CRI. The results of this study demongroups<br />
from baseline values of 168 and 151 �g/L to 80 strate that NESP, administered once weekly at a starting<br />
and 63 �g/L, respectively. Median serum ferritin concen- dose of 0.45 �g/kg, is safe and effective for the correction<br />
trations remained �100 �g/L until week 17, when values of anemia and maintenance of hemoglobin concentrations<br />
increased to 108 and 101 �g/L in the NESP and rHuEPO in this patient population. Of the 129 patients randomgroups,<br />
respectively. Median concentrations remained ized to receive NESP, 93% achieved a hemoglobin reabove<br />
100 �g/L for the rest of the 24-week treatment sponse during the 24-week treatment period. Although<br />
period. Intravenous iron was administered to 77% of hemoglobin concentrations were lower in the NESP<br />
patients receiving NESP and 81% of patients receiving group than in the rHuEPO group at baseline, both the<br />
rHuEPO, at a total mean patient dose of 685 mg and proportion of patients achieving a hemoglobin response<br />
678 mg, respectively. In addition, oral iron was adminis- and the time to achieve this response were the same<br />
tered to a similar proportion of patients in the NESP for patients receiving NESP once weekly or rHuEPO<br />
(52%) and rHuEPO (51%) groups. administered twice weekly. The degree of anemia correc-<br />
Vital signs were stable during the 24-week treatment tion with NESP treatment was also similar to that obperiod<br />
in both treatment groups. In patients receiving served in previous studies of rHuEPO administered<br />
NESP, mean � SD systolic and diastolic blood pressure three times weekly in patients with CRI [10–12].
746<br />
Locatelli et al: NESP treatment in CRI<br />
Page 112<br />
Fig. 2. Time required for hemoglobin concentrations<br />
to return to �12.0 g/dL after withheld<br />
doses for hemoglobin concentrations �14.0<br />
g/dL. Symbols are: (�) rHuEPO (N � 13);<br />
(�) NESP (N � 31). Means and 95% CIs are<br />
shown.<br />
Consistent with previous observations of NESP ad- laboratory or vital sign measures, and changes in mean<br />
ministered intravenously or SC in patients with CRF re- creatinine clearance were similar between treatment<br />
ceiving dialysis [5], a NESP starting dose of 0.45 �g/kg/ groups.<br />
week was effective for the correction of anemia in the The correction of anemia with NESP treatment was<br />
CRI population. The median dose of NESP at the time well controlled, with mean hemoglobin concentrations<br />
patients achieved the target hemoglobin range was simi- maintained within the target range of 11.0 to 13.0 g/dL<br />
lar to the starting dose. However, the median NESP dose for up to 48 weeks. During the initial 24-week treatment<br />
was reduced to 0.34 �g/kg after 24 weeks of treatment, phase, increases in hemoglobin over any four-week pe-<br />
potentially reflecting titration to maintain hemoglobin riod were �2.5 g/dL in most patients, consistent with<br />
within the target range. Reduced maintenance doses current recommendations for the management of anemia<br />
were also observed for patients receiving rHuEPO in in CRI [6, 7]. In patients who had doses withheld for<br />
this study and have been reported in other studies of hemoglobin concentrations �14.0 g/dL during the study,<br />
patients with CRF receiving rHuEPO [1, 13]. the time required for levels to return to �12.0 g/dL was<br />
Adverse events were consistent with those expected similar in the NESP and rHuEPO treatment groups. This<br />
in a population of patients with CRI and were generally result suggests that the rate of decline in hemoglobin<br />
considered unrelated to the study drug. While a higher after withholding NESP or rHuEPO therapy is primarily<br />
overall incidence of adverse events was reported for the determined by destruction of circulating red blood cells<br />
NESP group than for the rHuEPO group, this difference as they reach the end of their lifespan, and not by clearmay<br />
have been a consequence of the open-label design ance of the study drug.<br />
of the study and the potential over-attribution of adverse Median serum ferritin concentrations in both treat-<br />
events to a novel agent compared to an established therapy. ment groups decreased below the recommended level<br />
The 3:1 randomization of patients to NESP or rHuEPO of 100 �g/L [6, 7] during the initial correction of anemia<br />
and the resulting small number of patients evaluated and subsequently increased following supplemental in-<br />
in the rHuEPO group may have also contributed to the travenous iron therapy. Other studies in patients with<br />
observed difference. Patients in the NESP group had lower CRI receiving rHuEPO therapy have also reported a<br />
baseline hemoglobin, a higher incidence of hypertension high incidence of absolute or functional iron deficiency<br />
at baseline (91% NESP and 84% rHuEPO), and higher requiring intravenous or oral supplementation [10, 11,<br />
baseline systolic blood pressure values (155 mm Hg 14]. As iron deficiency is the most common cause of<br />
NESP and 141 mm Hg rHuEPO). These results suggest resistance to rHuEPO therapy, iron stores should be<br />
that the NESP group had a greater burden of comorbid- monitored regularly in patients receiving NESP to enity<br />
and may partially explain the difference in adverse sure adequate support of the erythropoietic response.<br />
events between treatment groups, particularly since hy- Further research into optimal iron supplementation in<br />
pertension was the most common adverse event reported this population is warranted.<br />
in this study.<br />
Although rHuEPO most commonly is administered<br />
No clinically significant changes were observed for any two or three times weekly for the treatment of anemia
Page 113<br />
Locatelli et al: NESP treatment in CRI 747<br />
in CRF, it has also been used once weekly in some<br />
patients. As a result of the extended half-life of NESP<br />
relative to rHuEPO, even longer dosing intervals are<br />
ease: Results of a phase III multicenter clinical trial. Ann Intern<br />
Med 111:992–1000, 1989<br />
2. Revicki DA, Brown RE, Feeny DH, et al: Health-related quality<br />
of life associated with recombinant human erythropoietin therapy<br />
possible with NESP therapy [3]. In a randomized, comparative<br />
study of NESP and rHuEPO in dialysis patients,<br />
95% of patients who were receiving rHuEPO once<br />
for predialysis chronic renal disease patients. Am J Kidney Dis<br />
25:548–554, 1995<br />
3. Macdougall IC, Gray SJ, Elston O, et al: Pharmacokinetics of<br />
novel erythropoiesis stimulating protein compared with Epoetin<br />
weekly at baseline successfully maintained stable hemoglobin<br />
concentrations when switched to NESP adminisalfa<br />
in dialysis patients. J Am Soc Nephrol 10:2392–2395, 1999<br />
4. Macdougall IC, Roberts DE, Coles GA, Williams JD: Clinical<br />
pharmacokinetics of Epoetin (recombinant human erythropoie-<br />
tered once every two weeks [5]. The longer dosing interval tin). Clin Pharmacokinet 20:99–113, 1991<br />
with NESP offers the possibility of greater convenience<br />
and less patient discomfort by reducing the number of<br />
5. Macdougall IC: Novel erythropoiesis stimulating protein. Semin<br />
Nephrol 20:375–381, 2000<br />
6. NKF-DOQI clinical practice guidelines for the treatment of anemia<br />
physician office visits (where standard practice) and sub- of chronic renal failure. Am J Kidney Dis 30(Suppl):S192–S240,<br />
cutaneous injections. With dose administration once<br />
weekly or once every two weeks, patients can avoid up<br />
1997<br />
7. Working Party for European Best Practice Guidelines for<br />
the Management of <strong>Anemia</strong> in Patients with Chronic Renal<br />
to 104 injections per year. Further clinical studies to<br />
evaluate the efficacy and safety of NESP at extended<br />
dosing intervals are currently underway.<br />
Failure: European best practice guidelines for the management<br />
of anemia in patients with chronic renal failure. Nephrol Dialysis<br />
Transplant 14(Suppl 5):1–50, 1999<br />
8. Hayashi T, Suzuki A, Shoji T, et al: Cardiovascular effect of<br />
In conclusion, these results demonstrate that NESP<br />
safely and effectively corrects and maintains hemoglobin<br />
concentrations at a reduced dosing frequency relative to<br />
normalizing the hematocrit level during erythropoietin therapy in<br />
predialysis patients with chronic renal failure. Am J Kidney Dis<br />
35:250–256, 2000<br />
9. Moreno F, Sanz-Guajardo D, López-Gómez JM, et al: Increasing<br />
rHuEPO in patients with CRI, providing a potential<br />
benefit to patients and health care providers.<br />
the hematocrit has a beneficial effect on quality of life and is safe<br />
in selected hemodialysis patients. J Am Soc Nephrol 11:335–342,<br />
2000<br />
10. Eschbach JW, Kelly MR, Haley NR, et al: Treatment of the<br />
ACKNOWLEDGMENTS<br />
anemia of progressive renal failure with recombinant human erythropoietin.<br />
N Engl J Med 321:158–163, 1989<br />
This study was supported by <strong>Amgen</strong> Inc. Results from this study<br />
were presented in abstract form at the annual meeting of the American<br />
Society of Nephrology in Toronto, Canada, October, 2000. The authors<br />
thank Ms. Janis Schaap for assistance in writing this manuscript.<br />
11. Watson AJ, Gimenez LF, Cotton S, et al: Treatment of the anemia<br />
of chronic renal failure with subcutaneous recombinant human<br />
erythropoietin. Am J Med 89:432–435, 1990<br />
12. US Recombinant Human Erythropoietin Predialysis Study<br />
Group: Double-blind, placebo-controlled study of the therapeutic<br />
Reprint requests to Francesco Locatelli, M.D., Divisione di Nefro-<br />
logia e Dialisi, Azienda Ospedaliera di Lecco, Ospedale Alessandro<br />
Manzoni, Via dell’Eremo 9-11, 23900 Lecco, Italy.<br />
E-mail: nefrologia@ospedale.lecco.it<br />
use of recombinant human erythropoietin for anemia associated<br />
with chronic renal failure in predialysis patients. Am J Kidney Dis<br />
18:50–59, 1991<br />
13. Eschbach JW, Egrie JC, Downing MR, et al: Correction of the<br />
anemia of end-stage renal disease with recombinant human erythropoietin:<br />
Results of a combined phase I and II clinical trial. N Engl<br />
REFERENCES<br />
J Med 316:73–78, 1987<br />
14. Macdougall IC, Hörl WH, Jacobs C, et al: European Best Prac-<br />
1. Eschbach JW, Abdulhadi MH, Browne JK, et al: Recombinant tice Guidelines 6–8: Assessing and optimizing iron stores. Nephrol<br />
human erythropoietin in anemic patients with end-stage renal dis- Dial Transplant 15(Suppl 4):20–32, 2000
Double-Blind Comparison of Full and Partial <strong>Anemia</strong><br />
Correction in Incident Hemodialysis Patients without<br />
Symptomatic Heart Disease<br />
Patrick S. Parfrey,* Robert N. Foley, † Barbara H. Wittreich, ‡ Daniel J. Sullivan, §<br />
Martin J. Zagari, ‡ and Dieter Frei; ‡ for the Canadian European Study Group<br />
*Memorial University of Newfoundland, St. John’s, Newfoundland, Canada; † Chronic Disease Research Group,<br />
Minneapolis, Minnesota; ‡ Ortho Biotech, Bridgewater, New Jersey; and § Johnson and Johnson, Pharmaceutical Research,<br />
LLC, Raritan, New Jersey<br />
It is unclear whether physiologic hemoglobin targets lead to cardiac benefit in incident hemodialysis patients without<br />
symptomatic heart disease and left ventricular dilation. In this randomized, double-blind study, lower (9.5 to 11.5 g/dl) and<br />
higher (13.5 to 14.5 g/dl) hemoglobin targets were generated with epoetin � over 24 wk and maintained for an additional 72<br />
wk. Major eligibility criteria included recent hemodialysis initiation and absence of symptomatic cardiac disease and left<br />
ventricular dilation. The primary outcome measure was left ventricular volume index (LVVI). The study enrolled 596 patients.<br />
Mean age, duration of dialysis therapy, baseline predialysis hemoglobin, and LVVI were 50.8 yr, 0.8 yr, 11.0 g/dl, and 69 ml/m 2 ,<br />
respectively; 18% had diabetic nephropathy. Mean hemoglobin levels in the higher and lower target groups were 13.3 and 10.9<br />
g/dl, respectively, at 24 wk. Percentage changes in LVVI between baseline and last value were similar (7.6% in the higher and<br />
8.3% in the lower target group) as were the changes in left ventricular mass index (16.8 versus 14.2%). For the secondary<br />
outcomes, the only between-group difference was an improved SF-36 Vitality score in the higher versus the lower target group<br />
(1.21 versus �2.31; P � 0.036). Overall adverse event rates were similar in both target groups; higher (P < 0.05) rates of skeletal<br />
pain, surgery, and dizziness were seen in the lower target group, and headache and cerebrovascular events were seen in the<br />
higher target group. Normalization of hemoglobin in incident hemodialysis patients does not have a beneficial effect on<br />
cardiac structure, compared with partial correction.<br />
J Am Soc Nephrol 16: 2180–2189, 2005. doi: 10.1681/ASN.2004121039<br />
Left ventricular hypertrophy (LVH) is present in<br />
nearly 80% of dialysis patients (1). Morphologically,<br />
left ventricular dilation and concentric hypertrophy<br />
are approximately equally represented, and both conditions<br />
are associated with higher rates of cardiovascular events<br />
(1–7). In dialysis patients, anemia is associated with LVH,<br />
left ventricular dilation, congestive heart failure, hospitalization,<br />
and mortality (8–11). Controlled studies with quality of<br />
life (QOL) and left ventricular mass as end points support<br />
partial correction of hemoglobin in dialysis patients (12–14).<br />
Received December 3, 2004. Accepted April 6, 2005.<br />
Published online ahead of print. Publication date available at www.jasn.org.<br />
Address correspondence to: Dr. Patrick Parfrey, Division of Nephrology, Health<br />
Sciences Center, Memorial University of Newfoundland, Prince Philip Drive, St.<br />
John’s, Newfoundland A1B 3V6, Canada. Phone: 709-777-7261; Fax: 709-777-6995;<br />
E-mail: pparfrey@mun.ca<br />
Conflict of interest statement: P.S.P. has received research support and is an<br />
academic advisor to companies that make erythropoietin products—Ortho Biotech,<br />
<strong>Amgen</strong>, and Roche. P.S.P. declares that he had full access to all of the data<br />
in the study and had final responsibility for the decision to submit for publication.<br />
R.N.F. has received research support and honoraria from Ortho Biotech. D.J.S. is<br />
an employee of Johnson & Johnson. B.H.W., M.J.Z., and D.F. are employees of<br />
Ortho Biotech.<br />
P.S.P. and R.N.F. contributed equally to this work.<br />
Page 114<br />
These findings underpin guidelines from the United States,<br />
Europe, and Canada, which suggest hemoglobin levels between<br />
11 and 12 g/dl in dialysis patients (15–17). The potential<br />
risks and benefits of higher hemoglobin targets in dialysis<br />
patients have generated considerable discussion.<br />
Evaluation of studies reported to date (18–21), with the<br />
benefit of hindsight, led to concerns in one or more of the<br />
following areas: Late intervention, small sample size, short<br />
follow-up, and nonblinded participants. The current study<br />
was conducted to compare the impact of higher versus lower<br />
hemoglobin targets on left ventricular size in incident hemodialysis<br />
patients without symptomatic cardiac disease. Secondary<br />
outcomes included left ventricular mass index<br />
(LVMI), 6-min walking test, QOL, and the occurrence of<br />
adverse events.<br />
Materials and Methods<br />
Among incident hemodialysis patients without symptomatic cardiac<br />
disease and left ventricular dilation, we compared the effects of higher<br />
(13.5 to 14.5 g/dl) and lower (9.5 to 11.5 g/dl) hemoglobin targets<br />
maintained with epoetin � on (1) left ventricular volume index (LVVI),<br />
the primary outcome; (2) LVMI; (3) the incidence of de novo congestive<br />
heart failure; (4) QOL, as revealed by vitality, fatigue, and quality of<br />
social interaction scores; and (5) 6-min walking test performance.<br />
Copyright © 2005 by the American Society of Nephrology ISSN: 1046-6673/1607-2180
J Am Soc Nephrol 16: 2180–2189, 2005 <strong>Anemia</strong> Correction in Hemodialysis Patients 2181<br />
Study Population<br />
Adult (�18 yr of age) hemodialysis patients were selected using the<br />
following inclusion criteria: (1) Predialysis hemoglobin between 8 and<br />
12 g/dl; (2) hemodialysis started in the preceding 3 to 18 mo (this<br />
relatively broad definition for early intervention was chosen to facilitate<br />
enrollment); (3) LVVI �100 ml/m 2 on screening echocardiography,<br />
with normal being �90 ml/m 2 ; and (4) predialysis diastolic BP �100<br />
mmHg. The exclusion criteria were (1) symptomatic ischemic heart<br />
disease or heart failure; (2) angiographic critical coronary artery disease;<br />
(3) current treatment �10 mg of prednisone daily for a failed renal<br />
transplant; (4) surgery for pericardial or valvular disease within the last<br />
2 yr; (5) medical conditions that are likely to reduce the response to<br />
epoetin �, including uncorrected iron deficiency; (6) concurrent malignancy;<br />
(7) blood transfusion within the preceding month; (8) therapy<br />
with cytotoxic agents; (9) seizure within the previous year; (10) hypersensitivity<br />
to intravenous iron; and (11) current pregnancy or breastfeeding.<br />
Design<br />
A randomized, double-blind design was used with patients and<br />
outcome assessors but not treating physicians, who were blinded to<br />
assigned hemoglobin target. The study was divided into a 24-wk titration<br />
phase, which was used to achieve hemoglobin targets, and a 72-wk<br />
maintenance period.<br />
Local independent ethics committees or institutional review boards<br />
approved the study protocol form before study initiation. The study<br />
was conducted in accordance with Good Clinical Practice guidelines<br />
Table 1. Baseline characteristics for the lower and higher target groups a<br />
Total (n � 596;<br />
Mean � SD or %)<br />
and the Declaration of Helsinki. All patients gave informed consent<br />
before study enrollment.<br />
Study Procedures<br />
The study was centrally monitored from St. John’s, Canada (P.S.P.),<br />
for Canadian patients and Manchester, England (R.N.F.), for European<br />
patients. Thirty percent of patients enrolled were from Canada, and<br />
70% were from Europe. Screening echocardiograms were sent to a<br />
central site (Cardialysis B.V., Rotterdam, The Netherlands) to determine<br />
whether LVVI was �100 ml/m 2 . Randomization was performed<br />
at the two coordinating centers with an interactive voice randomization<br />
telephone system, using permuted blocks, stratified by gender and<br />
concurrent epoetin use.<br />
Laboratory tests were measured by Quest Diagnostics (Van Nuys,<br />
CA, and Heston, UK). Baseline evaluations included medical history,<br />
vital signs, height and weight, blood chemistry, M-mode echocardiography,<br />
electrocardiography, Kidney Disease Quality of Life (KDQOL)<br />
(22), Functional Assessment of Chronic Illness Therapy (FACIT) fatigue<br />
scale (23), and a 6-min walking test (24). As part of the sponsor’s effort<br />
to investigate the occurrence of pure red-cell aplasia in patients who<br />
received epoetin �, the protocol was amended after 36 mo to mandate<br />
measurement of anti-erythropoietin antibodies and serum erythropoietin.<br />
The following treatment targets were used: (1) Predialysis hemoglobin<br />
levels of 9.5 to 11.5 g/dl throughout in the lower target group and,<br />
in the higher target group, increments of 0.5 to 1.0 g/dl biweekly, until<br />
achieving stability between 13.5 and 14.5 g/dl (measured weekly for 24<br />
Lower (9.5 to 11.5 g/dl;<br />
n � 300;<br />
Mean � SD or %)<br />
Higher (13.5 to 14.5 g/dl;<br />
n � 296;<br />
Mean � SD or %)<br />
Age (yr) 50.8 � 15.4 49.4 � 15.2 52.2 � 15.6<br />
Duration of dialysis (mo) 10.1 � 5.0 10.2 � 5.1 10.0 � 4.9<br />
Weight (kg) 75 � 16 74 � 17 75 � 16<br />
Height (m) 1.68 � 0.10 1.68 � 0.10 1.68 � 0.09<br />
Hemoglobin (g/dl) 11.0 � 1.2 11.0 � 1.2 11.0 � 1.2<br />
Transferrin saturation (%) 36.2 � 17.2 36.8 � 17.8 35.7 � 16.7<br />
Urea reduction ratio (%) 65.9 � 10.7 66.0 � 11.3 65.7 � 10.1<br />
Serum albumin (g/dl) 3.9 � 0.3 4.0 � 0.3 3.9 � 0.3<br />
Male 60 60 60<br />
Previous epoetin use 92 91 93<br />
Race<br />
white 89 88 91<br />
black 5 6 4<br />
Primary cause of renal failure<br />
glomerulonephritis 29 29 28<br />
diabetic nephropathy 18 17 19<br />
polycystic kidney disease 9 8 10<br />
hypertension 8 9 7<br />
unknown 10 10 9<br />
other 27 27 27<br />
Dialysis access<br />
fistula 84 83 86<br />
graft 6 5 6<br />
catheter 10 12 8<br />
a P � 0.05 for all comparisons between lower and higher target groups, except age (P � 0.02).<br />
Page 115
wk, then biweekly); (2) predialysis diastolic BP between 70 and 90<br />
mmHg (measured weekly for 24 wk, then every 4 wk); (3) urea reduction<br />
ratio �67% (measured every 4 wk for 24 wk, then every 12 wk);<br />
and (4) transferrin saturation �20% (measured biweekly for 24 wk,<br />
then every 4 wk).<br />
Between February 2000 and June 2001, 596 patients were enrolled in<br />
95 treatment centers in 10 European countries and Canada. For each<br />
patient, a form was faxed weekly to the coordinating center displaying<br />
hemoglobin, epoetin � regimen, BP, and transferrin saturation levels.<br />
Treatment recommendations were faxed back, weekly. Initially, epoetin<br />
� could be administered subcutaneously or intravenously. A study<br />
amendment, effective August 22, 2002, limited administration to the<br />
intravenous route. The last patient completed the study in May 2003.<br />
A predefined algorithm was used for epoetin � therapy. Epoetinnaïve<br />
patients in the higher target group were assigned a dose of 150<br />
IU/kg per wk. For hemoglobin levels that deviated from target, epoetin<br />
doses were changed by 25% of the previous dose or 25 IU/kg.<br />
Outcome Measures<br />
Echocardiograms were performed at 24, 48, and 96 wk after study<br />
start. Standard echocardiographic recordings were performed within 1<br />
kg of dry weight, usually within 24 h after the midweek dialysis. Dry<br />
weight was the optimal postdialysis weight for BP control without<br />
symptoms of blood volume contraction. American Society of Echocardiography<br />
criteria (25) were used, and echocardiograms were read by<br />
an independent central reader, Cardialysis. Left ventricular volume, in<br />
milliliters, was calculated as 0.001047 (left ventricular end-diastolic<br />
diameter mm) 3 (26). Left ventricular mass, in grams, was calculated as<br />
0.00083 � [(end-diastolic diameter mm � interventricular septum<br />
thickness mm � posterior wall thickness mm) 3 � (end-diastolic diameter<br />
mm) 3 � 0.6] (27). LVVI and LVMI were calculated as left ventricular<br />
volume/M 2 body surface area and left ventricular mass/M 2 body<br />
surface area, respectively (28).<br />
The 6-min walking test was performed at 24, 48, and 96 wk after<br />
study start, and QOL scales were recorded at 24, 36, 48, 60, 72, 84, and<br />
96 wk. The FACIT fatigue scale and two subscales from the KDQOL,<br />
the SF-36 Vitality and KDQOL Quality of Social Interaction, were<br />
chosen for analysis before initiating the study, with higher values<br />
representing better QOL. The 6-min walking test measured the distance<br />
walked in 6 min, change in heart rate from pre- to postexercise, and<br />
perceived exertion (24). De novo heart failure was defined as dyspnea at<br />
rest with two of the following: Increased jugular venous pressure,<br />
bilateral basal crackles, radiographic pulmonary hypertension, and<br />
radiographic interstitial edema. Safety evaluations included adverse<br />
events as defined by the investigator, vital signs, and laboratory measures.<br />
Statistical Analyses<br />
Data from Canadian Normalization of Hemoglobin trial were used to<br />
guide sample size estimation (19). The sample size needed to detect a<br />
15% difference between treatment groups was calculated as 166 per<br />
treatment group, given a two-tailed significance of 0.05, a power of 0.90,<br />
and an SD of the percentage change in left ventricular cavity volume<br />
index of 42%. With an expected dropout rate of 40%, primarily as a<br />
result of transplantation, 277 patients were required for each treatment<br />
group.<br />
The intention-to-treat philosophy was used. Analysis of covariance<br />
(adjusted for age, epoetin use at randomization, and baseline LVH) was<br />
used to adjust the effect of hemoglobin target on percentage change in<br />
LVVI and LVMI. De novo heart failure rates were compared using<br />
time-to-event analyses. QOL outcomes were compared in patients with<br />
Page 116<br />
2182 Journal of the American Society of Nephrology J Am Soc Nephrol 16: 2180–2189, 2005<br />
at least one QOL score, using piecewise linear regression, where QOL<br />
growth curves were allowed to change slopes at week 24, i.e., one slope<br />
was used from weeks 0 to 24, and another slope was used from week<br />
24 and beyond. The main QOL analysis assumed that missing QOL<br />
data were missing at random; however, a sensitivity analysis, which<br />
did not assume that data were missing at random, yielded similar<br />
findings. The primary QOL assessment was mean follow-up minus<br />
baseline QOL score, with P values adjusted for multiple comparisons<br />
using the Hochberg procedure (29).<br />
The proportions with at least one treatment-emergent adverse event<br />
were compared by treatment assignment; because the number of component<br />
conditions was very large, any adverse event that occurred in<br />
�10% of patients is reported here, as are vascular events, access loss<br />
events, cardiac events, and death when the occurrence rates exceeded<br />
2%. Parametric, two-sided statistical tests were used throughout, with<br />
a type I error of 0.05, using SAS Version 6.12.<br />
Role of the Funding Source<br />
The study sponsor, Johnson & Johnson Pharmaceutical Research and<br />
Development, LLC, identified the participating centers, monitored the<br />
data collection, and entered the data in a central database.<br />
Results<br />
Patients<br />
Baseline characteristics of the 596 patients enrolled are shown<br />
in Table 1 and were similar in the two randomly assigned<br />
treatment groups, apart from age, which was greater in the<br />
higher target group. As anticipated, 324 (54%) patients remained<br />
in the study for 96 wk, 160 (54%) in the higher and 164<br />
(55%) in the lower target groups. The reasons for study exit—<br />
renal transplantation (n � 133, 67 in the higher and 66 in the<br />
lower target group), adverse events (n � 76, 39 and 37), patient<br />
choice (n � 28, 9 and 19), loss to follow-up (n � 2, 1 and 1), and<br />
other (n � 36, 21 and 15)—were similar in the two target<br />
Figure 1. Hemoglobin levels (top) and epoetin � doses (bottom),<br />
presented as means � 2 SE in the higher and lower target<br />
groups.
Table 2. Clinical indicators for the lower and higher target groups<br />
groups. The mean times in the study were similar for both<br />
target groups: 73.4 � 31.1 wk for the higher compared with<br />
74.0 � 31.8 for the lower target group. In total, 339 patients had<br />
echocardiograms performed after 72 wk of follow-up.<br />
Figure 1 shows hemoglobin levels and epoetin � doses in the<br />
two target groups. Toward the end of the titration phase, at 24<br />
wk, the mean hemoglobin levels in the higher and lower target<br />
groups were 13.3 � 1.5 and 10.9 � 1.2 g/dl, respectively.<br />
During the maintenance phase, from weeks 24 to 96, mean<br />
hemoglobin levels were 13.1 � 0.9 g/dl in the higher and 10.8 �<br />
0.7 g/dl in the lower target group. Predialysis hemoglobin<br />
levels, averaged for the whole study, including both the titration<br />
and the maintenance phases, were 12.6 � 1.0 g/dl in the<br />
higher and 10.9 � 0.7 g/dl in the lower target group, whereas<br />
the corresponding postdialysis levels were 13.5 � 1.2 and<br />
11.8 � 1.1 g/dl, respectively. The proportionate increase in<br />
post- to predialysis hemoglobin, which reflects interdialytic<br />
weight gain, were similar in both groups (7 versus 8%).<br />
Table 2 summarizes clinical indicators at the beginning and<br />
Lower (9.5 to 11.5 g/dl) Higher (13.5 to 14.5 g/dl)<br />
N<br />
Mean � SD<br />
or n (%)<br />
N<br />
Mean � SD<br />
or n (%)<br />
Transferrin saturation (%)<br />
baseline 294 36.8 � 17.5 293 35.7 � 16.72<br />
last value<br />
Systolic BP (mmHg)<br />
294 34.2 � 16.53 293 34.6 � 14.91<br />
baseline a<br />
300 140 � 20 295 144 � 21.65<br />
last value<br />
Diastolic BP (mmHg)<br />
299 139 � 22 295 141 � 22.14<br />
baseline 298 80 � 12 295 81 � 11.48<br />
last value<br />
No. of antihypertensive drugs<br />
299 79 � 14 295 80 � 12.57<br />
baseline 300 1.8 � 1.4 296 2.0 � 1.5<br />
last value a<br />
Urea reduction ratio (%)<br />
300 1.7 � 1.5 296 2.0 � 1.7<br />
baseline 281 66 � 11 281 66 � 10.10<br />
last value a<br />
292 68 � 10 285 66 � 10.87<br />
Serum albumin (g/dl)<br />
baseline 296 4.0 � 0.3 290 3.9 � 0.29<br />
last value<br />
No. with transferrin saturation �20%<br />
279 4.0 � 0.4 279 3.9 � 0.35<br />
baseline 294 40 (14) 293 35 (12)<br />
last value<br />
No. receiving intravenous iron<br />
294 42 (14) 293 33 (11)<br />
baseline 300 129 (43) 296 139 (47)<br />
last value a<br />
Page 117<br />
J Am Soc Nephrol 16: 2180–2189, 2005 <strong>Anemia</strong> Correction in Hemodialysis Patients 2183<br />
300 75 (25) 296 110 (37)<br />
No. receiving antihypertensives<br />
baseline 300 242 (81) 296 244 (82)<br />
last value 300 222 (74) 296 226 (76)<br />
a The following comparisons were statistically significant: Baseline systolic BP (P � 0.019), last value for number of<br />
antihypertensive drugs (P � 0.020), last value for urea reduction ratio (P � 0.044), and last value for number receiving<br />
intravenous iron (P � 0.001).<br />
at the end of the study. The last observed values were similar in<br />
the two target groups except for a higher proportion receiving<br />
intravenous iron, number of antihypertensive drugs, and lower<br />
urea reduction ratios in the higher target group (all P � 0.05).<br />
There was no difference in the change in number of antihypertensive<br />
drugs from baseline to last value, comparing the two<br />
groups.<br />
Table 3 shows the major cardiac outcomes of the study,<br />
compared by assigned hemoglobin target. LVVI did not change<br />
significantly over time in the overall study population, and<br />
changes in LVVI were similar in both target groups. Although<br />
LVMI increased over time in the overall study population (P �<br />
0.001), the changes observed were unaffected by target hemoglobin<br />
assignment. These conclusions were unchanged when<br />
only those who had echocardiogram performed after week 80<br />
were included in the analysis. Rates of de novo heart failure<br />
were similar in both target groups, as were the changes in<br />
6-min walking distance.<br />
Table 4 shows the QOL outcomes, by assigned hemoglobin.
Table 3. Changes in LVVI, LVMI, 6-min walking test, and incidence of heart failure for the lower and higher<br />
target groups a<br />
SF-36 Vitality scores improved more in the higher than in the<br />
lower target group (P � 0.036), and differences between target<br />
groups, adjusted for multiple comparisons, were significant at<br />
weeks 24, 36, 48, 60, and 72 (Figure 2). No significance betweengroup<br />
differences were seen in the time course of FACIT Fatigue<br />
scores and the KDQOL Quality of Social Interaction<br />
scores.<br />
Thirty-three patients, 20 in the lower and 13 in the higher<br />
target group, died during the study (P � 0.28). Table 5 shows<br />
rates of treatment-emergent adverse events, vascular events,<br />
access loss events, cardiac events, and death. The proportions<br />
with at least one treatment-emergent adverse event were similar<br />
in both target groups; more patients in the lower target<br />
group experienced skeletal pain (P � 0.009), surgery (P �<br />
0.013), and dizziness (P � 0.001), whereas more patients in the<br />
higher target group experienced headache (P � 0.030) and<br />
cerebrovascular events (P � 0.045).<br />
Discussion<br />
We studied patients who had recently started hemodialysis<br />
therapy without overt cardiac disease. The fraction of incident<br />
Lower<br />
(9.5 to 11.5 g/dl)<br />
Higher<br />
(13.5 to 14.5 g/dl)<br />
Between Group<br />
Effect b<br />
Page 118<br />
2184 Journal of the American Society of Nephrology J Am Soc Nephrol 16: 2180–2189, 2005<br />
LVVI (ml/m 2 ; n �mean � SD�)<br />
baseline 300 (68.6 � 21.1) 296 (68.8 � 20.9)<br />
week 24 254 (70.6 � 21.7) 255 (69.4 � 22.4)<br />
week 48 222 (70.4 � 25.5) 223 (67.5 � 23.4)<br />
week 96 169 (68.5 � 25.2) 170 (66.7 � 26.1)<br />
last value 256 (69.0 � 25.2) 264 (68.4 � 25.7)<br />
% change from baseline c (n �Est � SE�) 256 (8.3 � 4.7) 264 (7.6 � 4.7) �0.7 0.8726<br />
LVMI (g/m 2 ; n �mean� SD�)<br />
baseline 300 (111.9 � 33.2) 296 (116.6 � 35.5)<br />
week 24 254 (121.3 � 37.2) 255 (121.7 � 40.1)<br />
week 48 222 (122.8 � 42.5) 223 (124.2 � 38.9)<br />
week 96 169 (128.2 (40.3) 166 (128.4 � 43.2)<br />
last value 256 (126.3 � 40.9) 260 (126.8 � 42.4)<br />
% change from baseline c (n �Est� SE�) 256 (16.8 � 3.5) 260 (14.2 � 3.5) �2.6 0.4353<br />
Six-min walking test (m; N �mean� SD�)<br />
baseline 277 (399 � 136) 284 (385 � 136)<br />
week 24 233 (416 � 133) 242 (407 � 141)<br />
week 48 200 (416 � 138) 203 (416 � 142)<br />
week 96 143 (415 � 144) 142 (412 � 142)<br />
last value 242 (416 � 141) 254 (410 � 144)<br />
change from baseline d (n �Est� SE�) 237 (26 � 9) 249 (32 � 9) 6.6 0.4462<br />
Congestive heart failure (N; n �%�) 300 (12 �4%�) 296 (11 �4%�) 0.8687 e<br />
a<br />
LVVI, left ventricular volume index; LVMI, left ventricular mass index.<br />
b<br />
Estimated treatment difference (higher target group minus lower target group).<br />
c<br />
Compared with analysis of covariance, adjusted for baseline left ventricular hypertrophy, gender, and epoetin � usage at<br />
randomization.<br />
d<br />
Compared with analysis of covariance, adjusted for baseline gender and epoetin � usage at randomization.<br />
e<br />
Log-rank statistic from the time-to-event analysis.<br />
dialysis patients in the Canadian echocardiographic cohort<br />
study (1), with manifestations similar to the inclusion criteria of<br />
the current study (no symptomatic heart failure or ischemic<br />
heart disease and LVVI � 100 ml/m 2 ) was 43%. Hemoglobin<br />
targets higher than the current guidelines had no effect on<br />
cardiac dimensions, the incidence of congestive heart failure, or<br />
performance on a 6-min walking test. QOL (in terms of vitality)<br />
was improved. Adverse event rates were comparable in both<br />
groups, except for skeletal pain, surgery, and dizziness being<br />
significantly higher in the lower target group and headaches<br />
and cerebrovascular events being higher in the higher target<br />
group.<br />
Several observational studies have shown associations between<br />
anemia and adverse outcomes in dialysis patients (8–11).<br />
Both uncontrolled (30,31) and controlled (14) studies have<br />
shown that partial correction of anemia leads to partial regression<br />
of LVH in dialysis patients, in addition to improving QOL<br />
and physical performance (12,13). Three controlled studies of<br />
normalization of hemoglobin with erythropoietin in hemodialysis<br />
populations have been reported to date. The United States<br />
Normal Hematocrit Trial differed from our study in several<br />
P
Table 4. Quality-of-life outcomes for the lower and higher target groups a<br />
Lower<br />
(9.5 to 11.5 g/dl)<br />
respects, including the requirement of pre-existing symptomatic<br />
cardiac disease, a higher proportion of patients with diabetes,<br />
patients on dialysis therapy an average of 3 yr or more,<br />
the predominance of synthetic grafts for vascular access, and<br />
the administration of substantially larger epoetin � doses in<br />
both target groups. Primary outcome rates (death or first nonfatal<br />
myocardial infarction) were higher in the higher target<br />
groups, although this was not statistically significant. Although<br />
rates of access loss were significantly higher in the normalized<br />
group, QOL was better (18). The study was stopped early<br />
because of significantly higher rates of vascular access thrombosis<br />
and loss, together with 30% higher mortality in the high<br />
hematocrit group. The Canadian Normalization of Hemoglobin<br />
trial included patients with asymptomatic LVH or LV dilation.<br />
The higher hemoglobin target failed to induce regression of<br />
pre-existing LVH or dilation. Secondary outcome analysis suggested<br />
that higher hemoglobin levels could prevent de novo left<br />
ventricular dilation; in addition, QOL was improved without<br />
Higher<br />
(13.5 to 14.5 g/dl)<br />
Page 119<br />
J Am Soc Nephrol 16: 2180–2189, 2005 <strong>Anemia</strong> Correction in Hemodialysis Patients 2185<br />
Between Group<br />
N Est � SE N Est � SE Est � SE P b<br />
FACIT-Fatigue d<br />
week 24 291 69.7 � 1.0 291 70.9 � 1.0 1.3 � 1.2 0.28 0.56<br />
week 36 291 68.9 � 1.0 291 70.5 � 1.0 1.6 � 1.1 0.16 0.32<br />
week 48 291 68.1 � 1.0 291 70.0 � 1.0 1.9 � 1.2 1.00 0.20<br />
week 60 291 67.3 � 1.0 291 69.5 � 0.1 2.3 � 1.3 0.08 0.16<br />
week 72 291 66.4 � 1.2 291 69.1 � 1.2 2.6 � 1.5 0.08 0.15<br />
week 84 291 65.6 � 1.3 291 68.6 � 1.3 3.0 � 1.7 0.08 0.16<br />
week 96 291 64.8 � 1.4 291 68.1 � 1.5 3.3 � 1.9 0.09 0.17<br />
mean follow-up minus baseline 291 �3.21 � 1.0 291 �1.0 � 1.0 2.3 � 1.3 0.08 0.16<br />
SF-36 Vitality d<br />
week 24 282 55.1 � 1.1 282 59.2 � 1.1 4.1 � 1.4 0.002 0.007<br />
week 36 282 54.6 � 1.1 282 58.5 � 1.1 3.9 � 1.3 0.003 0.008<br />
week 48 282 54.2 � 1.1 282 57.9 � 1.1 3.7 � 1.3 0.005 0.014<br />
week 60 282 53.7 � 1.1 282 57.2 � 1.1 3.5 � 1.4 0.011 0.035<br />
week 72 282 53.3 � 1.2 282 56.6 � 1.2 3.3 � 1.6 0.032 0.096<br />
week 84 282 52.8 � 1.3 282 56.0 � 1.4 3.1 � 1.8 0.073 0.220<br />
week 96 282 52.4 � 1.5 282 55.3 � 1.5 2.9 � 2.0 0.147 0.275<br />
mean follow-up minus baseline 282 �2.31 � 1.08 282 1.21 � 1.08 3.5 � 1.4 0.012 0.036<br />
KDQOL quality of social interaction d<br />
week 24 282 67.6 � 1.4 282 68.2 � 1.4 0.5 � 1.3 0.68 0.68<br />
week 36 282 67.4 � 1.3 282 68.0 � 1.3 0.6 � 1.2 0.62 0.62<br />
week 48 282 67.1 � 1.3 282 67.8 � 1.3 0.7 � 1.2 0.58 0.56<br />
week 60 282 66.9 � 1.3 282 67.7 � 1.3 0.8 � 1.3 0.56 0.58<br />
week 72 282 66.7 � 1.4 282 67.5 � 1.4 0.8 � 1.4 0.56 0.56<br />
week 84 282 66.4 � 1.4 282 67.3 � 1.5 0.9 � 1.6 0.56 0.56<br />
week 96 282 66.2 � 1.5 282 67.1 � 1.6 1.0 � 1.7 0.57 0.58<br />
mean follow-up minus baseline 282 0.03 � 1.0 282 0.8 � 1.0 0.8 � 1.30 0.56 0.56<br />
a<br />
FACIT, Functional Assessment of Chronic Illness Therapy; KDQOL, Kidney Disease Quality of Life.<br />
b<br />
Unadjusted P value.<br />
c<br />
The P value is adjusted for multiple comparisons across the three primary QOL scales using the Hochberg procedure.<br />
d<br />
Results from piecewise linear regression, where one slope was used from weeks 0 to 24 and another slope was used from<br />
week 24 and beyond. This analysis assumed that missing QOL data were missing at random and unstructured covariance.<br />
Figure 2. Mean of change in SF-36 Vitality scores from baseline in<br />
the lower and higher target groups, presented � 2 SE. *P � 0.05.<br />
P c
Table 5. Treatment-emergent adverse events that occurred in �10% of patients; vascular, access loss, and cardiac<br />
events that occurred in �2% of patients; and death in lower and higher target groups a<br />
Lower (9.5 to 11.5 g/dl;<br />
n � 300)<br />
Higher (13.5 to 14.5 g/dl;<br />
n � 296)<br />
Treatment emergent AE in �10% of patients<br />
any AE<br />
cardiovascular<br />
281 (94%) 284 (96%)<br />
hypertension 110 (37) 120 (41)<br />
hypotension<br />
platelet, bleeding, and clotting<br />
105 (35) 85 (29)<br />
arteriovenous fistula thrombosis 23 (8) 30 (10)<br />
hematoma<br />
vascular (extracardiac) disorders<br />
36 (12) 45 (15)<br />
arteriovenous fistula loss<br />
gastrointestinal<br />
26 (9) 30 (10)<br />
vomiting 52 (17) 54 (18)<br />
diarrhea 53 (18) 50 (17)<br />
nausea 53 (18) 47 (16)<br />
abdominal pain<br />
respiratory<br />
46 (15) 45 (15)<br />
upper respiratory tract infection 69 (23) 72 (24)<br />
dyspnea 42 (14) 35 (12)<br />
cough 36 (12) 35 (12)<br />
pharyngitis<br />
musculoskeletal<br />
31 (10) 29 (10)<br />
myalgia 85 (28) 81 (27)<br />
skeletal pain b<br />
64 (21) 39 (13)<br />
arthralgia<br />
nervous system<br />
43 (14) 36 (12)<br />
64 (21) 86 (29)<br />
headache b<br />
dizziness b<br />
40 (13) 16 (5)<br />
skin<br />
skin disorder 39 (13) 41 (14)<br />
pruritus<br />
other<br />
33 (11) 23 (8)<br />
infection 32 (11) 34 (11)<br />
urinary tract infection 27 (9) 29 (10)<br />
hyperparathyroidism 30 (10) 19 (6)<br />
pain 47 (16) 41 (14)<br />
back pain 40 (13) 35 (12)<br />
fever 42 (14) 30 (10)<br />
influenza-like symptoms 37 (12) 30 (10)<br />
device complications 27 (9) 42 (14)<br />
surgery b<br />
39 (13) 20 (7)<br />
Vascular, access loss, and cardiac events in �2% of patients<br />
vascular<br />
arteriovenous fistula thrombosis 36 (12) 45 (15)<br />
Non–site-specific embolism thrombosis 12 (4) 14 (5)<br />
permanent catheter thrombosis 9 (3) 8 (3)<br />
cerebrovascular disorder b<br />
4 (1) 12 (4)<br />
peripheral ischemia 7 (2) 8 (3)<br />
angina pectoris 8 (3) 9 (3)<br />
myocardial infarction 4 (1) 7 (2)<br />
chest pain 7 (2) 4 (1)<br />
access loss<br />
permanent catheter loss 6 (2) 7 (2)<br />
arteriovenous fistula loss 27 (9) 30 (10)<br />
arteriovenous graft loss 9 (3) 9 (3)<br />
cardiac<br />
angina pectoris 8 (3) 9 (3)<br />
myocardial infarction 4 (1) 7 (2)<br />
chest pain 7 (2) 4 (1)<br />
tachycardia 15 (5) 22 (7)<br />
palpitations 9 (3) 6 (2)<br />
atrial fibrillation 7 (2) 6 (2)<br />
bradycardia 5 (2) 7 (2)<br />
pulmonary edema 16 (5) 9 (3)<br />
cardiac failure 6 (2) 2 (1)<br />
pulmonary edema or heart failure 19 (61) 11 (4)<br />
death 20 (7) 13 (4)<br />
Page 120<br />
2186 Journal of the American Society of Nephrology J Am Soc Nephrol 16: 2180–2189, 2005<br />
a AE, adverse events.<br />
b P � 0.05 for all comparisons except headache (P � 0.030), skeletal pain (P � 0.009), surgery (P � 0.013), dizziness (P �<br />
0.001), and cerebrovascular disorders (P � 0.045).
compromising vascular access (arteriovenous fistulas, predominantly)<br />
(19). Another study used a double-blind crossover<br />
design to compare hemoglobin targets of 10 and 14 g/dl, each<br />
applied for 6 wk; the higher target led to reduced cardiac<br />
output and improved QOL (21).<br />
Two trials of higher hemoglobin targets, not restricted to<br />
hemodialysis patients, have been reported. A Scandinavian<br />
study with target hemoglobin levels of 9.0 to 12.0 or 13.5 to 16.0<br />
g/dl included dialysis and nondialysis patients with chronic<br />
kidney disease. QOL improved with the higher target, whereas<br />
thrombovascular event rates, including those involving vascular<br />
access, were similar (20). An Australian study compared<br />
strategies of early or delayed anemia therapy targets in patients<br />
with chronic kidney disease. Eligible patients had hemoglobin<br />
levels of 11.0 to 12.0 g/dl (women) or 11.0 to 13.0 g/dl (men).<br />
One group received epoetin � immediately, to maintain hemoglobin<br />
between 12.0 and 13.0 g/L. In the other group, hemoglobin<br />
was allowed to decline below 9.0 g/dl; epoetin � then<br />
was used to maintain levels between 9.0 and 10.0 g/dl. The<br />
mean hemoglobin levels achieved, in practice, were 12.1 and<br />
10.8 g/dl, respectively. In this 2-yr study, changes in LVMI<br />
were similar in both target groups (32). Thus, the available<br />
literature suggests, as in our study, that enhanced QOL is the<br />
only consistent benefit conferred by normalizing hemoglobin in<br />
patients with chronic kidney disease.<br />
Assessment of different adverse event rates should take account<br />
of the fact that multiple comparisons were made. The<br />
observation that a higher number of cerebrovascular events<br />
occurred in the higher (n � 12) compared with the lower (n �<br />
4) target group requires further study. Previous trials in chronic<br />
kidney disease did not report a higher incidence of stroke in the<br />
higher target group (18–21), but concern has been expressed<br />
regarding thrombotic events during erythropoietin therapy in<br />
oncology studies (33). The higher cerebrovascular event rate<br />
was not supported by a higher death rate in the higher target<br />
(n � 13) compared with the lower (n � 20) target group, and<br />
other cardiovascular events rates were similar. The BP levels<br />
were similar in both groups. Although a higher number of<br />
antihypertensive agents were prescribed in the higher group<br />
(compared with the lower group) at study end, the change in<br />
number of antihypertensive agents from baseline was similar in<br />
both groups.<br />
Certain limitations in our study need to be considered. (1)<br />
The study was not powered to examine major cardiovascular<br />
events and death. This being said, our study used a randomized,<br />
double-blind design; a reasonable duration of follow-up;<br />
and sequential measurements in an incident cohort that started<br />
hemodialysis. (2) The positive findings of our study—that<br />
higher hemoglobin levels increase vitality—were generated<br />
from secondary outcome analyses. The changes observed were<br />
probably clinically important (34). (3) Our study, by design,<br />
selected hemodialysis patients without symptomatic cardiac<br />
disease and severe left ventricular dilation, and its findings can<br />
be truly generalized only to such patients (approximately 40 to<br />
50% of incident dialysis patients). As a result of the inclusion<br />
criteria, the average age of the patients studied (51 yr) was<br />
younger than the median age of incident patients in Canada in<br />
Page 121<br />
J Am Soc Nephrol 16: 2180–2189, 2005 <strong>Anemia</strong> Correction in Hemodialysis Patients 2187<br />
2000 (65 yr), and the proportion with diabetes (18%) was lower<br />
(44%) (35). This is reflected in the low mortality rate during the<br />
study (5.5%). (4) Despite central monitoring with real-time<br />
treatment recommendations, we approached but failed to reach<br />
intended hemoglobin targets in the higher target group. However,<br />
the separation by target group was approximately 2.3<br />
g/dl throughout the maintenance phase of the study and was<br />
compatible with the sample size assumption that a 15% difference<br />
in LVVI changes would be associated with a 2-g/dl difference<br />
in hemoglobin levels (19). Therefore, it seems unlikely<br />
that the failure to achieve hemoglobin targets could fully account<br />
for the similarity seen in the primary outcome comparisons.<br />
(5) Although we observed no difference in cardiovascular,<br />
access, and malignancy rates, the actual event rates were low,<br />
and an untreated placebo group was not used. Thus, small or<br />
moderate differences in event rates cannot be excluded. (6) The<br />
high dropout rate was anticipated because patients such as<br />
those in our study are usually referred and then wait for renal<br />
transplantation. No differences in the primary outcome were<br />
observed whether analyzed by changes from baseline to last<br />
value or by analysis of serial measurements.<br />
Despite its limitations, we believe that this randomized, controlled<br />
trial, in enrolling a large number of incidence hemodialysis<br />
patients, in achieving a clinically important difference in<br />
hemoglobin levels, and in serial follow-up of several clinically<br />
important outcomes over 2 yr, provides important information<br />
regarding the question of normalizing hemoglobin in dialysis<br />
patients. It suggests that normalization of hemoglobin in patients<br />
who start hemodialysis, although improving vitality, has<br />
no effect on left ventricular size when compared with patients<br />
who are maintained with hemoglobin levels between 9.5 and<br />
11.5 g/dl.<br />
Acknowledgments<br />
This paper was presented at the American Society of Nephrology<br />
Clinical Trials Symposium, November 1, 2004, St. Louis, MO (J AmSoc<br />
Nephrol 15: 726A, 2004).<br />
We are grateful to Janet Morgan in Canada and to Aileen Foley in<br />
England for coordinating patient enrollment and management.<br />
P.S.P. and R.N.F., the co-principal investigators, designed the trial,<br />
applied for funding to Johnson and Johnson, coordinated the study,<br />
and wrote the report. D.J.S. performed the statistical analyses and<br />
contributed to preparation of the manuscript. B.H.W. contributed to the<br />
study design, collection of data, and preparation of the manuscript.<br />
M.J.Z. contributed to the study design with respect to QOL analysis, to<br />
analysis and interpretation of the data, and to the manuscript. D.F.<br />
contributed to the study design, to the collection and analysis of the<br />
data, and to the manuscript.<br />
Members of the Canadian European Study Group<br />
EPO-INT-68 Independent Data Monitoring Committee Members:<br />
L.J. Wei, Boston, MA; M.-M. Samama, Paris, France; P. Ivanovich,<br />
Chicago, IL; M.A. Pfeffer, Boston, MA<br />
Principal Investigator/Site: W. Hoerl, Wien, Austria; H.-K. Stummvoll,<br />
Linz, Austria; G. Mayer, Innsbruck, Austria; H. Graf, Wien,<br />
Austria; H. Holzer, Graz, Austria; Y. Vanrenterghem, Leuven, Belgium;<br />
W. Lornoy, Aalst, Belgium; C. Tielemans, Bruxelles, Belgium; M.<br />
Jadoul, Bruxelles, Belgium; P. Parfrey, St. John’s, Canada; P. Barre,
Montréal, Canada; A. Levin, Vancouver, Canada; P. Cartier, Montréal,<br />
Canada; N. Muirhead, London, Canada; A. Fine, Winnipeg, Canada; B.<br />
Murphy, Calgary, Canada; S. Handa, St. John’s, Canada; P. Campbell,<br />
Edmonton, Canada; V. Pichette, Montreal, Canada; S. Tobe, Toronto,<br />
Canada; C. Lok, Toronto, Canada; D. Kates, Kelowna, Canada; D.<br />
Holland, Kingston, Canada; G. Karr, Penticton, Canada; G. Pylpchuk,<br />
Saskatoon, Canada; G. Wu, Mississauga, Canada; M. Vasilevsky, Montreal,<br />
Canada; E. Carisle, Hamilton, Canada; E.R. Gagne, Fleurimont,<br />
Canada; W. Callaghan, Windsor, Canada; G. Soltys, Greenfield Park,<br />
Canada; P. Tam, Scarborough, Canada; R. Turcot, Trios-Rivieres, Canada;<br />
M. Berrall, Toronto, Canada; J. Zacharias, Winnipeg, Canada; S.<br />
Donnelly, Toronto, Canada; G. London, Fleury-Merogis, France; A.<br />
London, Aulnay sous Bois, France; F.P. Wambergue, Lille, France; H.<br />
Geiger, Frankfurt, Germany; V. Kliem, Hann Muenden, Germany; R.<br />
Winkler, Rostock, Germany; B. Kraemer, Regensburg, Germany; H.<br />
Schiffl, Munich, Germany; R. Brunkhorst, Hannover, Germany; D. Seybold,<br />
Bayreuth, Germany; M. Hilfenhaus, Langenhagen, Germany; D.<br />
Schaumann, Hameln, Germany; R. Goetz, Bad Windsheim, Germany;<br />
P. Roch, Regensburg, Germany; H.-P. Brasche, Ludwigshafen, Germany;<br />
V. Wizemann, Giessen, Germany; K. Bittner, Ansbach, Germany;<br />
K. Appen, Hamburg, Germany; B. Schroeder, Bad Toelz, Germany; W.<br />
Schropp, Munich, Germany; D. O’Donoghue, Salford, England; I. Mac-<br />
Dougall, London, England; G. Warwick, Leicester, England; M. Raftery,<br />
London, England; K. Farrington, Stevenage, England; J. Kwan, Carshalton,<br />
England; P. Conlon, Dublin, Ireland; G. Mellotte, Dublin, Ireland;<br />
K. Siamopoulos, Ioannina, Greece; N. Tsaparas, Crete, Greece; D. Tsakiris,<br />
Veria, Greece; V. Vargemezis, Alexandroupolis, Greece; S. Ferenczi,<br />
Gyor, Hungary; S. Gorogh, Kisvarda, Hungary; I. Kulcsar,<br />
Szombathely, Hungary; L. Locsey, Debrecen, Hungary; K. Akocsi,<br />
Veszprem, Hungary; I. Solt, Szekesfehervar, Hungary; O. Arkossy,<br />
Budapest, Hungary; E. Kiss, Szeged, Hungary; J. Manitius, Bydgoszcz,<br />
Poland; B. Rutkowski, Gdansk, Poland; A. Wiecek, Katowice, Poland;<br />
W. Sulowicz, Krakow, Poland; A. Ksiazek, Lublin, Poland; S. Czekalski,<br />
Poznan, Poland; M. Klinger, Wroclaw, Poland; M. Mysliwiec, Bialystok,<br />
Poland; H. Augustyniak-Bartosik, Milicz, Poland; J. Imiela, Warszawa-<br />
Miedzylesie, Poland; A. Sydor, Tarnow, Poland; R. Rudka, Bytom,<br />
Poland; M. Kiersztejn, Chrzanow, Poland; R. Wnuk, Oswiecim, Poland;<br />
A. Milkowsk, Krakow, Poland; F. Valderrabano, Madrid, Spain; P.<br />
Aljama, Córdoba, Spain; H. Alcocer, Valencia, Spain; A. Purroy, Pamplona,<br />
Spain<br />
References<br />
1. Foley RN, Parfrey PS, Harnett JD, Kent GM, Martin CJ,<br />
Murray DC, Barre PE: Clinical and echocardiographic disease<br />
in patients starting end-stage renal disease therapy.<br />
Kidney Int 47: 186–192, 1995<br />
2. Acquatella H, Perez-Rojas M, Burger B, Guinand-Baldo A:<br />
Left ventricular function in terminal uremia. A hemodynamic<br />
and echocardiographic study. Nephron 22: 160–174,<br />
1978<br />
3. London GM, Pannier B, Guerin AP, Blacher J, Marchais SJ,<br />
Darne B, Metivier F, Adda H, Safar ME: Alterations of left<br />
ventricular hypertrophy in and survival of patients receiving<br />
hemodialysis: Follow-up of an interventional study.<br />
J Am Soc Nephrol 12: 2759–2767, 2001<br />
4. Parfrey PS, Foley RN, Harnett JD, Kent GM, Murray DC,<br />
Barre PE: Outcome and risk factors for left ventricular<br />
disorders in chronic uraemia. Nephrol Dial Transplant 11:<br />
1277–1285, 1996<br />
5. Silberberg JS, Barre PE, Prichard SS, Sniderman AD: Im-<br />
Page 122<br />
2188 Journal of the American Society of Nephrology J Am Soc Nephrol 16: 2180–2189, 2005<br />
pact of left ventricular hypertrophy on survival in endstage<br />
renal disease. Kidney Int 36: 286–290, 1989<br />
6. Stack AG, Saran R: Clinical correlates and mortality impact<br />
of left ventricular hypertrophy among new ESRD patients<br />
in the United States. Am J Kidney Dis 40: 1202–1210, 2002<br />
7. Zoccali C, Benedetto FA, Mallamaci F, Tripepi G, Giacone<br />
G, Cataliotti A, Seminara G, Stancanelli B, Malatino LS;<br />
CREED Investigators: Prognostic impact of the indexation<br />
of left ventricular mass in patients undergoing dialysis.<br />
J Am Soc Nephrol 12: 2768–2774, 2004<br />
8. Foley RN, Parfrey PS, Harnett JD, Kent GM, Murray DC,<br />
Barre PE: The impact of anemia on cardiomyopathy, morbidity,<br />
and mortality in end-stage renal disease. Am J Kidney<br />
Dis 28: 53–61, 1996<br />
9. Ma JZ, Ebben J, Xia H, Collins AJ: Hematocrit level and<br />
associated mortality in hemodialysis patients. J Am Soc<br />
Nephrol 10: 610–619, 1999<br />
10. Madore F, Lowrie EG, Brugnara C, Lew NL, Lazarus JM,<br />
Bridges K, Owen WF: <strong>Anemia</strong> in hemodialysis patients:<br />
Variables affecting this outcome predictor. J Am Soc Nephrol<br />
8: 1921–1929, 1997<br />
11. Xia H, Ebben J, Ma JZ, Collins AJ: Hematocrit levels and<br />
hospitalization risks in hemodialysis patients. J Am Soc<br />
Nephrol 10: 1309–1316, 1999<br />
12. Canadian Erythropoietin Study Group: Association between<br />
recombinant human erythropoietin and quality of<br />
life and exercise capacity of patients receiving haemodialysis.<br />
BMJ 300: 573–578, 1990<br />
13. McMahon LP, Johns JA, McKenzie A, Austin M, Fowler R,<br />
Dawborn JK: Haemodynamic changes and physical performance<br />
at comparative levels of haemoglobin after longterm<br />
treatment with recombinant erythropoietin. Nephrol<br />
Dial Transplant 7: 1199–1206, 1992<br />
14. Sikole A, Polenakovic M, Spirovska V, Polenakovic B, Masin<br />
G: Analysis of heart morphology and function following<br />
erythropoietin treatment of anemic dialysis patients.<br />
Artif Organs 17: 977–984, 1993<br />
15. National Kidney Foundation Kidney Disease Outcomes<br />
Quality Initiative (NKF K/DOQI): Guidelines for anemia<br />
of chronic kidney disease. Available: www.kidney.org/<br />
professionals/kdoqi/guidelines/doqiupan_ii.html. Accessed<br />
March 2, 2005<br />
16. Churchill DN, Blake PG, Jindal KK, Toffelmire EB, Goldstein<br />
MB: Clinical practice guidelines for initiation of dialysis.<br />
Canadian Society of Nephrology. J Am Soc Nephrol<br />
10[Suppl 13]: S289–S291, 1999<br />
17. Locatelli F: European best practice guidelines II: Targets<br />
for anaemia treatment. Nephrol Dial Transplant 19[Suppl 2]:<br />
ii6–ii15, 2004<br />
18. Besarab A, Bolton WK, Browne JK, Egrie JC, Nissenson AR,<br />
Okamoto DM, Schwab SJ, Goodkin DA: The effects of<br />
normal as compared with low hematocrit values in patients<br />
with cardiac disease who are receiving hemodialysis<br />
and epoetin. N Engl J Med 339: 584–590, 1998<br />
19. Foley RN, Parfrey PS, Morgan J, Barre PE, Campbell P,<br />
Cartier P, Coyle D, Fine A, Handa P, Kingma I, Lau CY,<br />
Levin A, Mendelssohn D, Muirhead N, Murphy B, Plante<br />
RK, Posen G, Wells GA: Effect of hemoglobin levels in<br />
hemodialysis patients with asymptomatic cardiomyopathy.<br />
Kidney Int 58: 1325–1335, 2000<br />
20. Furuland H, Linde T, Ahlmen J, Christensson A, Strombom<br />
U, Danielson BG: A randomized controlled trial of
J Am Soc Nephrol 16: 2180–2189, 2005 <strong>Anemia</strong> Correction in Hemodialysis Patients 2189<br />
haemoglobin normalization with epoetin alfa in pre-dialysis<br />
and dialysis patients. Nephrol Dial Transplant 18: 353–<br />
361, 2003<br />
21. McMahon LP, Mason K, Skinner SL, Burge CM, Grigg<br />
LE, Becker GJ: Effects of haemoglobin normalization on<br />
quality of life and cardiovascular parameters in endstage<br />
renal failure. Nephrol Dial Transplant 15: 1425–1430,<br />
2000<br />
22. Hays RD, Kallich JD, Mapes DL, Coons SJ, Carter WB:<br />
Development of the kidney disease quality of life<br />
(KDQOL) instrument. Qual Life Res 3: 329–338, 1994<br />
23. Cella D: Manual of the Functional Assessment of Chronic<br />
Illness Therapy (FACIT) Measurement System, Version 4,<br />
Evanston, Center on Outcomes, Research and Education<br />
(CORE), Evanston Northwestern Healthcare and Northwestern<br />
University, 1997<br />
24. Fitts SS, Guthrie MR: Six-minute walk by people with<br />
chronic renal failure. Assessment of effort by perceived<br />
exertion. Am J Phys Med Rehabil 74: 54–58, 1995<br />
25. Sahn DJ, DeMaria A, Kisslo J, Weyman A: Recommendations<br />
regarding quantitation in M-mode echocardiography:<br />
Results of a survey of echocardiographic measurements.<br />
Circulation 58: 1072–1083, 1978<br />
26. Pombo JF, Troy BL, Russell RO Jr: Left ventricular volumes<br />
and ejection fraction by echocardiography. Circulation 43:<br />
480–490, 1971<br />
27. Devereux RB: Detection of left ventricular hypertrophy by<br />
M-mode echocardiography. Anatomic validation, standardization,<br />
and comparison to other methods. Hypertension<br />
9: II9–II26, 1987<br />
28. Lin CL, Hsu PY, Yang CT, Yang HY, Yang TY, Huang WH,<br />
Huang CC: LV mass index significantly impacts on patient<br />
and renal outcomes in patients with coronary artery bypass<br />
grafting and poor left-ventricular function. Ren Fail<br />
25: 287–295, 2003<br />
29. Proschan MA, Waclawiw MA: Practical guidelines for<br />
multiplicity adjustment in clinical trials. Control Clin Trials<br />
21: 527–539, 2000<br />
30. London GM, Zins B, Pannier B, Naret C, Berthelot JM,<br />
Jacquot C, Safar M, Drueke TB: Vascular changes in hemodialysis<br />
patients in response to recombinant human erythropoietin.<br />
Kidney Int 36: 878–882, 1989<br />
31. Macdougall IC, Lewis NP, Saunders MJ, Cochlin DL, Davies<br />
ME, Hutton RD, Fox KA, Coles GA, Williams JD:<br />
Long-term cardiorespiratory effects of amelioration of renal<br />
anaemia by erythropoietin. Lancet 335: 489–493, 1990<br />
32. Roger SD, McMahon LP, Clarkson A, Disney A, Harris D,<br />
Hawley C, Healy H, Kerr P, Lynn K, Parnham A, Pascoe R,<br />
Voss D, Walker R, Levin A: Effects of early and late intervention<br />
with epoetin alpha on left ventricular mass among patients<br />
with chronic kidney disease (stage 3 or 4): Results of a<br />
randomized clinical trial. J Am Soc Nephrol 15: 148–156, 2004<br />
33. Leyland-Jones B: Breast cancer trial with erythropoietin<br />
terminated unexpectedly. Lancet Oncol 4: 459–460, 2003<br />
34. Hays RD, Morales LS: The RAND-36 measure of healthrelated<br />
quality of life. Ann Med 33: 350–357, 2001<br />
35. Canadian Organ Replacement Register: Preliminary report<br />
for dialysis and transplantation 2002, Canadian<br />
Institute for Health Information, Ottawa, Canada 2002.<br />
Available: secure.cihi.ca/cihiweb/en/downloads/services_<br />
corr_ e_2002prelimreport.pdf. Accessed March 2, 2005<br />
Access to UpToDate on-line is available for additional clinical information<br />
at http://www.jasn.org/<br />
Page 123
The new england<br />
journal of medicine<br />
established in 1812 november 19, 2009 vol. 361 no. 21<br />
A Trial of Darbepoetin Alfa in Type 2 Diabetes<br />
and Chronic Kidney Disease<br />
Marc A. Pfeffer, M.D., Ph.D., Emmanuel A. Burdmann, M.D., Ph.D., Chao-Yin Chen, Ph.D., Mark E. Cooper, M.D.,<br />
Dick de Zeeuw, M.D., Ph.D., Kai-Uwe Eckardt, M.D., Jan M. Feyzi, M.S., Peter Ivanovich, M.D.,<br />
Reshma Kewalramani, M.D., Andrew S. Levey, M.D., Eldrin F. Lewis, M.D., M.P.H., Janet B. McGill, M.D.,<br />
John J.V. McMurray, M.D., Patrick Parfrey, M.D., Hans-Henrik Parving, M.D., Giuseppe Remuzzi, M.D.,<br />
Ajay K. Singh, M.D., Scott D. Solomon, M.D., and Robert Toto, M.D., for the TREAT Investigators*<br />
ABSTRACT<br />
BACKGROUND<br />
<strong>Anemia</strong> is associated with an increased risk of cardiovascular and renal events<br />
among patients with type 2 diabetes and chronic kidney disease. Although darbepoetin<br />
alfa can effectively increase hemoglobin levels, its effect on clinical outcomes<br />
in these patients has not been adequately tested.<br />
METHODS<br />
In this study involving 4038 patients with diabetes, chronic kidney disease, and<br />
anemia, we randomly assigned 2012 patients to darbepoetin alfa to achieve a hemoglobin<br />
level of approximately 13 g per deciliter and 2026 patients to placebo, with<br />
rescue darbepoetin alfa when the hemoglobin level was less than 9.0 g per deciliter.<br />
The primary end points were the composite outcomes of death or a cardiovascular<br />
event (nonfatal myocardial infarction, congestive heart failure, stroke, or hospitalization<br />
for myocardial ischemia) and of death or end-stage renal disease.<br />
RESULTS<br />
Death or a cardiovascular event occurred in 632 patients assigned to darbepoetin alfa<br />
and 602 patients assigned to placebo (hazard ratio for darbepoetin alfa vs. placebo,<br />
1.05; 95% confidence interval [CI], 0.94 to 1.17; P = 0.41). Death or end-stage renal<br />
disease occurred in 652 patients assigned to darbe poetin alfa and 618 patients assigned<br />
to placebo (hazard ratio, 1.06; 95% CI, 0.95 to 1.19; P = 0.29). Fatal or nonfatal<br />
stroke occurred in 101 patients assigned to darbepoetin alfa and 53 patients assigned<br />
to placebo (hazard ratio, 1.92; 95% CI, 1.38 to 2.68; P
2020<br />
Type 2 diabetes mellitus and chronic<br />
kidney disease frequently coexist, and each<br />
disease independently increases the risk of<br />
cardiovascular events and end-stage renal disease.<br />
1,2 Intensive treatment of concomitant conventional<br />
risk factors such as hypertension and<br />
elevated levels of low-density lipoprotein reduces<br />
fatal and nonfatal cardiovascular complications<br />
and slows the progression of kidney disease. 3-8<br />
Observational studies suggest that anemia can<br />
be considered another biomarker of risk, since a<br />
lower hemoglobin level is independently associated<br />
with a higher rate of cardiovascular and renal<br />
events, 9-11 especially among patients with<br />
diabetes. 12,13 Whether the use of erythropoiesisstimulating<br />
agents (ESAs) to increase hemoglobin<br />
levels lowers this risk is not known. 14<br />
Early studies involving the use of recombinant<br />
human erythropoietin in patients with severe<br />
anemia who were undergoing dialysis showed a<br />
reduced requirement for blood transfusions and<br />
improved quality-of-life assessments, which were<br />
considered major advances. 15,16 Extrapolations<br />
from these favorable effects to other populations,<br />
including patients with anemia and earlier stages<br />
of chronic kidney disease, led to the wider use<br />
of ESAs. The presumption of the benefits associated<br />
with the use of ESAs was so pervasive that<br />
major clinical trials considered the use of placebo<br />
unnecessary or even unethical. 17-19 In fact,<br />
there were no placebo-controlled trials in a recent<br />
meta-analysis of the use of ESAs in patients with<br />
chronic kidney disease. 20 Although ESAs have<br />
been available for more than two decades, the<br />
hypothesis that this treatment approach would<br />
lower the risks associated with anemia and improve<br />
the prognosis has not been examined. 21<br />
We conducted the Trial to Reduce Cardiovascular<br />
Events with Aranesp Therapy (TREAT) to test<br />
the hypothesis that, in patients with type 2 diabetes,<br />
chronic kidney disease that does not require<br />
dialysis, and concomitant anemia, increasing<br />
hemoglobin levels with the use of this agent<br />
would lower the rates of death, cardiovascular<br />
events, and end-stage renal disease. 22<br />
Methods<br />
The TREAT was a randomized, double-blind,<br />
placebo-controlled trial conducted at 623 sites in<br />
24 countries (see the Supplementary Appendix,<br />
available with the full text of this article at NEJM.<br />
org). The institutional review board or ethics<br />
The new england journal of medicine<br />
n engl j med 361;21 nejm.org november 19, 2009<br />
committee at each site approved the protocol,<br />
and all patients provided written informed consent.<br />
Enrollment occurred from August 25, 2004,<br />
through December 4, 2007.<br />
The trial was sponsored by <strong>Amgen</strong> and designed<br />
in collaboration with an academic executive<br />
committee. Data collection and management<br />
were the responsibility of the sponsor, with oversight<br />
by the executive committee. The Statistical<br />
Data Analysis Center at the University of Wisconsin<br />
prepared the interim unblinded reports<br />
for the independent data and safety monitoring<br />
committee, which oversaw patient safety and the<br />
quality of trial conduct. The independent academic<br />
statistical center also performed all analyses<br />
for this article and provided the writing<br />
group with unrestricted access to the data. The<br />
manuscript was prepared by the principal investigator<br />
and subsequently revised and edited by<br />
all the authors. All the authors decided to submit<br />
the article for publication and assume responsibility<br />
for the accuracy and completeness of the<br />
reported data.<br />
Study Population<br />
Patients with type 2 diabetes, chronic kidney disease<br />
(an estimated glomerular filtration rate [GFR]<br />
of 20 to 60 ml per minute per 1.73 m 2 of bodysurface<br />
area, calculated with the use of the fourvariable<br />
Modification of Diet in Renal Disease<br />
formula), anemia (hemoglobin level, ≤11.0 g per<br />
deciliter), and a transferrin saturation of 15% or<br />
more were eligible for enrollment. Patients with<br />
any of the following factors were excluded: uncontrolled<br />
hypertension; previous kidney transplantation<br />
or scheduled receipt of a kidney transplant<br />
from a living related donor; current use of<br />
intravenous antibiotics, chemotherapy, or radiation<br />
therapy; cancer (except basal-cell or squamouscell<br />
carcinoma of the skin); diagnosed human<br />
immunodeficiency virus infection; active bleeding;<br />
a hematologic disease; or pregnancy. Patients<br />
who had had a cardiovascular event or grand mal<br />
seizure, had undergone major surgery, or had received<br />
an ESA in the 12 weeks before randomization<br />
were also ineligible.<br />
Study Procedures<br />
During a 2-week screening period, prestudy laboratory<br />
assessments were obtained and the eligibility<br />
of patients who had provided consent was<br />
confirmed. Patients were randomly assigned with<br />
the use of a computer-generated, permuted-block<br />
Downloaded from www.nejm.org at <strong>Amgen</strong>, Inc. on November 20, 2009 .<br />
Copyright © 2009 Massachusetts Medical Society. All rights reserved.<br />
Page 125
Darbepoetin Alfa Therapy for reduction of Cardiovascular Events<br />
design, in a 1:1 ratio, to receive darbepoetin alfa<br />
(Aranesp, <strong>Amgen</strong>) or placebo. Randomization was<br />
stratified according to the study site, the baseline<br />
level of proteinuria (with marked proteinuria defined<br />
as a ratio of total protein to creatinine [calculated<br />
in milligrams per deciliter] of ≥1.0 in a<br />
spot urine sample), and an investigator-designated<br />
history of cardiovascular disease. Darbepoetin<br />
alfa and placebo were supplied in matching prefilled<br />
syringes at 12 different strengths. A third<br />
party used a point-of-care device to monitor hemoglobin<br />
levels and enter the value into an interactive<br />
voice-response system that selected the dosage<br />
according to a computer algorithm (see the<br />
Supplementary Appendix). This algorithm was<br />
designed to adjust the dose in order to maintain<br />
the hemoglobin level at approximately 13.0 g<br />
per deciliter in the patients assigned to darbepoetin<br />
alfa.<br />
Patients in the placebo group were assigned<br />
to receive darbepoetin alfa as a rescue agent if<br />
the hemoglobin level fell below 9.0 g per deciliter,<br />
with a return to placebo once the hemoglobin<br />
level was 9.0 g per deciliter or higher. The site<br />
investigator was to be notified if any patient had<br />
a hemoglobin value of 7.0 g per deciliter or less, a<br />
value of 16.0 g per deciliter or more, or a decrease<br />
of 2.0 g per deciliter or more in a 4-week period.<br />
Measurements of hemoglobin levels and vital<br />
signs were performed every 2 weeks during the<br />
study-drug–titration period and monthly thereafter.<br />
Transferrin saturation and ferritin levels<br />
were measured quarterly; other laboratory assessments<br />
and spot urine collections were performed<br />
at 24-week intervals. Patient-reported outcomes<br />
and health resource utilization were assessed at<br />
weeks 1, 13, and 25 and every 24 weeks thereafter.<br />
At each visit, information was gathered regarding<br />
adverse events, hospitalization, transfusions,<br />
and the concomitant use of other medications.<br />
Evaluation of Outcomes<br />
The primary end points were the time to the<br />
composite outcome of death from any cause or a<br />
cardiovascular event (nonfatal myocardial infarction,<br />
congestive heart failure, stroke, or hospitalization<br />
for myocardial ischemia) and the time to<br />
the composite outcome of death or end-stage renal<br />
disease (see the Supplementary Appendix).<br />
The overall alpha level for the primary end points<br />
was split: 0.048 for the cardiovascular composite<br />
outcome and 0.002 for the renal composite outcome.<br />
All potential end points were adjudicated<br />
by a clinical end-point committee whose members<br />
were unaware of the treatment assignments,<br />
and the hematocrit and hemoglobin values were<br />
redacted from the documents under review. Important<br />
secondary end points included time to<br />
death, death from cardiovascular causes, and the<br />
components of the primary end points, as well as<br />
the rate of decline in the estimated GFR and<br />
changes in patient-reported outcomes at week 25<br />
measured with the use of the Functional Assessment<br />
of Cancer Therapy–Fatigue (FACT-Fatigue)<br />
instrument (on which scores range from 0 to 52,<br />
with higher scores indicating less fatigue) and the<br />
36-Item Short-Form General Health Survey questionnaire<br />
(calculated with norm-based scoring so<br />
that 50 is the average score, with higher scores<br />
indicating a better quality of life) (added after the<br />
second protocol amendment in May 2005).<br />
Monitoring<br />
The independent data and safety monitoring committee<br />
reviewed safety reports monthly with formal<br />
interim analyses scheduled when approximately<br />
20, 40, 60, and 80% of the total expected<br />
cardiovascular composite events had occurred.<br />
Initial guidelines for early discontinuation included<br />
a symmetric O’Brien–Fleming alpha-spending<br />
function. In April 2006, data from a non–<br />
placebo-controlled trial of a different ESA in<br />
patients with chronic kidney disease showed that<br />
treatment aimed at achieving a higher hemoglobin<br />
level (13.5 g per deciliter vs. 11.3 g per deciliter)<br />
was associated with increased rates of adverse<br />
clinical events. 17 This information and more<br />
equivocal results from a related, smaller trial 18<br />
were proactively communicated to our patients,<br />
investigators, and the data and safety monitoring<br />
committee. The committee made no recommendation<br />
to alter or terminate the study on the basis<br />
of interim data that already reflected more clinical<br />
events than the numbers of events in these<br />
related trials. The consent form was modified<br />
with the addition of the new information regarding<br />
potential harm, and all study participants<br />
were asked to provide written informed consent<br />
again. The executive committee requested that<br />
the data and safety monitoring committee adopt<br />
a more cautious stopping rule, with the use of a<br />
one-sided alpha of 0.05 for harm at each assessment<br />
(without adjustment for multiple testing)<br />
for either the cardiovascular composite outcome<br />
or death. The boundaries for efficacy remained<br />
unchanged, and with this new mandatory stop-<br />
n engl j med 361;21 nejm.org november 19, 2009 2021<br />
Downloaded from www.nejm.org at <strong>Amgen</strong>, Inc. on November 20, 2009 .<br />
Copyright © 2009 Massachusetts Medical Society. All rights reserved.<br />
Page 126
2022<br />
ping rule for harm, the committee made no recommendation<br />
to terminate the trial before its<br />
scheduled conclusion.<br />
Statistical Analysis<br />
The trial was event driven, with a total of 1203<br />
cardiovascular composite events required to provide<br />
80% statistical power to detect a 20% risk<br />
reduction for this outcome, with a two-sided type<br />
I error of 0.048 (unadjusted for interim analyses).<br />
We aimed to enroll approximately 4000 patients;<br />
assumptions included an annualized rate of events<br />
in the placebo group of 12.5%, a 15% loss to<br />
follow-up, and attenuation of the treatment effect<br />
due to the anticipated use of ESAs in patients<br />
who had progression to end-stage renal disease.<br />
Time-to-event analyses were performed with<br />
the use of life-table methods according to the<br />
intention-to-treat principle. Kaplan–Meier cumulative<br />
incidence curves were compared with the<br />
use of a two-sided log-rank test, stratified according<br />
to the baseline proteinuria level and the presence<br />
or absence of a history of cardiovascular<br />
disease. Estimated hazard ratios (for darbepoetin<br />
alfa vs. placebo) and 95% confidence intervals<br />
were obtained with the use of stratified Cox<br />
proportional-hazards models. Patients who discontinued<br />
either study drug early, including patients<br />
who began treatment with dialysis or underwent<br />
transplantation, were followed for study<br />
end points.<br />
Categorization of adverse events was based on<br />
groupings of preferred terms defined by the<br />
standardized queries in the Medical Dictionary<br />
for Regulatory Activities. 23 Analyses of patientreported<br />
outcomes were prespecified to impute<br />
missing data with the last-observation-carriedforward<br />
method and to use t-tests for treatment<br />
comparisons, with means and standard deviations.<br />
Reported P values are nominal and have<br />
not been adjusted for multiple comparisons. Additional<br />
statistical methods are described in the<br />
Supplementary Appendix.<br />
Results<br />
Patients<br />
We enrolled a total of 4047 patients, but before<br />
unblinding, we excluded all information regarding<br />
9 patients from two sites that did not adhere<br />
to Good Clinical Practice guidelines (4 patients<br />
who were randomly assigned to darbepoetin alfa<br />
and 5 patients who were randomly assigned to<br />
The new england journal of medicine<br />
n engl j med 361;21 nejm.org november 19, 2009<br />
placebo). Of the 4038 patients evaluated, 2012<br />
were assigned to receive darbepoetin alfa and<br />
2026 were assigned to receive placebo. The study<br />
was event driven and was completed on March<br />
28, 2009, with a median follow-up duration of<br />
29.1 months. At that time, 3523 patients (87.2%)<br />
were either still being followed for clinical end<br />
points or had died; this group included 1761 patients<br />
in the darbepoetin alfa group (87.5%) and<br />
1762 patients in the placebo group (87.0%). The<br />
vital status at study termination was unknown<br />
for 153 patients in the darbepoetin alfa group<br />
(7.6%) and 164 in the placebo group (8.1%) (see<br />
the Consolidated Standards for the Reporting of<br />
Trials [CONSORT] diagram in the Supplementary<br />
Appendix).<br />
The median age was 68 years, and 57.3% of<br />
the patients were women; 65.4% of the patients<br />
had a history of cardiovascular disease, with<br />
similar percentages of patients in each group reporting<br />
a history of coronary artery disease,<br />
stroke, peripheral arterial disease, and myocardial<br />
infarction. There was an imbalance in the<br />
proportion of patients with a history of heart<br />
failure (31.5% in the darbepoetin alfa group vs.<br />
35.2% in the placebo group, unadjusted P = 0.01).<br />
There were no clinically meaningful baseline imbalances<br />
in vital signs, laboratory data, or the<br />
use of medications for cardiovascular disease and<br />
diabetes (Table 1).<br />
Intervention and Hemoglobin Values<br />
The overall median hemoglobin level at baseline<br />
was 10.4 g per deciliter (interquartile range, 9.8 to<br />
10.9). Between-group differences in hemoglobin<br />
values were apparent less than 1 month after randomization,<br />
and the differences were significant<br />
by 1 month (Fig. 1). From 3 months to the end of<br />
treatment, the median achieved hemoglobin level<br />
(based on the area under the curve) was 12.5 g<br />
per deciliter (interquartile range, 12.0 to 12.8) in<br />
the darbepoetin alfa group and 10.6 g per deciliter<br />
(interquartile range, 9.9 to 11.3) in the placebo<br />
group (P
Darbepoetin Alfa Therapy for reduction of Cardiovascular Events<br />
Table 1. Baseline Characteristics of the Patients.*<br />
Characteristic<br />
Darbepoetin Alfa<br />
(N = 2012)<br />
Placebo<br />
(N = 2026) P Value†<br />
Age (yr) 0.22<br />
Median 68 68<br />
Interquartile range 60–75 60–75<br />
Female sex (%) 58.5 56.0 0.10<br />
Race or ethnic group (%)‡ 0.84<br />
White 63.1 64.2<br />
Black 20.6 19.8<br />
Hispanic 13.6 13.1<br />
Other 2.7 3.0<br />
Known duration of diabetes (yr) 0.94<br />
Median 15.3 15.5<br />
Interquartile range 8.2–21.8 8.4–21.7<br />
Body-mass index§ 0.11<br />
Median 30.5 30.1<br />
Interquartile range 26.3–35.5 26.2–34.9<br />
Retinopathy (%) 48.2 45.7 0.12<br />
Laser treatment (%) 29.6 28.6 0.49<br />
Diabetic neuropathy (%) 49.2 46.4 0.07<br />
Amputation 5.7 6.1 0.58<br />
History of cardiovascular disease (%)¶ 64.0 66.9 0.05<br />
Coronary artery disease‖ 43.2 45.5 0.16<br />
Heart failure 31.5 35.2 0.01<br />
Myocardial infarction 18.4 18.3 0.95<br />
Stroke 11.5 10.7 0.41<br />
Peripheral arterial disease** 21.2 20.8 0.73<br />
Use of pacemaker 4.5 6.1 0.02<br />
Use of automatic implantable cardioverter–defibrillator 1.4 1.4 0.87<br />
Atrial fibrillation (%) 11.0 10.0 0.29<br />
Smoking status (%) 0.88<br />
Current smoker 5.4 4.7<br />
Former smoker 38.2 39.4<br />
Blood pressure (mm Hg)<br />
Systolic 0.25<br />
Median 136 135<br />
Interquartile range 122–149 123–148<br />
Diastolic 0.55<br />
Median 71 70<br />
Interquartile range 64–80 64–80<br />
Serum creatinine (mg/dl) 0.01<br />
Median 1.8 1.9<br />
Interquartile range 1.5–2.3 1.5–2.4<br />
Estimated GFR (ml/min/1.73 m 2 ) 0.03<br />
Median 34 33<br />
Interquartile range 27–43 26–42<br />
n engl j med 361;21 nejm.org november 19, 2009 2023<br />
Downloaded from www.nejm.org at <strong>Amgen</strong>, Inc. on November 20, 2009 .<br />
Copyright © 2009 Massachusetts Medical Society. All rights reserved.<br />
Page 128
2024<br />
Table 1. (Continued.)<br />
Characteristic<br />
The new england journal of medicine<br />
Darbepoetin Alfa<br />
(N = 2012)<br />
n engl j med 361;21 nejm.org november 19, 2009<br />
Placebo<br />
(N = 2026) P Value†<br />
Ratio of total protein (in mg/dl) to creatinine (in mg/dl) in urine¶ 0.73<br />
Median 0.4 0.4<br />
Interquartile range 0.1–2.0 0.1–1.8<br />
Table 1. (Continued.)<br />
Characteristic<br />
Medications (%)<br />
Darbepoetin Alfa Therapy for reduction of Cardiovascular Events<br />
poetin alfa. Among the patients who had not died<br />
or progressed to end-stage renal disease, 93.9%<br />
of the patients in the darbepoetin alfa group and<br />
90.4% of those in the placebo group were receiving<br />
the assigned treatment at 6 months; 87.4%<br />
and 83.7%, respectively, at 1 year; and 74.3% and<br />
69.3%, respectively, at 2 years. There was no significant<br />
difference in the proportions of patients<br />
receiving oral iron during the study (66.8% of<br />
those in the darbepoetin alfa group and 68.6% of<br />
those in the placebo group, P = 0.25); however,<br />
more patients in the placebo group received intravenous<br />
iron (20.4%, vs. 14.8% of patients assigned<br />
to darbepoetin alfa; P
2026<br />
Mean Hemoglobin (g/dl)<br />
No. of Patients<br />
Darbepoetin alfa<br />
Placebo<br />
13.5<br />
13.0<br />
12.5<br />
12.0<br />
11.5<br />
11.0<br />
10.5<br />
10.0<br />
9.5<br />
between-group differences in the time to the first<br />
occurrence of the following components, when<br />
considered individually: death from any cause,<br />
fatal or nonfatal congestive heart failure, fatal or<br />
nonfatal myocardial infarction, or hospitalization<br />
for myocardial ischemia (Table 2 and Fig. 2B, 2C,<br />
and 2D). However, fatal or nonfatal stroke was<br />
more likely to occur in the patients assigned to<br />
darbepoetin alfa (101 patients [5.0%] vs. 53 patients<br />
[2.6%]; hazard ratio, 1.92; 95% CI, 1.38 to<br />
2.68; P
Darbepoetin Alfa Therapy for reduction of Cardiovascular Events<br />
Table 2. Composite and Component End Points.*<br />
End Point<br />
Darbepoetin Alfa<br />
(N = 2012)<br />
1.95); among the 2570 white patients, the hazard<br />
ratio was 1.05 (95% CI, 0.92 to 1.21), and among<br />
the 815 black patients, the hazard ratio was 0.87<br />
(95% CI, 0.68 to 1.10; P = 0.03 for the interaction,<br />
uncorrected for multiple comparisons).<br />
Patient-Reported Outcomes<br />
The primary prespecified analysis for the patientreported<br />
outcomes was the change from baseline<br />
to 25 weeks in the FACT-Fatigue score. Among<br />
patients with both baseline and week-25 scores,<br />
from a baseline score of 30.2 in the group of 1762<br />
patients assigned to darbepoetin alfa and a baseline<br />
score of 30.4 in the 1769 patients assigned to<br />
placebo, there was a greater degree of improvement<br />
in the mean (±SD) score in the darbepoetin<br />
alfa group than in the placebo group (an increase<br />
of 4.2±10.5 points vs. 2.8±10.3 points, P
B Death from Any Cause<br />
50<br />
Hazard ratio, 1.05 (95% CI, 0.92–1.21)<br />
40 P=0.48<br />
A Cardiovascular Composite End Point<br />
50<br />
Hazard ratio, 1.05 (95% CI, 0.94–1.17)<br />
40 P=0.41<br />
Darbepoetin alfa<br />
30<br />
2028<br />
Darbepoetin alfa<br />
30<br />
Patients with Event (%)<br />
Placebo<br />
Placebo<br />
20<br />
20<br />
10<br />
10<br />
0<br />
0<br />
Patients with Event (%)<br />
0 6 12 18 24 30 36 42 48<br />
Months since Randomization<br />
0 6 12 18 24 30 36 42 48<br />
Months since Randomization<br />
164<br />
156<br />
386<br />
385<br />
655<br />
636<br />
945<br />
970<br />
1337<br />
1345<br />
1659<br />
1652<br />
1847<br />
1839<br />
1947<br />
1943<br />
2012<br />
2026<br />
No. at Risk<br />
Darbepoetin alfa<br />
Placebo<br />
130<br />
122<br />
318<br />
319<br />
551<br />
529<br />
817<br />
834<br />
1180<br />
1178<br />
1515<br />
1487<br />
1717<br />
1687<br />
1882<br />
1836<br />
2012<br />
2026<br />
No. at Risk<br />
Darbepoetin alfa<br />
Placebo<br />
C Fatal or Nonfatal Congestive Heart Failure<br />
50<br />
Hazard ratio, 0.89 (95% CI, 0.74–1.08)<br />
40 P=0.24<br />
The new england journal of medicine<br />
D Fatal or Nonfatal Myocardial Infarction and Myocardial Ischemia<br />
50 Fatal or Nonfatal<br />
Myocardial Infarction Myocardial Ischemia<br />
40<br />
Hazard ratio, 0.96 (95% CI, Hazard ratio, 0.84 (95% CI,<br />
0.75–1.22)<br />
0.55–1.27)<br />
30<br />
P=0.73<br />
P=0.40<br />
20<br />
Darbepoetin alfa<br />
Darbepoetin alfa<br />
Placebo<br />
Placebo<br />
Patients with Event (%)<br />
30<br />
20<br />
10<br />
Darbepoetin alfa<br />
Placebo<br />
10<br />
0<br />
0<br />
Patients with Event (%)<br />
0 6 12 18 24 30 36 42 48<br />
Months since Randomization<br />
0 6 12 18 24 30 36 42 48<br />
Months since Randomization<br />
136<br />
115<br />
319<br />
307<br />
555<br />
519<br />
819<br />
835<br />
1191<br />
1187<br />
1525<br />
1495<br />
1742<br />
1702<br />
1890<br />
1859<br />
2012<br />
2026<br />
No. at Risk<br />
Darbepoetin alfa<br />
Placebo<br />
137<br />
123<br />
325<br />
324<br />
577<br />
539<br />
851<br />
863<br />
1232<br />
1235<br />
1566<br />
1550<br />
146<br />
132<br />
347<br />
338<br />
597<br />
556<br />
869<br />
880<br />
1255<br />
1251<br />
1583<br />
1561<br />
No. at Risk<br />
Fatal or Nonfatal Myocardial Infarction<br />
Darbepoetin alfa 2012 1920 1785<br />
Placebo 2026 1907 1765<br />
Myocardial Ischemia<br />
Darbepoetin alfa 2012 1924 1794<br />
Placebo 2026 1906 1767<br />
E Fatal or Nonfatal Stroke<br />
50<br />
Hazard ratio, 1.92 (95% CI, 1.38–2.68)<br />
40 P
Darbepoetin Alfa Therapy for reduction of Cardiovascular Events<br />
Figure 2 (facing page). Kaplan–Meier Estimates of the<br />
Probability of the Primary and Secondary End Points.<br />
Panel A shows the primary cardiovascular composite<br />
end point. The secondary end points of deaths from<br />
any cause (Panel B), fatal or nonfatal congestive heart<br />
failure (Panel C), fatal or nonfatal myocardial infarction<br />
and myocardial ischemia (Panel D), and fatal or nonfatal<br />
stroke (Panel E) are also shown. P values are not<br />
adjusted for multiple comparison.<br />
Venous thromboembolic events were reported<br />
in 41 patients in the darbepoetin alfa group<br />
(2.0%), as compared with 23 patients in the placebo<br />
group (1.1%) (P = 0.02). Arterial thromboembolic<br />
events (some of which were adjudicated<br />
as cardiovascular events) were also reported more<br />
frequently in the darbepoetin alfa group (in 178<br />
patients [8.9%] vs. 144 patients [7.1%], P = 0.04).<br />
Cancer<br />
There was no significant between-group difference<br />
in the number of patients reporting a cancerrelated<br />
adverse event: 139 in the darbepoetin alfa<br />
group (6.9%) and 130 in the placebo group (6.4%)<br />
(P = 0.53). Overall, 39 deaths were attributed to<br />
cancer in the 2012 patients in the darbepoetin<br />
alfa group and 25 deaths were attributed to cancer<br />
in the 2026 patients in the placebo group (P = 0.08<br />
by the log-rank test). Among patients with a history<br />
of a malignant condition at baseline, there<br />
were 60 deaths from any cause in the 188 patients<br />
assigned to darbepoetin alfa and 37 deaths in the<br />
160 patients assigned to placebo (P = 0.13 by the<br />
log-rank test). In this subgroup, 14 of the 188 patients<br />
assigned to darbepoetin alfa died from cancer,<br />
as compared with 1 of the 160 patients assigned<br />
to placebo (P = 0.002 by the log-rank test).<br />
Discussion<br />
The main purpose of the TREAT was to determine<br />
whether treatment of a low hemoglobin level with<br />
darbepoetin alfa would reduce the risk of death<br />
and major cardiovascular and renal events among<br />
patients with type 2 diabetes mellitus, chronic<br />
kidney disease, and anemia. There was no significant<br />
difference in the overall rates of either the<br />
primary cardiovascular composite end point or<br />
the primary renal composite end point with the<br />
use of the therapeutic strategy of increasing the<br />
hemoglobin level with darbepoetin alfa (to attempt<br />
to reach a target hemoglobin level of 13.0 g<br />
per deciliter) versus placebo (with darbepoetin<br />
alfa as rescue therapy if hemoglobin values decreased<br />
below 9.0 g per deciliter). In this study<br />
involving 4038 patients randomly assigned to a<br />
study group, with 9941 patient-years of follow-up<br />
and with 1234 patients who had a composite outcome<br />
of a cardiovascular event and 1270 patients<br />
who had a composite outcome of a renal event,<br />
we found no overall significant differences in the<br />
hazard rates for these clinically important outcomes<br />
or in the rates of death, heart failure, myocardial<br />
infarction, admission for myocardial ischemia,<br />
or end-stage renal disease.<br />
Although there was no significant increase in<br />
the overall cardiovascular composite outcome in<br />
the group assigned to darbepoetin alfa, there was<br />
an increased incidence of stroke (annualized event<br />
rate, 2.1%, vs. 1.1% in the placebo group). Data<br />
from a study of patients undergoing dialysis suggested<br />
this risk of stroke 19 ; however, this risk<br />
was not identified in either the Correction of<br />
Hemoglobin and Outcomes in Renal Insufficiency<br />
(CHOIR) study (ClinicalTrials.gov number,<br />
NCT00211120) 17 or a meta-analysis. 24 This previously<br />
undocumented and clinically important<br />
finding of a heightened risk of stroke is not explained<br />
by an increase in systolic blood pressure.<br />
In a recent report of a randomized, placebo-controlled<br />
trial of intravenous erythropoietin in the<br />
early phase of an acute ischemic stroke, 25 there<br />
were more deaths in the group assigned to the<br />
ESA (42 of 256 patients [16.4%]) as compared<br />
with the group assigned to placebo (24 of 266<br />
patients [9.0%]). This study also provides support<br />
for an adverse relationship between ESAs and<br />
stroke. We also confirmed previous findings of<br />
increased rates of venous thromboembolic events<br />
among patients treated with ESAs.<br />
Our findings appear to differ from those of<br />
the CHOIR trial, the next largest trial involving<br />
patients with chronic kidney disease who were<br />
not undergoing dialysis, which used epoetin alfa<br />
and was discontinued prematurely after a median<br />
follow-up of 16 months and after 222 patients<br />
had a primary event. 17 Both groups in the CHOIR<br />
trial were randomly assigned to receive epoetin<br />
alfa, and in that study, there was a higher risk of<br />
cardiovascular events in the group assigned to a<br />
target hemoglobin level of 13.5 g per deciliter<br />
than in the group assigned to a target level of<br />
11.3 g per deciliter (hazard ratio, 1.34; 95% CI,<br />
1.03 to 1.74; P = 0.03). This excess of cardiovas-<br />
n engl j med 361;21 nejm.org november 19, 2009 2029<br />
Downloaded from www.nejm.org at <strong>Amgen</strong>, Inc. on November 20, 2009 .<br />
Copyright © 2009 Massachusetts Medical Society. All rights reserved.<br />
Page 134
2030<br />
A Renal Composite (ESRD or Death)<br />
Patients with Event (%)<br />
No. at Risk<br />
Darbepoetin alfa<br />
Placebo<br />
B ESRD<br />
Patients with Event (%)<br />
No. at Risk<br />
Darbepoetin alfa<br />
Placebo<br />
50<br />
40<br />
30<br />
20<br />
10<br />
cular events was largely accounted for by more<br />
deaths and heart-failure events; only 12 patients<br />
in each group had a stroke. These findings led<br />
to the suggestion that our trial should be discon-<br />
tinued. 26 However, by that time, there were more<br />
accumulated cardiovascular composite events in<br />
our trial than in the CHOIR trial, and the independent<br />
data and safety monitoring committee<br />
recommended continuation. 27 The TREAT executive<br />
committee updated the consent form to reflect<br />
the results from the CHOIR trial, and our<br />
patients again were asked to provide written informed<br />
consent. The final results of our study<br />
demonstrate the importance of completing the<br />
The new england journal of medicine<br />
Hazard ratio, 1.06 (95% CI, 0.95–1.19)<br />
P=0.29<br />
0<br />
0 6 12 18 24 30 36 42 48<br />
2012<br />
2026<br />
50<br />
40<br />
30<br />
20<br />
10<br />
1910<br />
1915<br />
1762<br />
1748<br />
Months since Randomization<br />
1544<br />
1519<br />
Hazard ratio, 1.02 (95% CI, 0.87–1.18)<br />
P=0.83<br />
1207<br />
1193<br />
820<br />
842<br />
n engl j med 361;21 nejm.org november 19, 2009<br />
552<br />
540<br />
Darbepoetin alfa<br />
309<br />
312<br />
Placebo<br />
0<br />
0 6 12 18 24 30 36 42 48<br />
2012<br />
2026<br />
1908<br />
1907<br />
1755<br />
1729<br />
Months since Randomization<br />
1527<br />
1491<br />
1187<br />
1162<br />
802<br />
811<br />
535<br />
513<br />
Darbepoetin alfa<br />
Placebo<br />
Figure 3. Kaplan–Meier Estimates of the Probability of Renal Outcomes.<br />
AUTHOR: Pfeffer<br />
RETAKE: 1st<br />
Panel A shows the primary renal composite end point (end-stage renal disease [ESRD] 2nd or death), and Panel B shows<br />
the end-point component of ESRD. FIGURE: P values 3 of 3have<br />
not been adjusted for multiple comparisons.<br />
3rd<br />
Revised<br />
ARTIST: MRL<br />
SIZE<br />
6 col<br />
TYPE: Line Combo 4-C H/T 33p9<br />
AUTHOR, PLEASE NOTE:<br />
Figure has been redrawn and type has been reset.<br />
Please check carefully.<br />
JOB: 361xx ISSUE:<br />
296<br />
292<br />
134<br />
123<br />
129<br />
115<br />
planned follow-up of trials and the potential to<br />
draw misleading conclusions when premature discontinuation<br />
results in an insufficient number<br />
of events to allow for a reliable estimation of the<br />
effect of treatment. 28,29<br />
Before we conducted our study, there was a<br />
suggestion that ESAs might increase mortality<br />
among patients with cancer, so patients with an<br />
active malignant condition were excluded from<br />
our trial. 30 During the trial, mounting concern led<br />
to new regulatory warnings about the use of ESAs<br />
in patients with “anemia of cancer,” 31 xx-xx-09<br />
prompting<br />
a protocol amendment to discontinue the study<br />
drug in patients in whom cancer developed. Al-<br />
Downloaded from www.nejm.org at <strong>Amgen</strong>, Inc. on November 20, 2009 .<br />
Copyright © 2009 Massachusetts Medical Society. All rights reserved.<br />
Page 135
Darbepoetin Alfa Therapy for reduction of Cardiovascular Events<br />
though the number of these patients did not differ<br />
significantly between the study groups, among<br />
the 348 patients with a history of cancer at baseline,<br />
mortality was higher among those assigned<br />
to darbepoetin alfa than among those assigned<br />
to placebo; these findings are consistent with<br />
those in a recent meta-analysis. 32<br />
Our trial provides long-term, placebo-controlled<br />
data on the use of ESAs in patients with diabetes,<br />
chronic kidney disease, and moderate anemia<br />
who are not undergoing dialysis. No single trial<br />
can address the multitude of pertinent issues<br />
without limitations, and our data may not be<br />
fully applicable to other patient populations. It is<br />
possible that other dosing strategies could be<br />
developed to mitigate the risk of stroke while<br />
conserving the modest benefits of treatment. In<br />
light of the baseline imbalances between the<br />
study groups, additional sensitivity analyses were<br />
conducted, and they did not alter our results.<br />
More extensive analyses of the patient-reported<br />
outcome measures are needed to assess the durability<br />
of the rather modest improvement we observed<br />
only in the FACT-Fatigue score.<br />
The long-standing presumption of a benefit of<br />
ESAs in this patient population led to non–placebo-controlled<br />
trials, which, by design, cannot<br />
provide a reliable assessment of risk and benefit.<br />
21 The present trial supplies these missing data,<br />
which may assist physicians and patients in making<br />
more informed decisions about individual<br />
care. It is our view that, in many patients with<br />
diabetes, chronic kidney disease, and moderate<br />
anemia who are not undergoing dialysis, the increased<br />
risk of stroke and possibly death among<br />
patients with a history of a malignant condition<br />
will outweigh any potential benefit of an ESA.<br />
Supported by <strong>Amgen</strong>, which provided independent statistical<br />
support through a contract with the board of regents for the<br />
University of Wisconsin System for data analysis for the TREAT<br />
Data and Safety Monitoring Committee as well as for the study.<br />
Dr. Pfeffer reports receiving consulting fees from Abbott,<br />
<strong>Amgen</strong>, AstraZeneca, Biogen, Boehringer Ingelheim, Boston<br />
Scientific, Bristol-Myers Squibb, Centocor, CVRx, Genentech,<br />
Cytokinetics, Daiichi Sankyo, Genzyme, Medtronic, Novartis,<br />
Roche, Sanofi-Aventis, Servier, and VIA Pharmaceutics and grant<br />
support from <strong>Amgen</strong>, Baxter, Celladon, Novartis, and Sanofi-<br />
Aventis, and being named coinventor on a patent for the use of<br />
inhibitors of the renin–angiotensin system in selected survivors<br />
of myocardial infarction; Dr. Burdmann, receiving consulting<br />
fees from <strong>Amgen</strong> and Sigma Pharma and grant support from<br />
<strong>Amgen</strong> and Roche; Drs. Chen and Kewalramani, being employees<br />
of and owning stock in <strong>Amgen</strong>; Dr. Cooper, receiving consulting<br />
fees from <strong>Amgen</strong>; Dr. de Zeeuw, receiving consulting<br />
fees from <strong>Amgen</strong> and Novartis and lecture fees from <strong>Amgen</strong>; Dr.<br />
Eckardt, receiving consulting fees from <strong>Amgen</strong>, Ortho Biotech,<br />
Roche, Affymax, Stada, and Sandoz–Hexal and lecture fees from<br />
<strong>Amgen</strong>, Ortho Biotech, and Roche; Dr. Ivanovich, receiving consulting<br />
fees from <strong>Amgen</strong>, Baxter, Biogen, and Reata; Dr. Levey,<br />
receiving grant support from <strong>Amgen</strong>; Dr. Lewis, receiving consulting<br />
fees from <strong>Amgen</strong> and grant support from <strong>Amgen</strong> and<br />
the Robert Wood Johnson Foundation; Dr. McGill, receiving consulting<br />
fees from <strong>Amgen</strong> and Boehringer Ingelheim, lecture fees<br />
from Novartis, and grant support from Novartis and Boehringer<br />
Ingel heim; Dr. McMurray, receiving consulting fees from Menarini,<br />
Bristol-Myers Squibb, Roche, Novocardia, Boehringer<br />
Ingelheim, Novartis, BioMérieux, and Boston Scientific, lecture<br />
fees from AstraZeneca, Solvay, Takeda, Novartis, BMS Sanofi,<br />
and Vox Media, and grant support from BMS, Novartis, <strong>Amgen</strong>,<br />
AstraZeneca, Cytokinetics, Hoffmann–La Roche, Pfizer, Scios,<br />
and GlaxoSmithKline; Dr. Parfrey, receiving consulting and<br />
lecture fees from <strong>Amgen</strong> and lecture fees from Ortho Biotech;<br />
Dr. Parving, receiving consulting fees from <strong>Amgen</strong> and Novartis<br />
and lecture fees from Novartis; Dr. Singh, receiving consulting<br />
fees from Johnson & Johnson and Watson, lecture fees from Johnson<br />
& Johnson, <strong>Amgen</strong>, and Watson, and grant support from<br />
Johnson & Johnson, <strong>Amgen</strong>, Roche, AMAG Pharmaceuticals, and<br />
Watson; Dr. Solomon, receiving grant support from <strong>Amgen</strong>;<br />
and Dr. Toto, receiving consulting and lecture fees from <strong>Amgen</strong><br />
and grant support from Novartis, Reata, and Abbott. No other<br />
potential conflict of interest relevant to this article was reported.<br />
Appendix<br />
From the Department of Medicine, Brig ham and Women’s Hospital, Harvard Medical School (M.A.P., E.F.L., A.K.S., S.D.S.); and the<br />
Division of Nephrology, Tufts Medical Center (A.S.L.) — both in Boston; Hospital de Base, Faculdade de Medicina de São José do Rio<br />
Preto, São José do Rio Preto, Brazil (E.A.B.); Global Biostatistics and Epidemiology and Global Clinical Development, <strong>Amgen</strong>, Thousand<br />
Oaks, CA (C.-Y.C., R.K.); Baker Heart Research Institute, Melbourne, VIC, Australia (M.E.C.); the Division of Clinical Pharmacology,<br />
University Medical Center, Groningen, the Netherlands (D.Z.); the Department of Nephrology and Hypertension, University of Erlangen-Nuremberg,<br />
Erlangen, Germany (K.-U.E.); the Department of Biostatistics and Medical Informatics, University of Wisconsin,<br />
Madison (J.M.F.); the Department of Medicine, Northwestern University Feinberg School of Medicine, Chicago (P.I.); the Department<br />
of Medicine, Washington University School of Medicine, St. Louis (J.B.M.); the Department of Cardiology, British Heart Foundation<br />
Glasgow Cardiovascular Research Centre, Glasgow, United Kingdom (J.J.V.M.); the Division of Nephrology, Health Sciences Centre, St.<br />
John’s, NF, Canada (P.P.); the Department of Medical Endocrinology, Rigshospitalet, University of Copenhagen, Copenhagen, and Faculty<br />
of Health Science, Aarhus University, Aarhus (H.-H.P.) — both in Denmark; Mario Negri Institute for Pharmacological Research,<br />
Bergamo, Italy (G.R.); and the Department of Medicine, University of Texas Southwestern Medical Center, Dallas (R.T.).<br />
The TREAT committees and teams are as follows: protocol development committee — R. Brenner and M. Pfeffer (cochairs), N.<br />
Abrouk, W. Carroll, D. Green, P. Klassen, J. Lubina, J. McMurray, L. Messer, R. Newmark, P. Parfrey, S. Solomon; executive committee<br />
— M. Pfeffer (chair), E. Burdmann, M. Cooper, D. de Zeeuw, K.-U. Eckardt, P. Ivanovich, A. Levey, J. McGill, J. McMurray, P. Parfrey,<br />
H.-H. Parving, B. Pereira, G. Remuzzi, A. Singh, S. Solomon, R. Toto; hemoglobin monitoring committee — P. Ivanovich (chair), S.<br />
Fishbane, A. Nissenson; statistical data analysis center — R. Bechhofer, D. DeMets, J. Feyzi; data and safety monitoring committee — C.<br />
Hennekens (chair), G. Chertow, E. Frohlich, P. O’Brien, J. Rouleau; clinical end-point center — S. Solomon (chair), E. Lewis (cochair),<br />
A. Desai, C. Duong, P. Finn, L.H. Hartley, S. Kesari, J. Lin, J. Meadows, L. Mielniczuk, F. Shamshad, A. Singh, O. Vasylyeva, L. Weinrauch;<br />
study team — A. Adee, A. Ahmed, P. Blaisdell, P. Brady, L. Bucker, J. Cap, W. Carroll, D. Chaparro, C.-Y. Chen, B. Condon, R.<br />
n engl j med 361;21 nejm.org november 19, 2009 2031<br />
Downloaded from www.nejm.org at <strong>Amgen</strong>, Inc. on November 20, 2009 .<br />
Copyright © 2009 Massachusetts Medical Society. All rights reserved.<br />
Page 136
2032<br />
Darbepoetin Alfa Therapy for reduction of Cardiovascular Events<br />
Cravario, R. Damato, K. Dellacroce, K. DiRocco, D. Donovan, B. Doria, M. Dougherty, J. Droge, A. Grewal, L. Guimaraes, P. Haynes,<br />
J. Hevy, T. Jambusaria, N. James, A. Kacprzak, M. Kasenda, S.R.K. Reddy, R. Kewalramani, H. Kirby, C. Klacker, T. Kocsis, A. Kondo,<br />
M. Lauw, M. Liebelt, P. McElligott, B. Mesquita, C. Mix, A. Mueller, S. O’Callaghan, H. Ocampo, K. Olson, S. Perez, J. Pillai, A. Pollock,<br />
F. Poloni, K. Polu, R. Poston, G. Ramirez, A. Rasmussen, L. Reeves, M. Rocha, A.P. Ross, J. Rossert, B. Sahl, T. See, S. Shahinfar, K.<br />
Shart, C. Stehman-Breen, A. Teh, L. Tierra, M. Vaghela, C. White. Enrollment by country was as follows (numbers of patients are in<br />
parentheses): Argentina (84), Australia (58), Austria (3), Brazil (190), Bulgaria (28), Canada (176), Chile (14), Czech Republic (96),<br />
Denmark (10), Estonia (16), France (11), Germany (135), Hungary (70), Italy (87), Latvia (51), Mexico (150), Poland (213), Portugal<br />
(17), Romania (47), Russia (117), Slovakia (65), Slovenia (12), United Kingdom (49), United States (2339).<br />
References<br />
1. Stamler J, Vaccaro O, Neaton JD, mortality in end-stage renal disease. Am J 21. Pfeffer MA. Critical missing data in<br />
Wentworth D. Diabetes, other risk fac- Kidney Dis 1996;28:53-61.<br />
erythropoiesis-stimulating agents in CKD:<br />
tors, and 12-yr cardiovascular mortality 11. Keane WF, Brenner BM, de Zeeuw D, first beat placebo. Am J Kidney Dis 2008;<br />
for men screened in the Multiple Risk Fac- et al. The risk of developing end-stage re- 51:366-9.<br />
tor Intervention Trial. Diabetes Care 1993; nal disease in patients with type 2 diabe- 22. Pfeffer MA, Burdmann EA, Chen CY,<br />
16:434-44.<br />
tes and nephropathy: the RENAAL study. et al. Baseline characteristics in the Trial<br />
2. Booth GL, Kapral MK, Fung K, Tu JV. Kidney Int 2003;63:1499-507.<br />
to Reduce Cardiovascular Events With<br />
Relation between age and cardiovascular 12. Vlagopoulos PT, Tighiouart H, Weiner Aranesp Therapy (TREAT). Am J Kidney<br />
disease in men and women with diabetes DE, et al. <strong>Anemia</strong> as a risk factor for car- Dis 2009;54:59-69.<br />
compared with non-diabetic people: a popdiovascular disease and all-cause mortal- 23. Mozzicato P. Standardised MedDRA<br />
ulation-based retrospective cohort study. ity in diabetes: the impact of chronic kid- queries: their role in signal detection.<br />
Lancet 2006;368:29-36.<br />
ney disease. J Am Soc Nephrol 2005;16: Drug Saf 2007;30:617-9.<br />
3. Turnbull F, Neal B, Algert C, et al. Ef- 3403-10.<br />
24. Strippoli GF, Navaneethan SD, Craig<br />
fects of different blood pressure-lowering 13. Tong PCY, Kong APS, So W-Y, et al. JC. Haemoglobin and haematocrit targets<br />
regimens on major cardiovascular events Hematocrit, independent of chronic kid- for the anaemia of chronic kidney dis-<br />
in individuals with and without diabetes ney disease, predicts adverse cardiovascuease. Cochrane Database Syst Rev 2006;4:<br />
mellitus: results of prospectively designed lar outcomes in Chinese patients with CD003967.<br />
overviews of randomized trials. Arch In- type 2 diabetes. Diabetes Care 2006;29: 25. Ehrenreich H, Weissenborn K, Prange<br />
tern Med 2005;165:1410-9.<br />
2439-44.<br />
H, et al. Recombinant human erythro-<br />
4. Baigent C, Keech A, Kearney PM, et al. 14. Pfeffer MA, Solomon SD, Singh AK, poietin in the treatment of acute ischemic<br />
Efficacy and safety of cholesterol-lower- Ivanovich P, McMurray JJ. Uncertainty in stroke. Stroke 2009 October 15 (Epub<br />
ing treatment: prospective meta-analysis the treatment of anemia in chronic kidney ahead of print).<br />
of data from 90,056 participants in 14 ran- disease. Rev Cardiovasc Med 2005;Suppl 3: 26. Strippoli GFM, Tognoni G, Navaneedomised<br />
trials of statins. Lancet 2005;366: S35-S41.<br />
than SD, Nicolucci A, Craig JC. Hemoglo-<br />
1267-78. [Errata, Lancet 2005;366:1358, 15. Eschbach JW, Abdulhadi MH, Browne bin targets: we were wrong, time to move<br />
2008;371:2084.]<br />
JK, et al. Recombinant human erythro- on. Lancet 2007;369:349-50.<br />
5. Gaede P, Lund-Andersen H, Parving poietin in anemic patients with end-stage 27. Pfeffer MA. An ongoing study of ane-<br />
H-H, Pedersen O. Effect of a multifacto- renal disease: results of a phase III multi- mia correction in chronic kidney disease.<br />
rial intervention on mortality in type 2 center clinical trial. Ann Intern Med N Engl J Med 2007;356:959-61.<br />
diabetes. N Engl J Med 2008;358:580-91. 1989;111:992-1000.<br />
28. DeMets DL, Pocock SJ, Julian DG. The<br />
6. Brenner BM, Cooper ME, de Zeeuw D, 16. Canadian Erythropoietin Study Group. agonising negative trend in monitoring of<br />
et al. Effects of losartan on renal and car- Association between recombinant human clinical trials. Lancet 1999;354:1983-8.<br />
diovascular outcomes in patients with erythropoietin and quality of life and exer- 29. Califf RM, DeMets DL. Principles from<br />
type 2 diabetes and nephropathy. N Engl J cise capacity of patients receiving haemo- clinical trials relevant to clinical practice:<br />
Med 2001;345:861-9.<br />
dialysis. BMJ 1990;300:573-8.<br />
Part I. Circulation 2002;106:1015-21.<br />
7. Lewis EJ, Hunsicker LG, Clarke WR, 17. Singh AK, Szczech L, Tang KL, et al. 30. Leyland-Jones B, Semiglazov V, Pawlet<br />
al. Renoprotective effect of the angio- Correction of anemia with epoetin alfa in icki M, et al. Maintaining normal hemotensin-receptor<br />
antagonist irbesartan in chronic kidney disease. N Engl J Med globin levels with epoetin alfa in mainly<br />
patients with nephropathy due to type 2 2006;355:2085-98.<br />
nonanemic patients with metastatic breast<br />
diabetes. N Engl J Med 2001;345:851-60. 18. Drueke TB, Locatelli F, Clyne N, et al. cancer receiving first-line chemotherapy:<br />
8. Tonelli M, Isles C, Craven T, et al. Ef- Normalization of hemoglobin level in pa- a sur vival study. J Clin Oncol 2005;23:5960fect<br />
of pravastatin on rate of kidney functients with chronic kidney disease and 72.<br />
tion loss in people with or at risk for coro- anemia. N Engl J Med 2006;355:2071-84. 31. FDA black box warning for Aranesp.<br />
nary disease. Circulation 2005;112:171-8. 19. Parfrey PS, Foley RN, Wittreich BH, Silver Spring, MD: Food and Drug Admin-<br />
9. Locatelli F, Pisoni RL, Combe C, et al. Sullivan DJ, Zagari MJ, Frei D. Doubleistration. (Accessed October 23, 2009, at<br />
Anaemia in haemodialysis patients of five blind comparison of full and partial ane- http://www.accessdata.fda.gov/drugsatfda<br />
European countries: association with mormia correction in incident hemodialysis _docs/label/2008/103951s5195PI.pdf.)<br />
bidity and mortality in the Dialysis Out- patients without symptomatic heart dis- 32. Bohlius J, Schmidlin K, Brillant C, et<br />
comes and Practice Patterns Study (DOPPS). ease. J Am Soc Nephrol 2005;16:2180-9. al. Recombinant human erythropoiesis-<br />
Nephrol Dial Transplant 2004;19:121-32. 20. Phrommintikul A, Haas SJ, Elsik M, stimulating agents and mortality in pa-<br />
[Erratum, Nephrol Dial Transplant 2004; Krum H. Mortality and target haemoglotients with cancer: a meta-analysis of ran-<br />
19:1666.]<br />
bin concentrations in anemic patients with domised trials. Lancet 2009;373:1532-42.<br />
10. Foley RN, Parfrey PS, Harnett JD, Kent chronic kidney disease treated with eryth- [Erratum, Lancet 2009;374:28.]<br />
GM, Murray DC, Barre PE. The impact of ropoietin: a meta-analysis. Lancet 2007; Copyright © 2009 Massachusetts Medical Society.<br />
anemia on cardiomyopathy, morbidity, and 369:381-8.<br />
n engl j med 361;21 nejm.org november 19, 2009<br />
Downloaded from www.nejm.org at <strong>Amgen</strong>, Inc. on November 20, 2009 .<br />
Copyright © 2009 Massachusetts Medical Society. All rights reserved.<br />
Page 137
The new england journal of medicine<br />
original article<br />
Correction of <strong>Anemia</strong> with Epoetin Alfa<br />
in Chronic Kidney Disease<br />
Ajay K. Singh, M.B., B.S., Lynda Szczech, M.D., Kezhen L. Tang, Ph.D.,<br />
Huiman Barnhart, Ph.D., Shelly Sapp, M.S., Marsha Wolfson, M.D.,<br />
and Donal Reddan, M.B., B.S., for the CHOIR Investigators*<br />
ABSTRACT<br />
Background<br />
<strong>Anemia</strong>, a common complication of chronic kidney disease, usually develops as a consequence<br />
of erythropoietin deficiency. Recombinant human erythropoietin (epoetin<br />
alfa) is indicated for the correction of anemia associated with this condition. However,<br />
the optimal level of hemoglobin correction is not defined.<br />
Methods<br />
In this open-label trial, we studied 1432 patients with chronic kidney disease, 715 of<br />
whom were randomly assigned to receive a dose of epoetin alfa targeted to achieve<br />
a hemoglobin level of 13.5 g per deciliter and 717 of whom were assigned to receive<br />
a dose targeted to achieve a level of 11.3 g per deciliter. The median study duration<br />
was 16 months. The primary end point was a composite of death, myocardial infarction,<br />
hospitalization for congestive heart failure (without renal replacement therapy),<br />
and stroke.<br />
Results<br />
A total of 222 composite events occurred: 125 events in the high-hemoglobin group,<br />
as compared with 97 events in the low-hemoglobin group (hazard ratio, 1.34; 95%<br />
confidence interval, 1.03 to 1.74; P = 0.03). There were 65 deaths (29.3%), 101 hospitalizations<br />
for congestive heart failure (45.5%), 25 myocardial infarctions (11.3%),<br />
and 23 strokes (10.4%). Seven patients (3.2%) were hospitalized for congestive heart<br />
failure and myocardial infarction combined, and one patient (0.5%) died after having a<br />
stroke. Improvements in the quality of life were similar in the two groups. More patients<br />
in the high-hemoglobin group had at least one serious adverse event.<br />
Conclusions<br />
The use of a target hemoglobin level of 13.5 g per deciliter (as compared with 11.3 g<br />
per deciliter) was associated with increased risk and no incremental improvement in<br />
the quality of life. (ClinicalTrials.gov number, NCT00211120.)<br />
Page 138<br />
From the Renal Division, Brigham and<br />
Women’s Hospital and Harvard Medical<br />
School, Boston (A.K.S.); the Renal Division,<br />
Duke University Medical Center (L.S., D.R.),<br />
Duke Clinical Research Institute (L.S., S.S.),<br />
and the Department of Biostatistics and<br />
Bioinformatics, Duke University (H.B.) —<br />
all in Durham, NC; Ortho Biotech Clinical<br />
Affairs, Bridgewater, NJ (K.L.T., M.W.);<br />
and the Department of Medicine, University<br />
College Galway, Galway, Ireland (D.R.).<br />
Address reprint requests to Dr. Singh at<br />
the Renal Division, Brigham and Women’s<br />
Hospital, 75 Francis St., Boston, MA 02115,<br />
or at asingh@partners.org.<br />
*Investigators in the Correction of Hemogloblin<br />
and Outcomes in Renal Insufficiency<br />
(CHOIR) trial are listed in the Appendix.<br />
N Engl J Med 2006;355:2085-98.<br />
Copyright © 2006 Massachusetts Medical Society.<br />
n engl j med 355;20 www.nejm.org november 16, 2006 2085
2086<br />
A<br />
nemia is common among patients<br />
with chronic kidney disease. 1 In such patients,<br />
treatment with erythropoietin has<br />
been shown to enhance the quality of life. 2-5 However,<br />
evidence suggesting that the correction of<br />
anemia improves cardiovascular outcomes has<br />
largely been derived from observational studies and<br />
small interventional trials associating a high level<br />
of hemoglobin (>12.0 g per deciliter) with a lower<br />
rate of complications and death from cardiovascular<br />
causes. 6-8 Other evidence has also indicated that<br />
cardiovascular complications, such as left ventricular<br />
hypertrophy, might be improved through the<br />
use of a high hemoglobin level as a target. 4 However,<br />
in a randomized, controlled study comparing<br />
a hematocrit target of 42% with that of 30%<br />
among patients with heart disease who were undergoing<br />
hemodialysis, the former group had<br />
higher rates of nonfatal myocardial infarction and<br />
death, but not significantly so. 5<br />
In 2000, a panel of the Kidney Disease Outcomes<br />
Quality Initiative of the National Kidney<br />
Foundation recommended that the target level of<br />
hemoglobin should be 11.0 to 12.0 g per deciliter<br />
in patients with chronic kidney disease, whether<br />
or not they were receiving dialysis. 9 A recent update<br />
of guidelines regarding anemia in such patients<br />
expanded the target range to 11.0 to 13.0 g<br />
per deciliter, 10 with the increase in the upper limit<br />
of the target range justified on the basis of a potential<br />
improvement in the patients’ quality of life.<br />
In the Correction of Hemogloblin and Outcomes<br />
in Renal Insufficiency (CHOIR) trial, we hypothesized<br />
that in patients with chronic kidney disease,<br />
the use of recombinant human erythropoietin<br />
(epoetin alfa) to achieve a high hemoglobin<br />
level (13.5 g per deciliter) would decrease the<br />
risk of complications from cardiovascular causes<br />
and death, as compared with a lower hemoglobin<br />
level (11.3 g per deciliter).<br />
Methods<br />
Study Subjects<br />
We conducted an open-label, randomized trial to<br />
study the risks and benefits of the correction of<br />
anemia in patients with chronic kidney disease<br />
who were not receiving dialysis. We enrolled 1432<br />
patients at 130 sites in the United States. At enrollment,<br />
patients had to be at least 18 years of age,<br />
have a hemoglobin level of less than 11.0 g per<br />
deciliter, and have chronic kidney disease, defined<br />
The new england journal of medicine<br />
n engl j med 355;20 www.nejm.org november 16, 2006<br />
Page 139<br />
by an estimated glomerular filtration rate (GFR)<br />
of 15 to 50 ml per minute per 1.73 m 2 of body-surface<br />
area, with the use of the Modification of Diet<br />
in Renal Disease (MDRD) formula. 11 Key exclusion<br />
criteria included the presence of uncontrolled<br />
hypertension, active gastrointestinal bleeding, an<br />
iron-overload state, a history of frequent transfusions<br />
in the previous 6 months, refractory irondeficiency<br />
anemia, active cancer, previous therapy<br />
with epoetin alfa, or angina pectoris that was<br />
unstable or present at rest.<br />
Intervention<br />
Patients were assigned by computer-generated permuted-block<br />
randomization to one of two groups:<br />
a high-hemoglobin group (with an initial hemoglobin<br />
target of 13.0 to 13.5 g per deciliter) or a<br />
low-hemoglobin group (with an initial target of<br />
10.5 to 11.0 g per deciliter). A protocol amendment<br />
on February 25, 2003, changed the original hemoglobin<br />
targets to 13.5 g per deciliter and 11.3 g per<br />
deciliter, respectively. At the time of the protocol<br />
amendment, 347 of the 1432 patients (24.2%) had<br />
been enrolled, and only 132 of the total of 1939<br />
patient-years had accrued. Both groups of patients<br />
initially received epoetin alfa subcutaneously weekly;<br />
administration was subsequently permitted every<br />
other week if the hemoglobin level was stable.<br />
(For details about the epoetin alfa regimen, see the<br />
Supplementary Appendix, available with the full<br />
text of this article at www.nejm.org.) The institutional<br />
review board at each center approved the<br />
protocol, and all the patients gave written informed<br />
consent.<br />
Laboratory Tests and Clinical Outcomes<br />
A central laboratory (Covance) performed all biochemical<br />
and hematologic analyses. We assessed<br />
the patients’ quality of life using the Linear Analogue<br />
Self-Assessment (LASA) (scores range from<br />
0 to 100, with higher scores indicating better function),<br />
12 the Kidney Disease Questionnaire (KDQ)<br />
(total scores range from 4 to 35, with higher scores<br />
indicating better health), 13 and the Medical Outcomes<br />
Study 36-item Short-Form Health Survey<br />
(SF-36) (scores for each subscale range from 0 to<br />
100, with higher scores indicating better health). 14<br />
Investigator-reported events were independently<br />
adjudicated by the clinical committee reviewing<br />
end points at the Duke Clinical Research Institute<br />
(DCRI), whose members were unaware of patients’<br />
study-group assignments. The primary end point
Correction of <strong>Anemia</strong> and Chronic Kidney Disease<br />
was the time to the composite of death, myocardial<br />
infarction, hospitalization for congestive heart<br />
failure (excluding renal replacement therapy), or<br />
stroke. Myocardial infarction was defined on the<br />
basis of any two of the following: chest pain that<br />
lasted for 15 minutes, abnormal cardiac enzyme<br />
levels, or new findings on electrocardiography suggestive<br />
of myocardial infarction. Hospitalization<br />
for congestive heart failure was defined as an unplanned<br />
presentation requiring admission, during<br />
which the patient received intravenous therapy with<br />
inotropes, diuretics, or vasodilators. If hospitalization<br />
involved renal replacement therapy, the event<br />
was not included in the primary composite end<br />
point. Stroke was defined as a new neurologic deficit<br />
of sudden onset that was not reversible within<br />
24 hours and that was not due to a readily identifiable<br />
nonvascular cause (e.g., a brain tumor or<br />
trauma). Other secondary outcomes included the<br />
time to renal replacement therapy, hospitalization<br />
for either a cardiovascular cause or any cause, and<br />
quality of life.<br />
Statistical Analysis<br />
We calculated that 1352 patients would need to<br />
be enrolled for the study to have a statistical power<br />
of 80% to detect a 25% reduction in the composite<br />
event rate in the high-hemoglobin group over<br />
a period of 3 years, assuming a 30% event rate in<br />
the low-hemoglobin group, the occurrence of at<br />
least 295 composite events overall during the 3-year<br />
period, a 30% rate of early withdrawal for reasons<br />
other than the occurrence of the primary end point,<br />
and a type I error of 0.05. Four interim analyses<br />
were planned in which efficacy guidelines used the<br />
O’Brien–Fleming alpha-spending boundary, guidelines<br />
for futility in which the likelihood that the<br />
study would be mistakenly stopped because of a<br />
nonsignificant difference between groups was 2%<br />
or less, and a conditional power calculation. 15-17<br />
An independent data and safety monitoring board<br />
reviewed the study.<br />
We used the Kaplan–Meier method to analyze<br />
the time to the first event for events that occurred<br />
during the study period. We used the log-rank test<br />
to compare the times to the first event between<br />
the two groups. Data on patients who did not have<br />
an event were censored at the time of study termination<br />
(either completion or early withdrawal).<br />
Repeated-measures analysis of variance was used<br />
to evaluate hemoglobin levels over time. Hemoglobin<br />
levels obtained within 28 days after a transfu-<br />
sion were excluded. All patients who received at<br />
least one dose of study medication were included<br />
in the safety analysis. Serious adverse events were<br />
defined as life-threatening, resulting in death,<br />
hospitalization, or substantial disability, or leading<br />
to a congenital anomaly or birth defect. The principal<br />
investigators (Drs. Singh and Reddan) developed<br />
the protocol and all amendments in collaboration<br />
with the DCRI and the industry sponsor.<br />
The DCRI acquired and queried all data. The<br />
database was developed and locked at DCRI, and<br />
a copy was provided to the sponsor. The investigators<br />
had full access to the data. DCRI performed<br />
all the primary analyses, and the sponsor performed<br />
all secondary analyses, the results of<br />
which were verified by the DCRI. All analyses<br />
were performed with the use of SAS software,<br />
version 8.2 or higher.<br />
Results<br />
early termination of the study<br />
The data and safety monitoring board recommended<br />
that the study be terminated in May 2005 at the<br />
time of the second interim analysis, even though<br />
715 Assigned to high-hemoglobin<br />
group (target level, 13.5 g/dl)<br />
312 Completed 36 mo or withdrew<br />
at study termination<br />
without having primary event<br />
125 Had a primary event<br />
278 Withdrew before early<br />
termination of study<br />
131 Required RRT<br />
147 Withdrew for other<br />
reasons<br />
1432 Patients enrolled<br />
Page 140<br />
717 Assigned to low-hemoglobin<br />
group (target level, 11.3 g/dl)<br />
349 Completed 36 mo or withdrew<br />
at study termination<br />
without having primary event<br />
97 Had a primary event<br />
271 Withdrew before early<br />
termination of study<br />
111 Required RRT<br />
160 Withdrew for other<br />
reasons<br />
Figure 1. Enrollment and Outcomes.<br />
A total of 1432 patients were enrolled; 715 were assigned to the high-hemoglobin<br />
group (with a target level of 13.5 g per deciliter), and 717 were assigned<br />
to the low-hemoglobin group (with a target level of 11.3 g per deciliter).<br />
In addition to the stated reasons for withdrawal from the study, other<br />
reasons included a request from a patient, an investigator, or the study<br />
sponsor; pregnancy; an adverse event; a protocol violation; or a loss to follow-up.<br />
RRT denotes renal replacement therapy.<br />
n engl j med 355;20 www.nejm.org november 16, 2006 2087
2088<br />
Table 1. Baseline Characteristics of the Patients.*<br />
neither the efficacy nor the futility boundaries had<br />
been crossed, because the conditional power for<br />
demonstrating a benefit for the high-hemoglobin<br />
group by the scheduled end of the study was less<br />
than 5% for all plausible values of the true effect<br />
for the remaining data. Other factors that the board<br />
considered included an examination of differences<br />
between the treatment groups in adverse events,<br />
biochemical data, and quality-of-life data.<br />
On the basis of the intention-to-treat principle,<br />
data from all 1432 patients were included in the<br />
final analysis (Fig. 1), and the nominal P value at<br />
final analysis is reported. Both the mean and the<br />
The new england journal of medicine<br />
High-Hemoglobin Low-Hemoglobin<br />
Characteristic<br />
Group (N = 715) Group (N = 717)<br />
Age (yr) 66.0±14.3 66.3±13.5<br />
Female sex (%)<br />
Race (%)<br />
56.2 54.1<br />
White 62.3 61.1<br />
Black 28.6 29.3<br />
American Indian or Alaskan Native 0.1 0.4<br />
Asian or Pacific Islander 3.4 3.2<br />
Other 5.6 6.0<br />
Hispanic ethnic background (%) 12.5 13.5<br />
History of smoking tobacco (%)<br />
Cause of chronic kidney disease (%)<br />
47.5 44.6<br />
Diabetes 46.8 50.8<br />
Hypertension 29.9 27.5<br />
Other<br />
Cardiovascular history (%)<br />
23.3 21.6<br />
Hypertension 95.8 93.2†<br />
Myocardial infarction 16.4 15.0<br />
CABG 17.4 13.5‡<br />
PCI 10.9 11.9<br />
Congestive heart failure 24.4 22.9<br />
Atrial fibrillation 9.4 8.6<br />
Stroke 9.8 10.0<br />
Peripheral vascular disease 16.4 16.4<br />
Myocardial infarction, stroke, CABG, PCI, or amputation of a lower limb 36.3 34.5<br />
Body-mass index<br />
Blood pressure (mm Hg)<br />
30.4±7.7 30.4±7.5<br />
Systolic 136.7±19.7 135.6±20.0<br />
Diastolic 71.6±11.6 70.9±11.2<br />
Mean arterial 93.3±12.1 92.5±12.0<br />
n engl j med 355;20 www.nejm.org november 16, 2006<br />
Page 141<br />
median duration of follow-up of all patients were<br />
16 months; 661 patients (46.2%) completed 36<br />
months of study or withdrew at study termination<br />
without having had a composite event. A total of<br />
549 patients (38.3%) withdrew before termination<br />
of the study without having had a composite event.<br />
Among these patients, 242 (16.9%) withdrew because<br />
they began renal replacement therapy, and<br />
307 patients (21.4% [147 from the high-hemoglobin<br />
group and 160 from the low-hemoglobin<br />
group]) withdrew for other reasons. However, the<br />
low-hemoglobin group had more patient-years of<br />
follow-up (980, as compared with 959 in the high-
Table 1. (Continued.)<br />
Correction of <strong>Anemia</strong> and Chronic Kidney Disease<br />
hemoglobin group). The reasons for early withdrawal<br />
were similar in the two groups (data not<br />
shown).<br />
characteristics of the patients<br />
The demographic and baseline characteristics of<br />
the two groups were similar (Table 1), except for<br />
a higher rate of a self-reported history of hypertension<br />
(P = 0.03) and coronary-artery bypass grafting<br />
in the high-hemoglobin group (P = 0.05). During<br />
the course of the study, the overall use of iron<br />
in both the high-hemoglobin group and the lowhemoglobin<br />
group was similar (52.0% and 48.3%,<br />
respectively; P = 0.18). The mean (±SD) systolic<br />
blood pressure decreased modestly from baseline<br />
to the end of study, with a decrease of 2.3±22.8<br />
mm Hg in the high-hemoglobin group and a de-<br />
High-Hemoglobin<br />
Group (N = 715)<br />
Low-Hemoglobin<br />
Group (N = 717)<br />
Hemoglobin (g/dl) 10.1±0.9 10.1±0.9<br />
Hematocrit (%) 31.4±2.9 31.4±2.9<br />
Transferrin saturation (%) 25.2±11.8 24.6 ±10.1<br />
Ferritin (ng/ml) 167.8±157.2 179.2±171.5<br />
Creatinine clearance (ml/min/1.73 m2 )§ 36.7±17.0 37.1±17.9<br />
GFR (ml/min)¶ 27.0±8.7 27.3±9.1<br />
Albumin (g/dl) 3.7±0.5 3.8±0.5<br />
Ratio of total protein to creatinine in urine<br />
Medications (%)<br />
1.6±2.3 1.5±2.3<br />
ACE inhibitor only 35.7 37.8<br />
ARB only 29.7 26.8<br />
Combination of ACE inhibitor and ARB 8.3 9.6<br />
Beta-blocker (including labetalol) 46.9 47.7<br />
Platelet aggregation inhibitor (excluding heparin) 42.8 45.0<br />
HMG CoA reductase inhibitor<br />
Iron<br />
52.8 52.3<br />
Intravenous 2.6 1.6<br />
Oral 26.5 26.7<br />
Unknown route 3.1 1.6<br />
* Plus–minus values are means ±SD. The body-mass index is the weight in kilograms divided by the square of the height<br />
in meters. Race and ethnic group were assigned by the investigators. Cardiovascular history was reported either by the<br />
patient or by chart review. CABG denotes coronary-artery bypass grafting, PCI percutaneous coronary intervention, ACE<br />
angiotensin-converting enzyme, ARB angiotensin II–receptor blocker, and HMG CoA 3-hydroxy-3-methylglutaryl coenzyme<br />
A.<br />
† P = 0.03 for the comparison with the high-hemoglobin group.<br />
‡ P = 0.05 for the comparison with the high-hemoglobin group.<br />
§ The rate was calculated with the use of the Cockcroft–Gault formula.<br />
¶ The GFR was calculated according to the MDRD formula.<br />
crease of 2.6±21.9 mm Hg in the low-hemoglobin<br />
group. The difference was not statistically significant<br />
between the two groups (P = 0.27). The mean<br />
diastolic blood pressure increased by 0.2±12.9<br />
mm Hg in the high-hemoglobin group and decreased<br />
by 0.7±12.4 mm Hg in the low-hemoglobin<br />
group by the end of the study, as compared<br />
with baseline (P = 0.02).<br />
The hemoglobin levels over time are shown in<br />
Figure 2A. The mean change in the hemoglobin<br />
level from baseline to the final measurement was<br />
2.5 g per deciliter for the high-hemoglobin group<br />
and 1.2 g per deciliter for the low-hemoglobin<br />
group, a mean difference of 1.3 g per deciliter<br />
(P
2090<br />
level in the high-hemoglobin group was nearly<br />
twice that required in the low-hemoglobin group<br />
(11,215 U and 6276 U per week, respectively).<br />
Primary Outcomes<br />
In the primary analysis of the composite events,<br />
a patient was counted only once (e.g., if a myocardial<br />
infarction occurred before a stroke, then only<br />
the time from randomization to the myocardial infarction<br />
was included in the composite event for<br />
the patient). A total of 222 composite events<br />
(death, myocardial infarction, hospitalization for<br />
congestive heart failure without renal replacement<br />
therapy, or stroke) occurred: 125 among the<br />
715 patients in the high-hemoglobin group, as<br />
compared with 97 among the 717 patients in the<br />
low-hemoglobin group (17.5% vs. 13.5%; hazard<br />
ratio, 1.34; 95% confidence interval [CI], 1.03 to<br />
1.74; P = 0.03) (Fig. 3A). Of the 222 composite<br />
events, there were 65 deaths (29.3%), 101 hospitalizations<br />
for congestive heart failure without<br />
renal replacement therapy (45.5%), 25 myocardial<br />
infarctions (11.3%), and 23 strokes (10.4%). Notably,<br />
seven patients (3.2%) were hospitalized for<br />
congestive heart failure and had a myocardial infarction<br />
on the same day, and one patient (0.5%)<br />
died after having a stroke on the same day. Death<br />
and hospitalization for congestive heart failure<br />
accounted for 74.8% of the composite events. Sensitivity<br />
analyses yielded similar results. A perprotocol<br />
analysis of primary outcome data for<br />
1395 patients showed a hazard ratio of 1.34<br />
(95% CI, 1.03 to 1.75; P = 0.03). The per-protocol<br />
population excluded 37 patients from the intention-to-treat<br />
population who did not meet the criteria<br />
required by the protocol and either underwent<br />
incorrect randomization, did not receive any<br />
dose of study medication, had no measurements<br />
of hemoglobin obtained after randomization, or<br />
did not meet all criteria for inclusion.<br />
On the basis of data from the intention-totreat<br />
population, but including all events from<br />
randomization to study termination or 30 days<br />
after the last administration of study medication,<br />
the hazard ratio for the primary outcome in the<br />
high-hemoglobin group, as compared with the<br />
low-hemoglobin group, was 1.30 (95% CI, 1.01 to<br />
1.68; P = 0.04). When the analysis included all<br />
events from randomization to 90 days after study<br />
termination, the hazard ratio was also 1.30 (95%<br />
CI, 1.01 to 1.66; P = 0.04).<br />
The new england journal of medicine<br />
n engl j med 355;20 www.nejm.org november 16, 2006<br />
Page 143<br />
Figure 2 (facing page). Mean Monthly Hemoglobin<br />
Levels (Panel A) and Mean Weekly Doses of Epoetin<br />
Alfa (Panel B).<br />
In Panel A, a separation in hemoglobin values between<br />
the two groups was observed just before the third<br />
month. Mean hemoglobin values were close to the target<br />
of 11.3 g per deciliter in the low-hemoglobin group<br />
but were consistently below the target of 13.5 g per deciliter<br />
in the high-hemoglobin group. A total of 93.9% of<br />
patients in the low-hemoglobin group and 75.9% of patients<br />
in the high-hemoglobin group had at least one hemoglobin<br />
value that reached the target. The median<br />
time for patients in the high-hemoglobin group to reach<br />
the target of 13.5 g per deciliter was 126 days (95% confidence<br />
interval [CI], 113 to 139), whereas it took a median<br />
of 36 days (95% CI, 29 to 43) for patients in the lowhemoglobin<br />
group to reach the target level of 11.3 g per<br />
deciliter (P
A<br />
B<br />
Mean Hemoglobin (g/dl)<br />
No. of Patients<br />
High-hemoglobin<br />
Low-hemoglobin<br />
Mean Dose of Epoetin Alfa (U)<br />
No. of Patients<br />
High-hemoglobin<br />
Low-hemoglobin<br />
15.5<br />
15.0<br />
14.5<br />
14.0<br />
13.5<br />
13.0<br />
12.5<br />
12.0<br />
11.5<br />
11.0<br />
10.5<br />
10.0<br />
9.5<br />
20,000<br />
18,000<br />
16,000<br />
14,000<br />
12,000<br />
10,000<br />
8,000<br />
6,000<br />
4,000<br />
2,000<br />
Correction of <strong>Anemia</strong> and Chronic Kidney Disease<br />
0<br />
0 2 4 6 8 10 12 14 16 18 20 22 24 26 28 30 32 34 36<br />
710<br />
707<br />
667<br />
672<br />
632<br />
625<br />
600<br />
603<br />
558<br />
549<br />
507<br />
528<br />
485<br />
510<br />
was examined; the difference between the two<br />
groups persisted (hazard ratio, 1.28; 95% CI, 1.07<br />
to 1.54; P = 0.007). Results similar to those in the<br />
primary analysis were observed when hospitalization<br />
for congestive heart failure with renal replacement<br />
therapy was included in the composite end<br />
point (hazard ratio for the high-hemoglobin group<br />
High-hemoglobin group<br />
433<br />
471<br />
Low-hemoglobin group<br />
367<br />
384<br />
Month<br />
306<br />
334<br />
252<br />
250<br />
194<br />
182<br />
High-hemoglobin group<br />
Low-hemoglobin group<br />
0<br />
0 2 4 6 8 10 12 14 16 18 20 22 24 26 28 30 32 34 36<br />
709<br />
707<br />
693<br />
691<br />
659<br />
655<br />
623<br />
621<br />
578<br />
577<br />
530<br />
549<br />
500<br />
526<br />
452<br />
479<br />
370<br />
393<br />
Month<br />
310<br />
333<br />
258<br />
262<br />
189<br />
189<br />
139<br />
141<br />
132<br />
141<br />
vs. the low-hemoglobin group, 1.37; P = 0.02). In<br />
addition, the results comparing all hospitalizations<br />
for congestive heart failure (including those<br />
involving renal replacement therapy) in the two<br />
groups were similar to the results of hospitalization<br />
for congestive heart failure in the primary end<br />
point (hazard ratio, 1.44; P = 0.04).<br />
n engl j med 355;20 www.nejm.org november 16, 2006 2091<br />
95<br />
101<br />
97<br />
95<br />
81<br />
75<br />
79<br />
73<br />
67<br />
60<br />
65<br />
54<br />
49<br />
45<br />
52<br />
43<br />
31<br />
30<br />
27<br />
27<br />
13<br />
13<br />
11<br />
12<br />
Page 144
2092<br />
The patients’ quality of life (as assessed by LASA,<br />
KDQ, and SF-36 scores) showed similar levels of<br />
improvement from baseline values in both groups,<br />
except for the score for the emotional role subscale<br />
of the SF-36, which was significantly higher<br />
in the low-hemoglobin group (Table 2).<br />
Of the patients who reported adverse events,<br />
a total of 376 of 686 patients (54.8%) in the highhemoglobin<br />
group and 334 of 688 patients (48.5%)<br />
in the low-hemoglobin group had at least one serious<br />
adverse event between the time of randomization<br />
and the end of the study (P = 0.02) (Table 3).<br />
The types of serious adverse events were similar<br />
in the two groups, with the exception of congestive<br />
heart failure, which occurred more frequently<br />
in the high-hemoglobin group (11.2% vs. 7.4%,<br />
P = 0.02). The types of serious adverse events that<br />
occurred after the end of study were also similar<br />
in the two groups (data not shown).<br />
Discussion<br />
We observed an increased risk of the primary composite<br />
end point in the high-hemoglobin group, as<br />
compared with the low-hemoglobin group. Death<br />
and hospitalization for congestive heart failure<br />
accounted for 74.8% of the composite events. On<br />
the basis of findings of three validated instruments<br />
(LASA, KDQ, and SF-36), the overall quality<br />
of life improved when anemia was treated with<br />
epoetin alfa, but aiming for a target value of 13.5 g<br />
of hemoglobin per deciliter provided no additional<br />
quality-of-life benefit. Since our study showed no<br />
apparent additional benefit in quality of life, and<br />
since the cost of epoetin alfa treatment increases<br />
with higher doses, we believe that the use of a<br />
high target hemoglobin level provides no cost<br />
benefit for either patients or payers in this population,<br />
even before considering risk.<br />
Several studies have demonstrated that the<br />
correction of anemia in patients with chronic<br />
kidney disease improves the quality of life and<br />
exercise tolerance while reducing the need for<br />
transfusion. 5,18 However, as Strippoli et al. have<br />
observed, 19 there remains much uncertainty about<br />
the validity of various assessments of the quality<br />
of life in published studies.<br />
Data on the effects of the correction of anemia<br />
on cardiovascular outcomes and survival have been<br />
both discordant and controversial. Recent large,<br />
controlled studies involving patients with pre–endstage<br />
or end-stage renal disease have shown either<br />
The new england journal of medicine<br />
n engl j med 355;20 www.nejm.org november 16, 2006<br />
Page 145<br />
Figure 3 (facing page). Kaplan–Meier Estimates<br />
of the Probability of the Primary Composite End Point<br />
and Secondary End Points of Individual Components<br />
— Hospitalization for Congestive Heart Failure (CHF)<br />
without Renal Replacement Therapy (RRT), Myocardial<br />
Infarction, Stroke, and Death.<br />
Panel A shows that the largest separation between the<br />
two groups in the primary composite end point occurred<br />
at 15 months. At that time, the Kaplan–Meier<br />
estimate of the difference in cumulative event rates between<br />
the two groups reached 4.7 percentage points<br />
(15.8% in the high-hemoglobin group vs. 11.1% in the<br />
low-hemoglobin group). After 15 months, the difference<br />
between the two groups remained constant, with<br />
752 patients (52.5%) remaining in the study (355 in<br />
the high-hemoglobin group and 397 in the low-hemoglobin<br />
group). There were no significant differences<br />
between the two groups in the four individual components<br />
of the primary composite end point (Panels B,<br />
C, D, and E). However, the hazard ratios for death and<br />
hospitalization for CHF had strong trends toward a<br />
higher risk in the high-hemoglobin group than in the<br />
low-hemoglobin group.<br />
an increase in adverse events or no benefit from<br />
the normalization of hemoglobin levels. 20-26 Furthermore,<br />
in several studies, complete correction<br />
of anemia, as compared with partial correction,<br />
did not improve left ventricular hypertrophy. 18,20-<br />
23 Our results, coupled with the results of other<br />
recent interventional trials involving patients with<br />
chronic kidney disease, 27,28 reinforce the differences<br />
between observational and clinical trial data,<br />
which appear particularly notable in the setting<br />
of anemia therapy. 29<br />
The <strong>Anemia</strong> Guideline Committee of the Dialysis<br />
Outcomes Quality Initiative has recently<br />
updated its guidelines. 10 The lower limit of the<br />
hemoglobin level was set at 11.0 g per deciliter<br />
as an “evidence-based recommendation,” whereas<br />
the upper limit was set at 13.0 g per deciliter as<br />
a “clinical practice recommendation.” The committee<br />
concluded that there was insufficient evidence<br />
to recommend the routine maintenance of<br />
a hemoglobin level of 13.0 g per deciliter or higher<br />
in patients being treated with erythropoiesis-stimulating<br />
agents. There was also concern that the<br />
narrow range of 11 to 12 g per deciliter could not<br />
be achieved because of hemoglobin cycling. The<br />
panel emphasized that the use of a high target<br />
hemoglobin level may be associated with an increased<br />
risk. In the high-hemoglobin group in our<br />
study, we used a level of 13.5 g per deciliter as a<br />
target but achieved a mean level of just 12.6 g per
Primary Composite End Point<br />
0.30<br />
A<br />
High-hemoglobin group<br />
0.25<br />
0.20<br />
Low-hemoglobin group<br />
0.15<br />
0.10<br />
Probability of<br />
Composite Event<br />
Correction of <strong>Anemia</strong> and Chronic Kidney Disease<br />
0.05<br />
0.00<br />
0 3 6 9 12 15 18 21 24 27 30 33 36 39<br />
Month<br />
23<br />
23<br />
55<br />
44<br />
72<br />
67<br />
101<br />
107<br />
176<br />
182<br />
270<br />
293<br />
355<br />
397<br />
457<br />
499<br />
520<br />
539<br />
587<br />
594<br />
654<br />
660<br />
715<br />
717<br />
No. at Risk<br />
High-hemoglobin<br />
Low-hemoglobin<br />
Hazard ratio: 0.91<br />
P=0.78<br />
Low-hemoglobin group<br />
Myocardial Infarction<br />
0.20<br />
0.15<br />
0.10<br />
0.05<br />
B Hospitalization for CHF (without RRT)<br />
C<br />
0.20<br />
0.15 Hazard ratio: 1.41<br />
High-hemoglobin group<br />
P=0.07<br />
0.10<br />
0.05<br />
Low-hemoglobin group<br />
High-hemoglobin group<br />
0.00<br />
Probability of Event<br />
0.00<br />
Probability of Event<br />
0 3 6 9 12 15 18 21 24 27 30 33 36 39<br />
Month<br />
0 3 6 9 12 15 18 21 24 27 30 33 36 39<br />
Month<br />
25<br />
26<br />
59<br />
49<br />
79<br />
73<br />
113<br />
115<br />
193<br />
192<br />
295<br />
307<br />
387<br />
415<br />
487<br />
520<br />
543<br />
560<br />
612<br />
609<br />
674<br />
672<br />
715<br />
717<br />
No. at Risk<br />
High-hemoglobin<br />
Low-hemoglobin<br />
23<br />
24<br />
56<br />
45<br />
73<br />
70<br />
102<br />
111<br />
179<br />
187<br />
273<br />
299<br />
359<br />
402<br />
461<br />
504<br />
523<br />
544<br />
591<br />
596<br />
656<br />
663<br />
715<br />
717<br />
No. at Risk<br />
High-hemoglobin<br />
Low-hemoglobin<br />
n engl j med 355;20 www.nejm.org november 16, 2006 2093<br />
Death<br />
0.20<br />
D Stroke<br />
E<br />
0.20<br />
High-hemoglobin group<br />
Hazard ratio: 1.48<br />
P=0.07<br />
0.15<br />
Probability of Event<br />
Hazard ratio: 1.01<br />
P=0.98<br />
0.15<br />
0.10<br />
Low-hemoglobin group<br />
0.10<br />
Low-hemoglobin group<br />
0.05<br />
High-hemoglobin group<br />
0.05<br />
0.00<br />
0.00<br />
Probability of Event<br />
0 3 6 9 12 15 18 21 24 27 30 33 36 39<br />
Month<br />
39<br />
0 3 6 9 12 15 18 21 24 27 30 33 36<br />
Month<br />
25<br />
26<br />
60<br />
49<br />
80<br />
74<br />
114<br />
117<br />
196<br />
195<br />
297<br />
310<br />
389<br />
418<br />
490<br />
523<br />
545<br />
564<br />
614<br />
610<br />
675<br />
676<br />
715<br />
717<br />
No. at Risk<br />
High-hemoglobin<br />
Low-hemoglobin<br />
25<br />
25<br />
59<br />
48<br />
79<br />
72<br />
113<br />
115<br />
195<br />
193<br />
295<br />
306<br />
386<br />
414<br />
487<br />
518<br />
543<br />
559<br />
611<br />
608<br />
672<br />
675<br />
715<br />
717<br />
No. at Risk<br />
High-hemoglobin<br />
Low-hemoglobin<br />
Page 146
Table 2. Secondary End Points.*<br />
End Point<br />
2094<br />
High-Hemoglobin<br />
Group (N=715)<br />
The new england journal of medicine<br />
no. of patients (%)<br />
Low-Hemoglobin<br />
Group (N=717) Hazard Ratio (95% CI) P Value†<br />
Clinical results<br />
Components of the primary end point‡<br />
Death 52 (7.3) 36 (5.0) 1.48 (0.97–2.27) 0.07<br />
Hospitalization for congestive<br />
heart failure (without renal<br />
replacement therapy)<br />
64 (9.0) 47 (6.6) 1.41 (0.97–2.05) 0.07<br />
Myocardial infarction 18 (2.5) 20 (2.8) 0.91 (0.48–1.73) 0.78<br />
Stroke<br />
Renal replacement therapy<br />
12 (1.7) 12 (1.7) 1.01 (0.45–2.25) 0.98<br />
Any renal replacement therapy§ 155 (21.7) 134 (18.7) 1.19 (0.94–1.49) 0.15<br />
Hospitalization for renal replacement<br />
therapy<br />
Hospitalization<br />
99 (13.8) 81 (11.3) 1.25 (0.93–1.68) 0.13<br />
Cardiovascular causes 233 (32.6) 197 (27.5) 1.23 (1.01–1.48) 0.03<br />
Any cause 369 (51.6) 334 (46.6) 1.18 (1.02–1.37) 0.03<br />
High-Hemoglobin Group Low-Hemoglobin Group P Value¶<br />
Baseline Change from Baseline∥ Baseline Change from Baseline**<br />
Quality of life††<br />
LASA score<br />
Energy 38.1±23.7 16.6±28.6 38.2±23.1 15.5±28.6 0.67<br />
Activity 40.8±25.9 15.0±39.9 42.5±25.8 13.3±29.8 0.98<br />
Overall quality of life 46.3±26.2 11.2±29.7 46.1±25.4 11.9±28.1 0.46<br />
KDQ total score<br />
SF-36 score<br />
20.3±5.80 1.6±5.6 20.6±6.00 1.1±5.6 0.26<br />
Physical function 41.9±28.2 3.2±24.0 42.4±27.3 2.1±23.3 0.49<br />
Physical role 31.9±38.9 6.4±40.7 32.5±39.2 7.5±43.2 0.32<br />
Pain 57.8±28.5 0.4±28.1 58.0±27.1 2.4±26.7 0.15<br />
General health 41.3±20.1 3.0±19.2 42.6±20.1 1.8±17.8 0.87<br />
Vitality 35.2±22.6 10.0±23.8 36.6±22.4 8.2±20.6 0.58<br />
Social function 63.7±29.5 1.3±33.1 63.7±29.0 3.5±28.7 0.16<br />
Emotional role 57.2±43.6 0.8±48.3 57.4±43.3 5.9±48.1 0.01<br />
Mental health 69.6±19.5 1.7±18.5 70.2±20.1 2.4±18.2 0.31<br />
* Plus–minus values are means ±SD. Hazard ratios are for the comparison of the high-hemoglobin group with the low-hemoglobin group.<br />
† P values were calculated by the log-rank test.<br />
‡ Components of the primary end point were analyzed separately. For example, if a patient had more than one type of event, each event was<br />
counted the first time it occurred. Therefore, a patient could be included in more than one category of events. In the primary analysis of<br />
the composite events, a patient was counted only once (e.g., if a myocardial infarction occurred before a stroke, then only the time from<br />
randomization to the myocardial infarction was included in the composite event for the patient).<br />
§ A total of 47 patients (24 in the high-hemoglobin group and 23 in the low-hemoglobin group) had a composite event.<br />
¶ P values were calculated by analysis of covariance with the baseline score as a covariate.<br />
∥ P values for comparisons of the change from baseline were between
Table 3. Adverse Events.*<br />
Correction of <strong>Anemia</strong> and Chronic Kidney Disease<br />
High-Hemoglobin Group<br />
(N = 686)<br />
deciliter, with an increase in risk with no qualityof-life<br />
benefit. Furthermore, the number of patients<br />
who had at least one serious adverse event<br />
was higher in the high-hemoglobin group than<br />
in the low-hemoglobin group. Thus, our study<br />
does not provide support for the expanded target<br />
range recently advocated by the National<br />
Kidney Foundation.<br />
Patients in the high-hemoglobin group had a<br />
higher (but not significantly higher) rate of both<br />
progression to renal replacement therapy and hospitalization<br />
for renal replacement therapy. Smaller<br />
interventional studies have suggested the contrary.<br />
In a recent randomized, controlled study<br />
involving 88 patients, Gouva et al. reported that<br />
the early initiation of epoetin alfa treatment in<br />
patients with chronic kidney disease in an effort<br />
to achieve a hemoglobin level of 13.0 g per deciliter<br />
reduced the rate of the composite end point<br />
Low-Hemoglobin Group<br />
(N = 688) P Value†<br />
Adverse Event<br />
no. of patients (%)<br />
Any event<br />
Thrombovascular event<br />
607 (88.5) 589 (85.6) 0.11<br />
Any event 126 (18.4) 120 (17.4) 0.65<br />
Any clinically relevant event‡ 74 (10.8) 82 (11.9) 0.51<br />
Any serious adverse event 376 (54.8) 334 (48.5) 0.02<br />
Any serious adverse event associated with<br />
epoetin alfa§<br />
Serious adverse events**<br />
10 (1.5)¶ 3 (0.4)∥ 0.05<br />
Congestive heart failure 77 (11.2) 51 (7.4) 0.02<br />
Myocardial infarction 10 (1.5) 19 (2.8) 0.09<br />
Gastrointestinal hemorrhage 18 (2.6) 18 (2.6) 0.99<br />
Chest pain 23 (3.4) 16 (2.3) 0.25<br />
Cellulitis 16 (2.3) 11 (1.6) 0.33<br />
Pneumonia 32 (4.7) 28 (4.1) 0.59<br />
Renal failure 95 (13.8) 73 (10.6) 0.07<br />
* The analysis includes 1374 patients in the two study groups who received at least one dose of epoetin alfa and for<br />
whom data were collected regarding adverse events.<br />
† P values were calculated by the chi-square test.<br />
‡ The thrombovascular events that were considered to be clinically relevant included myocardial infarction, stroke, angina<br />
pectoris, transient ischemic attack, deep-vein thrombosis, pulmonary embolism, and retinal-vein occlusion.<br />
§ The event was deemed by the investigators to be related to drug administration.<br />
¶ These events included two cases of deep-vein thrombosis and one case each of pulmonary embolism, retinal-vein occlusion,<br />
transient ischemic attack, deep-vein thrombosis and pulmonary embolism, priapism, rash, allergic dermatitis,<br />
and unstable angina.<br />
∥ These events included one case each of hypertension, pulmonary embolism, and stroke.<br />
** Serious adverse events that occurred in at least 2% of patients in either study group are listed.<br />
of a doubling of creatinine levels, renal replacement,<br />
or death, as compared with deferred initiation<br />
of treatment (P = 0.008 by the log-rank<br />
test). 30 However, elsewhere in this issue of the<br />
Journal, the Cardiovascular Risk Reduction by Early<br />
<strong>Anemia</strong> Treatment with Epoetin Beta (CREATE)<br />
investigators report that more patients assigned<br />
to complete correction of anemia than to partial<br />
correction progressed to dialysis at the end of the<br />
study (P = 0.03). 24 Thus, it appears that larger studies<br />
either demonstrate no apparent benefit or<br />
actually may show an increased risk of progression<br />
to renal replacement therapy with the targeting<br />
of a high hemoglobin value. Clearly, additional<br />
studies will be required to address this issue.<br />
Our study has several potential limitations.<br />
Since we prespecified the censoring of data on<br />
patients at the time of the initiation of renal replacement<br />
therapy, no further data were collected;<br />
Page 148<br />
n engl j med 355;20 www.nejm.org november 16, 2006 2095
2096<br />
there is a possibility of bias if the rates of renal<br />
replacement therapy differed between the two<br />
groups. Our analysis showed that there was no<br />
significant difference between the two groups<br />
with respect to the time to renal replacement<br />
therapy (P = 0.15). Furthermore, when renal replacement<br />
therapy was treated as an event and<br />
added to the composite outcome, the difference<br />
between the two groups was similar to that obtained<br />
in the primary analysis. A potential limitation<br />
of the reporting of the components of the<br />
primary end point is the issue of death as a competing<br />
risk. It could be argued that the results<br />
with respect to myocardial infarction and stroke<br />
should be interpreted with caution; however, our<br />
primary results remain unchanged. We also censored<br />
data from the time-to-event analysis for a<br />
large number of patients because they required<br />
renal replacement therapy (16.9%) or withdrew<br />
from the study (21.4%) (Fig. 1). This factor would<br />
be a limitation if the censoring that occurred was<br />
not random in nature; however, such confounding<br />
is unlikely because the numbers of patients<br />
whose data were censored or who withdrew for<br />
other reasons did not differ significantly between<br />
the two groups. The differential withdrawal rate<br />
could also have generated bias. The low-hemoglobin<br />
group did have a higher number of early<br />
withdrawals for other reasons than did the highhemoglobin<br />
group. However, the low-hemoglobin<br />
group had more patient-years of follow-up (980,<br />
as compared with 959 in the high-hemoglobin<br />
group). Furthermore, the two groups had similar<br />
demographic characteristics at baseline.<br />
Another potential limitation is the lack of a<br />
double-blind design; this could have biased the<br />
assessment of some end points, such as congestive<br />
heart failure and the quality of life, which<br />
have an element of subjectivity. To address this<br />
issue, we used a tighter definition of congestive<br />
heart failure (i.e., without renal replacement therapy).<br />
In addition, the adjudication process by the<br />
committee reviewing clinical end points should<br />
have attenuated the possibility of bias because<br />
The new england journal of medicine<br />
n engl j med 355;20 www.nejm.org november 16, 2006<br />
Page 149<br />
committee members were unaware of patients’<br />
study-group assignments.<br />
In conclusion, our study showed that the use<br />
of a target hemoglobin level of 13.5 g per deciliter<br />
(as compared with a level of 11.3 g per deciliter) is<br />
associated with an increased risk among patients<br />
with anemia caused by chronic kidney disease.<br />
Furthermore, no incremental improvement in the<br />
quality of life was observed. Hence, we recommend<br />
the use of a target hemoglobin level of 11.0<br />
to 12.0 g per deciliter rather than a level of 11.0 to<br />
13.0 g per deciliter to correct anemia in patients<br />
with chronic kidney disease, because of increased<br />
risk, a likely increased cost, and no quality-of-life<br />
benefit. This study did not provide a mechanistic<br />
explanation for the poorer outcome with the use<br />
of a high target hemoglobin level. More studies<br />
will be required to explore the role of the level of<br />
hemoglobin and the dose of epoetin alfa to understand<br />
these findings more completely.<br />
Supported by Ortho Biotech Clinical Affairs and Johnson &<br />
Johnson Pharmaceutical Research and Development, both subsidiaries<br />
of Johnson & Johnson.<br />
Dr. Singh reports receiving consulting fees from Ortho Biotech<br />
Clinical Affairs, <strong>Amgen</strong>, Roche, Merck (Germany), Abbott,<br />
Watson, and Horizon Blue Cross Blue Shield and lecture fees<br />
from Ortho Biotech Clinical Affairs, Roche, <strong>Amgen</strong>, Abbott,<br />
Watson, Scios, Pfizer, and Genzyme; serving on advisory boards<br />
for Ortho Biotech Clinical Affairs, Roche, Acologix, Watson,<br />
Advanced Magnetics, and <strong>Amgen</strong>; and receiving grant support<br />
from Ortho Biotech Clinical Affairs, Dialysis Clinic, Roche,<br />
Baxter, Johnson & Johnson, <strong>Amgen</strong>, Watson, and Aspreva. Dr.<br />
Szczech reports receiving consulting fees from Ortho Biotech<br />
Clinical Affairs, Nabi Pharmaceuticals, Gilead, Kuraha, Acologix,<br />
and Roche; lecture fees from Nabi Biopharmaceuticals,<br />
GlaxoSmithKline, Genzyme, Abbott, <strong>Amgen</strong>, and Ortho Biotech;<br />
and grant support from Ortho Biotech Clinical Affairs. Dr.<br />
Barnhart reports receiving consulting fees and grant support<br />
from Ortho Biotech Clinical Affairs. Drs. Tang and Wolfson report<br />
being employees of Ortho Biotech Clinical Affairs. Dr. Reddan<br />
reports receiving consulting fees from Ortho Biotech Clinical<br />
Affairs and Shire Pharmaceuticals; lecture fees from <strong>Amgen</strong>,<br />
Novartis, Pfizer, AstraZeneca, and General Electric; and grant<br />
support from Ortho Biotech Clinical Affairs, <strong>Amgen</strong>, and Novartis.<br />
No other potential conflict of interest relevant to this article<br />
was reported.<br />
We thank Dr. Anil Londhe for biostatistical support; Drs. William<br />
F. Owen, Jr., Mark Klausner, and Michael Corwin for help<br />
in the development of the study protocol; and the many investigators,<br />
study nurses, and coordinators who contributed to this<br />
study.<br />
Appendix<br />
The following investigators participated in the CHOIR trial: Study Chairs: A.K. Singh and D. Reddan. Investigators: University of Tennessee,<br />
Memphis — S. Acchiardo; Outcomes Research International, Hudson, FL — M.K. Acharya; University of Southern California, Los Angeles — M. Akmal;<br />
Research Institute of Dallas, Dallas — S. Aronoff; North Shore University Hospital, Great Neck, NY — A. Ashfaq; Worcester Medical Center, Worcester, MA<br />
— R. Black; Louisiana State University Medical Center, Shreveport — J. Blondin; Balboa Nephrology Medical Group, La Jolla, CA — M. Boiskin; University<br />
of Virginia Health System, Charlottesville — W.K. Bolton; South Dakota Health Research Foundation, Sioux Falls — L. Burris; Clinica Las Americas,<br />
San Juan, Puerto Rico — J.L. Cangiano; Emory Hypertension Research Center, Decatur, GA — A. Chapman; New York Hospital Medical Center of Queens,<br />
Flushing — C. Charytan; Regional Kidney Disease Center/Associates in Nephrology, Erie, PA — E. Clark, F. Foti; Internal Medicine Specialists, Orlando,<br />
FL — J. Cohen; Carolina Kidney Associates, Greensboro, NC — J.A. Coladonato; Renal Hypertension Physicians, Mount Laurel, NJ — M. Conrad;
Correction of <strong>Anemia</strong> and Chronic Kidney Disease<br />
Southwest Kidney Institute, Tempe, AZ — R. Cooper; University of California, Los Angeles, Medical Center, Sylmar — D. Corry; Cleveland Clinic Foundation,<br />
Cleveland — V. Dennis; Advanced Medical Research Institute, Fresno, CA — G. Dhillon; University of Miami Hospital and Clinics, Miami — J.<br />
Diego; Virginia Commonwealth University, Richmond — S. DiGiovanni; St. Louis — D.T. Domoto; Research Center of Florida, Miami — F. Dumenigo;<br />
Sislen and Associates, Washington, DC — G. Eisner; University of Southern California, Los Angeles — M. El Shahawy; Charles River Medical<br />
Associates, Framingham, MA — L. Epstein; California Institute of Renal Research, San Diego — G. Fadda; Kidney Associates, Houston — S. Fadem;<br />
Nephrology Associates, Rock Hill, SC — J. Fassler; Winthrop University Hospital, Mineola, NY — S. Fishbane; Talbert Medical Group, Huntington Beach,<br />
CA — M. Fredrick; San Antonio Kidney Disease Center, San Antonio, TX — T. Fried; Wake Nephrology Associates, Raleigh, NC — L. Garrett; Western<br />
New England Renal and Transplant Associates, Springfield, MA — M. Germain; South Florida Nephrology Associates, Lauderdale Lakes — R. Geronemus;<br />
Georgetown University Medical Center, Washington, DC — J. Gonin; Renal Medical Group, Visalia, CA — R.J. Haley; Mayo Clinic, Jacksonville, FL<br />
— W.E. Haley; Regional Kidney Disease Center, Erie, PA — R.D. Halligan; University of Oklahoma, Health Science Center, Oklahoma City — L. Haragsim;<br />
Bronx Nephrology Hypertension, Bronx, NY — M. Henriquez; Nephrology Associates of Western New York, Amherst — T. Herman; North Shore<br />
Diabetes and Endocrine Associates, New Hyde Park, NY — K. Hershon; Miami Kidney Group, Miami — D. Hoffman; University of California, Los Angeles,<br />
Medical Center, Los Angeles — E. Jacobson; Indiana University Medical Center, Indianapolis — M. Jaradat; Empire Health Services, Spokane, WA<br />
— S. Joshi; University Internal Medicine Associates, Cincinnati — S. Kant; Northwest Louisiana Nephrology, Shreveport — M. Kaskas; George Washington<br />
University Medical Center, Washington, DC — P. Kimmel; Medical Group of North County, Vista, CA — S. Kipper; Stanford University Medical<br />
Center, Stanford, CA — R. Lafayette; Apex Research of Riverside, Riverside, CA — J. Lee; Southbay Pharma Research, Buena Park, CA — S. Lee; University<br />
of Arizona Health Sciences Center, Tucson — H.Y. Lien; Discovery Medical Research Group, Ocala, FL — H.R. Locay; Twin Cities Clinical Research,<br />
Brooklyn Center, MN — N. Lunde; Bronx Westchester Medical Group, Bronx, NY — R. Lynn; Health Research Association, Los Angeles — H. Madkour;<br />
Jefferson Nephrology, Charlottesville, VA — K. McConnell; Foundation Research, St. Petersburg, FL — M. McIvor; Arlington Nephrology, Arlington, TX<br />
— B.R. Mehta; University of California, San Diego, Medical Center, San Diego — R. Mehta; Model Clinical Research, Baltimore — J.H. Mersey; Glendale<br />
Internal Medicine and Cardiology Medical Group, Glendale, CA — R. Minasian; Hurley Medical Center, Flint, MI — A. Mohammed; University of Chicago<br />
Hospitals, Chicago — P. Murray; Nephrology Associates of Orangeburg, Orangeburg, SC — M. Nassri; Genesis Clinical Research Corporation, Tampa,<br />
FL — J. Navarro; University of California at Los Angeles, Los Angeles — A.R. Nissenson; State University of New York at Stony Brook, Stony Brook — E.<br />
Nord; Empire Health Services, Spokane, WA — L.E. Obermiller; Morehouse School of Medicine, Atlanta — C. Obialo; Grand Street Medical Associates,<br />
Kingston, NY — P. Pagnozzi; Odyssey Research Services, Bullhead City, AZ — S.M. Parekhehzad; InterMedix, Winter Haven, FL — E. Perez; Medical<br />
College of Wisconsin, Milwaukee — W. Piering; Nephrology and Endocrine Associates Research, Las Vegas — N. Pokroy; Saint Clair Specialty Physicians,<br />
Detroit — R. Provenzano; Columbia University Medical Center, New York — J. Radhakrishnan; Charlotte Nephrology Associates, Port Charlotte, FL — R.<br />
Rajaram; InterMedix, Tampa, FL — G. Ramirez, G. Serrano; Nephrology Associates of Central Florida, Orlando — U. Ranjit; Citrus Nephrology,<br />
Crystal River, FL — P. Reddy; East Bay Nephrology, San Pablo, CA — D. Ricker; Dallas Nephrology Associates, Dallas — J. Roman-Latorre; University<br />
of Pennsylvania Health System–Presbyterian Medical Center, Philadelphia — M. Rudnick; State University of New York, Brooklyn — M. Salifu;<br />
University of Kentucky Medical Center, Lexington — B.P. Sawaya; West Virginia University, Morgantown — R. Schmidt; Vanderbilt University Medical<br />
Center, Nashville — G. Schulman; Drexel University College of Medicine, Philadelphia — A.B. Schwartz; Diabetes and Glandular Disease Research Associates,<br />
San Antonio, TX — S.L. Schwartz; Springfield Gardens, NY — D. Scott; Clinical Research Solutions, Knoxville, TN — D.M. Sellers; Brookdale<br />
University Hospital and Medical Center, Brooklyn, NY — W. Shapiro; Jefferson Renal Association, Philadelphia — K. Sharma; Rhode Island Hospital,<br />
Providence — D. Shemin; Redrock Research Center, Las Vegas — L.K. Shete; Temple University Hospital, Philadelphia — P. Silva; Metabolism Associates,<br />
New Haven, CT — D.B. Simon; Brigham and Women’s Hospital, Boston — A. Singh; FutureCare Studies, Springfield, MA — J. Slater; Nephrology<br />
Associates, Augusta, GA — M. Smith; Fletcher Allen Health Care, Burlington, VT — R. Solomon; Ohio State University Hospitals, Columbus — D. Spetie;<br />
University of Colorado Hospitals and Health Sciences Center, Denver — D. Spiegel; National Institute of Clinical Research, Los Angeles — M. Spira;<br />
Evanston Northwestern Healthcare, Evanston, IL — S.M Sprague; Methodist Research Institute, Indianapolis — T. Taber; Salem Hospital, Salem, OR<br />
— D. Tran; California Kidney Medical Group, Simi Valley — K. Tucker; Emory Clinic, Atlanta — J. Tumlin; Associates in Family Practice Clinical Research,<br />
Davie, FL — M. Vacker; Associates in Nephrology, Fort Myers, FL — J. Van Sickler; Penn State Milton S. Hershey Medical Center, Hershey — N.<br />
Verma; Long Island Jewish Medical Center, New Hyde Park, NY — J.D. Wagner; Baltimore — M. Waseem; Hypertension and Nephrology, Providence,<br />
RI — M. Weinberg; West Palm Beach, FL — R. Weiss; Tennessee Cardiovascular Research Institute, Nashville — M. Wigger; Clinical Research Associates<br />
of Tidewater, Norfolk, VA — D. Wombolt; Queens Medical Center, Honolulu — E. Wong; Western Nephrology and Metabolic Bone Disease, Lakewood,<br />
CO — M. Yanover; Northwest Louisiana Nephrology, Shreveport — R.I. Zabaneh; and Southwest Nephrology, Evergreen Park, IL — D. Zikos; Clinical<br />
Event Adjudication Committee: DCRI, Duke University School of Medicine, Durham, NC — K.W. Mahaffey (chair), D.T. Laskowitz, L.A. Szczech;<br />
University of Texas Southwestern, Dallas — S. Hedayati; Hennepin County Medical Center, Minnepolis — C.A. Herzog; William Beaumont Hospital,<br />
Royal Oak, MI — P. McCullough; Data and Safety Monitoring Board: Brigham and Women’s Hospital, Boston — M. Pfeffer (initial chair); Beth<br />
Israel Deaconess Medical Center, Boston — T. Steinman (subsequent chair); Baylor College of Medicine, Houston — G. Eknoyan; Cleveland Clinic<br />
Foundation, Cleveland — T. Greene; Washington University School of Medicine, St. Louis — S. Klahr; Dallas Transplant Institute, Dallas — T.F.<br />
Parker; CHOIR Scientific Advisory Board: Rush University Medical Center, Chicago — G.L. Bakris; DCRI, Duke University School of Medicine, Durham,<br />
NC — R.M. Califf; Minneapolis Medical Research Foundation, Minneapolis — R.N. Foley; State University of New York, Brooklyn — E.A. Friedman;<br />
Stanford Medical Center, Stanford, CA — L.T. Goodnough; George Washington University, Washington, DC — P.L. Kimmel; University of<br />
British Columbia, Vancouver, Canada — A. Levin; Georgia Medical Care Foundation, Atlanta — W. McClennan; Memorial University, St. John’s, NL, Canada<br />
— P. Parfrey.<br />
References<br />
1. Astor BC, Muntner P, Levin A, Eustace 3. Ross SD, Fahrbach K, Frame D, Scheye<br />
JA, Coresh J. Association of kidney function R, Connelly JE, Glaspy J. The effect of ane-<br />
with anemia: the Third National Health and mia treatment on selected health-related<br />
Nutrition Examination Survey (1988-1994). quality-of-life domains: a systematic re-<br />
Arch Intern Med 2002;162:1401-8. view. Clin Ther 2003;25:1786-805.<br />
2. Jones M, Ibels L, Schenkel B, Zagari 4. Levin A. <strong>Anemia</strong> and left ventricular<br />
M. Impact of epoetin alfa on clinical end hypertrophy in chronic kidney disease pop-<br />
points in patients with chronic renal failulations: a review of the current state of<br />
ure: a meta-analysis. Kidney Int 2004;65: knowledge. Kidney Int Suppl 2002;80:35-8.<br />
757-67.<br />
5. Besarab A, Bolton WK, Browne JK, et<br />
al. The effects of normal as compared with<br />
low hematocrit values in patients with<br />
cardiac disease who are receiving hemodialysis<br />
and epoetin. N Engl J Med 1998;<br />
339:584-90.<br />
6. Strippoli GF, Manno C, Schena FP,<br />
Craig JC. Haemoglobin and haematocrit<br />
targets for the anaemia of chronic renal<br />
disease. Cochrane Database Syst Rev 2003;<br />
1:CD003967.<br />
Page 150<br />
n engl j med 355;20 www.nejm.org november 16, 2006 2097
2098<br />
Correction of <strong>Anemia</strong> and Chronic Kidney Disease<br />
7. Collins AJ, Li S, St Peter W, et al. mental health constructs. Med Care 1993;<br />
Death, hospitalization, and economic as- 31:247-63.<br />
sociations among incident hemodialysis 15. Lan KKG, DeMets DL. Discrete se-<br />
patients with hematocrit values of 36 to quential boundaries for clinical trials.<br />
39%. J Am Soc Nephrol 2001;12:2465-73. Biometrika 1983;70:659-63.<br />
8. Xue JL, St Peter WL, Ebben JP, Everson 16. DeMets DL, Lan, KK. Interim analy-<br />
SE, Collins AJ. <strong>Anemia</strong> treatment in the sis: the alpha spending function approach.<br />
pre-ESRD period and associated mortality Stat Med 1994;13:1241-52.<br />
in elderly patients. Am J Kidney Dis 2002; 17. Jennison C, Turnbull BW. Group se-<br />
40:1153-61.<br />
quential methods with applications to<br />
9. National Kidney Foundation. K/DOQI clinical trials. Boca Raton, FL: Chapman<br />
clinical practice guidelines for anemia of & Hall/CRC, 2000:29-31,<br />
chronic kidney disease: update 2000. Am 18. Parfrey PS, Foley RN, Wittreich BH,<br />
J Kidney Dis 2001;37:Suppl 1:S182-S238. Sullivan DJ, Zagari MJ, Frei D. Double-<br />
10. Idem. K/DOQI clinical practice guideblind comparison of full and partial anelines<br />
and clinical practice recommendamia correction in incident hemodialysis<br />
tions for anemia in chronic kidney dis- patients without symptomatic heart disease.<br />
Am J Kidney Dis 2006;47:Suppl 3: ease. J Am Soc Nephrol 2005;16:2180-9.<br />
S11-S145.<br />
19. Strippoli GF, Craig JC, Manno C,<br />
11. Levey AS, Bosch JP, Lewis JB, Greene T, Schena FP. Hemoglobin targets for the<br />
Rogers N, Roth D. A more accurate meth- anemia of chronic kidney disease: a metaod<br />
to estimate glomerular filtration rate analysis of randomized controlled trials.<br />
from serum creatinine: a new prediction J Am Soc Nephrol 2004;15:3154-65.<br />
equation. Ann Intern Med 1999;130:461- 20. Foley RN, Parfrey PS, Morgan J, et al.<br />
70.<br />
Effect of hemoglobin levels in hemodialy-<br />
12. Coates A, Dillenbeck CF, McNeil DR, sis patients with asymptomatic cardiomy-<br />
et al. On the receiving end — II. Linear opathy. Kidney Int 2000;58:1325-35.<br />
Analogue Self-Assessment (LASA) in eval- 21. Levin A, Djurdjev O, Thompson C, et al.<br />
uation of aspects of the quality of life of Canadian randomized trial of hemoglo-<br />
cancer patients receiving therapy. Eur J bin maintenance to prevent or delay left<br />
Cancer Clin Oncol 1983;19:1633-7. ventricular mass growth in patients with<br />
13. Hays RD, Kallich JD, Mapes DL, CKD. Am J Kidney Dis 2005;46:799-811.<br />
Coons SJ, Carter WB. Development of the 22. McMahon LP, Roger SD, Levin A,<br />
Kidney Disease Quality of Life (KDQOL) Slimheart Investigators Group. Develop-<br />
instrument. Qual Life Res 1994;3:329-38. ment, prevention, and potential reversal<br />
14. McHorney CA, Ware JE Jr, Raczek AE. of left ventricular hypertrophy in chronic<br />
The MOS 36-Item Short-Form Health Sur- kidney disease. J Am Soc Nephrol 2004;15:<br />
vey (SF-36): II. Psychometric and clinical 1640-7.<br />
tests of validity in measuring physical and 23. Roger SD, McMahon LP, Clarkson A,<br />
EARLY JOB ALERT SERVICE AVAILABLE AT THE NEJM CAREERCENTER<br />
Register to receive weekly e-mail messages with the latest job openings<br />
that match your specialty, as well as preferred geographic region,<br />
practice setting, call schedule, and more. Visit the NEJM CareerCenter<br />
at www.nejmjobs.org for more information.<br />
n engl j med 355;20 www.nejm.org november 16, 2006<br />
Page 151<br />
et al. Effects of early and late intervention<br />
with epoetin alfa on left ventricular mass<br />
among patients with chronic kidney disease<br />
(stage 3 or 4): results of a randomized<br />
clinical trial. J Am Soc Nephrol 2004;<br />
15:148-56.<br />
24. Drüeke TB, Locatelli F, Clyne N, et al.<br />
Normalization of hemoglobin level in patients<br />
with chronic kidney disease and<br />
anemia. N Engl J Med 2006;355:2071-84.<br />
25. Rossert J, Levin A, Roger SD, et al. Effect<br />
of early correction of anemia on the<br />
progression of CKD. Am J Kidney Dis<br />
2006;47:738-50.<br />
26. Furuland H, Linde T, Ahlmen J, Christensson<br />
A, Strombom U, Danielson BG. A<br />
randomized controlled trial of haemoglobin<br />
normalization with epoetin alfa in<br />
pre-dialysis and dialysis patients. Nephrol<br />
Dial Transplant 2003;18:353-61.<br />
27. Wanner C, Krane V, Marz W, et al.<br />
Atorvastatin in patients with type 2 diabetes<br />
mellitus undergoing hemodialysis.<br />
N Engl J Med 2005;353:238-48. [Erratum,<br />
N Engl J Med 2005;353:1640.]<br />
28. Eknoyan G, Beck GJ, Cheung AK, et<br />
al. Effect of dialysis dose and membrane<br />
flux in maintenance hemodialysis. N Engl<br />
J Med 2002;347:2010-9.<br />
29. Parfrey PS. Target hemoglobin level<br />
for EPO therapy in CKD. Am J Kidney Dis<br />
2006;47:171-3.<br />
30. Gouva C, Nikolopoulos P, Ioannidis JP,<br />
Siamopoulos KC. Treating anemia early in<br />
renal failure patients slows the decline of<br />
renal function: a randomized controlled<br />
trial. Kidney Int 2004;66:753-60.<br />
Copyright © 2006 Massachusetts Medical Society.
Estimated Effect of Epoetin Dosage on Survival among<br />
Elderly Hemodialysis Patients in the United States<br />
Yi Zhang,* Mae Thamer,* Dennis Cotter,* James Kaufman, † and Miguel A. Hernán ‡<br />
*Medical Technology and Practice Patterns Institute, Bethesda, Maryland; and † Renal Section, Veterans Affairs Boston<br />
Healthcare System and Boston University School of Medicine, and ‡ Department of Epidemiology, Harvard School of<br />
Public Health, and Harvard-MIT Division of Health Sciences and Technology, Boston, Massachusetts<br />
Background and objectives: The common finding that low achieved hemoglobin in observational studies and high target<br />
hemoglobin in randomized trials each were associated with increased mortality and high epoetin dosage has suggested the<br />
possibility that high epoetin dosage might explain the increased mortality risk.<br />
Design, setting, participants, & measurements: We considered data from 18,454 patients who were >65 yr, were in the US<br />
Renal Data System, started hemodialysis in 2003, and survived 3 mo on dialysis. We estimated the association between<br />
cumulative average epoetin dosage and survival through the subsequent 9 mo by using inverse probability weighting to adjust<br />
for time-dependent confounding by indication.<br />
Results: Survival was similar throughout the entire follow-up period for the three hypothetical treatment regimens selected:<br />
Low dosage 15,000 U/wk, medium dosage 30,000 U/wk, and high dosage 45,000 U/wk. Compared with a cumulative average<br />
dosage of 20,000 to 30,000 U/wk, the estimated hazard ratio (HR; 95% confidence interval [CI]) was 0.90 (0.52 to 1.54) for<br />
Institutional claims, including treatment information, were used as the<br />
primary data set and merged with variables from patient, medical<br />
evidence, facility, and physician/supplier files from the USRDS core<br />
CD based on unique patient identifiers.<br />
We identified incident hemodialysis patients who were �65 yr and<br />
had their first ESRD service in 2003. We chose an elderly incident<br />
cohort so that we would have the complete data on their epoetin<br />
therapy (elderly patients are already enrolled in the Medicare program,<br />
unlike their younger counterparts who initiate dialysis, and do not<br />
have to wait for 3 mo before receiving Medicare dialysis benefits).<br />
Beginning in 2003, patients from hospital-based facilities might receive<br />
darbepoetin (Aranesp®; <strong>Amgen</strong> Inc., Thousand Oaks, CA) instead of<br />
epoetin alfa (11), the therapy of interest in this study, so we restricted<br />
our study population to patients who received dialysis care in freestanding<br />
facilities. Patients who did not receive their first outpatient<br />
dialysis claims in the first 90 d after being certified as having ESRD and<br />
those identified as having Medicare as a secondary payer were also<br />
excluded to ensure that we had the complete patient claims treatment<br />
history. The analysis was further restricted to patients who, during the<br />
first 3 mo on hemodialysis, did not have missing data, a history of HIV<br />
or cancer (studies suggest that patients with ESRD and HIV might<br />
respond differently to epoetin therapy compared with the ESRD population<br />
at large) (12–14), a change of dialysis modality, a kidney transplant,<br />
a change of dialysis provider, or a gap in billable dialysis services<br />
(defined as missing dialysis treatment or hospitalization information<br />
for �30 consecutive days).<br />
Follow-up started after 3 complete months of outpatient dialysis<br />
treatment and ended 9 mo later; at the time of death; at the time of<br />
censoring by change of dialysis modality (3.2% censored), a kidney<br />
transplant (0.5%), 60 d after change of dialysis provider (8.4%), or a gap<br />
in outpatient dialysis services (11.7%); or as a result of data anomalies<br />
(3%), whichever happened earliest. We could not use cause-specific<br />
mortality (e.g., cardiovascular mortality) as an outcome because the<br />
information on causes of death in the USRDS is not validated.<br />
Statistical Analysis<br />
We fit a pooled logistic model to estimate the probability of death at<br />
each month conditional on cumulative average log epoetin dosage<br />
(cubic splines with knots located at 5th, 25th, 75th, and 95th percentiles<br />
corresponding to weekly dosages of 3000, 8330, 22,900 and 46,950 U,<br />
respectively) through that month. For each patient and month, the<br />
cumulative average dosage was calculated as the total epoetin dosage<br />
received since the start of follow-up divided by the number of weeks<br />
elapsed. The model included covariates for month of follow-up (linear<br />
and quadratic terms) and their product (interaction) terms with the log<br />
epoetin dosage variables (log of zero dose was treated as zero). The<br />
model also included the non–time-varying covariates age (years) at<br />
ESRD onset, race (black, white, or other), gender, underlying cause of<br />
ESRD (diabetes, glomerulonephritis, hypertension, cystic kidney, or<br />
other), US geographic region (Northeast, Southeast, Midwest, or West),<br />
dialysis chain membership (five largest chains and small/nonchain<br />
facilities); hematocrit level (�30, 30 to �33, 33 to �36, 36 to �39, or<br />
�39%), patient weight (�61, 61 to �72, 72 to �84, or �84 kg), Charlson<br />
index score (in four groups, �3 to�6,6to�8, or �8), and presence of<br />
cardiovascular and noncardiovascular comorbidities (15) at the start of<br />
follow-up (cardiovascular comorbidities include cardiac arrest, congestive<br />
heart failure, cerebrovascular disease, cardiac dysrhythmia, pericarditis,<br />
peripheral vascular disease, ischemic heart disease, and myocardial<br />
infarction; noncardiovascular comorbidities include alcohol<br />
dependence, cancer, drug dependence, HIV, AIDS, inability to ambulate,<br />
inability to transfer, chronic obstructive pulmonary disease, tobacco<br />
use, diabetes, currently on insulin, diabetes, primary or contrib-<br />
Page 153<br />
Clin J Am Soc Nephrol 4: 638–644, 2009 Epoetin Dosage and Survival 639<br />
uting), and average monthly intravenous iron administered (obtained<br />
using Healthcare Common Procedure Coding System codes and categorized<br />
in quartiles as �450, 450 to �800, 800 to �1200, or �1200 mg),<br />
cumulative hospital days (0, 0 to �5,5to�10, or �10 d), and average<br />
epoetin dosage and number of administrations during the first 3 mo on<br />
dialysis.<br />
We then plotted the predicted survival under three hypothetical<br />
scenarios: All patients received a cumulative average dosage of (1)<br />
15,000 U/wk, (2) 30,000 U/wk, and (3) 45,000 U/wk. These levels were<br />
selected to represent approximately low, average, and high dosages. To<br />
estimate average HRs during the entire follow-up, we also fitted the<br />
model without interaction terms and with continuous epoetin dosage<br />
replaced by a categorical variable with five levels: 0 to �10,000; 10,000<br />
to �20,000; 20,000 to �30,000; 30,000 to �40,000; and �40,000 U/wk.<br />
We computed conservative 95% CIs by using a robust variance.<br />
Because high epoetin dosages are more likely to be prescribed to<br />
patients with higher mortality risk (e.g., with lower hematocrit) (6), the<br />
estimates from the regression model need to be adjusted for this timedependent<br />
confounding by indication effect. To do so, one could add<br />
the time-varying confounders (e.g., hematocrit) as covariates in the<br />
logistic regression model; however, this standard approach might introduce<br />
bias because hematocrit is affected by previous epoetin treatment<br />
(and might be on the causal pathway between epoetin treatment<br />
and mortality) (16). We therefore used another method to adjust for<br />
time-dependent confounding by indication: Inverse probability weighting.<br />
Unlike the standard approach, inverse probability weighting appropriately<br />
adjusts for measured time-dependent confounders that are<br />
affected by previous epoetin therapy (e.g., previous hematocrit). Formally,<br />
under the assumption that all time-varying predictors of both<br />
epoetin therapy and hematocrit were included in the analysis (as described<br />
in the next paragraph), our weighted model estimates the<br />
parameters of a marginal structural Cox model (17–19) and can be used<br />
to mimic a sequentially randomized trial in which patients were assigned<br />
to different epoetin dosing regimens.<br />
Each patient in the logistic models received a time-varying weight<br />
inversely proportional to the estimated probability of having his or her<br />
own observed epoetin dosage history, as described elsewhere (20).<br />
These weights were estimated by fitting two nested models: A logistic<br />
regression model to estimate each patient’s probability of not receiving<br />
epoetin at any given month (7.3% of the patient-months had zero dose)<br />
and a linear regression model to estimate each patient’s density (assumed<br />
to be normal) of log epoetin dosage among those with nonzero<br />
dose in that month. Both models included the covariates listed already<br />
for the mortality model plus the following time-varying covariates<br />
measured during the previous month: Hematocrit (�24, 24 to �27, 27<br />
to �30, 30 to �33, 33 to �36, 36 to �39, and �39%; most recent<br />
hematocrit levels were carried forward when hematocrit value was<br />
missing), inpatient days (0, 0 to �4,4to�7, �7), iron treatment (yes,<br />
no), and log epoetin dosage (cubic splines with five knots located at 5.5,<br />
9.5, 10.5, 11.5, and 13.5, which correspond to weekly epoetin dosages of<br />
60, 3340, 9100, 24,580, and 182,350 U, respectively). The model also<br />
included product terms between log epoetin dosage spline variables<br />
and time-varying hematocrit and between chains and both baseline<br />
epoetin dosage and time-varying epoetin dosage (because chain characteristics<br />
are associated with epoetin dosing patterns [21]). Inverse<br />
probability weights were also computed to adjust for potential selection<br />
bias as a result of censoring. Both the epoetin and censoring weights<br />
were stabilized and their product was used to fit the weighted regression<br />
model.<br />
Because Medicare does not reimburse separately for epoetin treatment<br />
in the hospital, no data on inpatient use are available. Furthermore,<br />
there are no empirical studies on inpatient epoetin use, and
anecdotal evidence varies<br />
widely regarding how often<br />
and how much epoetin is<br />
prescribed to dialysis inpatients;<br />
however, because patients<br />
with longer hospital<br />
stays might be more likely to<br />
receive some epoetin, we selected<br />
a primary analysis in<br />
which patients with �4 inpatient<br />
days were assumed to<br />
receive the same epoetin dosage<br />
from day 5 onward as<br />
they received during their<br />
most recent preceding outpatient<br />
dialysis period (per<br />
dialysis session). We also conducted<br />
two secondary analyses:<br />
Analysis A, which assumes<br />
that epoetin was given throughout the duration of the hospital<br />
stay, and analysis B, which assumes that epoetin was not given during<br />
a hospital stay, regardless of the duration. All analyses were conducted<br />
with SAS 9.1 (SAS Institute, Cary, NC).<br />
Results<br />
Figure 1 depicts the selection process for the patients who<br />
were included in the analysis. The final cohort consisted of<br />
18,454 patients. The demographics, clinical history, comorbidities,<br />
and baseline anemia management of the study population<br />
are shown in Table 1. The study cohort was 51% men, 69%<br />
white, 47% with diabetes, and 63% with cardiovascular comorbidities.<br />
During the first 3 mo on dialysis, the average weekly<br />
epoetin dosage was �10,000 U in 11% of the patients, 10,000 to<br />
20,000 U in 36%, 20,000 to 30,000 Us in 30%, and �30,000 U in<br />
24%. At the start of follow-up, 83% had a hematocrit �33%,<br />
60% of the patients had a hematocrit �36%, and 35% had a<br />
hematocrit of �39%. During the follow-up, 4105 (22%) patients<br />
died and 4906 (27%) were censored before the end of the study.<br />
The mean of the estimated inverse probability weights was 1.05<br />
(SD 5.2), and the 1st and 99th percentiles were 0.06 and 6.20,<br />
respectively.<br />
Figure 2 shows the estimated survival functions under<br />
three hypothetical dosing levels: 15,000 U/wk, 30,000 U/wk,<br />
and 45,000 U/wk throughout the entire follow-up. Our primary<br />
analysis estimated similar survival at 9 mo for all three<br />
dosage levels. Secondary analyses indicate that survival<br />
probabilities vary depending on assumptions of epoetin use<br />
during hospitalizations. Specifically, the lowest epoetin dosage<br />
(15,000 U/wk) resulted in the highest survival when<br />
assuming that epoetin was used throughout the hospital stay<br />
(analysis A; see supplemental information available online at<br />
http://www.cjasn.org) but in the lowest survival when assuming<br />
that epoetin was not used in hospital at all (analysis<br />
B; see supplemental information available online at http://<br />
www.cjasn.org). The main features of the estimated epoetin<br />
dosage-survival curves were not sensitive to the particular<br />
functional form used for cumulative average dosage (results<br />
did not change when we used cubic splines with knots at<br />
different locations) or to alternative summaries of dosage<br />
Page 154<br />
640 Clinical Journal of the American Society of Nephrology Clin J Am Soc Nephrol 4: 638–644, 2009<br />
Figure 1. Selection of study population from US Renal Data System (USRDS) data.<br />
history (i.e., total cumulative dosage from start of follow-up,<br />
recent and past cumulative average dosage).<br />
Table 2 presents the estimated average HRs during the entire<br />
follow-up from our weighted model under different assumptions<br />
regarding the use of epoetin during hospital stays. These<br />
average HRs are consistent with the survival curves (Figure 2).<br />
The HRs for the two lowest epoetin dosage groups are sensitive<br />
to the assumptions about epoetin use during hospitalizations,<br />
but the HRs for the two highest epoetin dosage group are less<br />
sensitive to these assumptions. In the primary analysis, compared<br />
with a cumulative average dosage of 20,000 to �30,000<br />
U/wk, the HR estimates (95% CI) were 0.91 (0.67 to 1.22) for<br />
�40,000 U/wk, 0.96 (0.76 to 1.21) for 30,000 to �40,000 U/wk,<br />
0.84 (0.67 to 1.05) for 10,000 to �20,000 U/wk, and 0.90 (0.52 to<br />
1.54) for �10,000 U/wk (P � 0.83 for trend).<br />
Our estimates did not materially change (data not shown)<br />
when we used alternative categorizations of hospital days and<br />
hematocrit values, when we expanded our billable service gap<br />
definition from 30 to 60 d, when we did not censor on change<br />
of provider, when we used different knots’ locations for splines<br />
of log epoetin dosage, when the estimated weights were truncated<br />
to a maximum of 20, and when the weights were estimated<br />
under a � distribution for the log of epoetin dosage. We<br />
also tested the effect of using a log scale to compute the cumulative<br />
epoetin dosage. In the primary analysis, compared with<br />
a cumulative average dosage of 20,000 to �30,000 U/wk, use of<br />
the logarithmic scale resulted in HR estimates (95% CI) of 1.15<br />
(0.92 to 1.44) for �40,000 U/wk, 1.06 (0.86 to 1.31) for 30,000 to<br />
�40,000 U/wk, 1.00 (0.83 to 1.20) for 10,000 to �20,000 U/wk,<br />
and 0.81 (0.56 to 1.17) for �10,000 U/wk (P � 0.19 for trend).<br />
Compared with the primary analysis in Figure 2, the 9-mo<br />
survival estimated using the log-transformed dosage was similar<br />
for the lowest dosage group (15,000 U/wk) and 4% lower<br />
for both the middle and higher dosage groups (30,000 and<br />
45,000 U/wk).<br />
For comparison purposes, Table 3 shows the corresponding<br />
estimated HRs from standard unweighted models that include<br />
the measured time-varying confounders as covariates. In both<br />
the primary and secondary analyses, these standard Cox re-
Table 1. Characteristics of study population (n � 18,454) a<br />
Characteristic Value<br />
Patient demographics<br />
race (%)<br />
white 69.4<br />
black 25.3<br />
other/unknown 5.3<br />
age (yr; mean) 75.7<br />
male gender (%) 51.2<br />
Facility characteristics<br />
region (%)<br />
Northeast (networks 1 to 5) 24.0<br />
Southeast (networks 6 to 8, 13, 14) 35.4<br />
Midwest (networks 9 to 12) 23.9<br />
West (networks 15 to 18) 16.6<br />
chain membership (%)<br />
chain 1 30.6<br />
chain 2 14.1<br />
chain 3 15.1<br />
chain 4 8.8<br />
chain 5 3.8<br />
chain 6 2.2<br />
small chain/nonchain 25.4<br />
Patient clinical history (%)<br />
cause of ESRD<br />
diabetes 46.9<br />
hypertension 36.1<br />
glomerulonephritis 5.1<br />
cystic kidney 1.0<br />
other 10.9<br />
body weight (kg)<br />
�61 23.9<br />
61 to �72 25.7<br />
72 to 84 24.3<br />
�84 26.2<br />
Charlson index score b<br />
�3 18.2<br />
3to�6 29.4<br />
6to�8 21.0<br />
�8 31.4<br />
baseline hospitalization (d) b<br />
0 56.1<br />
�5 11.4<br />
5to�10 12.8<br />
�10 19.7<br />
cardiovascular comorbidities (% yes) 63.1<br />
noncardiovascular comorbidities (% yes) 61.4<br />
<strong>Anemia</strong> management practices<br />
receipt of predialysis epoetin (% yes) 35.1<br />
hematocrit level at end of month 3 (%)<br />
�30 6.5<br />
30 to �33 10.5<br />
33 to �36 20.1<br />
36 to �39 27.6<br />
�39 35.3<br />
Table 1. Continued<br />
Page 155<br />
Clin J Am Soc Nephrol 4: 638–644, 2009 Epoetin Dosage and Survival 641<br />
Characteristic Value<br />
epoetin dosage administered (U/wk) b<br />
�10,000 9.8<br />
10,000 to �20,000 34.5<br />
20,000 to �30,000 30.5<br />
30,000 to �40,000 14.5<br />
�40,000 10.6<br />
Average iron administered (mg/mo) b<br />
�450 20.2<br />
450 to �800 19.4<br />
800 to �1200 24.6<br />
�1200 35.8<br />
a All variables in Table 1 were adjusted for in the survival<br />
analyses. Unless otherwise noted, all variables were collected<br />
at study entry.<br />
b First 3 mo of dialysis therapy.<br />
Figure 2. Survival probabilities for three hypothetical regimens:<br />
Low dosage (15,000 U/wk), medium dosage (30,000 U/wk),<br />
and high dosage (45,000 U/wk).<br />
gression models suggest that mortality risk increases with epoetin<br />
dosage.<br />
Discussion<br />
We used data from an elderly hemodialysis population to<br />
answer the question, “What would be the survival if every<br />
patient were to receive the same epoetin dosage during the<br />
entire follow-up?” We found no indication of a harmful effect<br />
of higher epoetin dosages on survival during months 4 through<br />
12 after dialysis initiation among patients aged �65 yr, who<br />
comprise 50% of the patients with newly diagnosed ESRD and<br />
one third of the prevalent hemodialysis population.
Table 2. Cumulative average epoetin dosage and mortality HRs for weighted regression models a<br />
U/wk<br />
Patient-<br />
Months<br />
No. of<br />
Deaths<br />
%<br />
Deaths<br />
Our finding of no harmful effect of high dosages is unlikely<br />
to be explained by unmeasured confounding by indication,<br />
because better confounder measurement (e.g., more frequent<br />
hematocrit measurements or information on other prognostic<br />
factors such as nutritional status, BP, or inflammatory state)<br />
would be expected to result in effect estimates that are further<br />
from a harmful effect because patients who receive higher<br />
dosages tend to be those with more severe disease.<br />
The concern about the relationship between high epoetin<br />
dosages and mortality has been raised by the seeming paradox<br />
between the association of higher hematocrit levels with better<br />
survival found in observational studies (3–7) and the adverse<br />
effects of targeting higher hematocrit levels found in randomized<br />
clinical trials (1,2). Because in observational studies higher<br />
hematocrit levels are associated with lower epoetin dosages,<br />
whereas in randomized trials the group assigned to higher<br />
hematocrit targets receives higher epoetin dosages, some ob-<br />
Primary Analysis Secondary Analysis A Secondary Analysis B<br />
HR 95% CI HR 95% CI HR 95% CI<br />
�10,000 41,113 776 1.9 0.90 0.52 to 1.54 0.56 0.38 to 0.82 1.21 0.79 to 1.83<br />
10,000 to �20,000 45,251 1111 2.5 0.84 0.67 to 1.05 0.84 0.65 to 1.09 1.12 0.82 to 1.55<br />
20,000 to �30,000<br />
(reference<br />
group)<br />
20,682 722 3.5 Reference Reference Reference<br />
30,000 to �40,000 9070 390 4.3 0.96 0.76 to 1.21 0.99 0.82 to 1.21 0.95 0.69 to 1.30<br />
�40,000 9708 499 5.1 0.91 0.67 to 1.22 1.04 0.84 to 1.29 0.88 0.68 to 1.14<br />
Total 125,824 3498 2.8<br />
a The weighted models include baseline covariates (age, race, gender, underlying cause of ESRD, geographic region, Charlson<br />
index score, cardiovascular and noncardiovascular comorbidities, baseline hematocrit, average intravenous iron administered,<br />
length of inpatient stays in the baseline, and average epoetin dosage and number of administrations at baseline). Variables in<br />
the models to estimate weights include baseline covariates as listed above plus time-varying covariates including hematocrit,<br />
inpatient days, iron treatment, log epoetin dosage, and interaction terms between log epoetin dosage and time-varying<br />
hematocrit and between chains and both baseline epoetin dosage and time-varying epoetin dosage. Primary analysis: Epoetin<br />
was imputed for patients with a hospital stay �4 d on the basis of the previous outpatient epoetin prescription; secondary<br />
analysis A: Epoetin was imputed throughout duration of hospital stay; secondary analysis B: Epoetin was assumed not to be<br />
administered during hospital stay. Distribution of patient-months, number of deaths, and percentage death are based on<br />
primary analysis.<br />
Table 3. Cumulative average epoetin dosage and mortality HRs from standard (unweighted) regression models a<br />
U/wk<br />
Page 156<br />
642 Clinical Journal of the American Society of Nephrology Clin J Am Soc Nephrol 4: 638–644, 2009<br />
Primary Analysis Secondary Analysis A Secondary Analysis B<br />
HR 95% CI HR 95% CI HR 95% CI<br />
�10,000 0.73 0.65 to 0.83 0.70 0.62 to 0.79 0.85 0.75 to 0.96<br />
10,000 to �20,000 0.82 0.74 to 0.91 0.80 0.72 to 0.88 0.89 0.80 to 0.99<br />
20,000 to �30,000<br />
(reference group)<br />
Reference Reference Reference<br />
30,000 to �40,000 1.16 1.02 to 1.33 1.09 0.95 to 1.24 1.11 0.96 to 1.28<br />
�40,000 1.26 1.10 to 1.44 1.26 1.10 to 1.43 1.27 1.10 to 1.46<br />
a The standard regression models include baseline covariates (age, race, gender, underlying cause of ESRD, geographic<br />
region, Charlson index score, cardiovascular and noncardiovascular comorbidities, baseline hematocrit, average intravenous<br />
iron administered, length of inpatient stays in the baseline, and average epoetin dosage and number of administrations at<br />
baseline) and time-varying covariates (previous month’s hematocrit, iron treatment, and length of hospital stay).<br />
servers have suggested that mortality might be related to epoetin<br />
dosage rather than achieved hematocrit level. In fact, several<br />
extrahematopoietic effects of epoetin administration,<br />
particularly worsening of hypertension, might account for an<br />
increased mortality as a result of higher epoetin dosages (22);<br />
however, all studies that suggested increased mortality with<br />
higher epoetin dosages (3,4,5,7), including our own (6), and a<br />
recent secondary analysis of a randomized trial (10) used<br />
standard adjustment techniques. (Another study found that<br />
the estimates were sensitive to modeling assumptions [23].)<br />
These analyses might not have appropriately adjusted for<br />
time-varying confounders that are affected by past epoetin<br />
use and that might be on the causal pathway between epoetin<br />
use and mortality. These confounders include hematocrit<br />
level (the major determinant of epoetin dosage in clinical<br />
practice) and previous hospitalization (a key prognostic factor<br />
for death). In this study, we confirm the previous observations
that higher epoetin dosages are associated with increased mortality<br />
when using standard adjustment techniques but were<br />
unable to show a harmful association between high epoetin<br />
dosage and mortality when we used inverse probability<br />
weighting to adjust for measured time-varying confounders.<br />
A limitation of our study is the lack of data on epoetin use<br />
during hospitalizations. Our analysis suggests that the estimated<br />
survival at lower epoetin dosages is quite sensitive to<br />
assumptions regarding epoetin use in the hospital. Future studies<br />
that provide more details regarding inpatient epoetin use<br />
are needed to determine the mortality risk associated with low<br />
epoetin dosages; however, regardless of the uncertainty for<br />
mortality under low epoetin dosages, we did not find strong<br />
support for an effect, either harmful or beneficial, of high<br />
epoetin dosages on survival.<br />
The results of our study may not be generalizable to patients<br />
other than those included in the analysis, who were �65 yr,<br />
incident to dialysis and survived the first 90 d of dialysis, and<br />
are dialyzed in free-standing facilities. Furthermore, our analysis<br />
included only limited center-specific attributes (profit and<br />
chain status), and center effects may be associated with epoetin<br />
dosing as well as mortality.<br />
Our findings address but do not fully resolve the seeming<br />
paradox between observational studies and RCTs regarding<br />
the effect of hematocrit on mortality. The discrepancy might<br />
be explained by a modification of the effect of high epoetin<br />
dosages by patient characteristics, which differ for patients<br />
who are included in observational studies compared with<br />
those who are included in RCTs: One of the RCTs enrolled<br />
patients who had chronic kidney disease and were not on<br />
dialysis, and the other included prevalent hemodialysis patients<br />
with underlying cardiovascular disease. Additional<br />
appropriately adjusted analyses of observational databases,<br />
as well as randomized clinical trials, are necessary to understand<br />
the relationship among epoetin, hematocrit, and survival<br />
and help design treatment algorithms that maximize<br />
benefit.<br />
Disclosures<br />
All authors participated in the design, analysis, interpretation, writing,<br />
and/or editing of this study and have seen and approved the final<br />
version. Y.Z. had full access to all of the data in the study and had final<br />
responsibility for the decision to submit for publication.<br />
J.K. has served as a consultant and receives financial support from<br />
<strong>Amgen</strong> and F. Hoffman-La Roche.<br />
Acknowledgments<br />
This project was funded in part by National Institutes of Health<br />
grants R01-DK066011-01A2 and R01-HL080644-01. The National Institutes<br />
of Health had no role in the study design; in the collection,<br />
analysis, and interpretation of data; in the writing of the report; and in<br />
the decision to submit the paper for publication. The data reported here<br />
have been supplied by the US Renal Data System. The interpretation<br />
and reporting of these data are the responsibility of the authors and in<br />
no way should be seen as the official policy or interpretation of the US<br />
government.<br />
Page 157<br />
Clin J Am Soc Nephrol 4: 638–644, 2009 Epoetin Dosage and Survival 643<br />
References<br />
1. Besarab A, Bolton WK, Browne JK, Egrie JC, Nissenson AR,<br />
Okamoto DM, Schwab SJ, Goodkin DA: The effects of<br />
normal as compared with low hematocrit values in patients<br />
with cardiac disease who are receiving hemodialysis<br />
and epoetin. N Engl J Med 339: 584–590, 1988<br />
2. Singh AK, Szczech L, Tang KL, Barnhart H, Sapp S, Wolfson<br />
M, Reddan D, CHOIR Investigators: Correction of<br />
anemia with epoetin alfa in chronic kidney disease. N Engl<br />
J Med 355: 2085–2098, 2006<br />
3. Collins AJ, Li S, St Peter W, Ebben J, Roberts T, Ma JZ,<br />
Manning W: Death, hospitalization, and economic associations<br />
among incident hemodialysis patients with hematocrit<br />
values of 36 to 39%. J Am Soc Nephrol 12: 2465–2473,<br />
2001<br />
4. Lowrie EG, Huang WH, Lew NL, Liu Y: The relative<br />
contribution of measured variables to death risk among<br />
hemodialysis patients. In: Death on Hemodialysis, edited<br />
by Friedman EA, Dordrecht, Kluwer Academic Publishers,<br />
1994, pp 121–141<br />
5. Ma JZ, Ebben J, Xia H, Collins AJ: Hematocrit level and<br />
associated mortality in hemodialysis patients. J Am Soc<br />
Nephrol 10: 610–619, 1999<br />
6. Zhang Y, Thamer M, Stefanik K, Kaufman J, Cotter DJ:<br />
Epoetin requirements predict mortality in hemodialysis<br />
patients. Am J Kidney Dis 44: 866–876, 2004<br />
7. Madore F, Lowrie EG, Brugnara C, Lew NL, Lazarus JM,<br />
Bridges K, Owen WF: <strong>Anemia</strong> in hemodialysis patients:<br />
Variables affecting this outcome predictor. J Am Soc Nephrol<br />
8: 1921–1929, 1997<br />
8. Strippoli GF, Tognoni G, Navaneethan SD, Nicolucci A,<br />
Craig JC: Haemoglobin targets: We were wrong, time to<br />
move on. Lancet 369: 346–350, 2007<br />
9. Busko M: Higher haemoglobin targets linked to increased<br />
mortality risk in CKD patients with anemia, February 5,<br />
2007, Available at: http://www.medscape.com/viewarticle/<br />
551687. Accessed May 22, 2008<br />
10. Szczech LA, Barnhart HX, Inrig JK, Reddan DN, Sapp S,<br />
Califf RM, Patel UD, Singh AK: Secondary analysis of the<br />
CHOIR trial epoetin-alpha dose and achieved hemoglobin<br />
outcomes. Kidney Int 74: 791–798, 2008<br />
11. EPO & DPO Use by Provider, Figure 5.39. In: US Renal Data<br />
System, USRDS 2006 Annual Data Report: Atlas of End-Stage<br />
Renal Disease in the United States, Bethesda, National Institutes<br />
of Health, National Institute of Diabetes and Digestive<br />
and Kidney Diseases, 2006. Available at: http://www.<br />
usrds.org/2006/pdf/05_clin_ind_prev_hlth_06.pdf. Accessed<br />
January 31, 2008<br />
12. Henke M, Laszig R, Rube C, Schäfer U, Haase KD,<br />
Schilcher B, Mose S, Beer KT, Burger U, Dougherty C,<br />
Frommhold H: Erythropoietin to treat head and neck cancer<br />
patients with anemia undergoing radiotherapy. Lancet<br />
362: 1255–1260, 2003<br />
13. Leyland-Jones B; BEST investigators: Breast cancer trial<br />
with erythropoietin terminated unexpectedly. Lancet 4:<br />
459–460, 2003<br />
14. Ifudu O, Mathew JJ, Mayers JD, Macey LJ, Brezsnyak W,<br />
Reydel C, McClendon E, Surgrue T, Rao S, Friedman EA:<br />
Severity of AIDS and response to EPO in uremia. Am J<br />
Kidney Dis 30: 28–35, 1997<br />
15. Frankenfield DL, Roman SH, Rocco MV, Bedinger MR,
644 Clinical Journal of the American Society of Nephrology Clin J Am Soc Nephrol 4: 638–644, 2009<br />
McClellan WM: Disparity in outcomes for adult Native<br />
American hemodialysis patients? Findings from the ESRD<br />
clinical performance measures project, 1996 to 1999. Kidney<br />
Int 65: 1426–1434, 2004<br />
16. Hernán MA, Hernandez-Diaz S, Robins JM: A structural<br />
approach to selection bias. Epidemiology 15: 615–625, 2004<br />
17. Robins JM, Hernán MA, Brumback B: Marginal structural<br />
models and causal inference in epidemiology. Epidemiology<br />
11: 550–560, 2000<br />
18. Hernán MA, Brumback B, Robins JM: Marginal structural<br />
models to estimate the causal effect of zidovudine on the<br />
survival of HIV-positive men. Epidemiology 11: 561–570,<br />
2000<br />
19. Hernán MA, Brumback B, Robins JM: Estimating the<br />
causal effect of zidovudine on CD4 count with a marginal<br />
structural model for repeated measures. Stat Med 21: 1689–<br />
1709, 2002<br />
20. Cotter D, Zhang Y, Thamer M, Kaufman J, Hernán M: The<br />
effect of epoetin dose on hematocrit. Kidney Int 73: 347–353,<br />
2008<br />
21. Thamer M, Zhang Y, Kaufman J, Cotter D, Hernán MA:<br />
Dialysis facility ownership and epoetin dosing in patients<br />
receiving hemodialysis. JAMA 297: 1667–1674, 2007<br />
22. Vaziri ND: Cardiovascular effects of erythropoietin and<br />
anemia correction. Curr Opin Nephrol Hypertens 10: 633–<br />
637, 2001<br />
23. Bradbury BD, Wang O, Critchlow CW, Rothman KJ, Heagerty<br />
P, Keen M, Acquavella JF: Exploring relative mortality<br />
and epoetin alfa dose among hemodialysis patients.<br />
Am J Kidney Dis 51: 62–70, 2008<br />
Access to UpToDate on-line is available for additional clinical information<br />
at http://www.cjasn.org/<br />
Page 158
Technical Appendix 3 – PI for Aranesp and EPOGEN<br />
Technical Appendix 3 – PI for Aranesp and EPOGEN<br />
Page 159
Aranesp ®<br />
(darbepoetin alfa)<br />
For Injection<br />
WARNINGS: INCREASED MORTALITY, SERIOUS CARDIOVASCULAR EVENTS,<br />
THROMBOEMBOLIC EVENTS, STROKE and INCREASED RISK OF TUMOR PROGRESSION OR<br />
RECURRENCE<br />
Chronic Renal Failure:<br />
Page 160<br />
• In clinical studies, patients experienced greater risks for death, serious cardiovascular events,<br />
and stroke when administered erythropoiesis-stimulating agents (ESAs) to target hemoglobin<br />
levels of 13 g/dL and above.<br />
• Individualize dosing to achieve and maintain hemoglobin levels within the range of 10 to 12<br />
g/dL.<br />
Cancer:<br />
• ESAs shortened overall survival and/or increased the risk of tumor progression or recurrence<br />
in some clinical studies in patients with breast, non-small cell lung, head and neck, lymphoid,<br />
and cervical cancers (see WARNINGS: Table 1).<br />
• To decrease these risks, as well as the risk of serious cardio- and thrombovascular events,<br />
use the lowest dose needed to avoid red blood cell transfusion.<br />
• Because of these risks, prescribers and hospitals must enroll in and comply with the ESA<br />
APPRISE Oncology Program to prescribe and/or dispense Aranesp ® to patients with cancer.<br />
To enroll in the ESA APPRISE Oncology Program, visit www.esa-apprise.com or call 1-866-<br />
284-8089 for further assistance.<br />
• Use ESAs only for treatment of anemia due to concomitant myelosuppressive chemotherapy.<br />
• ESAs are not indicated for patients receiving myelosuppressive therapy when the anticipated<br />
outcome is cure.<br />
• Discontinue following the completion of a chemotherapy course.<br />
(See WARNINGS: Increased Mortality, Serious Cardiovascular Events, Thromboembolic Events,<br />
and Stroke, WARNINGS: Increased Mortality and/or Increased Risk of Tumor Progression or<br />
Recurrence, INDICATIONS AND USAGE, and DOSAGE AND ADMINISTRATION.)<br />
DESCRIPTION<br />
Aranesp ® is an erythropoiesis stimulating protein, closely related to erythropoietin, that is produced in<br />
Chinese hamster ovary (CHO) cells by recombinant DNA technology. Aranesp ® is a 165-amino acid<br />
protein that differs from recombinant human erythropoietin in containing 5 N-linked oligosaccharide<br />
chains, whereas recombinant human erythropoietin contains 3 chains. 1 The two additional N-glycosylation<br />
sites result from amino acid substitutions in the erythropoietin peptide backbone. The additional<br />
carbohydrate chains increase the approximate molecular weight of the glycoprotein from 30,000 to<br />
37,000 daltons. Aranesp ® is formulated as a sterile, colorless, preservative-free protein solution for<br />
intravenous or subcutaneous administration.<br />
Single-dose vials are available containing 25, 40, 60, 100, 150, 200, 300, or 500 mcg of Aranesp ® .<br />
1
Page 161<br />
Single-dose prefilled syringes and prefilled SureClick autoinjectors are available containing 25, 40,<br />
60, 100, 150, 200, 300, or 500 mcg of Aranesp ® . Each prefilled syringe is equipped with a needle guard<br />
that covers the needle during disposal.<br />
Single-dose vials, prefilled syringes and autoinjectors are available in two formulations that contain<br />
excipients as follows:<br />
Polysorbate solution Each 1 mL contains 0.05 mg polysorbate 80, and is formulated at pH 6.2 ±<br />
0.2 with 2.12 mg sodium phosphate monobasic monohydrate, 0.66 mg sodium phosphate dibasic<br />
anhydrous, and 8.18 mg sodium chloride in Water for Injection, USP (to 1 mL).<br />
Albumin solution Each 1 mL contains 2.5 mg albumin (human), and is formulated at pH 6.0 ±<br />
0.3 with 2.23 mg sodium phosphate monobasic monohydrate, 0.53 mg sodium phosphate dibasic<br />
anhydrous, and 8.18 mg sodium chloride in Water for Injection, USP (to 1 mL).<br />
CLINICAL PHARMACOLOGY<br />
Mechanism of Action<br />
Aranesp ® stimulates erythropoiesis by the same mechanism as endogenous erythropoietin. A primary<br />
growth factor for erythroid development, erythropoietin is produced in the kidney and released into the<br />
bloodstream in response to hypoxia. In responding to hypoxia, erythropoietin interacts with progenitor<br />
stem cells to increase red blood cell (RBC) production. Production of endogenous erythropoietin is<br />
impaired in patients with chronic renal failure (CRF), and erythropoietin deficiency is the primary cause of<br />
their anemia. Increased hemoglobin levels are not generally observed until 2 to 6 weeks after initiating<br />
treatment with Aranesp ® (see DOSAGE AND ADMINISTRATION). In patients with cancer receiving<br />
concomitant chemotherapy, the etiology of anemia is multifactorial.<br />
Pharmacokinetics<br />
Adult Patients<br />
The pharmacokinetics of Aranesp ® were studied in patients with CRF receiving or not receiving dialysis<br />
and cancer patients receiving chemotherapy.<br />
Following intravenous administration in CRF patients receiving dialysis, Aranesp ® serum concentrationtime<br />
profiles were biphasic, with a distribution half-life of approximately 1.4 hours and a mean terminal<br />
half-life of 21 hours. The terminal half-life of Aranesp ® was approximately 3-fold longer than that of<br />
Epoetin alfa when administered intravenously.<br />
Following subcutaneous administration of Aranesp ® to CRF patients (receiving or not receiving dialysis),<br />
absorption was slow and peak concentrations occurred at 48 hours (range: 12 to 72 hours). In CRF<br />
patients receiving dialysis, the average half-life was 46 hours (range: 12 to 89 hours), and in CRF patients<br />
not receiving dialysis, the average half-life was 70 hours (range: 35 to 139 hours). Aranesp ® apparent<br />
clearance was approximately 1.4 times faster on average in patients receiving dialysis compared to<br />
patients not receiving dialysis. The bioavailability of Aranesp ® in CRF patients receiving dialysis after<br />
subcutaneous administration was 37% (range: 30% to 50%).<br />
Following the first subcutaneous dose of 6.75 mcg/kg (equivalent to 500 mcg for a 74-kg patient) in<br />
patients with cancer, the mean terminal half-life was 74 hours (range: 24 to 144 hours). Peak<br />
concentrations were observed at 90 hours (range: 71 to 123 hours) after a dose of 2.25 mcg/kg, and 71<br />
hours (range: 28 to 120 hours) after a dose of 6.75 mcg/kg. When administered on a once every 3 week<br />
schedule, 48-hour post-dose Aranesp ® levels after the fourth dose were similar to those after the first<br />
dose.<br />
Over the dose range of 0.45 to 4.5 mcg/kg Aranesp ® administered intravenously or subcutaneously on a<br />
once weekly schedule and 4.5 to 15 mcg/kg administered subcutaneously on a once every 3 week<br />
schedule, systemic exposure was approximately proportional to dose. No evidence of accumulation was<br />
observed beyond an expected < 2-fold increase in blood levels when compared to the initial dose.<br />
2
Pediatric Patients<br />
Aranesp ® pharmacokinetics were studied in 12 pediatric CRF patients (age 3-16 years) receiving or not<br />
receiving dialysis. Following a single intravenous or subcutaneous Aranesp ® dose, Cmax and half-life<br />
were similar to those obtained in adult CRF patients on dialysis. Following a single subcutaneous dose,<br />
the average bioavailability was 54% (range: 32% to 70%), which was higher than that obtained in adult<br />
CRF patients on dialysis.<br />
CLINICAL STUDIES<br />
Throughout this section of the package insert, the Aranesp ® study numbers associated with the<br />
nephrology and cancer clinical programs are designated with the letters “N” and “C”, respectively.<br />
Chronic Renal Failure Patients<br />
The safety and effectiveness of Aranesp ® have been assessed in a number of multicenter studies. Two<br />
studies evaluated the safety and efficacy of Aranesp ® for the correction of anemia in adult patients with<br />
CRF, and three studies (2 in adults and 1 in pediatric patients) assessed the ability of Aranesp ® to<br />
maintain hemoglobin concentrations in patients with CRF who had been receiving other recombinant<br />
erythropoietins.<br />
De Novo Use of Aranesp ®<br />
Once Weekly Aranesp ® Starting Dose<br />
Page 162<br />
In two open-label studies, Aranesp ® or Epoetin alfa was administered for the correction of anemia in CRF<br />
patients who had not been receiving prior treatment with exogenous erythropoietin. Study N1 evaluated<br />
CRF patients receiving dialysis; Study N2 evaluated patients not requiring dialysis. In both studies, the<br />
starting dose of Aranesp ® was 0.45 mcg/kg administered once weekly. The starting dose of Epoetin alfa<br />
was 50 Units/kg 3 times weekly in Study N1 and 50 Units/kg twice weekly in Study N2. When necessary,<br />
dosage adjustments were instituted to maintain hemoglobin in the study target range of 11 to 13 g/dL.<br />
(Note: The recommended hemoglobin target is lower than the target range of these studies. See<br />
DOSAGE AND ADMINISTRATION for recommended clinical hemoglobin target.) The primary efficacy<br />
endpoint was the proportion of patients who experienced at least a 1 g/dL increase in hemoglobin<br />
concentration to a level of at least 11 g/dL by 20 weeks (Study N1) or 24 weeks (Study N2). The studies<br />
were designed to assess the safety and effectiveness of Aranesp ® but not to support conclusions<br />
regarding comparisons between the two products.<br />
In Study N1, the hemoglobin target was achieved by 72% (95% CI: 62%, 81%) of the 90 patients treated<br />
with Aranesp ® and 84% (95% CI: 66%, 95%) of the 31 patients treated with Epoetin alfa. The mean<br />
increase in hemoglobin over the initial 4 weeks of Aranesp ® treatment was 1.1 g/dL (95% CI: 0.82 g/dL,<br />
1.37 g/dL).<br />
In Study N2, the primary efficacy endpoint was achieved by 93% (95% CI: 87%, 97%) of the 129 patients<br />
treated with Aranesp ® and 92% (95% CI: 78%, 98%) of the 37 patients treated with Epoetin alfa. The<br />
mean increase in hemoglobin from baseline through the initial 4 weeks of Aranesp ® treatment was<br />
1.38 g/dL (95% CI: 1.21 g/dL, 1.55 g/dL).<br />
Once Every 2 Week Aranesp ® Starting Dose<br />
In two single arm studies (N3 and N4), Aranesp ® was administered for the correction of anemia in CRF<br />
patients not receiving dialysis. In both studies, the starting dose of Aranesp ® was 0.75 mcg/kg<br />
administered once every 2 weeks.<br />
In Study N3 (study duration of 18 weeks), the hemoglobin goal (hemoglobin concentration ≥ 11 g/dL) was<br />
achieved by 92% (95% CI: 86%, 96%) of the 128 patients treated with Aranesp ® .<br />
In Study N4 (study duration of 24 weeks), the hemoglobin goal (hemoglobin concentration of 11-13 g/dL)<br />
was achieved by 85% (95% CI: 77%, 93%) of the 75 patients treated with Aranesp ® .<br />
3
Page 163<br />
Conversion From Other Recombinant Erythropoietins<br />
Two adult studies (N5 and N6) and one pediatric study (N7) were conducted in patients with CRF who<br />
had been receiving other recombinant erythropoietins. The studies compared the abilities of Aranesp ®<br />
and other erythropoietins to maintain hemoglobin concentrations within a study target range of 9 to<br />
13 g/dL in adults and 10 to 12.5 g/dL in pediatric patients. (Note: The recommended hemoglobin target<br />
is lower than the target range of these studies. See DOSAGE AND ADMINISTRATION for<br />
recommended clinical hemoglobin target.) CRF patients who had been receiving stable doses of other<br />
recombinant erythropoietins were randomized to Aranesp ® , or to continue with their prior erythropoietin at<br />
the previous dose and schedule. For patients randomized to Aranesp ® , the initial weekly dose was<br />
determined on the basis of the previous total weekly dose of recombinant erythropoietin.<br />
Adult Patients<br />
Study N5 was a double-blind study conducted in North America, in which 169 hemodialysis patients were<br />
randomized to treatment with Aranesp ® and 338 patients continued on Epoetin alfa. Study N6 was an<br />
open-label study conducted in Europe and Australia in which 347 patients were randomized to treatment<br />
with Aranesp ® and 175 patients were randomized to continue on Epoetin alfa or Epoetin beta. Of the<br />
347 patients randomized to Aranesp ® , 92% were receiving hemodialysis and 8% were receiving<br />
peritoneal dialysis.<br />
In Study N5, a median weekly dose of 0.53 mcg/kg Aranesp ® (25th, 75th percentiles: 0.30, 0.93 mcg/kg)<br />
was required to maintain hemoglobin in the study target range. In Study N6, a median weekly dose of<br />
0.41 mcg/kg Aranesp ® (25th, 75th percentiles: 0.26, 0.65 mcg/kg) was required to maintain hemoglobin in<br />
the study target range.<br />
Pediatric Patients<br />
Study N7 was an open-label, randomized study, conducted in the United States in pediatric patients from<br />
1 to 18 years of age with CRF receiving or not receiving dialysis. Patients that were stable on Epoetin alfa<br />
were randomized to receive either darbepoetin alfa (n = 82) administered once weekly (subcutaneously or<br />
intravenously) or to continue receiving Epoetin alfa (n = 42) at the current dose, schedule, and route of<br />
administration. A median weekly dose of 0.41 mcg/kg Aranesp ® (25th, 75th percentiles: 0.25, 0.82<br />
mcg/kg) was required to maintain hemoglobin in the study target range.<br />
Cancer Patients Receiving Chemotherapy<br />
Efficacy in patients with anemia due to concomitant chemotherapy was demonstrated based on reduction<br />
in the requirement for RBC transfusions.<br />
Once Weekly Dosing<br />
The safety and effectiveness of Aranesp ® in reducing the requirement for RBC transfusions in patients<br />
undergoing chemotherapy was assessed in a randomized, placebo-controlled, double-blind, multinational<br />
study (C1). This study was conducted in anemic (Hgb ≤ 11 g/dL) patients with advanced, small cell or<br />
non-small cell lung cancer, who received a platinum-containing chemotherapy regimen. Patients were<br />
randomized to receive Aranesp ® 2.25 mcg/kg (n = 156) or placebo (n = 158) administered as a single<br />
weekly SC injection for up to 12 weeks. The dose was escalated to 4.5 mcg/kg/week at week 6, in<br />
subjects with an inadequate response to treatment, defined as less than 1 g/dL hemoglobin increase.<br />
There were 67 patients in the Aranesp ® arm who had their dose increased from 2.25 to 4.5 mcg/kg/week,<br />
at any time during the treatment period.<br />
Efficacy was determined by a reduction in the proportion of patients who were transfused over the 12week<br />
treatment period. A significantly lower proportion of patients in the Aranesp ® arm, 26% (95% CI:<br />
20%, 33%) required transfusion compared to 60% (95% CI: 52%, 68%) in the placebo arm (Kaplan-Meier<br />
estimate of proportion; p < 0.001 by Cochran–Mantel-Haenszel test). Of the 67 patients who received a<br />
dose increase, 28% had a 2 g/dL increase in hemoglobin over baseline, generally occurring between<br />
weeks 8 to 13. Of the 89 patients who did not receive a dose increase, 69% had a 2 g/dL increase in<br />
4
hemoglobin over baseline, generally occurring between weeks 6 to 13. On-study deaths occurred in 14%<br />
(22/156) of patients treated with Aranesp ® and 12% (19/158) of the placebo-treated patients.<br />
Once Every 3 Week Dosing<br />
The safety and effectiveness of once every 3 week Aranesp ® therapy in reducing the requirement for red<br />
blood cell (RBC) transfusions in patients undergoing chemotherapy was assessed in a randomized,<br />
double-blind, multinational study (C2). This study was conducted in anemic (Hgb < 11 g/dL) patients with<br />
non-myeloid malignancies receiving multicycle chemotherapy. Patients were randomized to receive<br />
Aranesp ® at 500 mcg once every 3 weeks (n = 353) or 2.25 mcg/kg (n = 352) administered weekly as a<br />
subcutaneous injection for up to 15 weeks. In both groups, the dose was reduced by 40% of the previous<br />
dose (e.g., for first dose reduction, to 300 mcg in the once every 3 week group and 1.35 mcg/kg in the<br />
once weekly group) if hemoglobin increased by more than 1 g/dL in a 14-day period. Study drug was<br />
withheld if hemoglobin exceeded 13 g/dL. In the once every 3 week group, 254 patients (72%) required<br />
dose reductions (median time to first reduction at 6 weeks). In the once weekly group, 263 patients (75%)<br />
required dose reductions (median time to first reduction at 5 weeks).<br />
Efficacy was determined by a comparison of the Kaplan-Meier estimates of the proportion of patients who<br />
received at least one RBC transfusion between day 29 and the end of treatment. Three hundred thirtyfive<br />
patients in the once every 3 week group and 337 patients in the once weekly group remained on<br />
study through or beyond day 29 and were evaluated for efficacy. Twenty-seven percent (95% CI: 22%,<br />
32%) of patients in the once every 3 week group and 34% (95% CI: 29%, 39%) in the weekly group<br />
required a RBC transfusion. The observed difference in the transfusion rates (once every 3 week-once<br />
weekly) was -6.7% (95% CI: -13.8%, 0.4%).<br />
INDICATIONS AND USAGE<br />
<strong>Anemia</strong> With Chronic Renal Failure<br />
Aranesp ® is indicated for the treatment of anemia associated with chronic renal failure, including patients<br />
on dialysis and patients not on dialysis.<br />
<strong>Anemia</strong> With Non-Myeloid Malignancies Due to Chemotherapy<br />
Aranesp ® is indicated for the treatment of anemia due to the effect of concomitantly administered<br />
chemotherapy based on studies that have shown a reduction in the need for RBC transfusions in patients<br />
with metastatic, non-myeloid malignancies. Studies to determine whether Aranesp ® increases mortality<br />
or decreases progression-free/recurrence-free survival are ongoing.<br />
• Aranesp ® is not indicated for use in patients receiving hormonal agents, therapeutic biologic<br />
products, or radiotherapy unless receiving concomitant myelosuppressive chemotherapy.<br />
• Aranesp ® is not indicated for patients receiving myelosuppressive therapy when the anticipated<br />
outcome is cure due to the absence of studies that adequately characterize the impact of<br />
Aranesp ® on progression-free and overall survival (see WARNINGS: Increased Mortality and/or<br />
Increased Risk of Tumor Progression or Recurrence).<br />
• Aranesp ® use has not been demonstrated in controlled clinical trials to improve symptoms of<br />
anemia, quality of life, fatigue, or patient well-being.<br />
CONTRAINDICATIONS<br />
Aranesp ® is contraindicated in patients with:<br />
• uncontrolled hypertension<br />
• known hypersensitivity to the active substance or any of the excipients<br />
Page 164<br />
5
WARNINGS<br />
Increased Mortality, Serious Cardiovascular Events, Thromboembolic Events, and Stroke<br />
Page 165<br />
Patients with chronic renal failure experienced greater risks for death, serious cardiovascular events, and<br />
stroke when administered erythropoiesis-stimulating agents (ESAs) to target hemoglobin levels of 13 g/dL<br />
and above in clinical studies. Patients with chronic renal failure and an insufficient hemoglobin response<br />
to ESA therapy may be at even greater risk for cardiovascular events and mortality than other patients.<br />
Aranesp ® and other ESAs increased the risks for death and serious cardiovascular events in controlled<br />
clinical trials of patients with cancer. These events included myocardial infarction, stroke, congestive<br />
heart failure, and hemodialysis vascular access thrombosis. A rate of hemoglobin rise of > 1 g/dL over 2<br />
weeks may contribute to these risks.<br />
In a randomized prospective trial, 1432 anemic chronic renal failure patients who were not undergoing<br />
dialysis were assigned to Epoetin alfa (rHuEPO) treatment targeting a maintenance hemoglobin<br />
concentration of 13.5 g/dL or 11.3 g/dL. A major cardiovascular event (death, myocardial infarction,<br />
stroke, or hospitalization for congestive heart failure) occurred among 125 (18%) of the 715 patients in<br />
the higher hemoglobin group compared to 97 (14%) among the 717 patients in the lower hemoglobin<br />
group [Hazard Ratio (HR) 1.3, 95% CI: 1.0, 1.7, p = 0.03]. 2<br />
In a randomized, double-blind, placebo-controlled study of 4038 patients, there was an increased risk of<br />
stroke when Aranesp ® was administered to patients with anemia, type 2 diabetes, and CRF who were not<br />
on dialysis. Patients were randomized to Aranesp ® treatment targeted to a hemoglobin level of 13 g/dL or<br />
to placebo. Placebo patients received Aranesp ® only if their hemoglobin levels were less than 9 g/dL. A<br />
total of 101 patients receiving Aranesp ® experienced stroke compared to 53 patients receiving placebo<br />
(5% vs. 2.6%; HR 1.92, 95% CI: 1.38, 2.68; p < 0.001).<br />
Increased risk for serious cardiovascular events was also reported from a randomized, prospective trial of<br />
1265 hemodialysis patients with clinically evident cardiac disease (ischemic heart disease or congestive<br />
heart failure). In this trial, patients were assigned to Epoetin alfa treatment targeted to a maintenance<br />
hemoglobin of either 14 ± 1 g/dL or 10 ± 1 g/dL. 3 Higher mortality (35% vs. 29%) was observed in the<br />
634 patients randomized to a target hemoglobin of 14 g/dL than in the 631 patients assigned a target<br />
hemoglobin of 10 g/dL. The reason for the increased mortality observed in this study is unknown;<br />
however, the incidence of nonfatal myocardial infarction, vascular access thrombosis, and other<br />
thrombotic events was also higher in the group randomized to a target hemoglobin of 14 g/dL.<br />
An increased incidence of thrombotic events has also been observed in patients with cancer treated with<br />
erythropoietic agents. In patients with cancer who received Aranesp ® , pulmonary emboli,<br />
thrombophlebitis, and thrombosis occurred more frequently than in placebo controls (see ADVERSE<br />
REACTIONS: Cancer Patients Receiving Chemotherapy, Table 5).<br />
In a randomized controlled study (referred to as Cancer Study 1 - the ‘BEST’ study) with another ESA in<br />
939 women with metastatic breast cancer receiving chemotherapy, patients received either weekly<br />
Epoetin alfa or placebo for up to a year. This study was designed to show that survival was superior<br />
when an ESA was administered to prevent anemia (maintain hemoglobin levels between 12 and 14 g/dL<br />
or hematocrit between 36% and 42%). The study was terminated prematurely when interim results<br />
demonstrated that a higher mortality at 4 months (8.7% vs. 3.4%) and a higher rate of fatal thrombotic<br />
events (1.1% vs. 0.2%) in the first 4 months of the study were observed among patients treated with<br />
Epoetin alfa. Based on Kaplan-Meier estimates, at the time of study termination, the 12-month survival<br />
was lower in the Epoetin alfa group than in the placebo group (70% vs. 76%; HR 1.37, 95% CI: 1.07,<br />
1.75, p = 0.012). 4<br />
A systematic review of 57 randomized controlled trials (including Cancer Studies 1 and 5 - the ‘BEST’ and<br />
‘ENHANCE’ studies) evaluating 9353 patients with cancer compared ESAs plus RBC transfusion with<br />
6
RBC transfusion alone for prophylaxis or treatment of anemia in cancer patients with or without<br />
concurrent antineoplastic therapy. An increased relative risk (RR) of thromboembolic events (RR 1.67,<br />
95% CI: 1.35, 2.06; 35 trials and 6769 patients) was observed in ESA-treated patients. An overall<br />
survival hazard ratio of 1.08 (95% CI: 0.99, 1.18; 42 trials and 8167 patients) was observed in ESAtreated<br />
patients. 5<br />
An increased incidence of deep vein thrombosis (DVT) in patients receiving Epoetin alfa undergoing<br />
surgical orthopedic procedures has been observed. In a randomized controlled study (referred to as the<br />
‘SPINE’ study), 681 adult patients, not receiving prophylactic anticoagulation and undergoing spinal<br />
surgery, received Epoetin alfa and standard of care (SOC) treatment, or SOC treatment alone.<br />
Preliminary analysis showed a higher incidence of DVT, determined by either Color Flow Duplex Imaging<br />
or by clinical symptoms, in the Epoetin alfa group [16 patients (4.7%)] compared to the SOC group [7<br />
patients (2.1%)]. In addition, 12 patients in the Epoetin alfa group and 7 patients in the SOC group had<br />
other thrombotic vascular events.<br />
Increased mortality was observed in a randomized placebo-controlled study of Epoetin alfa in adult<br />
patients who were undergoing coronary artery bypass surgery (7 deaths in 126 patients randomized to<br />
Epoetin alfa versus no deaths among 56 patients receiving placebo). Four of these deaths occurred<br />
during the period of study drug administration and all four deaths were associated with thrombotic events.<br />
Aranesp ® is not approved for reduction in allogeneic RBC transfusions in patients scheduled for surgical<br />
procedures.<br />
Increased Mortality and/or Increased Risk of Tumor Progression or Recurrence<br />
Erythropoiesis-stimulating agents resulted in decreased locoregional control/progression-free survival<br />
and/or overall survival (see Table 1). These findings were observed in studies of patients with advanced<br />
head and neck cancer receiving radiation therapy (Cancer Studies 5 and 6), in patients receiving<br />
chemotherapy for metastatic breast cancer (Cancer Study 1) or lymphoid malignancy (Cancer Study 2),<br />
and in patients with non-small cell lung cancer or various malignancies who were not receiving<br />
chemotherapy or radiotherapy (Cancer Studies 7 and 8).<br />
Table 1: Randomized, Controlled Trials with Decreased Survival and/or Decreased Locoregional<br />
Control<br />
Study / Tumor / (n)<br />
Chemotherapy<br />
Cancer Study 1<br />
Metastatic breast<br />
cancer<br />
(n=939)<br />
Cancer Study 2<br />
Lymphoid<br />
malignancy<br />
(n=344)<br />
Cancer Study 3<br />
Early breast cancer<br />
(n=733)<br />
Hemoglobin<br />
Target<br />
12-14 g/dL<br />
13-15 g/dL (M)<br />
13-14 g/dL (F)<br />
12.5-13 g/dL<br />
Achieved<br />
Hemoglobin<br />
(Median<br />
Q1,Q3)<br />
12.9 g/dL<br />
12.2, 13.3 g/dL<br />
11.0 g/dL<br />
9.8, 12.1 g/dL<br />
13.1 g/dL<br />
12.5, 13.7 g/dL<br />
Primary<br />
Endpoint<br />
12-month overall<br />
survival<br />
Proportion of<br />
patients<br />
achieving a<br />
hemoglobin<br />
response<br />
Relapse-free and<br />
overall survival<br />
Adverse Outcome for ESA-containing<br />
Arm<br />
Decreased 12-month survival<br />
Decreased overall survival<br />
Page 166<br />
Decreased 3 yr. relapse-free and overall<br />
survival<br />
7
Cancer Study 4<br />
Cervical Cancer<br />
(n=114)<br />
Radiotherapy Alone<br />
Cancer Study 5<br />
Head and neck<br />
cancer<br />
(n=351)<br />
Cancer Study 6<br />
Head and neck<br />
cancer<br />
(n=522)<br />
12-14 g/dL<br />
≥15 g/dL (M)<br />
≥14 g/dL (F)<br />
No Chemotherapy or Radiotherapy<br />
Cancer Study 7<br />
Non-small cell lung<br />
cancer<br />
(n=70)<br />
Cancer Study 8<br />
Non-myeloid<br />
malignancy<br />
(n=989)<br />
12.7 g/dL<br />
12.1, 13.3 g/dL<br />
Not available<br />
14-15.5 g/dL Not available<br />
Progression-free<br />
and overall<br />
survival and<br />
locoregional<br />
control<br />
Locoregional<br />
progression-free<br />
survival<br />
Locoregional<br />
disease control<br />
Decreased 3 yr. progression-free and<br />
overall survival and locoregional control<br />
Decreased 5-year locoregional<br />
progression-free survival<br />
Decreased overall survival<br />
Decreased locoregional disease control<br />
12-14 g/dL Not available Quality of life Decreased overall survival<br />
12-13 g/dL<br />
Decreased overall survival:<br />
10.6 g/dL<br />
9.4, 11.8 g/dL<br />
RBC transfusions Decreased overall survival<br />
Cancer Study 1 (the ‘BEST’ study) was previously described (see WARNINGS: Increased Mortality,<br />
Serious Cardiovascular Events, Thromboembolic Events, and Stroke). Mortality at 4 months (8.7%<br />
vs. 3.4%) was significantly higher in the Epoetin alfa arm. The most common investigator-attributed cause<br />
of death within the first 4 months was disease progression; 28 of 41 deaths in the Epoetin alfa arm and 13<br />
of 16 deaths in the placebo arm were attributed to disease progression. Investigator assessed time to<br />
tumor progression was not different between the two groups. Survival at 12 months was significantly<br />
lower in the Epoetin alfa arm (70% vs. 76%, HR 1.37, 95% CI: 1.07, 1.75; p = 0.012). 4<br />
Cancer Study 2 was a Phase 3, double-blind, randomized (Aranesp ® vs. placebo) study conducted in 344<br />
anemic patients with lymphoid malignancy receiving chemotherapy. With a median follow-up of 29<br />
months, overall mortality rates were significantly higher among patients randomized to Aranesp ® as<br />
compared to placebo (HR 1.36, 95% CI: 1.02, 1.82).<br />
Cancer Study 7 was a Phase 3, multicenter, randomized (Epoetin alfa vs. placebo), double-blind study, in<br />
which patients with advanced non-small cell lung cancer receiving only palliative radiotherapy or no active<br />
therapy were treated with Epoetin alfa to achieve and maintain hemoglobin levels between 12 and 14<br />
g/dL. Following an interim analysis of 70 of 300 patients planned, a significant difference in survival in<br />
favor of the patients on the placebo arm of the trial was observed (median survival 63 vs. 129 days; HR<br />
1.84; p = 0.04).<br />
Cancer Study 8 was a Phase 3, double-blind, randomized (Aranesp ® vs. placebo), 16-week study in 989<br />
anemic patients with active malignant disease, neither receiving nor planning to receive chemotherapy or<br />
radiation therapy. There was no evidence of a statistically significant reduction in proportion of patients<br />
receiving RBC transfusions. The median survival was shorter in the Aranesp ® treatment group (8<br />
months) compared with the placebo group (10.8 months); HR 1.30, 95% CI: 1.07, 1.57.<br />
Decreased progression-free survival and overall survival:<br />
Page 167<br />
8
Cancer Study 3 (the ‘PREPARE’ study) was a randomized controlled study in which Aranesp ® was<br />
administered to prevent anemia conducted in 733 women receiving neo-adjuvant breast cancer<br />
treatment. After a median follow-up of approximately 3 years the survival rate (86% vs. 90%, HR 1.42,<br />
95% CI: 0.93, 2.18) and relapse-free survival rate were lower (72% vs. 78%, HR 1.33, 95% CI: 0.99,<br />
1.79) in the Aranesp ® -treated arm compared to the control arm.<br />
Cancer Study 4 (protocol GOG 191) was a randomized controlled study that enrolled 114 of a planned<br />
460 cervical cancer patients receiving chemotherapy and radiotherapy. Patients were randomized to<br />
receive Epoetin alfa to maintain hemoglobin between 12 and 14 g/dL or to transfusion support as needed.<br />
The study was terminated prematurely due to an increase in thromboembolic events in Epoetin alfatreated<br />
patients compared to control (19% vs. 9%). Both local recurrence (21% vs. 20%) and distant<br />
recurrence (12% vs. 7%) were more frequent in Epoetin alfa-treated patients compared to control.<br />
Progression-free survival at 3 years was lower in the Epoetin alfa-treated group compared to control (59%<br />
vs. 62%, HR 1.06, 95% CI: 0.58, 1.91). Overall survival at 3 years was lower in the Epoetin alfa-treated<br />
group compared to control (61% vs. 71%, HR 1.28, 95% CI: 0.68, 2.42).<br />
Cancer Study 5 (the ‘ENHANCE’ study) was a randomized controlled study in 351 head and neck cancer<br />
patients where Epoetin beta or placebo was administered to achieve target hemoglobins of 14 and 15<br />
g/dL for women and men, respectively. Locoregional progression-free survival was significantly shorter in<br />
patients receiving Epoetin beta (HR 1.62, 95% CI: 1.22, 2.14, p = 0.0008) with a median of 406 days<br />
Epoetin beta vs. 745 days placebo. Overall survival was significantly shorter in patients receiving Epoetin<br />
beta (HR 1.39, 95% CI: 1.05, 1.84; p = 0.02).<br />
Decreased locoregional control:<br />
Cancer Study 6 (DAHANCA 10) was conducted in 522 patients with primary squamous cell carcinoma of<br />
the head and neck receiving radiation therapy randomized to Aranesp ® with radiotherapy or radiotherapy<br />
alone. An interim analysis on 484 patients demonstrated that locoregional control at 5 years was<br />
significantly shorter in patients receiving Aranesp ® (RR 1.44, 95% CI: 1.06, 1.96; p = 0.02). Overall<br />
survival was shorter in patients receiving Aranesp ® (RR 1.28, 95% CI: 0.98, 1.68; p = 0.08).<br />
ESA APPRISE Oncology Program<br />
Page 168<br />
Prescribers and hospitals must enroll in and comply with the ESA APPRISE Oncology Program to<br />
prescribe and/or dispense Aranesp ® to patients with cancer. To enroll, visit www.esa-apprise.com or call<br />
1-866-284-8089 for further assistance. Additionally, prescribers and patients must provide written<br />
acknowledgment of a discussion of the risks associated with Aranesp ® .<br />
Hypertension<br />
Patients with uncontrolled hypertension should not be treated with Aranesp ® ; blood pressure should be<br />
controlled adequately before initiation of therapy. Blood pressure may rise during treatment of anemia<br />
with Aranesp ® or Epoetin alfa. In Aranesp ® clinical trials, approximately 40% of patients with CRF<br />
required initiation or intensification of antihypertensive therapy during the early phase of treatment when<br />
the hemoglobin was increasing. Hypertensive encephalopathy and seizures have been observed in<br />
patients with CRF treated with Aranesp ® or Epoetin alfa.<br />
Special care should be taken to closely monitor and control blood pressure in patients treated with<br />
Aranesp ® . During Aranesp ® therapy, patients should be advised of the importance of compliance with<br />
antihypertensive therapy and dietary restrictions. If blood pressure is difficult to control by pharmacologic<br />
or dietary measures, the dose of Aranesp ® should be reduced or withheld (see DOSAGE AND<br />
ADMINISTRATION). A clinically significant decrease in hemoglobin may not be observed for several<br />
weeks.<br />
9
Page 169<br />
Seizures<br />
Seizures have occurred in patients with CRF participating in clinical trials of Aranesp ® and Epoetin alfa.<br />
During the first several months of therapy, blood pressure and the presence of premonitory neurologic<br />
symptoms should be monitored closely. While the relationship between seizures and the rate of rise of<br />
hemoglobin is uncertain, it is recommended that the dose of Aranesp ® be decreased if the hemoglobin<br />
increase exceeds 1 g/dL in any 2-week period.<br />
Pure Red Cell Aplasia<br />
Cases of pure red cell aplasia (PRCA) and of severe anemia, with or without other cytopenias, associated<br />
with neutralizing antibodies to erythropoietin have been reported in patients treated with Aranesp ® . This<br />
has been reported predominantly in patients with CRF receiving ESAs by subcutaneous administration.<br />
PRCA has also been reported in patients receiving ESAs while undergoing treatment for hepatitis C with<br />
interferon and ribavirin. Any patient who develops a sudden loss of response to Aranesp ® , accompanied<br />
by severe anemia and low reticulocyte count, should be evaluated for the etiology of loss of effect,<br />
including the presence of neutralizing antibodies to erythropoietin (see PRECAUTIONS: Lack or Loss of<br />
Response to Aranesp ® ). If anti-erythropoietin antibody-associated anemia is suspected, withhold<br />
Aranesp ® and other ESAs. Contact <strong>Amgen</strong> (1-800-77AMGEN) to perform assays for binding and<br />
neutralizing antibodies. Aranesp ® should be permanently discontinued in patients with antibody-mediated<br />
anemia. Patients should not be switched to other ESAs as antibodies may cross-react (see ADVERSE<br />
REACTIONS: Immunogenicity).<br />
Albumin (Human)<br />
Aranesp ® is supplied in two formulations with different excipients, one containing polysorbate 80 and<br />
another containing albumin (human), a derivative of human blood (see DESCRIPTION). Based on<br />
effective donor screening and product manufacturing processes, Aranesp ® formulated with albumin<br />
carries an extremely remote risk for transmission of viral diseases. A theoretical risk for transmission of<br />
Creutzfeldt-Jakob disease (CJD) also is considered extremely remote. No cases of transmission of viral<br />
diseases or CJD have ever been identified for albumin.<br />
PRECAUTIONS<br />
General<br />
The safety and efficacy of Aranesp ® therapy have not been established in patients with underlying<br />
hematologic diseases (e.g., hemolytic anemia, sickle cell anemia, thalassemia, porphyria).<br />
The needle cover of the prefilled syringe contains dry natural rubber (a derivative of latex), which may<br />
cause allergic reactions in individuals sensitive to latex.<br />
Lack or Loss of Response to Aranesp ®<br />
A lack of response or failure to maintain a hemoglobin response with Aranesp ® doses within the<br />
recommended dosing range should prompt a search for causative factors. Deficiencies of folic acid, iron,<br />
or vitamin B12 should be excluded or corrected. Depending on the clinical setting, intercurrent infections,<br />
inflammatory or malignant processes, osteofibrosis cystica, occult blood loss, hemolysis, severe<br />
aluminum toxicity, and bone marrow fibrosis may compromise an erythropoietic response. In the absence<br />
of another etiology, the patient should be evaluated for evidence of PRCA and sera should be tested for<br />
the presence of antibodies to erythropoietin (see WARNINGS: Pure Red Cell Aplasia). See DOSAGE<br />
AND ADMINISTRATION: Chronic Renal Failure Patients, Dose Adjustment for management of<br />
patients with an insufficient hemoglobin response to Aranesp ® therapy.<br />
Hematology<br />
Sufficient time should be allowed to determine a patient’s responsiveness to a dosage of Aranesp ® before<br />
adjusting the dose. Because of the time required for erythropoiesis and the RBC half-life, an interval of 2<br />
to 6 weeks may occur between the time of a dose adjustment (initiation, increase, decrease, or<br />
discontinuation) and a significant change in hemoglobin.<br />
10
Page 170<br />
In order to prevent the hemoglobin from exceeding the recommended target range (10 to 12 g/dL) or<br />
rising too rapidly (greater than 1 g/dL in 2 weeks), the guidelines for dose and frequency of dose<br />
adjustments should be followed (see WARNINGS and DOSAGE AND ADMINISTRATION).<br />
Allergic Reactions<br />
There have been rare reports of potentially serious allergic reactions, including skin rash and urticaria,<br />
associated with Aranesp ® . Symptoms have recurred with rechallenge, suggesting a causal relationship<br />
exists in some instances. If a serious allergic or anaphylactic reaction occurs, Aranesp ® should be<br />
immediately and permanently discontinued and appropriate therapy should be administered.<br />
Patients with CRF Not Requiring Dialysis<br />
Patients with CRF not yet requiring dialysis may require lower maintenance doses of Aranesp ® than<br />
patients receiving dialysis. Though CRF patients not on dialysis generally receive less frequent<br />
monitoring of blood pressure and laboratory parameters than dialysis patients, CRF patients not on<br />
dialysis may be more responsive to the effects of Aranesp ® , and require judicious monitoring of blood<br />
pressure and hemoglobin. Renal function and fluid and electrolyte balance should also be closely<br />
monitored.<br />
Patients Transitioning to Dialysis<br />
During the transition period onto dialysis, hemoglobin and blood pressure should be monitored carefully<br />
and patients may need to have their maintenance doses adjusted to maintain hemoglobin levels within<br />
the range of 10 to 12 g/dL (see DOSAGE AND ADMINISTRATION: Maintenance Dose).<br />
Dialysis Management<br />
Therapy with Aranesp ® results in an increase in RBCs and a decrease in plasma volume, which could<br />
reduce dialysis efficiency; patients who are marginally dialyzed may require adjustments in their dialysis<br />
prescription.<br />
Laboratory Tests<br />
After initiation of Aranesp ® therapy, the hemoglobin should be determined weekly until it has stabilized<br />
and the maintenance dose has been established (see DOSAGE AND ADMINISTRATION). After a dose<br />
adjustment, the hemoglobin should be determined weekly for at least 4 weeks, until it has been<br />
determined that the hemoglobin has stabilized in response to the dose change. The hemoglobin should<br />
then be monitored at regular intervals.<br />
In order to ensure effective erythropoiesis, iron status should be evaluated for all patients before and<br />
during treatment, as the majority of patients will eventually require supplemental iron therapy.<br />
Supplemental iron therapy is recommended for all patients whose serum ferritin is below 100 mcg/L or<br />
whose serum transferrin saturation is below 20%.<br />
Information for Patients<br />
Patients should be informed of the increased risks of mortality, serious cardiovascular events,<br />
thromboembolic events, and increased risk of tumor progression or recurrence (see WARNINGS).<br />
Patients should be informed of the possible side effects of Aranesp ® and be instructed to report them to<br />
the prescribing physician. Patients should be informed of the signs and symptoms of allergic drug<br />
reactions and be advised of appropriate actions. Patients should be counseled on the importance of<br />
compliance with their Aranesp ® treatment, dietary and dialysis prescriptions, and the importance of<br />
judicious monitoring of blood pressure and hemoglobin concentration should be stressed.<br />
In those rare cases where it is determined that a patient can safely and effectively administer Aranesp ® at<br />
home, appropriate instruction on the proper use of Aranesp ® should be provided for patients and their<br />
caregivers. Patients should be instructed to read the Aranesp ® Medication Guide and Patient Instructions<br />
for Use and should be informed that the Medication Guide is not a disclosure of all possible side effects.<br />
Patients and caregivers should also be cautioned against the reuse of needles, syringes, prefilled<br />
SureClick autoinjectors, or drug product, and be thoroughly instructed in their proper disposal. A<br />
puncture-resistant container for the disposal of used syringes, autoinjectors, and needles should be made<br />
available to the patient. Patients should be informed that the needle cover on the prefilled syringe<br />
11
Page 171<br />
contains dry natural rubber (a derivative of latex), which should not be handled by persons sensitive to<br />
latex.<br />
Drug Interactions<br />
No formal drug interaction studies of Aranesp ® have been performed.<br />
Carcinogenesis, Mutagenesis, and Impairment of Fertility<br />
Carcinogenicity: The carcinogenic potential of Aranesp ® has not been evaluated in long-term animal<br />
studies. Aranesp ® did not alter the proliferative response of non-hematological cells in vitro or in vivo. In<br />
toxicity studies of approximately 6 months duration in rats and dogs, no tumorigenic or unexpected<br />
mitogenic responses were observed in any tissue type. Using a panel of human tissues, the in vitro<br />
tissue binding profile of Aranesp ® was identical to Epoetin alfa. Neither molecule bound to human tissues<br />
other than those expressing the erythropoietin receptor.<br />
Mutagenicity: Aranesp ® was negative in the in vitro bacterial and CHO cell assays to detect<br />
mutagenicity and in the in vivo mouse micronucleus assay to detect clastogenicity.<br />
Impairment of Fertility: When administered intravenously to male and female rats prior to and during<br />
mating, reproductive performance, fertility, and sperm assessment parameters were not affected at any<br />
doses evaluated (up to 10 mcg/kg/dose, administered 3 times weekly). An increase in post implantation<br />
fetal loss was seen at doses equal to or greater than 0.5 mcg/kg/dose, administered 3 times weekly.<br />
Pregnancy Category C<br />
When Aranesp ® was administered intravenously to rats and rabbits during gestation, no evidence of a<br />
direct embryotoxic, fetotoxic, or teratogenic outcome was observed at doses up to 20 mcg/kg/day. The<br />
only adverse effect observed was a slight reduction in fetal weight, which occurred at doses causing<br />
exaggerated pharmacological effects in the dams (1 mcg/kg/day and higher). No deleterious effects on<br />
uterine implantation were seen in either species. No significant placental transfer of Aranesp ® was<br />
observed in rats. An increase in post implantation fetal loss was observed in studies assessing fertility<br />
(see PRECAUTIONS: Carcinogenesis, Mutagenesis, and Impairment of Fertility: Impairment of<br />
Fertility).<br />
Intravenous injection of Aranesp ® to female rats every other day from day 6 of gestation through day 23 of<br />
lactation at doses of 2.5 mcg/kg/dose and higher resulted in offspring (F1 generation) with decreased<br />
body weights, which correlated with a low incidence of deaths, as well as delayed eye opening and<br />
delayed preputial separation. No adverse effects were seen in the F2 offspring.<br />
There are no adequate and well-controlled studies in pregnant women. Aranesp ® should be used during<br />
pregnancy only if the potential benefit justifies the potential risk to the fetus.<br />
Nursing Mothers<br />
It is not known whether Aranesp ® is excreted in human milk. Because many drugs are excreted in human<br />
milk, caution should be exercised when Aranesp ® is administered to a nursing woman.<br />
Pediatric Use<br />
Pediatric CRF Patients<br />
A study of the conversion from Epoetin alfa to Aranesp ® among pediatric CRF patients over 1 year of age<br />
showed similar safety and efficacy to the findings from adult conversion studies (see CLINICAL<br />
PHARMACOLOGY and CLINICAL STUDIES). Safety and efficacy in the initial treatment of anemic<br />
pediatric CRF patients or in the conversion from another erythropoietin to Aranesp ® in pediatric CRF<br />
patients less than 1 year of age have not been established.<br />
Pediatric Cancer Patients<br />
The safety and efficacy of Aranesp ® in pediatric cancer patients have not been established.<br />
12
Page 172<br />
Geriatric Use<br />
Of the 1801 CRF patients in clinical studies of Aranesp ® , 44% were age 65 and over, while 17% were age<br />
75 and over. Of the 873 cancer patients in clinical studies receiving Aranesp ® and concomitant<br />
chemotherapy, 45% were age 65 and over, while 14% were age 75 and over. No overall differences in<br />
safety or efficacy were observed between older and younger patients.<br />
ADVERSE REACTIONS<br />
General<br />
Because clinical trials are conducted under widely varying conditions, adverse reaction rates observed in<br />
the clinical trials of Aranesp ® cannot be directly compared to rates in the clinical trials of other drugs and<br />
may not reflect the rates observed in practice.<br />
Immunogenicity<br />
As with all therapeutic proteins, there is a potential for immunogenicity. Neutralizing antibodies to<br />
erythropoietin, in association with PRCA or severe anemia (with or without other cytopenias), have been<br />
reported in patients receiving Aranesp ® (see WARNINGS: Pure Red Cell Aplasia) during post-marketing<br />
experience.<br />
In clinical studies, the percentage of patients with antibodies to Aranesp ® was examined using the<br />
BIAcore assay. Sera from 1501 CRF patients and 1159 cancer patients were tested. At baseline, prior to<br />
Aranesp ® treatment, binding antibodies were detected in 59 (4%) of CRF patients and 36 (3%) of cancer<br />
patients. While receiving Aranesp ® therapy (range 22-177 weeks), a follow-up sample was taken. One<br />
additional CRF patient and eight additional cancer patients developed antibodies capable of binding<br />
Aranesp ® . None of the patients had antibodies capable of neutralizing the activity of Aranesp ® or<br />
endogenous erythropoietin at baseline or at end of study. No clinical sequelae consistent with PRCA<br />
were associated with the presence of these antibodies.<br />
The incidence of antibody formation is highly dependent on the sensitivity and specificity of the assay.<br />
Additionally, the observed incidence of antibody (including neutralizing antibody) positivity in an assay<br />
may be influenced by several factors including assay methodology, sample handling, timing of sample<br />
collection, concomitant medications, and underlying disease. For these reasons, comparison of the<br />
incidence of antibodies across products within this class (erythropoietic proteins) may be misleading.<br />
Chronic Renal Failure Patients<br />
Adult Patients<br />
In all studies, the most frequently reported serious adverse events with Aranesp ® were infection,<br />
congestive heart failure, angina pectoris/cardiac chest pain, thrombosis vascular access, and cardiac<br />
arrhythmia/cardiac arrest. The most frequently reported adverse events resulting in clinical intervention<br />
(e.g., discontinuation of Aranesp ® , adjustment in dosage, or the need for concomitant medication to treat<br />
an adverse reaction symptom) were infection, hypertension, hypotension, and muscle spasm. See<br />
WARNINGS: Increased Mortality, Serious Cardiovascular Events, Thromboembolic Events, and<br />
Stroke and Hypertension.<br />
The data described below reflect exposure to Aranesp ® in 1801 CRF patients, including 675 exposed for<br />
at least 6 months, of whom 185 were exposed for greater than 1 year. Aranesp ® was evaluated in activecontrolled<br />
(n = 823) and uncontrolled studies (n = 978). These data include a pooled analysis of CRF<br />
patients not on dialysis and dialysis patients who were studied for the correction of anemia and<br />
maintenance of hemoglobin.<br />
The population encompassed an age range from 18 to 94 years. Fifty-five percent of the patients were<br />
male. The percentages of Caucasian, Black, Asian, and Hispanic patients were 80%, 13%, 3%, and 2%,<br />
respectively. The median weekly dose of Aranesp ® for patients who received either once weekly or once<br />
every 2 week administration was 0.44 mcg/kg (25th, 75th percentiles: 0.30, 0.64 mcg/kg).<br />
Some of the adverse events reported are typically associated with CRF, or recognized complications of<br />
dialysis, and may not necessarily be attributable to Aranesp ® therapy. No important differences in<br />
13
adverse event rates between treatment groups were observed in controlled studies in which patients<br />
received Aranesp ® or other recombinant erythropoietins.<br />
The data in Table 2 reflect those adverse events occurring in at least 5% of patients treated with<br />
Aranesp ® .<br />
Table 2. Adverse Events Occurring in ≥ 5% of CRF Patients<br />
(Continued)<br />
Event<br />
Patients Treated with<br />
Aranesp ® APPLICATION SITE<br />
(n = 1801)<br />
Injection Site Pain<br />
BODY AS A WHOLE<br />
6%<br />
Peripheral Edema 10%<br />
Fatigue 9%<br />
Fever 7%<br />
Death 6%<br />
Chest Pain, Unspecified 7%<br />
Fluid Overload 6%<br />
Access Infection 6%<br />
Influenza-like Symptoms 6%<br />
Access Hemorrhage 7%<br />
Asthenia<br />
CARDIOVASCULAR<br />
5%<br />
Hypertension 20%<br />
Hypotension 20%<br />
Cardiac Arrhythmias/Cardiac Arrest 8%<br />
Angina Pectoris/Cardiac Chest Pain 8%<br />
Thrombosis Vascular Access 6%<br />
Congestive Heart Failure<br />
CNS/PNS<br />
5%<br />
Headache 15%<br />
Dizziness<br />
GASTROINTESTINAL<br />
7%<br />
Diarrhea 14%<br />
Vomiting 14%<br />
Nausea 11%<br />
Abdominal Pain 10%<br />
Constipation<br />
MUSCULO-SKELETAL<br />
5%<br />
Muscle Spasm 17%<br />
Arthralgia 9%<br />
Limb Pain 8%<br />
Back Pain 7%<br />
Page 173<br />
14
Table 2. Adverse Events Occurring in ≥ 5% of CRF Patients (Continued)<br />
Event<br />
Patients Treated with Aranesp ®<br />
RESISTANCE MECHANISM<br />
(n = 1801)<br />
Infection a 24%<br />
RESPIRATORY<br />
Upper Respiratory Infection 15%<br />
Dyspnea 10%<br />
Cough 9%<br />
Bronchitis 5%<br />
SKIN AND APPENDAGES<br />
Pruritus 6%<br />
a Infection includes sepsis, bacteremia, pneumonia, peritonitis, and abscess.<br />
The incidence rates for other clinically significant events are shown in Table 3.<br />
Table 3. Percent Incidence of Other Clinically Significant Events in CRF Patients<br />
Event<br />
Patients Treated with Aranesp ®<br />
(n = 1801)<br />
Acute Myocardial Infarction 2%<br />
Stroke 2%<br />
Seizure 1%<br />
Transient Ischemic Attack ≤1%<br />
Page 174<br />
Pediatric Patients<br />
In Study N7, Aranesp ® was administered to 81 pediatric CRF patients who had stable hemoglobin<br />
concentrations while previously receiving Epoetin alfa (see CLINICAL STUDIES). In this study, the most<br />
frequently reported serious adverse events with Aranesp ® were catheter sepsis, fever, catheter related<br />
infection, chronic renal failure, and vascular access complication. The most commonly reported adverse<br />
events were fever, headache, nasopharyngitis, hypertension, hypotension, injection site pain, cough,<br />
peritonitis, and vomiting. Aranesp ® administration was discontinued because of injection site pain in two<br />
patients and moderate hypertension in a third patient.<br />
Studies have not evaluated the effects of Aranesp ® when administered to pediatric patients as the initial<br />
treatment for the anemia associated with CRF.<br />
Thrombotic Events<br />
Vascular access thrombosis in hemodialysis patients occurred in clinical trials at an annualized rate of<br />
0.22 events per patient year of Aranesp ® therapy. Rates of thrombotic events (e.g., vascular access<br />
thrombosis, venous thrombosis, and pulmonary emboli) with Aranesp ® therapy were similar to those<br />
observed with other recombinant erythropoietins in these trials; the median duration of exposure was 12<br />
weeks.<br />
Cancer Patients Receiving Chemotherapy<br />
The incidence data described below reflect the exposure to Aranesp ® in 873 cancer patients including<br />
patients exposed to Aranesp ® once weekly (547, 63%), once every 2 weeks (128, 16%), and once every<br />
3 weeks (198, 23%). Aranesp ® was evaluated in seven studies that were active-controlled and/or<br />
placebo-controlled studies of up to 6 months duration. The Aranesp ® -treated patient demographics were<br />
as follows: median age of 63 years (range of 20 to 91 years); 40% male; 88% Caucasian, 5% Hispanic,<br />
15
4% Black, and 3% Asian. Over 90% of patients had locally advanced or metastatic cancer, with the<br />
remainder having early stage disease. Patients with solid tumors (e.g., lung, breast, colon, ovarian<br />
cancers) and lymphoproliferative malignancies (e.g., lymphoma, multiple myeloma) were enrolled in the<br />
clinical studies. All of the 873 Aranesp ® -treated subjects also received concomitant cyclic chemotherapy.<br />
The most frequently reported serious adverse events included death (10%), fever (4%), pneumonia (3%),<br />
dehydration (3%), vomiting (2%), and dyspnea (2%). The most commonly reported adverse events were<br />
fatigue, edema, nausea, vomiting, diarrhea, fever, and dyspnea (see Table 4). Except for those events<br />
listed in Tables 4 and 5, the incidence of adverse events in clinical studies occurred at a similar rate<br />
compared with patients who received placebo and were generally consistent with the underlying disease<br />
and its treatment with chemotherapy. The most frequently reported reasons for discontinuation of<br />
Aranesp ® were progressive disease, death, discontinuation of the chemotherapy, asthenia, dyspnea,<br />
pneumonia, and gastrointestinal hemorrhage. No important differences in adverse event rates between<br />
treatment groups were observed in controlled studies in which patients received Aranesp ® or other<br />
recombinant erythropoietins.<br />
Table 4. Adverse Events Occurring in ≥ 5% of Patients Receiving Chemotherapy<br />
Event<br />
Aranesp ®<br />
(n = 873)<br />
Placebo<br />
(n = 221)<br />
BODY AS A WHOLE<br />
Fatigue 33% 30%<br />
Edema 21% 10%<br />
Fever 19% 16%<br />
CNS/PNS<br />
Dizziness 14% 8%<br />
Headache 12% 9%<br />
GASTROINTESTINAL<br />
Diarrhea 22% 12%<br />
Constipation 18% 17%<br />
METABOLIC/NUTRITION<br />
Dehydration 5% 3%<br />
MUSCULO-SKELETAL<br />
Arthralgia 13% 6%<br />
Myalgia 8% 5%<br />
SKIN AND APPENDAGES<br />
Rash 7% 3%<br />
Page 175<br />
16
Table 5. Incidence of Other Clinically Significant Adverse Events in Patients Receiving<br />
Chemotherapy<br />
Event<br />
All Aranesp ®<br />
(n = 873)<br />
Placebo<br />
(n = 221)<br />
Hypertension 3.7% 3.2%<br />
Seizures/Convulsions a 0.6% 0.5%<br />
Thrombotic Events 6.2% 4.1%<br />
Pulmonary Embolism 1.3% 0.0%<br />
Thrombosis b 5.6% 4.1%<br />
a<br />
Seizures/Convulsions include the preferred terms: Convulsions, Convulsions<br />
Grand Mal, and Convulsions Local.<br />
b<br />
Thrombosis includes: Thrombophlebitis, Thrombophlebitis Deep,<br />
Thrombosis Venous, Thrombosis Venous Deep, Thromboembolism, and<br />
Thrombosis.<br />
Page 176<br />
In a randomized controlled trial of Aranesp ® 500 mcg once every 3 weeks (n = 353) and Aranesp ® 2.25<br />
mcg/kg once weekly (n = 352), the incidences of all adverse events and of serious adverse events were<br />
similar between the two groups.<br />
Thrombotic and Cardiovascular Events<br />
Overall, the incidence of thrombotic events was 6.2% for Aranesp ® and 4.1% for placebo. However, the<br />
following events were reported more frequently in Aranesp ® -treated patients than in placebo controls:<br />
pulmonary embolism, thromboembolism, thrombosis, and thrombophlebitis (deep and/or superficial). In<br />
addition, edema of any type was more frequently reported in Aranesp ® -treated patients (21%) than in<br />
patients who received placebo (10%).<br />
OVERDOSAGE<br />
The expected manifestations of Aranesp ® overdosage include signs and symptoms associated with an<br />
excessive and/or rapid increase in hemoglobin concentration, including any of the cardiovascular events<br />
described in WARNINGS and listed in ADVERSE REACTIONS. Patients receiving an overdosage of<br />
Aranesp ® should be monitored closely for cardiovascular events and hematologic abnormalities.<br />
Polycythemia should be managed acutely with phlebotomy, as clinically indicated. Following resolution of<br />
the effects due to Aranesp ® overdosage, reintroduction of Aranesp ® therapy should be accompanied by<br />
close monitoring for evidence of rapid increases in hemoglobin concentration (> 1 g/dL in any 2-week<br />
period). In patients with an excessive hematopoietic response, reduce the Aranesp ® dose in accordance<br />
with the recommendations described in DOSAGE AND ADMINISTRATION.<br />
DOSAGE AND ADMINISTRATION<br />
IMPORTANT: See BOXED WARNINGS and WARNINGS: Increased Mortality, Serious<br />
Cardiovascular Events, Thromboembolic Events, and Stroke.<br />
Aranesp ® is supplied in vials or in prefilled syringes with UltraSafe ® Needle Guards * . Following<br />
administration of Aranesp ® from the prefilled syringe, the UltraSafe ® Needle Guard should be activated to<br />
prevent accidental needlesticks.<br />
Aranesp ® is also supplied in prefilled SureClick autoinjectors containing the same dosage strengths as<br />
the prefilled syringes. Because the autoinjectors are designed to deliver the full content, autoinjectors<br />
should only be used for patients who need the full dose. If the required dose is not available in an<br />
autoinjector, prefilled syringes, or vials should be used to administer the required dose. Autoinjectors are<br />
for subcutaneous administration only.<br />
17
Page 177<br />
Chronic Renal Failure Patients<br />
Aranesp ® may be administered either intravenously or subcutaneously as a single weekly injection. In<br />
patients on hemodialysis, the intravenous route is recommended. The dose should be started and<br />
slowly adjusted as described below based on hemoglobin levels. If a patient fails to respond or maintain<br />
a response, this should be evaluated (see WARNINGS: Pure Red Cell Aplasia, PRECAUTIONS: Lack<br />
or Loss of Response to Aranesp ® and PRECAUTIONS: Laboratory Tests). When Aranesp ® therapy<br />
is initiated or adjusted, the hemoglobin should be followed weekly until stabilized and monitored at least<br />
monthly thereafter. During therapy, hematological parameters should be monitored regularly. Doses<br />
must be individualized to ensure that hemoglobin is maintained at an appropriate level for each patient.<br />
For patients who respond to Aranesp ® with a rapid increase in hemoglobin (e.g., more than 1 g/dL in any<br />
2-week period), the dose of Aranesp ® should be reduced.<br />
Individualize dosing to achieve and maintain hemoglobin levels within the range of 10 to 12 g/dL.<br />
Starting Dose<br />
Correction of <strong>Anemia</strong><br />
The initial dose by subcutaneous or intravenous administration is 0.45 mcg/kg body weight, as a<br />
single injection once weekly. Alternatively, in patients not receiving dialysis, an initial dose of 0.75 mcg/kg<br />
may be administered subcutaneously as a single injection once every 2 weeks. If hemoglobin excursions<br />
outside the recommended range occur, the Aranesp ® dose should be adjusted as described below.<br />
The use of Aranesp ® in pediatric CRF patients as the initial treatment to correct anemia has not been<br />
studied.<br />
Maintenance Dose<br />
The dose should be individualized to maintain hemoglobin levels within the range of 10 to 12 g/dL (see<br />
Dose Adjustment). If hemoglobin excursions outside the recommended range occur, the Aranesp ® dose<br />
should be adjusted as described below. For many patients, the appropriate maintenance dose will be<br />
lower than the starting dose. CRF patients not on dialysis, in particular, may require lower maintenance<br />
doses. In the maintenance phase, Aranesp ® may continue to be administered as a single injection once<br />
weekly or once every 2 weeks.<br />
Dose Adjustment<br />
The dose should be adjusted for each patient to achieve and maintain hemoglobin levels within the range<br />
of 10 to 12 g/dL. If hemoglobin excursions outside the recommended range occur, the Aranesp ® dose<br />
should be adjusted as described below. Increases in dose should not be made more frequently than<br />
once a month.<br />
If the hemoglobin is increasing and approaching 12 g/dL, the dose should be reduced by approximately<br />
25%. If the hemoglobin continues to increase, doses should be temporarily withheld until the hemoglobin<br />
begins to decrease, at which point therapy should be reinitiated at a dose approximately 25% below the<br />
previous dose. If the hemoglobin increases by more than 1 g/dL in a 2-week period, the dose should be<br />
decreased by approximately 25%.<br />
If the increase in hemoglobin is less than 1 g/dL over 4 weeks and iron stores are adequate (see<br />
PRECAUTIONS: Laboratory Tests), the dose of Aranesp ® may be increased by approximately 25% of<br />
the previous dose. Further increases may be made at 4-week intervals until the specified hemoglobin is<br />
obtained.<br />
For patients whose hemoglobin does not attain a level within the range of 10 to 12 g/dL despite the use of<br />
appropriate Aranesp ® dose titrations over a 12-week period:<br />
• do not administer higher Aranesp ® doses and use the lowest dose that will maintain a<br />
hemoglobin level sufficient to avoid the need for recurrent RBC transfusions,<br />
• evaluate and treat for other causes of anemia (see PRECAUTIONS: Lack or Loss of Response<br />
to Aranesp ® ), and<br />
18
• thereafter, hemoglobin should continue to be monitored and if responsiveness improves,<br />
Aranesp ® dose adjustments should be made as described above; discontinue Aranesp ® if<br />
responsiveness does not improve and the patient needs recurrent RBC transfusions.<br />
Conversion From Epoetin alfa to Aranesp ®<br />
The starting weekly dose of Aranesp ® for adults and pediatric patients should be estimated on the basis<br />
of the weekly Epoetin alfa dose at the time of substitution (see Table 6). For pediatric patients receiving<br />
a weekly Epoetin alfa dose of < 1,500 units/week, the available data are insufficient to determine an<br />
Aranesp ® conversion dose. Because of variability, doses should be titrated to achieve and maintain<br />
hemoglobin levels within the range of 10 to 12 g/dL. Due to the longer serum half-life, Aranesp ® should<br />
be administered less frequently than Epoetin alfa. Aranesp ® should be administered once a week if a<br />
patient was receiving Epoetin alfa 2 to 3 times weekly. Aranesp ® should be administered once every<br />
2 weeks if a patient was receiving Epoetin alfa once per week. The route of administration (intravenous<br />
or subcutaneous) should be maintained.<br />
Table 6. Estimated Aranesp ® Starting Doses (mcg/week) for Patients<br />
Based on Previous Epoetin alfa Dose (Units/week)<br />
Weekly Aranesp ® Dose (mcg/week)<br />
Previous Weekly Epoetin alfa<br />
Dose (Units/week)<br />
Adult Pediatric<br />
< 1,500 6.25 See text*<br />
1,500 to 2,499 6.25 6.25<br />
2,500 to 4,999 12.5 10<br />
5,000 to 10,999 25 20<br />
11,000 to 17,999 40 40<br />
18,000 to 33,999 60 60<br />
34,000 to 89,999 100 100<br />
≥ 90,000 200 200<br />
*For pediatric patients receiving a weekly Epoetin alfa dose of < 1,500 units/week, the available data are insufficient<br />
to determine an Aranesp ® conversion dose.<br />
Cancer Patients Receiving Chemotherapy<br />
Only prescribers enrolled in the ESA APPRISE Oncology Program may prescribe and/or dispense<br />
Aranesp ® (see WARNINGS: ESA APPRISE Oncology Program).<br />
For pediatric patients, see PRECAUTIONS: Pediatric Use.<br />
Page 178<br />
The recommended starting dose for Aranesp ® administered weekly is 2.25 mcg/kg as a subcutaneous<br />
injection.<br />
The recommended starting dose for Aranesp ® administered once every 3 weeks is 500 mcg as a<br />
subcutaneous injection.<br />
Therapy should not be initiated at hemoglobin levels ≥ 10 g/dL. For both dosing schedules, the dose<br />
should be adjusted for each patient to maintain the lowest hemoglobin level sufficient to avoid RBC<br />
19
transfusion. If the rate of hemoglobin increase is more than 1 g/dL per 2-week period or when the<br />
hemoglobin reaches a level needed to avoid transfusion, the dose should be reduced by 40% of the<br />
previous dose. If the hemoglobin exceeds a level needed to avoid transfusion, Aranesp ® should be<br />
temporarily withheld until the hemoglobin approaches a level where transfusions may be required. At this<br />
point, therapy should be reinitiated at a dose 40% below the previous dose.<br />
For patients receiving weekly administration, if there is less than a 1 g/dL increase in hemoglobin after 6<br />
weeks of therapy, the dose of Aranesp ® should be increased up to 4.5 mcg/kg.<br />
Discontinue Aranesp ® if after 8 weeks of therapy there is no response as measured by hemoglobin levels<br />
or if transfusions are still required.<br />
Discontinue Aranesp ® following the completion of a chemotherapy course (see BOXED WARNINGS:<br />
Cancer).<br />
Preparation and Administration of Aranesp ®<br />
Page 179<br />
Do not shake Aranesp ® or leave vials, syringes, or prefilled SureClick autoinjectors exposed to light.<br />
After removing the vials, prefilled syringes, or autoinjectors from the refrigerator, protect from room light<br />
until administration. Vigorous shaking or exposure to light may denature Aranesp ® , causing it to become<br />
biologically inactive. Always store vials, prefilled syringes, or autoinjectors of Aranesp ® in their carton<br />
until use.<br />
Parenteral drug products should be inspected visually for particulate matter and discoloration prior to<br />
administration. Do not use any vials, prefilled syringes, or autoinjectors exhibiting particulate matter or<br />
discoloration.<br />
Do not dilute Aranesp ® .<br />
Do not administer Aranesp ® in conjunction with other drug solutions.<br />
Aranesp ® contains no preservatives. Discard any unused portion. Do not pool unused portions from<br />
the vials or prefilled syringes. Do not use the vial, prefilled syringe, or autoinjector more than one<br />
time.<br />
Following administration of Aranesp ® from the prefilled syringe, activate the UltraSafe ® Needle Guard.<br />
Place your hands behind the needle, grasp the guard with one hand, and slide the guard forward until the<br />
needle is completely covered and the guard clicks into place. NOTE: If an audible click is not heard, the<br />
needle guard may not be completely activated.<br />
The prefilled SureClick autoinjector is designed to deliver the full dose. The completion of the injection<br />
is signaled by an audible click. Removal of the autoinjector from the injection site automatically extends a<br />
needle cover.<br />
The autoinjectors, the syringes used with vials, and the entire prefilled syringe with activated needle<br />
guard should be disposed of in a puncture-proof container.<br />
See the accompanying “Patient Instructions for Use” insert for complete instructions on the preparation<br />
and administration of Aranesp ® for patients, including injection site selection.<br />
HOW SUPPLIED<br />
Aranesp ® is available in single-dose vials in two solutions, an albumin solution and a polysorbate solution.<br />
The words “Albumin Free” appear on the polysorbate container labels and the package main panels as<br />
well as other panels as space permits. Aranesp ® single-dose prefilled syringes and prefilled SureClick<br />
autoinjectors are available in albumin and polysorbate solutions. Both prefilled syringes and autoinjectors<br />
are supplied with a 27-gauge, ½-inch needle.<br />
Each prefilled syringe is equipped with an UltraSafe ® Needle Guard that is manually activated to cover<br />
the needle during disposal. The needle cover of the prefilled syringe contains dry natural rubber (a<br />
derivative of latex). The autoinjector has a needle cover that automatically extends as the autoinjector is<br />
removed from the injection site after completion of the injection.<br />
20
Aranesp ® is available in the following packages:<br />
Single-dose Vial, Polysorbate Solution<br />
1 Vial/Pack,<br />
4 Packs/Case<br />
200 mcg/1 mL<br />
(NDC 55513-006-01)<br />
300 mcg/1 mL<br />
(NDC 55513-110-01)<br />
500 mcg/1 mL<br />
(NDC 55513-008-01)<br />
Single-dose Vial, Albumin Solution<br />
1 Vial/Pack,<br />
4 Packs/Case<br />
200 mcg/1 mL<br />
(NDC 55513-014-01)<br />
300 mcg/1 mL<br />
(NDC 55513-015-01)<br />
500 mcg/1 mL<br />
(NDC 55513-016-01)<br />
4 Vials/Pack, 4 Packs/Case 4 Vials/Pack, 10 Packs/Case<br />
200 mcg/1 mL<br />
(NDC 55513-006-04)<br />
300 mcg/1 mL<br />
(NDC 55513-110-04)<br />
25 mcg/1 mL<br />
(NDC 55513-002-04)<br />
40 mcg/1 mL<br />
(NDC 55513-003-04)<br />
60 mcg/1 mL<br />
(NDC 55513-004-04)<br />
100 mcg/1 mL<br />
(NDC 55513-005-04)<br />
150 mcg/0.75 mL<br />
(NDC 55513-053-04)<br />
4 Vials/Pack, 4 Packs/Case 4 Vials/Pack, 10 Packs/Case<br />
200 mcg/1 mL<br />
(NDC 55513-014-04)<br />
300 mcg/1 mL<br />
(NDC 55513-015-04)<br />
25 mcg/1 mL<br />
(NDC 55513-010-04)<br />
40 mcg/1 mL<br />
(NDC 55513-011-04)<br />
60 mcg/1 mL<br />
(NDC 55513-012-04)<br />
100 mcg/1 mL<br />
(NDC 55513-013-04)<br />
150 mcg/0.75 mL<br />
(NDC 55513-054-04)<br />
Page 180<br />
21
Single-dose Prefilled Syringe (SingleJect ® ) with a 27-gauge, ½-inch needle with an UltraSafe ®<br />
Needle Guard, Polysorbate Solution<br />
1 Syringe/Pack,<br />
4 Packs/Case<br />
200 mcg/0.4 mL<br />
(NDC 55513-028-01)<br />
300 mcg/0.6 mL<br />
(NDC 55513-111-01)<br />
500 mcg/1 mL<br />
(NDC 55513-032-01)<br />
4 Syringes/Pack, 4 Packs/Case 4 Syringes/Pack, 10 Packs/Case<br />
200 mcg/0.4 mL<br />
(NDC 55513-028-04)<br />
300 mcg/0.6 mL<br />
(NDC 55513-111-04)<br />
25 mcg/0.42 mL<br />
(NDC 55513-057-04)<br />
40 mcg/0.4 mL<br />
(NDC 55513-021-04)<br />
60 mcg/0.3 mL<br />
(NDC 55513-023-04)<br />
100 mcg/0.5 mL<br />
(NDC 55513-025-04)<br />
150 mcg/0.3 mL<br />
(NDC 55513-027-04)<br />
Single-dose Prefilled Syringe (SingleJect ® ) with a 27-gauge, ½-inch needle with an UltraSafe ®<br />
Needle Guard, Albumin Solution<br />
1 Syringe/Pack,<br />
4 Packs/Case<br />
200 mcg/0.4 mL<br />
(NDC 55513-044-01)<br />
300 mcg/0.6 mL<br />
(NDC 55513-046-01)<br />
500 mcg/1 mL<br />
(NDC 55513-048-01)<br />
4 Syringes/Pack, 4 Packs/Case 4 Syringes/Pack, 10 Packs/Case<br />
200 mcg/0.4 mL<br />
(NDC 55513-044-04)<br />
300 mcg/0.6 mL<br />
(NDC 55513-046-04)<br />
25 mcg/0.42 mL<br />
(NDC 55513-058-04)<br />
40 mcg/0.4 mL<br />
(NDC 55513-037-04)<br />
60 mcg/0.3 mL<br />
(NDC 55513-039-04)<br />
100 mcg/0.5 mL<br />
(NDC 55513-041-04)<br />
150 mcg/0.3 mL<br />
(NDC 55513-043-04)<br />
Page 181<br />
22
Single-dose Prefilled SureClick Autoinjector with a 27-gauge, ½-inch needle, Polysorbate Solution<br />
1 Autoinjector/Pack<br />
25 mcg/0.42 mL<br />
(NDC 55513-090-01)<br />
40 mcg/0.4 mL<br />
(NDC 55513-091-01)<br />
60 mcg/0.3 mL<br />
(NDC 55513-092-01)<br />
100 mcg/0.5 mL<br />
(NDC 55513-093-01)<br />
150 mcg/0.3 mL<br />
(NDC 55513-094-01)<br />
200 mcg/0.4 mL<br />
(NDC 55513-095-01)<br />
300 mcg/0.6 mL<br />
(NDC 55513-096-01)<br />
500 mcg/1 mL<br />
(NDC 55513-097-01)<br />
Single-dose Prefilled SureClick Autoinjector with a 27-gauge, ½-inch needle, Albumin Solution<br />
1 Autoinjector/Pack<br />
25 mcg/0.42 mL<br />
(NDC 55513-080-01)<br />
40 mcg/0.4 mL<br />
(NDC 55513-081-01)<br />
60 mcg/0.3 mL<br />
(NDC 55513-082-01)<br />
100 mcg/0.5 mL<br />
(NDC 55513-083-01)<br />
150 mcg/0.3 mL<br />
(NDC 55513-084-01)<br />
200 mcg/0.4 mL<br />
(NDC 55513-085-01)<br />
300 mcg/0.6 mL<br />
(NDC 55513-086-01)<br />
500 mcg/1 mL<br />
(NDC 55513-087-01)<br />
Page 182<br />
23
Storage<br />
Store at 2° to 8°C (36° to 46°F). Do not freeze or shake. Protect from light.<br />
REFERENCES<br />
1. Egrie JC, Browne JK. Development and characterization of novel erythropoiesis stimulating protein<br />
(NESP). Br J Cancer. 2001; 84 (suppl 1): 3-10.<br />
2. Singh AK, Szczech L, Tang KL, et al. Correction of <strong>Anemia</strong> with Epoetin Alfa in Chronic Kidney<br />
Disease. N Engl J Med. 2006; 355: 2085-98.<br />
3. Besarab A, Bolton WK, Browne JK, et al. The effects of normal as compared with low hematocrit<br />
values in patients with cardiac disease who are receiving hemodialysis and epoetin. N Engl J Med.<br />
1998; 339: 584-590.<br />
4. Leyland-Jones B, Semiglazov V, Pawlicki M, et al. Maintaining Normal Hemoglobin Levels With<br />
Epoetin Alfa in Mainly Nonanemic Patients With Metastatic Breast Cancer Receiving First-Line<br />
Chemotherapy: A Survival Study. JCO. 2005; 23(25): 1-13.<br />
5. Bohlius J, Wilson J, Seidenfeld J, et al. Recombinant Human Erythropoietins and Cancer Patients:<br />
Updated Meta-Analysis of 57 Studies Including 9353 Patients. J Natl Cancer Inst. 2006; 98: 708-14.<br />
Rx only<br />
This product, or its use, may be covered by one or more US Patents, including US Patent No. 5,618,698,<br />
in addition to others including patents pending.<br />
Manufactured by:<br />
<strong>Amgen</strong> Manufacturing, Limited, a subsidiary of <strong>Amgen</strong> Inc.<br />
One <strong>Amgen</strong> Center Drive<br />
Thousand Oaks, CA 91320-1799<br />
©2001-2010 <strong>Amgen</strong> Inc. All rights reserved.<br />
* UltraSafe ® is a registered trademark of Safety Syringes, Inc.<br />
1xxxxxx – v23<br />
Revised: 02/2010<br />
Page 183<br />
24
EPOGEN ®<br />
(Epoetin alfa)<br />
FOR INJECTION<br />
Page 184<br />
WARNINGS: INCREASED MORTALITY, SERIOUS CARDIOVASCULAR EVENTS,<br />
THROMBOEMBOLIC EVENTS, STROKE and INCREASED RISK OF TUMOR PROGRESSION OR<br />
RECURRENCE<br />
Chronic Renal Failure:<br />
• In clinical studies, patients experienced greater risks for death, serious cardiovascular<br />
events, and stroke when administered erythropoiesis-stimulating agents (ESAs) to target<br />
hemoglobin levels of 13 g/dL and above.<br />
• Individualize dosing to achieve and maintain hemoglobin levels within the range of 10 to<br />
12 g/dL.<br />
Cancer:<br />
• ESAs shortened overall survival and/or increased the risk of tumor progression or<br />
recurrence in some clinical studies in patients with breast, non-small cell lung, head and<br />
neck, lymphoid, and cervical cancers (see WARNINGS: Table 1).<br />
• To decrease these risks, as well as the risk of serious cardio- and thrombovascular<br />
events, use the lowest dose needed to avoid red blood cell transfusion.<br />
• Because of these risks, prescribers and hospitals must enroll in and comply with the<br />
ESA APPRISE Oncology Program to prescribe and/or dispense EPOGEN ® to patients<br />
with cancer. To enroll in the ESA APPRISE Oncology Program, visit www.esaapprise.com<br />
or call 1-866-284-8089 for further assistance.<br />
• Use ESAs only for treatment of anemia due to concomitant myelosuppressive<br />
chemotherapy.<br />
• ESAs are not indicated for patients receiving myelosuppressive therapy when the<br />
anticipated outcome is cure.<br />
• Discontinue following the completion of a chemotherapy course.<br />
Perisurgery: EPOGEN ® increased the rate of deep venous thromboses in patients not receiving<br />
prophylactic anticoagulation. Consider deep venous thrombosis prophylaxis.<br />
(See WARNINGS: Increased Mortality, Serious Cardiovascular Events, Thromboembolic Events,<br />
and Stroke, WARNINGS: Increased Mortality and/or Increased Risk of Tumor Progression or<br />
Recurrence, INDICATIONS AND USAGE, and DOSAGE AND ADMINISTRATION.)<br />
DESCRIPTION<br />
Erythropoietin is a glycoprotein which stimulates red blood cell production. It is produced in the kidney<br />
and stimulates the division and differentiation of committed erythroid progenitors in the bone marrow.<br />
EPOGEN ® (Epoetin alfa), a 165 amino acid glycoprotein manufactured by recombinant DNA<br />
technology, has the same biological effects as endogenous erythropoietin. 1 It has a molecular weight<br />
of 30,400 daltons and is produced by mammalian cells into which the human erythropoietin gene has<br />
been introduced. The product contains the identical amino acid sequence of isolated natural<br />
erythropoietin.<br />
1
Page 185<br />
EPOGEN ® is formulated as a sterile, colorless liquid in an isotonic sodium chloride/sodium citrate<br />
buffered solution or a sodium chloride/sodium phosphate buffered solution for intravenous (IV) or<br />
subcutaneous (SC) administration.<br />
Single-dose, Preservative-free Vial: Each 1 mL of solution contains 2000, 3000, 4000 or 10,000<br />
Units of Epoetin alfa, 2.5 mg Albumin (Human), 5.8 mg sodium citrate, 5.8 mg sodium chloride, and<br />
0.06 mg citric acid in Water for Injection, USP (pH 6.9 ± 0.3). This formulation contains no<br />
preservative.<br />
Single-dose, Preservative-free Vial: 1 mL (40,000 Units/mL). Each 1 mL of solution contains 40,000<br />
Units of Epoetin alfa, 2.5 mg Albumin (Human), 1.2 mg sodium phosphate monobasic monohydrate,<br />
1.8 mg sodium phosphate dibasic anhydrate, 0.7 mg sodium citrate, 5.8 mg sodium chloride, and 6.8<br />
mcg citric acid in Water for Injection, USP (pH 6.9 ± 0.3). This formulation contains no preservative.<br />
Multidose, Preserved Vial: 2 mL (20,000 Units, 10,000 Units/mL). Each 1 mL of solution contains<br />
10,000 Units of Epoetin alfa, 2.5 mg Albumin (Human), 1.3 mg sodium citrate, 8.2 mg sodium chloride,<br />
0.11 mg citric acid, and 1% benzyl alcohol as preservative in Water for Injection, USP (pH 6.1 ± 0.3).<br />
Multidose, Preserved Vial: 1 mL (20,000 Units/mL). Each 1 mL of solution contains 20,000 Units of<br />
Epoetin alfa, 2.5 mg Albumin (Human), 1.3 mg sodium citrate, 8.2 mg sodium chloride, 0.11 mg citric<br />
acid, and 1% benzyl alcohol as preservative in Water for Injection, USP (pH 6.1 ± 0.3).<br />
CLINICAL PHARMACOLOGY<br />
Chronic Renal Failure Patients<br />
Endogenous production of erythropoietin is normally regulated by the level of tissue oxygenation.<br />
Hypoxia and anemia generally increase the production of erythropoietin, which in turn stimulates<br />
erythropoiesis. 2 In normal subjects, plasma erythropoietin levels range from 0.01 to 0.03 Units/mL and<br />
increase up to 100- to 1000-fold during hypoxia or anemia. 2 In contrast, in patients with chronic renal<br />
failure (CRF), production of erythropoietin is impaired, and this erythropoietin deficiency is the primary<br />
cause of their anemia. 3,4<br />
Chronic renal failure is the clinical situation in which there is a progressive and usually irreversible<br />
decline in kidney function. Such patients may manifest the sequelae of renal dysfunction, including<br />
anemia, but do not necessarily require regular dialysis. Patients with end-stage renal disease (ESRD)<br />
are those patients with CRF who require regular dialysis or kidney transplantation for survival.<br />
EPOGEN ® has been shown to stimulate erythropoiesis in anemic patients with CRF, including both<br />
patients on dialysis and those who do not require regular dialysis. 4-12 The first evidence of a response<br />
to the three times weekly (TIW) administration of EPOGEN ® is an increase in the reticulocyte count<br />
within 10 days, followed by increases in the red cell count, hemoglobin, and hematocrit, usually within 2<br />
to 6 weeks. 4,5 Because of the length of time required for erythropoiesis — several days for erythroid<br />
progenitors to mature and be released into the circulation — a clinically significant increase in<br />
hematocrit is usually not observed in less than 2 weeks and may require up to 6 weeks in some<br />
patients. Once the hematocrit reaches the suggested target range (30% to 36%), that level can be<br />
sustained by EPOGEN ® therapy in the absence of iron deficiency and concurrent illnesses.<br />
The rate of hematocrit increase varies between patients and is dependent upon the dose of EPOGEN ® ,<br />
within a therapeutic range of approximately 50 to 300 Units/kg TIW. 4 A greater biologic response is not<br />
observed at doses exceeding 300 Units/kg TIW. 6 Other factors affecting the rate and extent of<br />
response include availability of iron stores, the baseline hematocrit, and the presence of concurrent<br />
medical problems.<br />
2
Zidovudine-treated HIV-infected Patients<br />
Responsiveness to EPOGEN ® in HIV-infected patients is dependent upon the endogenous serum<br />
erythropoietin level prior to treatment. Patients with endogenous serum erythropoietin levels ≤ 500<br />
mUnits/mL, and who are receiving a dose of zidovudine ≤ 4200 mg/week, may respond to EPOGEN ®<br />
therapy. Patients with endogenous serum erythropoietin levels > 500 mUnits/mL do not appear to<br />
respond to EPOGEN ® therapy. In a series of four clinical trials involving 255 patients, 60% to 80% of<br />
HIV-infected patients treated with zidovudine had endogenous serum erythropoietin levels ≤ 500<br />
mUnits/mL.<br />
Response to EPOGEN ® in zidovudine-treated HIV-infected patients is manifested by reduced<br />
transfusion requirements and increased hematocrit.<br />
Cancer Patients on Chemotherapy<br />
A series of clinical trials enrolled 131 anemic cancer patients who received EPOGEN ® TIW and who<br />
were receiving cyclic cisplatin- or non cisplatin-containing chemotherapy. Endogenous baseline serum<br />
erythropoietin levels varied among patients in these trials with approximately 75% (n = 83/110) having<br />
endogenous serum erythropoietin levels ≤ 132 mUnits/mL, and approximately 4% (n = 4/110) of<br />
patients having endogenous serum erythropoietin levels > 500 mUnits/mL. In general, patients with<br />
lower baseline serum erythropoietin levels responded more vigorously to EPOGEN ® than patients with<br />
higher baseline erythropoietin levels. Although no specific serum erythropoietin level can be stipulated<br />
above which patients would be unlikely to respond to EPOGEN ® therapy, treatment of patients with<br />
grossly elevated serum erythropoietin levels (eg, > 200 mUnits/mL) is not recommended.<br />
Pharmacokinetics<br />
In adult and pediatric patients with CRF, the elimination half-life of plasma erythropoietin after<br />
intravenously administered EPOGEN ® ranges from 4 to 13 hours. 13-15 The half-life is approximately<br />
20% longer in CRF patients than that in healthy subjects. After SC administration, peak plasma levels<br />
are achieved within 5 to 24 hours. The half-life is similar between adult patients with serum creatinine<br />
level greater than 3 and not on dialysis and those maintained on dialysis. The pharmacokinetic data<br />
indicate no apparent difference in EPOGEN ® half-life among adult patients above or below 65 years of<br />
age.<br />
The pharmacokinetic profile of EPOGEN ® in children and adolescents appears to be similar to that of<br />
adults. Limited data are available in neonates. 16 A study of 7 preterm very low birth weight neonates<br />
and 10 healthy adults given IV erythropoietin suggested that distribution volume was approximately 1.5<br />
to 2 times higher in the preterm neonates than in the healthy adults, and clearance was approximately<br />
3 times higher in the preterm neonates than in the healthy adults. 39<br />
The pharmacokinetics of EPOGEN ® have not been studied in HIV-infected patients.<br />
Page 186<br />
A pharmacokinetic study comparing 150 Units/kg SC TIW to 40,000 Units SC weekly dosing regimen<br />
was conducted for 4 weeks in healthy subjects (n = 12) and for 6 weeks in anemic cancer patients (n =<br />
32) receiving cyclic chemotherapy. There was no accumulation of serum erythropoietin after the 2<br />
dosing regimens during the study period. The 40,000 Units weekly regimen had a higher Cmax (3- to 7fold),<br />
longer Tmax (2- to 3-fold), higher AUC0-168h (2- to 3-fold) of erythropoietin and lower clearance<br />
(50%) than the 150 Units/kg TIW regimen. In anemic cancer patients, the average t1/2 was similar (40<br />
hours with range of 16 to 67 hours) after both dosing regimens. After the 150 Units/kg TIW dosing, the<br />
values of Tmax and clearance are similar (13.3 ± 12.4 vs. 14.2 ± 6.7 hours, and 20.2 ± 15.9 vs. 23.6 ±<br />
9.5 mL/h/kg) between Week 1 when patients were receiving chemotherapy (n = 14) and Week 3 when<br />
patients were not receiving chemotherapy (n = 4). Differences were observed after the 40,000 Units<br />
weekly dosing with longer Tmax (38 ± 18 hours) and lower clearance (9.2 ± 4.7 mL/h/kg) during Week 1<br />
3
Page 187<br />
when patients were receiving chemotherapy (n = 18) compared with those (22 ± 4.5 hours, 13.9 ± 7.6<br />
mL/h/kg) during Week 3 when patients were not receiving chemotherapy (n = 7).<br />
The bioequivalence between the 10,000 Units/mL citrate-buffered Epoetin alfa formulation and the<br />
40,000 Units/mL phosphate-buffered Epoetin alfa formulation has been demonstrated after SC<br />
administration of single 750 Units/kg doses to healthy subjects.<br />
INDICATIONS AND USAGE<br />
Treatment of <strong>Anemia</strong> of Chronic Renal Failure Patients<br />
EPOGEN ® is indicated for the treatment of anemia associated with CRF, including patients on dialysis<br />
and patients not on dialysis. EPOGEN ® is indicated to elevate or maintain the red blood cell level (as<br />
manifested by the hematocrit or hemoglobin determinations) and to decrease the need for transfusions<br />
in these patients.<br />
Non-dialysis patients with symptomatic anemia considered for therapy should have a hemoglobin less<br />
than 10 g/dL.<br />
EPOGEN ® is not intended for patients who require immediate correction of severe anemia. EPOGEN ®<br />
may obviate the need for maintenance transfusions but is not a substitute for emergency transfusion.<br />
Prior to initiation of therapy, the patient’s iron stores should be evaluated. Transferrin saturation should<br />
be at least 20% and ferritin at least 100 ng/mL. Blood pressure should be adequately controlled prior to<br />
initiation of EPOGEN ® therapy, and must be closely monitored and controlled during therapy.<br />
Treatment of <strong>Anemia</strong> in Zidovudine-treated HIV-infected Patients<br />
EPOGEN ® is indicated for the treatment of anemia related to therapy with zidovudine in HIV-infected<br />
patients. EPOGEN ® is indicated to elevate or maintain the red blood cell level (as manifested by the<br />
hematocrit or hemoglobin determinations) and to decrease the need for transfusions in these patients.<br />
EPOGEN ® is not indicated for the treatment of anemia in HIV-infected patients due to other factors<br />
such as iron or folate deficiencies, hemolysis, or gastrointestinal bleeding, which should be managed<br />
appropriately. EPOGEN ® use has not been demonstrated in controlled clinical trials to improve<br />
symptoms of anemia, quality of life, fatigue, or patient well-being.<br />
EPOGEN ® , at a dose of 100 Units/kg TIW, is effective in decreasing the transfusion requirement and<br />
increasing the red blood cell level of anemic, HIV-infected patients treated with zidovudine, when the<br />
endogenous serum erythropoietin level is ≤ 500 mUnits/mL and when patients are receiving a dose of<br />
zidovudine ≤ 4200 mg/week.<br />
Treatment of <strong>Anemia</strong> in Cancer Patients on Chemotherapy<br />
EPOGEN ® is indicated for the treatment of anemia due to the effect of concomitantly administered<br />
chemotherapy based on studies that have shown a reduction in the need for RBC transfusions in<br />
patients with metastatic, non-myeloid malignancies receiving chemotherapy for a minimum of 2 months.<br />
Studies to determine whether EPOGEN ® increases mortality or decreases progression-free/recurrencefree<br />
survival are ongoing.<br />
• EPOGEN ® is not indicated for use in patients receiving hormonal agents, therapeutic biologic<br />
products, or radiotherapy unless receiving concomitant myelosuppressive chemotherapy.<br />
• EPOGEN ® is not indicated for patients receiving myelosuppressive therapy when the<br />
anticipated outcome is cure due to the absence of studies that adequately characterize the<br />
impact of EPOGEN ® on progression-free and overall survival (see WARNINGS: Increased<br />
Mortality and/or Increased Risk of Tumor Progression or Recurrence).<br />
4
• EPOGEN ® is not indicated for the treatment of anemia in cancer patients due to other factors<br />
such as iron or folate deficiencies, hemolysis, or gastrointestinal bleeding (see PRECAUTIONS:<br />
Lack or Loss of Response).<br />
• EPOGEN ® use has not been demonstrated in controlled clinical trials to improve symptoms of<br />
anemia, quality of life, fatigue, or patient well-being.<br />
Reduction of Allogeneic Blood Transfusion in Surgery Patients<br />
EPOGEN ® is indicated for the treatment of anemic patients (hemoglobin > 10 to ≤ 13 g/dL) who are at<br />
high risk for perioperative blood loss from elective, noncardiac, nonvascular surgery to reduce the need<br />
for allogeneic blood transfusions. 17-19 EPOGEN ® is not indicated for anemic patients who are willing to<br />
donate autologous blood (see BOXED WARNINGS and DOSAGE AND ADMINISTRATION).<br />
CLINICAL EXPERIENCE: RESPONSE TO EPOGEN ®<br />
Chronic Renal Failure Patients<br />
When dosed with EPOGEN ® , patients responded with an increase in hematocrit. 5 After 3 months on<br />
study, more than 95% of patients were transfusion-independent.<br />
In the presence of adequate iron stores (see IRON EVALUATION), the time to reach the target<br />
hematocrit is a function of the baseline hematocrit and the rate of hematocrit rise.<br />
The rate of increase in hematocrit is dependent upon the dose of EPOGEN ® administered and<br />
individual patient variation. In clinical trials at starting doses of 50 to 150 Units/kg TIW, adult patients<br />
responded with an average rate of hematocrit rise of:<br />
Starting Dose Hematocrit Increase<br />
(TIW IV) Points/Day Points/2 Weeks<br />
50 Units/kg 0.11 1.5<br />
100 Units/kg 0.18 2.5<br />
150 Units/kg 0.25 3.5<br />
Page 188<br />
In a 26 week, double-blind, placebo-controlled trial, 118 anemic dialysis patients with an average<br />
hemoglobin of approximately 7 g/dL were randomized to either EPOGEN ® or placebo. By the end of<br />
the study, average hemoglobin increased to approximately 11 g/dL in the EPOGEN ® -treated patients<br />
and remained unchanged in patients receiving placebo. EPOGEN ® -treated patients experienced<br />
improvements in exercise tolerance and patient-reported physical functioning at month 2 that was<br />
maintained throughout the study.<br />
Adult Patients on Dialysis: Thirteen clinical studies were conducted, involving IV administration to a<br />
total of 1010 anemic patients on dialysis for 986 patient-years of EPOGEN ® therapy. In the three<br />
largest of these clinical trials, the median maintenance dose necessary to maintain the hematocrit<br />
between 30% to 36% was approximately 75 Units/kg TIW. In the US multicenter phase 3 study,<br />
approximately 65% of the patients required doses of 100 Units/kg TIW, or less, to maintain their<br />
hematocrit at approximately 35%. Almost 10% of patients required a dose of 25 Units/kg, or less, and<br />
approximately 10% required a dose of more than 200 Units/kg TIW to maintain their hematocrit at this<br />
level.<br />
A multicenter unit dose study was also conducted in 119 patients receiving peritoneal dialysis who selfadministered<br />
EPOGEN ® subcutaneously for approximately 109 patient-years of experience. Patients<br />
responded to EPOGEN ® administered SC in a manner similar to patients receiving IV administration. 20<br />
5
Page 189<br />
Pediatric Patients on Dialysis: One hundred twenty-eight children from 2 months to 19 years of age with<br />
CRF requiring dialysis were enrolled in 4 clinical studies of EPOGEN ® . The largest study was a<br />
placebo-controlled, randomized trial in 113 children with anemia (hematocrit ≤ 27%) undergoing<br />
peritoneal dialysis or hemodialysis. The initial dose of EPOGEN ® was 50 Units/kg IV or SC TIW. The<br />
dose of study drug was titrated to achieve either a hematocrit of 30% to 36% or an absolute increase in<br />
hematocrit of 6 percentage points over baseline.<br />
At the end of the initial 12 weeks, a statistically significant rise in mean hematocrit (9.4% vs 0.9%) was<br />
observed only in the EPOGEN ® arm. The proportion of children achieving a hematocrit of 30%, or an<br />
increase in hematocrit of 6 percentage points over baseline, at any time during the first 12 weeks was<br />
higher in the EPOGEN ® arm (96% vs 58%). Within 12 weeks of initiating EPOGEN ® therapy, 92.3% of<br />
the pediatric patients were transfusion-independent as compared to 65.4% who received placebo.<br />
Among patients who received 36 weeks of EPOGEN ® , hemodialysis patients required a higher median<br />
maintenance dose (167 Units/kg/week [n = 28] vs 76 Units/kg/week [n = 36]) and took longer to achieve<br />
a hematocrit of 30% to 36% (median time to response 69 days vs 32 days) than patients undergoing<br />
peritoneal dialysis.<br />
Patients With CRF Not Requiring Dialysis<br />
Four clinical trials were conducted in patients with CRF not on dialysis involving 181 patients treated<br />
with EPOGEN ® for approximately 67 patient-years of experience. These patients responded to<br />
EPOGEN ® therapy in a manner similar to that observed in patients on dialysis. Patients with CRF not<br />
on dialysis demonstrated a dose-dependent and sustained increase in hematocrit when EPOGEN ® was<br />
administered by either an IV or SC route, with similar rates of rise of hematocrit when EPOGEN ® was<br />
administered by either route. Moreover, EPOGEN ® doses of 75 to 150 Units/kg per week have been<br />
shown to maintain hematocrits of 36% to 38% for up to 6 months. 21-22<br />
Zidovudine-treated HIV-infected Patients<br />
Efficacy in HIV-infected patients with anemia related to therapy with zidovudine was demonstrated<br />
based on reduction in the requirement for RBC transfusions.<br />
EPOGEN ® has been studied in four placebo-controlled trials enrolling 297 anemic (hematocrit < 30%)<br />
HIV-infected (AIDS) patients receiving concomitant therapy with zidovudine (all patients were treated<br />
with Epoetin alfa manufactured by <strong>Amgen</strong> Inc). In the subgroup of patients (89/125 EPOGEN ® and<br />
88/130 placebo) with prestudy endogenous serum erythropoietin levels ≤ 500 mUnits/mL, EPOGEN ®<br />
reduced the mean cumulative number of units of blood transfused per patient by approximately 40% as<br />
compared to the placebo group. 24 Among those patients who required transfusions at baseline, 43% of<br />
patients treated with EPOGEN ® versus 18% of placebo-treated patients were transfusion-independent<br />
during the second and third months of therapy. EPOGEN ® therapy also resulted in significant<br />
increases in hematocrit in comparison to placebo. When examining the results according to the weekly<br />
dose of zidovudine received during month 3 of therapy, there was a statistically significant (p < 0.003)<br />
reduction in transfusion requirements in patients treated with EPOGEN ® (n = 51) compared to placebo<br />
treated patients (n = 54) whose mean weekly zidovudine dose was ≤ 4200 mg/week. 23<br />
Approximately 17% of the patients with endogenous serum erythropoietin levels ≤ 500 mUnits/mL<br />
receiving EPOGEN ® in doses from 100 to 200 Units/kg TIW achieved a hematocrit of 38% without<br />
administration of transfusions or significant reduction in zidovudine dose. In the subgroup of patients<br />
whose prestudy endogenous serum erythropoietin levels were > 500 mUnits/mL, EPOGEN ® therapy<br />
did not reduce transfusion requirements or increase hematocrit, compared to the corresponding<br />
responses in placebo-treated patients.<br />
6
In a 6 month open-label EPOGEN ® study, patients responded with decreased transfusion requirements<br />
and sustained increases in hematocrit and hemoglobin with doses of EPOGEN ® up to 300 Units/kg<br />
TIW. 23-25<br />
Responsiveness to EPOGEN ® therapy may be blunted by intercurrent infectious/inflammatory episodes<br />
and by an increase in zidovudine dosage. Consequently, the dose of EPOGEN ® must be titrated based<br />
on these factors to maintain the desired erythropoietic response.<br />
Cancer Patients on Chemotherapy<br />
Adult Patients<br />
Efficacy in patients with anemia due to concomitant chemotherapy was demonstrated based on<br />
reduction in the requirement for RBC transfusions.<br />
Three-Times Weekly (TIW) Dosing<br />
EPOGEN ® administered TIW has been studied in a series of six placebo-controlled, double-blind trials<br />
that enrolled 131 anemic cancer patients receiving EPOGEN ® or matching placebo. Across all studies,<br />
72 patients were treated with concomitant non cisplatin-containing chemotherapy regimens and 59<br />
patients were treated with concomitant cisplatin-containing chemotherapy regimens. Patients were<br />
randomized to EPOGEN ® 150 Units/kg or placebo subcutaneously TIW for 12 weeks in each study.<br />
The results of the pooled data from these six studies are shown in the table below. Because of the<br />
length of time required for erythropoiesis and red cell maturation, the efficacy of EPOGEN ® (reduction<br />
in proportion of patients requiring transfusions) is not manifested until 2 to 6 weeks after initiation of<br />
EPOGEN ® .<br />
Chemotherapy<br />
Regimen<br />
Proportion of Patients Transfused During Chemotherapy<br />
(Efficacy Population a )<br />
On Study b During Months 2 and 3 c<br />
Page 190<br />
EPOGEN ® Placebo EPOGEN ® Placebo<br />
Regimens without<br />
cisplatin<br />
44% (15/34) 44% (16/36) 21% (6/29) 33% (11/33)<br />
Regimens<br />
containing cisplatin<br />
50% (14/28) 63% (19/30) 23% (5/22) d<br />
56% (14/25)<br />
Combined 47% (29/62) 53% (35/66) 22% (11/51) d<br />
43% (25/58)<br />
a ®<br />
Limited to patients remaining on study at least 15 days (1 patient excluded from EPOGEN , 2 patients excluded from<br />
placebo).<br />
b<br />
c<br />
d<br />
Includes all transfusions from day 1 through the end of study.<br />
Limited to patients remaining on study beyond week 6 and includes only transfusions during weeks 5-12.<br />
Unadjusted 2-sided p < 0.05<br />
Intensity of chemotherapy in the above trials was not directly assessed, however the degree and timing<br />
of neutropenia was comparable across all trials. Available evidence suggests that patients with<br />
lymphoid and solid cancers respond similarly to EPOGEN ® therapy, and that patients with or without<br />
tumor infiltration of the bone marrow respond similarly to EPOGEN ® therapy.<br />
Weekly (QW) Dosing<br />
EPOGEN ® was also studied in a placebo-controlled, double-blind trial utilizing weekly dosing in a total<br />
of 344 anemic cancer patients. In this trial, 61 (35 placebo arm and 26 in the EPOGEN ® arm) patients<br />
were treated with concomitant cisplatin containing regimens and 283 patients received concomitant<br />
chemotherapy regimens that did not contain cisplatinum. Patients were randomized to EPOGEN ®<br />
7
40,000 Units weekly (n = 174) or placebo (n = 170) SC for a planned treatment period of 16 weeks. If<br />
hemoglobin had not increased by > 1 g/dL after 4 weeks of therapy or the patient received RBC<br />
transfusion during the first 4 weeks of therapy, study drug was increased to 60,000 Units weekly.<br />
Forty-three percent of patients in the Epoetin alfa group required an increase in EPOGEN ® dose to<br />
60,000 Units weekly. 23<br />
Results demonstrated that EPOGEN ® therapy reduced the proportion of patients transfused in day 29<br />
through week 16 of the study as compared to placebo. Twenty-five patients (14%) in the EPOGEN ®<br />
group received transfusions compared to 48 patients (28%) in the placebo group (p = 0.0010) between<br />
day 29 and week 16 or the last day on study.<br />
Comparable intensity of chemotherapy for patients enrolled in the two study arms was suggested by<br />
similarities in mean dose and frequency of administration for the 10 most commonly administered<br />
chemotherapy agents, and similarity in the incidence of changes in chemotherapy during the trial in the<br />
two arms.<br />
Pediatric Patients<br />
The safety and effectiveness of EPOGEN ® were evaluated in a randomized, double-blind, placebocontrolled,<br />
multicenter study in anemic patients ages 5 to 18 receiving chemotherapy for the treatment<br />
of various childhood malignancies. Two hundred twenty-two patients were randomized (1:1) to<br />
EPOGEN ® or placebo. EPOGEN ® was administered at 600 Units/kg (maximum 40,000 Units)<br />
intravenously once per week for 16 weeks. If hemoglobin had not increased by 1g/dL after the first 4-5<br />
weeks of therapy, EPOGEN ® was increased to 900 Units/kg (maximum 60,000 Units). Among the<br />
EPOGEN ® -treated patients 60% required dose escalation to 900 Units/kg/week.<br />
The effect of EPOGEN ® on transfusion requirements is shown in the table below:<br />
Percentage of Patients Transfused:<br />
On Study a<br />
After 28 Days<br />
Post-Randomization<br />
EPOGEN ®<br />
Placebo<br />
EPOGEN<br />
(n=111)<br />
(n=111)<br />
®<br />
Placebo<br />
(n= 111)<br />
(n=111)<br />
65% (72) 77% (86) 51%(57) b<br />
69% (77)<br />
a<br />
Includes all transfusions from day 1 through the end of study<br />
b<br />
Adjusted 2 sided p 10 to ≤ 13 (n = 96), and > 13 to ≤ 15 g/dL (n = 218)] and then randomly<br />
assigned to receive 300 Units/kg EPOGEN ® , 100 Units/kg EPOGEN ® or placebo by SC injection for 10<br />
days before surgery, on the day of surgery, and for 4 days after surgery. 17 All patients received oral<br />
iron and a low-dose post-operative warfarin regimen. 17<br />
8
Treatment with EPOGEN ® 300 Units/kg significantly (p = 0.024) reduced the risk of allogeneic<br />
transfusion in patients with a pretreatment hemoglobin of > 10 to ≤ 13; 5/31 (16%) of EPOGEN ® 300<br />
Units/kg, 6/26 (23%) of EPOGEN ® 100 Units/kg, and 13/29 (45%) of placebo-treated patients were<br />
transfused. 17 There was no significant difference in the number of patients transfused between<br />
EPOGEN ® (9% 300 Units/kg, 6% 100 Units/kg) and placebo (13%) in the > 13 to ≤ 15 g/dL hemoglobin<br />
stratum. There were too few patients in the ≤ 10 g/dL group to determine if EPOGEN ® is useful in this<br />
hemoglobin strata. In the > 10 to ≤ 13 g/dL pretreatment stratum, the mean number of units transfused<br />
per EPOGEN ® -treated patient (0.45 units blood for 300 Units/kg, 0.42 units blood for 100 Units/kg) was<br />
less than the mean transfused per placebo-treated patient (1.14 units) (overall p = 0.028). In addition,<br />
mean hemoglobin, hematocrit, and reticulocyte counts increased significantly during the presurgery<br />
period in patients treated with EPOGEN ® . 17<br />
EPOGEN ® was also studied in an open-label, parallel-group trial enrolling 145 subjects with a<br />
pretreatment hemoglobin level of ≥ 10 to ≤ 13 g/dL who were scheduled for major orthopedic hip or<br />
knee surgery and who were not participating in an autologous program. 18 Subjects were randomly<br />
assigned to receive one of two SC dosing regimens of EPOGEN ® (600 Units/kg once weekly for 3<br />
weeks prior to surgery and on the day of surgery, or 300 Units/kg once daily for 10 days prior to<br />
surgery, on the day of surgery and for 4 days after surgery). All subjects received oral iron and<br />
appropriate pharmacologic anticoagulation therapy.<br />
From pretreatment to presurgery, the mean increase in hemoglobin in the 600 Units/kg weekly group<br />
(1.44 g/dL) was greater than observed in the 300 Units/kg daily group. 18 The mean increase in<br />
absolute reticulocyte count was smaller in the weekly group (0.11 x 10 6 /mm 3 ) compared to the daily<br />
group (0.17 x 10 6 /mm 3 ). Mean hemoglobin levels were similar for the two treatment groups throughout<br />
the postsurgical period.<br />
The erythropoietic response observed in both treatment groups resulted in similar transfusion rates<br />
[11/69 (16%) in the 600 Units/kg weekly group and 14/71 (20%) in the 300 Units/kg daily group]. 18 The<br />
mean number of units transfused per subject was approximately 0.3 units in both treatment groups.<br />
CONTRAINDICATIONS<br />
EPOGEN ® is contraindicated in patients with:<br />
1. Uncontrolled hypertension.<br />
2. Known hypersensitivity to mammalian cell-derived products.<br />
3. Known hypersensitivity to Albumin (Human).<br />
WARNINGS<br />
Pediatrics<br />
Risk in Premature Infants<br />
The multidose preserved formulation contains benzyl alcohol. Benzyl alcohol has been reported to be<br />
associated with an increased incidence of neurological and other complications in premature infants<br />
which are sometimes fatal.<br />
Adults<br />
Page 192<br />
Increased Mortality, Serious Cardiovascular Events, Thromboembolic Events, and Stroke<br />
Patients with chronic renal failure experienced greater risks for death, serious cardiovascular events,<br />
and stroke when administered erythropoiesis-stimulating agents (ESAs) to target hemoglobin levels of<br />
9
Page 193<br />
13 g/dL and above in clinical studies. Patients with chronic renal failure and an insufficient hemoglobin<br />
response to ESA therapy may be at even greater risk for cardiovascular events and mortality than other<br />
patients. EPOGEN ® and other ESAs increased the risks for death and serious cardiovascular events in<br />
controlled clinical trials of patients with cancer. These events included myocardial infarction, stroke,<br />
congestive heart failure, and hemodialysis vascular access thrombosis. A rate of hemoglobin rise of ><br />
1 g/dL over 2 weeks may contribute to these risks.<br />
In a randomized prospective trial, 1432 anemic chronic renal failure patients who were not undergoing<br />
dialysis were assigned to Epoetin alfa (rHuEPO) treatment targeting a maintenance hemoglobin<br />
concentration of 13.5 g/dL or 11.3 g/dL. A major cardiovascular event (death, myocardial infarction,<br />
stroke, or hospitalization for congestive heart failure) occurred among 125 (18%) of the 715 patients in<br />
the higher hemoglobin group compared to 97 (14%) among the 717 patients in the lower hemoglobin<br />
group (HR 1.3, 95% CI: 1.0, 1.7, p = 0.03). 40<br />
In a randomized, double-blind, placebo-controlled study of 4038 patients, there was an increased risk of<br />
stroke when darbepoetin alfa was administered to patients with anemia, type 2 diabetes, and CRF who<br />
were not on dialysis. Patients were randomized to darbepoetin alfa treatment targeted to a hemoglobin<br />
level of 13 g/dL or to placebo. Placebo patients received darbepoetin alfa only if their hemoglobin<br />
levels were less than 9 g/dL. A total of 101 patients receiving darbepoetin alfa experienced stroke<br />
compared to 53 patients receiving placebo (5% vs. 2.6%; HR 1.92, 95% CI: 1.38, 2.68; p < 0.001).<br />
Increased risk for serious cardiovascular events was also reported from a randomized, prospective trial<br />
of 1265 hemodialysis patients with clinically evident cardiac disease (ischemic heart disease or<br />
congestive heart failure). In this trial, patients were assigned to EPOGEN ® treatment targeted to a<br />
maintenance hematocrit of either 42 ± 3% or 30 ± 3%. 37 Increased mortality was observed in 634<br />
patients randomized to a target hematocrit of 42% [221 deaths (35% mortality)] compared to 631<br />
patients targeted to remain at a hematocrit of 30% [185 deaths (29% mortality)]. The reason for the<br />
increased mortality observed in this study is unknown, however, the incidence of non-fatal myocardial<br />
infarctions (3.1% vs. 2.3%), vascular access thromboses (39% vs. 29%), and all other thrombotic<br />
events (22% vs. 18%) were also higher in the group randomized to achieve a hematocrit of 42%. An<br />
increased incidence of thrombotic events has also been observed in patients with cancer treated with<br />
erythropoietic agents.<br />
In a randomized controlled study (referred to as Cancer Study 1 - the ‘BEST’ study) with another ESA<br />
in 939 women with metastatic breast cancer receiving chemotherapy, patients received either weekly<br />
Epoetin alfa or placebo for up to a year. This study was designed to show that survival was superior<br />
when an ESA was administered to prevent anemia (maintain hemoglobin levels between 12 and 14<br />
g/dL or hematocrit between 36% and 42%). The study was terminated prematurely when interim<br />
results demonstrated that a higher mortality at 4 months (8.7% vs. 3.4%) and a higher rate of fatal<br />
thrombotic events (1.1% vs. 0.2%) in the first 4 months of the study were observed among patients<br />
treated with Epoetin alfa. Based on Kaplan-Meier estimates, at the time of study termination, the 12month<br />
survival was lower in the Epoetin alfa group than in the placebo group (70% vs. 76%; HR 1.37,<br />
95% CI: 1.07, 1.75; p = 0.012). 43<br />
A systematic review of 57 randomized controlled trials (including Cancer Studies 1 and 5 - the ‘BEST’<br />
and ‘ENHANCE’ studies) evaluating 9353 patients with cancer compared ESAs plus red blood cell<br />
transfusion with red blood cell transfusion alone for prophylaxis or treatment of anemia in cancer<br />
patients with or without concurrent antineoplastic therapy. An increased relative risk of thromboembolic<br />
events (RR 1.67, 95% CI: 1.35, 2.06; 35 trials and 6769 patients) was observed in ESA-treated<br />
patients. An overall survival hazard ratio of 1.08 (95% CI: 0.99, 1.18; 42 trials and 8167 patients) was<br />
observed in ESA-treated patients. 41<br />
10
An increased incidence of deep vein thrombosis (DVT) in patients receiving Epoetin alfa undergoing<br />
surgical orthopedic procedures has been observed (see ADVERSE REACTIONS, Surgery Patients:<br />
Thrombotic/Vascular Events). In a randomized controlled study (referred to as the ‘SPINE’ study), 681<br />
adult patients, not receiving prophylactic anticoagulation and undergoing spinal surgery, received either<br />
4 doses of 600 U/kg Epoetin alfa (7, 14, and 21 days before surgery, and the day of surgery) and<br />
standard of care (SOC) treatment, or SOC treatment alone. Preliminary analysis showed a higher<br />
incidence of DVT, determined by either Color Flow Duplex Imaging or by clinical symptoms, in the<br />
Epoetin alfa group [16 patients (4.7%)] compared to the SOC group [7 patients (2.1%)]. In addition,<br />
12 patients in the Epoetin alfa group and 7 patients in the SOC group had other thrombotic vascular<br />
events. Deep venous thrombosis prophylaxis should be strongly considered when ESAs are used for<br />
the reduction of allogeneic RBC transfusions in surgical patients (see BOXED WARNINGS and<br />
DOSAGE AND ADMINISTRATION).<br />
Increased mortality was also observed in a randomized placebo-controlled study of EPOGEN ® in adult<br />
patients who were undergoing coronary artery bypass surgery (7 deaths in 126 patients randomized to<br />
EPOGEN ® versus no deaths among 56 patients receiving placebo). Four of these deaths occurred<br />
during the period of study drug administration and all four deaths were associated with thrombotic<br />
events. 42 ESAs are not approved for reduction of allogeneic red blood cell transfusions in patients<br />
scheduled for cardiac surgery.<br />
Increased Mortality and/or Increased Risk of Tumor Progression or Recurrence<br />
Erythropoiesis-stimulating agents resulted in decreased locoregional control/progression-free survival<br />
and/or overall survival (see Table 1). These findings were observed in studies of patients with<br />
advanced head and neck cancer receiving radiation therapy (Cancer Studies 5 and 6), in patients<br />
receiving chemotherapy for metastatic breast cancer (Cancer Study 1) or lymphoid malignancy (Cancer<br />
Study 2), and in patients with non-small cell lung cancer or various malignancies who were not<br />
receiving chemotherapy or radiotherapy (Cancer Studies 7 and 8).<br />
Table 1: Randomized, Controlled Trials with Decreased Survival and/or Decreased Locoregional<br />
Control<br />
Study / Tumor / (n)<br />
Chemotherapy<br />
Cancer Study 1<br />
Metastatic breast<br />
cancer<br />
(n=939)<br />
Cancer Study 2<br />
Lymphoid<br />
malignancy<br />
(n=344)<br />
Cancer Study 3<br />
Early breast cancer<br />
(n=733)<br />
Hemoglobin<br />
Target<br />
12-14 g/dL<br />
13-15 g/dL (M)<br />
13-14 g/dL (F)<br />
12.5-13 g/dL<br />
Achieved<br />
Hemoglobin<br />
(Median<br />
Q1,Q3)<br />
12.9 g/dL<br />
12.2, 13.3 g/dL<br />
11.0 g/dL<br />
9.8, 12.1 g/dL<br />
13.1 g/dL<br />
12.5, 13.7 g/dL<br />
Primary Endpoint<br />
12-month overall<br />
survival<br />
Proportion of<br />
patients achieving<br />
a hemoglobin<br />
response<br />
Relapse-free and<br />
overall survival<br />
Page 194<br />
Adverse Outcome for ESA-containing<br />
Arm<br />
Decreased 12-month survival<br />
Decreased overall survival<br />
Decreased 3 yr. relapse-free and overall<br />
survival<br />
11
Cancer Study 4<br />
Cervical Cancer<br />
(n=114)<br />
Radiotherapy Alone<br />
Cancer Study 5<br />
Head and neck<br />
cancer<br />
(n=351)<br />
Cancer Study 6<br />
Head and neck<br />
cancer<br />
(n=522)<br />
12-14 g/dL<br />
≥15 g/dL (M)<br />
≥14 g/dL (F)<br />
No Chemotherapy or Radiotherapy<br />
Cancer Study 7<br />
Non-small cell lung<br />
cancer<br />
(n=70)<br />
Cancer Study 8<br />
Non-myeloid<br />
malignancy<br />
(n=989)<br />
12.7 g/dL<br />
12.1, 13.3 g/dL<br />
Not available<br />
14-15.5 g/dL Not available<br />
Progression-free<br />
and overall survival<br />
and locoregional<br />
control<br />
Locoregional<br />
progression-free<br />
survival<br />
Locoregional<br />
disease control<br />
Decreased 3 yr. progression-free and<br />
overall survival and locoregional control<br />
Decreased 5-year locoregional<br />
progression-free survival<br />
Decreased overall survival<br />
Decreased locoregional disease control<br />
12-14 g/dL Not available Quality of life Decreased overall survival<br />
12-13 g/dL<br />
Decreased overall survival:<br />
10.6 g/dL<br />
9.4, 11.8 g/dL<br />
Page 195<br />
RBC transfusions Decreased overall survival<br />
Cancer Study 1 (the ‘BEST’ study) was previously described (see WARNINGS: Increased Mortality,<br />
Serious Cardiovascular Events, Thromboembolic Events, and Stroke). Mortality at 4 months (8.7% vs.<br />
3.4%) was significantly higher in the Epoetin alfa arm. The most common investigator-attributed cause<br />
of death within the first 4 months was disease progression; 28 of 41 deaths in the Epoetin alfa arm and<br />
13 of 16 deaths in the placebo arm were attributed to disease progression. Investigator assessed time<br />
to tumor progression was not different between the two groups. Survival at 12 months was significantly<br />
lower in the Epoetin alfa arm (70% vs. 76%, HR 1.37, 95% CI: 1.07, 1.75; p = 0.012). 43<br />
Cancer Study 2 was a Phase 3, double-blind, randomized (darbepoetin alfa vs. placebo) study<br />
conducted in 344 anemic patients with lymphoid malignancy receiving chemotherapy. With a median<br />
follow-up of 29 months, overall mortality rates were significantly higher among patients randomized to<br />
darbepoetin alfa as compared to placebo (HR 1.36, 95% CI: 1.02, 1.82).<br />
Cancer Study 7 was a Phase 3, multicenter, randomized (Epoetin alfa vs. placebo), double-blind study,<br />
in which patients with advanced non-small cell lung cancer receiving only palliative radiotherapy or no<br />
active therapy were treated with Epoetin alfa to achieve and maintain hemoglobin levels between 12<br />
and 14 g/dL. Following an interim analysis of 70 of 300 patients planned, a significant difference in<br />
survival in favor of the patients on the placebo arm of the trial was observed (median survival 63 vs.<br />
129 days; HR 1.84; p = 0.04).<br />
Cancer Study 8 was a Phase 3, double-blind, randomized (darbepoetin alfa vs. placebo), 16-week<br />
study in 989 anemic patients with active malignant disease, neither receiving nor planning to receive<br />
chemotherapy or radiation therapy. There was no evidence of a statistically significant reduction in<br />
proportion of patients receiving RBC transfusions. The median survival was shorter in the darbepoetin<br />
alfa treatment group (8 months) compared with the placebo group (10.8 months); HR 1.30, 95% CI:<br />
1.07, 1.57.<br />
12
Decreased progression-free survival and overall survival:<br />
Cancer Study 3 (the ‘PREPARE’ study) was a randomized controlled study in which darbepoetin alfa<br />
was administered to prevent anemia conducted in 733 women receiving neo-adjuvant breast cancer<br />
treatment. After a median follow-up of approximately 3 years, the survival rate (86% vs. 90%, HR 1.42,<br />
95% CI: 0.93, 2.18) and relapse-free survival rate (72% vs. 78%, HR 1.33, 95% CI: 0.99, 1.79) were<br />
lower in the darbepoetin alfa-treated arm compared to the control arm.<br />
Cancer Study 4 (protocol GOG 191) was a randomized controlled study that enrolled 114 of a planned<br />
460 cervical cancer patients receiving chemotherapy and radiotherapy. Patients were randomized to<br />
receive Epoetin alfa to maintain hemoglobin between 12 and 14 g/dL or to transfusion support as<br />
needed. The study was terminated prematurely due to an increase in thromboembolic events in<br />
Epoetin alfa-treated patients compared to control (19% vs. 9%). Both local recurrence (21% vs. 20%)<br />
and distant recurrence (12% vs. 7%) were more frequent in Epoetin alfa-treated patients compared to<br />
control. Progression-free survival at 3 years was lower in the Epoetin alfa-treated group compared to<br />
control (59% vs. 62%, HR 1.06, 95% CI: 0.58, 1.91). Overall survival at 3 years was lower in the<br />
Epoetin alfa-treated group compared to control (61% vs. 71%, HR 1.28, 95% CI: 0.68, 2.42).<br />
Cancer Study 5 (the ‘ENHANCE’ study) was a randomized controlled study in 351 head and neck<br />
cancer patients where Epoetin beta or placebo was administered to achieve target hemoglobin of 14<br />
and 15 g/dL for women and men, respectively. Locoregional progression-free survival was significantly<br />
shorter in patients receiving Epoetin beta (HR 1.62, 95% CI: 1.22, 2.14; p = 0.0008) with a median of<br />
406 days Epoetin beta vs. 745 days placebo. Overall survival was significantly shorter in patients<br />
receiving Epoetin beta (HR 1.39, 95% CI: 1.05, 1.84; p = 0.02). 38<br />
Decreased locoregional control:<br />
Cancer Study 6 (DAHANCA 10) was conducted in 522 patients with primary squamous cell carcinoma<br />
of the head and neck receiving radiation therapy randomized to darbepoetin alfa with radiotherapy or<br />
radiotherapy alone. An interim analysis on 484 patients demonstrated that locoregional control at 5<br />
years was significantly shorter in patients receiving darbepoetin alfa (RR 1.44, 95% CI: 1.06, 1.96; p =<br />
0.02). Overall survival was shorter in patients receiving darbepoetin alfa (RR 1.28, 95% CI: 0.98, 1.68;<br />
p = 0.08).<br />
ESA APPRISE Oncology Program<br />
Page 196<br />
Prescribers and hospitals must enroll in and comply with the ESA APPRISE Oncology Program to<br />
prescribe and/or dispense EPOGEN ® to patients with cancer. To enroll, visit www.esa-apprise.com or<br />
call 1-866-284-8089 for further assistance. Additionally, prescribers and patients must provide written<br />
acknowledgement of a discussion of the risks associated with EPOGEN ® .<br />
Pure Red Cell Aplasia<br />
Cases of pure red cell aplasia (PRCA) and of severe anemia, with or without other cytopenias,<br />
associated with neutralizing antibodies to erythropoietin have been reported in patients treated with<br />
EPOGEN ® . This has been reported predominantly in patients with CRF receiving ESAs by<br />
subcutaneous administration. PRCA has also been reported in patients receiving ESAs while<br />
undergoing treatment for hepatitis C with interferon and ribavirin. Any patient who develops a sudden<br />
loss of response to EPOGEN ® , accompanied by severe anemia and low reticulocyte count, should be<br />
evaluated for the etiology of loss of effect, including the presence of neutralizing antibodies to<br />
erythropoietin (see PRECAUTIONS: Lack or Loss of Response). If anti-erythropoietin antibody-<br />
13
Page 197<br />
associated anemia is suspected, withhold EPOGEN ® and other ESAs. Contact <strong>Amgen</strong> (1-800-<br />
77AMGEN) to perform assays for binding and neutralizing antibodies. EPOGEN ® should be<br />
permanently discontinued in patients with antibody-mediated anemia. Patients should not be switched<br />
to other ESAs as antibodies may cross-react (see ADVERSE REACTIONS: Immunogenicity).<br />
Albumin (Human)<br />
EPOGEN ® contains albumin, a derivative of human blood. Based on effective donor screening and<br />
product manufacturing processes, it carries an extremely remote risk for transmission of viral diseases.<br />
A theoretical risk for transmission of Creutzfeldt-Jakob disease (CJD) also is considered extremely<br />
remote. No cases of transmission of viral diseases or CJD have ever been identified for albumin.<br />
Chronic Renal Failure Patients<br />
Hypertension: Patients with uncontrolled hypertension should not be treated with EPOGEN ® ; blood<br />
pressure should be controlled adequately before initiation of therapy. Although there do not appear to<br />
be any direct pressor effects of EPOGEN ® , blood pressure may rise during EPOGEN ® therapy. During<br />
the early phase of treatment when the hematocrit is increasing, approximately 25% of patients on<br />
dialysis may require initiation of, or increases in, antihypertensive therapy. Hypertensive<br />
encephalopathy and seizures have been observed in patients with CRF treated with EPOGEN ® .<br />
Special care should be taken to closely monitor and aggressively control blood pressure in patients<br />
treated with EPOGEN ® . Patients should be advised as to the importance of compliance with<br />
antihypertensive therapy and dietary restrictions. If blood pressure is difficult to control by initiation of<br />
appropriate measures, the hemoglobin may be reduced by decreasing or withholding the dose of<br />
EPOGEN ® . A clinically significant decrease in hemoglobin may not be observed for several weeks.<br />
It is recommended that the dose of EPOGEN ® be decreased if the hemoglobin increase exceeds 1 g/dL<br />
in any 2-week period, because of the possible association of excessive rate of rise of hemoglobin with<br />
an exacerbation of hypertension. In CRF patients on hemodialysis with clinically evident ischemic heart<br />
disease or congestive heart failure, the dose of EPOGEN ® should be carefully adjusted to achieve and<br />
maintain hemoglobin levels between 10-12 g/dL (see WARNINGS: Increased Mortality, Serious<br />
Cardiovascular Events, Thromboembolic Events, and Stroke, and DOSAGE AND ADMINISTRATION:<br />
Chronic Renal Failure Patients).<br />
Seizures: Seizures have occurred in patients with CRF participating in EPOGEN ® clinical trials.<br />
In adult patients on dialysis, there was a higher incidence of seizures during the first 90 days of therapy<br />
(occurring in approximately 2.5% of patients) as compared with later timepoints.<br />
Given the potential for an increased risk of seizures during the first 90 days of therapy, blood pressure<br />
and the presence of premonitory neurologic symptoms should be monitored closely. Patients should<br />
be cautioned to avoid potentially hazardous activities such as driving or operating heavy machinery<br />
during this period.<br />
While the relationship between seizures and the rate of rise of hemoglobin is uncertain, it is<br />
recommended that the dose of EPOGEN ® be decreased if the hemoglobin increase exceeds 1 g/dL in<br />
any 2-week period.<br />
Thrombotic Events: During hemodialysis, patients treated with EPOGEN ® may require increased<br />
anticoagulation with heparin to prevent clotting of the artificial kidney (see ADVERSE REACTIONS for<br />
more information about thrombotic events).<br />
Other thrombotic events (eg, myocardial infarction, cerebrovascular accident, transient ischemic attack)<br />
have occurred in clinical trials at an annualized rate of less than 0.04 events per patient year of<br />
14
EPOGEN ® therapy. These trials were conducted in adult patients with CRF (whether on dialysis or not)<br />
in whom the target hematocrit was 32% to 40%. However, the risk of thrombotic events, including<br />
vascular access thrombosis, was significantly increased in adult patients with ischemic heart disease or<br />
congestive heart failure receiving EPOGEN ® therapy with the goal of reaching a normal hematocrit<br />
(42%) as compared to a target hematocrit of 30%. Patients with pre-existing cardiovascular disease<br />
should be monitored closely.<br />
Zidovudine-treated HIV-infected Patients<br />
In contrast to CRF patients, EPOGEN ® therapy has not been linked to exacerbation of hypertension,<br />
seizures, and thrombotic events in HIV-infected patients. However, the clinical data do not rule out an<br />
increased risk for serious cardiovascular events.<br />
PRECAUTIONS<br />
The parenteral administration of any biologic product should be attended by appropriate precautions in<br />
case allergic or other untoward reactions occur (see CONTRAINDICATIONS). In clinical trials, while<br />
transient rashes were occasionally observed concurrently with EPOGEN ® therapy, no serious allergic<br />
or anaphylactic reactions were reported (see ADVERSE REACTIONS for more information regarding<br />
allergic reactions).<br />
The safety and efficacy of EPOGEN ® therapy have not been established in patients with a known<br />
history of a seizure disorder or underlying hematologic disease (eg, sickle cell anemia, myelodysplastic<br />
syndromes, or hypercoagulable disorders).<br />
In some female patients, menses have resumed following EPOGEN ® therapy; the possibility of<br />
pregnancy should be discussed and the need for contraception evaluated.<br />
Page 198<br />
Hematology<br />
Exacerbation of porphyria has been observed rarely in patients with CRF treated with EPOGEN ® .<br />
However, EPOGEN ® has not caused increased urinary excretion of porphyrin metabolites in normal<br />
volunteers, even in the presence of a rapid erythropoietic response. Nevertheless, EPOGEN ® should<br />
be used with caution in patients with known porphyria.<br />
In preclinical studies in dogs and rats, but not in monkeys, EPOGEN ® therapy was associated with<br />
subclinical bone marrow fibrosis. Bone marrow fibrosis is a known complication of CRF in humans and<br />
may be related to secondary hyperparathyroidism or unknown factors. The incidence of bone marrow<br />
fibrosis was not increased in a study of adult patients on dialysis who were treated with EPOGEN ® for<br />
12 to 19 months, compared to the incidence of bone marrow fibrosis in a matched group of patients<br />
who had not been treated with EPOGEN ® .<br />
Hemoglobin in CRF patients should be measured twice a week; zidovudine-treated HIV-infected and<br />
cancer patients should have hemoglobin measured once a week until hemoglobin has been stabilized,<br />
and measured periodically thereafter.<br />
Lack or Loss of Response<br />
If the patient fails to respond or to maintain a response to doses within the recommended dosing range,<br />
the following etiologies should be considered and evaluated:<br />
1. Iron deficiency: Virtually all patients will eventually require supplemental iron therapy (see IRON<br />
EVALUATION).<br />
2. Underlying infectious, inflammatory, or malignant processes.<br />
3. Occult blood loss.<br />
15
Page 199<br />
4. Underlying hematologic diseases (ie, thalassemia, refractory anemia, or other myelodysplastic<br />
disorders).<br />
5. Vitamin deficiencies: Folic acid or vitamin B12.<br />
6. Hemolysis.<br />
7. Aluminum intoxication.<br />
8. Osteitis fibrosa cystica.<br />
9. Pure Red Cell Aplasia (PRCA) or anti-erythropoietin antibody-associated anemia: In the absence of<br />
another etiology, the patient should be evaluated for evidence of PRCA and sera should be tested<br />
for the presence of antibodies to erythropoietin (see WARNINGS: Pure Red Cell Aplasia).<br />
See DOSAGE AND ADMINISTRATION: Chronic Renal Failure Patients for management of patients<br />
with an insufficient hemoglobin response to EPOGEN ® therapy.<br />
Iron Evaluation<br />
During EPOGEN ® therapy, absolute or functional iron deficiency may develop. Functional iron<br />
deficiency, with normal ferritin levels but low transferrin saturation, is presumably due to the inability to<br />
mobilize iron stores rapidly enough to support increased erythropoiesis. Transferrin saturation should<br />
be at least 20% and ferritin should be at least 100 ng/mL.<br />
Prior to and during EPOGEN ® therapy, the patient’s iron status, including transferrin saturation (serum<br />
iron divided by iron binding capacity) and serum ferritin, should be evaluated. Virtually all patients will<br />
eventually require supplemental iron to increase or maintain transferrin saturation to levels which will<br />
adequately support erythropoiesis stimulated by EPOGEN ® . All surgery patients being treated with<br />
EPOGEN ® should receive adequate iron supplementation throughout the course of therapy in order to<br />
support erythropoiesis and avoid depletion of iron stores.<br />
Drug Interaction<br />
No evidence of interaction of EPOGEN ® with other drugs was observed in the course of clinical trials.<br />
Carcinogenesis, Mutagenesis, and Impairment of Fertility<br />
Carcinogenic potential of EPOGEN ® has not been evaluated. EPOGEN ® does not induce bacterial<br />
gene mutation (Ames Test), chromosomal aberrations in mammalian cells, micronuclei in mice, or gene<br />
mutation at the HGPRT locus. In female rats treated IV with EPOGEN ® , there was a trend for slightly<br />
increased fetal wastage at doses of 100 and 500 Units/kg.<br />
Pregnancy Category C<br />
EPOGEN ® has been shown to have adverse effects in rats when given in doses 5 times the human<br />
dose. There are no adequate and well-controlled studies in pregnant women. EPOGEN ® should be<br />
used during pregnancy only if potential benefit justifies the potential risk to the fetus.<br />
In studies in female rats, there were decreases in body weight gain, delays in appearance of abdominal<br />
hair, delayed eyelid opening, delayed ossification, and decreases in the number of caudal vertebrae in<br />
the F1 fetuses of the 500 Units/kg group. In female rats treated IV, there was a trend for slightly<br />
increased fetal wastage at doses of 100 and 500 Units/kg. EPOGEN ® has not shown any adverse<br />
effect at doses as high as 500 Units/kg in pregnant rabbits (from day 6 to 18 of gestation).<br />
Nursing Mothers<br />
Postnatal observations of the live offspring (F1 generation) of female rats treated with EPOGEN ® during<br />
gestation and lactation revealed no effect of EPOGEN ® at doses of up to 500 Units/kg. There were,<br />
however, decreases in body weight gain, delays in appearance of abdominal hair, eyelid opening, and<br />
decreases in the number of caudal vertebrae in the F1 fetuses of the 500 Units/kg group. There were<br />
no EPOGEN ® -related effects on the F2 generation fetuses.<br />
16
It is not known whether EPOGEN ® is excreted in human milk. Because many drugs are excreted in<br />
human milk, caution should be exercised when EPOGEN ® is administered to a nursing woman.<br />
Pediatric Use<br />
See WARNINGS: Pediatrics.<br />
Pediatric Patients on Dialysis: EPOGEN ® is indicated in infants (1 month to 2 years), children (2 years<br />
to 12 years), and adolescents (12 years to 16 years) for the treatment of anemia associated with CRF<br />
requiring dialysis. Safety and effectiveness in pediatric patients less than 1 month old have not been<br />
established (see CLINICAL EXPERIENCE: CHRONIC RENAL FAILURE, PEDIATRIC PATIENTS ON<br />
DIALYSIS). The safety data from these studies show that there is no increased risk to pediatric CRF<br />
patients on dialysis when compared to the safety profile of EPOGEN ® in adult CRF patients (see<br />
ADVERSE REACTIONS and WARNINGS). Published literature 27-30 provides supportive evidence of<br />
the safety and effectiveness of EPOGEN ® in pediatric CRF patients on dialysis.<br />
Pediatric Patients Not Requiring Dialysis: Published literature 30,31 has reported the use of EPOGEN ® in<br />
133 pediatric patients with anemia associated with CRF not requiring dialysis, ages 3 months to 20<br />
years‚ treated with 50 to 250 Units/kg SC or IV‚ QW to TIW. Dose-dependent increases in hemoglobin<br />
and hematocrit were observed with reductions in transfusion requirements.<br />
Pediatric HIV-infected Patients: Published literature 32,33 has reported the use of EPOGEN ® in 20<br />
zidovudine-treated anemic HIV-infected pediatric patients ages 8 months to 17 years‚ treated with 50 to<br />
400 Units/kg SC or IV‚ 2 to 3 times per week. Increases in hemoglobin levels and in reticulocyte<br />
counts‚ and decreases in or elimination of blood transfusions were observed.<br />
Pediatric Cancer Patients on Chemotherapy: The safety and effectiveness of EPOGEN ® were<br />
evaluated in a randomized, double-blind, placebo-controlled, multicenter study (see CLINICAL<br />
EXPERIENCE, Weekly (QW) Dosing, Pediatric Patients).<br />
Page 200<br />
Geriatric Use<br />
Among 1051 patients enrolled in the 5 clinical trials of EPOGEN ® for reduction of allogeneic blood<br />
transfusions in patients undergoing elective surgery 745 received EPOGEN ® and 306 received<br />
placebo. Of the 745 patients who received EPOGEN ® , 432 (58%) were aged 65 and over, while 175<br />
(23%) were 75 and over. No overall differences in safety or effectiveness were observed between<br />
geriatric and younger patients. The dose requirements for EPOGEN ® in geriatric and younger patients<br />
within the 4 trials using the TIW schedule were similar. Insufficient numbers of patients were enrolled in<br />
the study using the weekly dosing regimen to determine whether the dosing requirements differ for this<br />
schedule.<br />
Of the 882 patients enrolled in the 3 studies of chronic renal failure patients on dialysis, 757 received<br />
EPOGEN ® and 125 received placebo. Of the 757 patients who received EPOGEN ® , 361 (47%) were<br />
aged 65 and over, while 100 (13%) were 75 and over. No differences in safety or effectiveness were<br />
observed between geriatric and younger patients. Dose selection and adjustment for an elderly patient<br />
should be individualized to achieve and maintain the target hematocrit (See DOSAGE AND<br />
ADMINISTRATION).<br />
Insufficient numbers of patients age 65 or older were enrolled in clinical studies of EPOGEN ® for the<br />
treatment of anemia associated with pre-dialysis chronic renal failure, cancer chemotherapy, and<br />
Zidovudine-treatment of HIV infection to determine whether they respond differently from younger<br />
subjects.<br />
17
Page 201<br />
Information for Patients<br />
Patients should be informed of the increased risks of mortality, serious cardiovascular events,<br />
thromboembolic events, and increased risk of tumor progression or recurrence (see WARNINGS). In<br />
those situations in which the physician determines that a patient or their caregiver can safely and<br />
effectively administer EPOGEN ® at home, instruction as to the proper dosage and administration should<br />
be provided. Patients should be instructed to read the EPOGEN ® Medication Guide and Patient<br />
Instructions for Use and should be informed that the Medication Guide is not a disclosure of all possible<br />
side effects. Patients should be informed of the possible side effects of EPOGEN ® and of the signs and<br />
symptoms of allergic drug reaction and advised of appropriate actions. If home use is prescribed for a<br />
patient, the patient should be thoroughly instructed in the importance of proper disposal and cautioned<br />
against the reuse of needles, syringes, or drug product. A puncture-resistant container should be<br />
available for the disposal of used syringes and needles, and guidance provided on disposal of the full<br />
container.<br />
Chronic Renal Failure Patients<br />
Patients with CRF Not Requiring Dialysis<br />
Blood pressure and hemoglobin should be monitored no less frequently than for patients maintained on<br />
dialysis. Renal function and fluid and electrolyte balance should be closely monitored.<br />
Hematology<br />
Sufficient time should be allowed to determine a patient’s responsiveness to a dosage of EPOGEN ®<br />
before adjusting the dose. Because of the time required for erythropoiesis and the red cell half-life, an<br />
interval of 2 to 6 weeks may occur between the time of a dose adjustment (initiation, increase,<br />
decrease, or discontinuation) and a significant change in hemoglobin.<br />
For patients who respond to EPOGEN ® with a rapid increase in hemoglobin (eg, more than 1 g/dL in<br />
any 2-week period), the dose of EPOGEN ® should be reduced because of the possible association of<br />
excessive rate of rise of hemoglobin with an exacerbation of hypertension.<br />
The elevated bleeding time characteristic of CRF decreases toward normal after correction of anemia in<br />
adult patients treated with EPOGEN ® . Reduction of bleeding time also occurs after correction of<br />
anemia by transfusion.<br />
Laboratory Monitoring<br />
The hemoglobin should be determined twice a week until it has stabilized in the suggested hemoglobin<br />
range and the maintenance dose has been established. After any dose adjustment, the hemoglobin<br />
should also be determined twice weekly for at least 2 to 6 weeks until it has been determined that the<br />
hemoglobin has stabilized in response to the dose change. The hemoglobin should then be monitored<br />
at regular intervals.<br />
A complete blood count with differential and platelet count should be performed regularly. During<br />
clinical trials, modest increases were seen in platelets and white blood cell counts. While these<br />
changes were statistically significant, they were not clinically significant and the values remained within<br />
normal ranges.<br />
In patients with CRF, serum chemistry values (including blood urea nitrogen [BUN], uric acid,<br />
creatinine, phosphorus, and potassium) should be monitored regularly. During clinical trials in adult<br />
patients on dialysis, modest increases were seen in BUN, creatinine, phosphorus, and potassium. In<br />
some adult patients with CRF not on dialysis treated with EPOGEN ® , modest increases in serum uric<br />
acid and phosphorus were observed. While changes were statistically significant, the values remained<br />
within the ranges normally seen in patients with CRF.<br />
18
Page 202<br />
Diet<br />
The importance of compliance with dietary and dialysis prescriptions should be reinforced. In<br />
particular, hyperkalemia is not uncommon in patients with CRF. In US studies in patients on dialysis,<br />
hyperkalemia has occurred at an annualized rate of approximately 0.11 episodes per patient-year of<br />
EPOGEN ® therapy, often in association with poor compliance to medication, diet, and/or dialysis.<br />
Dialysis Management<br />
Therapy with EPOGEN ® results in an increase in hematocrit and a decrease in plasma volume which<br />
could affect dialysis efficiency. In studies to date, the resulting increase in hematocrit did not appear to<br />
adversely affect dialyzer function 8,9 or the efficiency of high flux hemodialysis. 10 During hemodialysis,<br />
patients treated with EPOGEN ® may require increased anticoagulation with heparin to prevent clotting<br />
of the artificial kidney.<br />
Patients who are marginally dialyzed may require adjustments in their dialysis prescription. As with all<br />
patients on dialysis, the serum chemistry values (including BUN, creatinine, phosphorus, and<br />
potassium) in patients treated with EPOGEN ® should be monitored regularly to assure the adequacy of<br />
the dialysis prescription.<br />
Renal Function<br />
In adult patients with CRF not on dialysis, renal function and fluid and electrolyte balance should be<br />
closely monitored. In patients with CRF not on dialysis, placebo-controlled studies of progression of<br />
renal dysfunction over periods of greater than 1 year have not been completed. In shorter term trials in<br />
adult patients with CRF not on dialysis, changes in creatinine and creatinine clearance were not<br />
significantly different in patients treated with EPOGEN ® compared with placebo-treated patients.<br />
Analysis of the slope of 1/serum creatinine versus time plots in these patients indicates no significant<br />
change in the slope after the initiation of EPOGEN ® therapy.<br />
Zidovudine-treated HIV-infected Patients<br />
Hypertension<br />
Exacerbation of hypertension has not been observed in zidovudine-treated HIV-infected patients<br />
treated with EPOGEN ® . However, EPOGEN ® should be withheld in these patients if pre-existing<br />
hypertension is uncontrolled, and should not be started until blood pressure is controlled. In doubleblind<br />
studies, a single seizure has been experienced by a patient treated with EPOGEN ® . 23<br />
Cancer Patients on Chemotherapy<br />
Hypertension<br />
Hypertension, associated with a significant increase in hemoglobin, has been noted rarely in patients<br />
treated with EPOGEN ® . Nevertheless, blood pressure in patients treated with EPOGEN ® should be<br />
monitored carefully, particularly in patients with an underlying history of hypertension or cardiovascular<br />
disease.<br />
Seizures<br />
In double-blind, placebo-controlled trials, 3.2% (n = 2/63) of patients treated with EPOGEN ® TIW and<br />
2.9% (n = 2/68) of placebo-treated patients had seizures. Seizures in 1.6% (n = 1/63) of patients<br />
treated with EPOGEN ® TIW occurred in the context of a significant increase in blood pressure and<br />
hematocrit from baseline values. However, both patients treated with EPOGEN ® also had underlying<br />
CNS pathology which may have been related to seizure activity.<br />
In a placebo-controlled, double-blind trial utilizing weekly dosing with EPOGEN ® , 1.2% (n = 2/168) of<br />
safety-evaluable patients treated with EPOGEN ® and 1% (n = 1/165) of placebo-treated patients had<br />
seizures. Seizures in the patients treated with weekly EPOGEN ® occurred in the context of a<br />
19
significant increase in hemoglobin from baseline values however significant increases in blood pressure<br />
were not seen. These patients may have had other CNS pathology.<br />
Thrombotic Events<br />
In double-blind, placebo-controlled trials, 3.2% (n = 2/63) of patients treated with EPOGEN ® TIW and<br />
11.8% (n = 8/68) of placebo-treated patients had thrombotic events (eg, pulmonary embolism,<br />
cerebrovascular accident), (see WARNINGS: Increased Mortality, Serious Cardiovascular Events,<br />
Thromboembolic Events, and Stroke).<br />
In a placebo-controlled, double-blind trial utilizing weekly dosing with EPOGEN ® , 6.0% (n = 10/168) of<br />
safety-evaluable patients treated with EPOGEN ® and 3.6% (n = 6/165) (p = 0.444) of placebo-treated<br />
patients had clinically significant thrombotic events (deep vein thrombosis requiring anticoagulant<br />
therapy, embolic event including pulmonary embolism, myocardial infarction, cerebral ischemia, left<br />
ventricular failure and thrombotic microangiopathy). A definitive relationship between the rate of<br />
hemoglobin increase and the occurrence of clinically significant thrombotic events could not be<br />
evaluated due to the limited schedule of hemoglobin measurements in this study.<br />
The safety and efficacy of EPOGEN ® were evaluated in a randomized, double-blind, placebocontrolled,<br />
multicenter study that enrolled 222 anemic patients ages 5 to 18 receiving treatment for a<br />
variety of childhood malignancies. Due to the study design (small sample size and the heterogeneity of<br />
the underlying malignancies and of anti-neoplastic treatments employed), a determination of the effect<br />
of EPOGEN ® on the incidence of thrombotic events could not be performed. In the EPOGEN ® arm, the<br />
overall incidence of thrombotic events was 10.8% and the incidence of serious or life-threatening<br />
events was 7.2%.<br />
Surgery Patients<br />
Hypertension<br />
Blood pressure may rise in the perioperative period in patients being treated with EPOGEN ® .<br />
Therefore, blood pressure should be monitored carefully.<br />
Page 203<br />
ADVERSE REACTIONS<br />
Immunogenicity<br />
As with all therapeutic proteins, there is the potential for immunogenicity. Neutralizing antibodies to<br />
erythropoietin, in association with PRCA or severe anemia (with or without other cytopenias), have<br />
been reported in patients receiving EPOGEN ® (see WARNINGS: Pure Red Cell Aplasia) during postmarketing<br />
experience.<br />
There has been no systematic assessment of immune responses, i.e., the incidence of either binding or<br />
neutralizing antibodies to EPOGEN ® , in controlled clinical trials.<br />
Where reported, the incidence of antibody formation is highly dependent on the sensitivity and<br />
specificity of the assay. Additionally, the observed incidence of antibody (including neutralizing<br />
antibody) positivity in an assay may be influenced by several factors including assay methodology,<br />
sample handling, timing of sample collection, concomitant medications, and underlying disease. For<br />
these reasons, comparison of the incidence of antibodies across products within this class<br />
(erythropoietic proteins) may be misleading.<br />
Chronic Renal Failure Patients<br />
In double-blind, placebo-controlled studies involving over 300 patients with CRF, the events reported in<br />
greater than 5% of patients treated with EPOGEN ® during the blinded phase were:<br />
20
Percent of Patients Reporting Event<br />
Patients Treated With Placebo-treated<br />
EPOGEN ® Patients<br />
Event (n = 200) (n = 135)<br />
Hypertension 24% 19%<br />
Headache 16% 12%<br />
Arthralgias 11% 6%<br />
Nausea 11% 9%<br />
Edema 9% 10%<br />
Fatigue 9% 14%<br />
Diarrhea 9% 6%<br />
Vomiting 8% 5%<br />
Chest Pain 7% 9%<br />
Skin Reaction 7% 12%<br />
(Administration Site)<br />
Asthenia 7% 12%<br />
Dizziness 7% 13%<br />
Clotted Access 7% 2%<br />
Significant adverse events of concern in patients with CRF treated in double-blind, placebo-controlled<br />
trials occurred in the following percent of patients during the blinded phase of the studies:<br />
Seizure 1.1% 1.1%<br />
CVA/TIA 0.4% 0.6%<br />
MI 0.4% 1.1%<br />
Death 0% 1.7%<br />
Page 204<br />
In the US EPOGEN ® studies in adult patients on dialysis (over 567 patients), the incidence (number of<br />
events per patient-year) of the most frequently reported adverse events were: hypertension (0.75),<br />
headache (0.40), tachycardia (0.31), nausea/vomiting (0.26), clotted vascular access (0.25), shortness<br />
of breath (0.14), hyperkalemia (0.11), and diarrhea (0.11). Other reported events occurred at a rate of<br />
less than 0.10 events per patient per year.<br />
Events reported to have occurred within several hours of administration of EPOGEN ® were rare, mild,<br />
and transient, and included injection site stinging in dialysis patients and flu-like symptoms such as<br />
arthralgias and myalgias.<br />
In all studies analyzed to date, EPOGEN ® administration was generally well-tolerated, irrespective of<br />
the route of administration.<br />
21
Page 205<br />
Pediatric CRF Patients: In pediatric patients with CRF on dialysis, the pattern of most adverse events<br />
was similar to that found in adults. Additional adverse events reported during the double-blind phase in<br />
>10% of pediatric patients in either treatment group were: abdominal pain, dialysis access<br />
complications including access infections and peritonitis in those receiving peritoneal dialysis, fever,<br />
upper respiratory infection, cough, pharyngitis, and constipation. The rates are similar between the<br />
treatment groups for each event.<br />
Hypertension: Increases in blood pressure have been reported in clinical trials, often during the first<br />
90 days of therapy. On occasion, hypertensive encephalopathy and seizures have been observed in<br />
patients with CRF treated with EPOGEN ® . When data from all patients in the US phase 3 multicenter<br />
trial were analyzed, there was an apparent trend of more reports of hypertensive adverse events in<br />
patients on dialysis with a faster rate of rise of hematocrit (greater than 4 hematocrit points in any 2week<br />
period). However, in a double-blind, placebo-controlled trial, hypertensive adverse events were<br />
not reported at an increased rate in the group treated with EPOGEN ® (150 Units/kg TIW) relative to the<br />
placebo group.<br />
Seizures: There have been 47 seizures in 1010 patients on dialysis treated with EPOGEN ® in clinical<br />
trials, with an exposure of 986 patient-years for a rate of approximately 0.048 events per patient-year.<br />
However, there appeared to be a higher rate of seizures during the first 90 days of therapy (occurring in<br />
approximately 2.5% of patients) when compared to subsequent 90-day periods. The baseline<br />
incidence of seizures in the untreated dialysis population is difficult to determine; it appears to be in the<br />
range of 5% to 10% per patient-year. 34-36<br />
Thrombotic Events: In clinical trials where the maintenance hematocrit was 35 ± 3% on EPOGEN ® ,<br />
clotting of the vascular access (A-V shunt) has occurred at an annualized rate of about 0.25 events per<br />
patient-year, and other thrombotic events (eg, myocardial infarction, cerebral vascular accident,<br />
transient ischemic attack, and pulmonary embolism) occurred at a rate of 0.04 events per patient-year.<br />
In a separate study of 1111 untreated dialysis patients, clotting of the vascular access occurred at a<br />
rate of 0.50 events per patient-year. However, in CRF patients on hemodialysis who also had clinically<br />
evident ischemic heart disease or congestive heart failure, the risk of A-V shunt thrombosis was higher<br />
(39% vs 29%, p < 0.001), and myocardial infarctions, vascular ischemic events, and venous thrombosis<br />
were increased, in patients targeted to a hematocrit of 42 ± 3% compared to those maintained at 30 ±<br />
3% (see WARNINGS).<br />
In patients treated with commercial EPOGEN ® , there have been rare reports of serious or unusual<br />
thromboembolic events including migratory thrombophlebitis, microvascular thrombosis, pulmonary<br />
embolus, and thrombosis of the retinal artery, and temporal and renal veins. A causal relationship has<br />
not been established.<br />
Allergic Reactions: There have been no reports of serious allergic reactions or anaphylaxis<br />
associated with EPOGEN ® administration during clinical trials. Skin rashes and urticaria have been<br />
observed rarely and when reported have generally been mild and transient in nature.<br />
There have been rare reports of potentially serious allergic reactions including urticaria with associated<br />
respiratory symptoms or circumoral edema, or urticaria alone. Most reactions occurred in situations<br />
where a causal relationship could not be established. Symptoms recurred with rechallenge in a few<br />
instances, suggesting that allergic reactivity may occasionally be associated with EPOGEN ® therapy. If<br />
an anaphylactoid reaction occurs, EPOGEN ® should be immediately discontinued and appropriate<br />
therapy initiated.<br />
22
Zidovudine-treated HIV-infected Patients<br />
In double-blind, placebo-controlled studies of 3 months duration involving approximately 300<br />
zidovudine-treated HIV-infected patients, adverse events with an incidence of ≥ 10% in either patients<br />
treated with EPOGEN ® or placebo-treated patients were:<br />
Percent of Patients Reporting Event<br />
Patients Treated With Placebo-treated<br />
EPOGEN ® Patients<br />
Event (n = 144) (n = 153)<br />
Pyrexia 38% 29%<br />
Fatigue 25% 31%<br />
Headache 19% 14%<br />
Cough 18% 14%<br />
Diarrhea 16% 18%<br />
Rash 16% 8%<br />
Congestion, 15% 10%<br />
Respiratory<br />
Nausea 15% 12%<br />
Shortness of Breath 14% 13%<br />
Asthenia 11% 14%<br />
Skin Reaction, 10% 7%<br />
Medication Site<br />
Dizziness 9% 10%<br />
In the 297 patients studied, EPOGEN ® was not associated with significant increases in opportunistic<br />
infections or mortality. 23 In 71 patients from this group treated with EPOGEN ® at 150 Units/kg TIW,<br />
serum p24 antigen levels did not appear to increase. 25 Preliminary data showed no enhancement of<br />
HIV replication in infected cell lines in vitro. 23<br />
Peripheral white blood cell and platelet counts are unchanged following EPOGEN ® therapy.<br />
Page 206<br />
Allergic Reactions: Two zidovudine-treated HIV-infected patients had urticarial reactions within 48<br />
hours of their first exposure to study medication. One patient was treated with EPOGEN ® and one was<br />
treated with placebo (EPOGEN ® vehicle alone). Both patients had positive immediate skin tests<br />
against their study medication with a negative saline control. The basis for this apparent pre-existing<br />
hypersensitivity to components of the EPOGEN ® formulation is unknown, but may be related to HIVinduced<br />
immunosuppression or prior exposure to blood products.<br />
Seizures: In double-blind and open-label trials of EPOGEN ® in zidovudine-treated HIV-infected<br />
patients, 10 patients have experienced seizures. 23 In general, these seizures appear to be related to<br />
underlying pathology such as meningitis or cerebral neoplasms, not EPOGEN ® therapy.<br />
23
Cancer Patients on Chemotherapy<br />
In double-blind, placebo-controlled studies of up to 3 months duration involving 131 cancer patients,<br />
adverse events with an incidence > 10% in either patients treated with EPOGEN ® or placebo-treated<br />
patients were as indicated below:<br />
Percent of Patients Reporting Event<br />
Patients Treated With Placebo-treated<br />
EPOGEN ® Patients<br />
Event (n = 63) (n = 68)<br />
Pyrexia 29% 19%<br />
Diarrhea 21%* 7%<br />
Nausea 17%* 32%<br />
Vomiting 17% 15%<br />
Edema 17%* 1%<br />
Asthenia 13% 16%<br />
Fatigue 13% 15%<br />
Shortness of Breath 13% 9%<br />
Parasthesia 11% 6%<br />
Upper Respiratory<br />
Infection<br />
11% 4%<br />
Dizziness 5% 12%<br />
Trunk Pain<br />
* Statistically significant<br />
3%* 16%<br />
Although some statistically significant differences between patients being treated with EPOGEN ® and<br />
placebo-treated patients were noted, the overall safety profile of EPOGEN ® appeared to be consistent<br />
with the disease process of advanced cancer. During double-blind and subsequent open-label therapy<br />
in which patients (n = 72 for total exposure to EPOGEN ® ) were treated for up to 32 weeks with doses<br />
as high as 927 Units/kg, the adverse experience profile of EPOGEN ® was consistent with the<br />
progression of advanced cancer.<br />
Three hundred thirty-three (333) cancer patients enrolled in a placebo-controlled double-blind trial<br />
utilizing Weekly dosing with EPOGEN ® for up to 4 months were evaluable for adverse events.<br />
The incidence of adverse events was similar in both the treatment and placebo arms.<br />
Surgery Patients<br />
Adverse events with an incidence of ≥ 10% are shown in the following table:<br />
Page 207<br />
24
Percent of Patients Reporting Event<br />
Patients Patients Placebo- Patients Patients<br />
Treated Treated treated Treated Treated<br />
With With Patients With With<br />
EPOGEN ®<br />
EPOGEN ®<br />
EPOGEN ®<br />
EPOGEN ®<br />
300 U/kg 100 U/kg 600 U/kg 300 U/kg<br />
Event (n = 112) a<br />
(n = 101) a<br />
(n = 103) a<br />
(n = 73) b<br />
(n = 72) b<br />
Pyrexia 51% 50% 60% 47% 42%<br />
Nausea 48% 43% 45% 45% 58%<br />
Constipation 43% 42% 43% 51% 53%<br />
Skin Reaction, 25% 19% 22% 26% 29%<br />
Medication<br />
Site<br />
Vomiting 22% 12% 14% 21% 29%<br />
Skin Pain 18% 18% 17% 5% 4%<br />
Pruritus 16% 16% 14% 14% 22%<br />
Insomnia 13% 16% 13% 21% 18%<br />
Headache 13% 11% 9% 10% 19%<br />
Dizziness 12% 9% 12% 11% 21%<br />
Urinary Tract 12% 3% 11% 11% 8%<br />
Infection<br />
Hypertension 10% 11% 10% 5% 10%<br />
Diarrhea 10% 7% 12% 10% 6%<br />
Deep Venous 10% 3% 5% 0% c<br />
Thrombosis<br />
Dyspepsia 9% 11% 6% 7% 8%<br />
Anxiety 7% 2% 11% 11% 4%<br />
Edema 6% 11% 8% 11% 7%<br />
a Study including patients undergoing orthopedic surgery treated with EPOGEN ® or placebo for 15 days<br />
b Study including patients undergoing orthopedic surgery treated with EPOGEN ® 600 Units/kg weekly x 4 or 300<br />
Units/kg daily x 15<br />
c Determined by clinical symptoms<br />
Thrombotic/Vascular Events: In three double-blind, placebo-controlled orthopedic surgery studies,<br />
the rate of deep venous thrombosis (DVT) was similar among Epoetin alfa and placebo-treated patients<br />
in the recommended population of patients with a pretreatment hemoglobin of > 10 g/dL to ≤ 13<br />
g/dL. 17,19,26 However, in 2 of 3 orthopedic surgery studies the overall rate (all pretreatment hemoglobin<br />
groups combined) of DVTs detected by postoperative ultrasonography and/or surveillance venography<br />
was higher in the group treated with Epoetin alfa than in the placebo-treated group (11% vs. 6%). This<br />
finding was attributable to the difference in DVT rates observed in the subgroup of patients with<br />
pretreatment hemoglobin > 13 g/dL.<br />
0% c<br />
Page 208<br />
25
In the orthopedic surgery study of patients with pretreatment hemoglobin of > 10 g/dL to ≤ 13 g/dL<br />
which compared two dosing regimens (600 Units/kg weekly x 4 and 300 Units/kg daily x 15), 4 subjects<br />
in the 600 Units/kg weekly EPOGEN ® group (5%) and no subjects in the 300 Units/kg daily group had a<br />
thrombotic vascular event during the study period. 18<br />
In a study examining the use of Epoetin alfa in 182 patients scheduled for coronary artery bypass graft<br />
surgery, 23% of patients treated with Epoetin alfa and 29% treated with placebo experienced<br />
thrombotic/vascular events. There were 4 deaths among the Epoetin alfa-treated patients that were<br />
associated with a thrombotic/vascular event (see WARNINGS).<br />
OVERDOSAGE<br />
The expected manifestations of EPOGEN ® overdosage include signs and symptoms associated with an<br />
excessive and/or rapid increase in hemoglobin concentration, including any of the cardiovascular<br />
events described in WARNINGS and listed in ADVERSE REACTIONS. Patients receiving an<br />
overdosage of EPOGEN ® should be monitored closely for cardiovascular events and hematologic<br />
abnormalities. Polycythemia should be managed acutely with phlebotomy, as clinically indicated.<br />
Following resolution of the effects due to EPOGEN ® overdosage, reintroduction of EPOGEN ® therapy<br />
should be accompanied by close monitoring for evidence of rapid increases in hemoglobin<br />
concentration (>1 gm/dL per 14 days). In patients with an excessive hematopoietic response, reduce<br />
the EPOGEN ® dose in accordance with the recommendations described in DOSAGE AND<br />
ADMINISTRATION.<br />
DOSAGE AND ADMINISTRATION<br />
IMPORTANT: See BOXED WARNINGS and WARNINGS: Increased Mortality,<br />
Serious Cardiovascular Events, Thromboembolic Events, and Stroke.<br />
Chronic Renal Failure Patients<br />
The recommended range for the starting dose of EPOGEN ® is 50 to 100 Units/kg TIW for adult<br />
patients. The recommended starting dose for pediatric CRF patients on dialysis is 50 Units/kg TIW.<br />
Individualize dosing to achieve and maintain hemoglobin levels between 10-12 g/dL. The dose of<br />
EPOGEN ® should be reduced as the hemoglobin approaches 12 g/dL or increases by more than 1 g/dL<br />
in any 2-week period. If hemoglobin excursions outside the recommended range occur, the EPOGEN ®<br />
dose should be adjusted as described below.<br />
EPOGEN ® may be given either as an IV or SC injection. In patients on hemodialysis, the IV route is<br />
recommended (see WARNINGS: Pure Red Cell Aplasia). While the administration of EPOGEN ® is<br />
independent of the dialysis procedure, EPOGEN ® may be administered into the venous line at the end<br />
of the dialysis procedure to obviate the need for additional venous access. In adult patients with CRF<br />
not on dialysis, EPOGEN ® may be given either as an IV or SC injection.<br />
Patients who have been judged competent by their physicians to self-administer EPOGEN ® without<br />
medical or other supervision may give themselves either an IV or SC injection. The table below<br />
provides general therapeutic guidelines for patients with CRF:<br />
Individually titrate to achieve and maintain hemoglobin levels between 10 to 12 g/dL.<br />
Page 209<br />
26
Starting Dose:<br />
Adults 50 to 100 Units/kg TIW; IV or SC<br />
Pediatric Patients 50 Units/kg TIW; IV or SC<br />
Increase Dose by 25% If: 1. Hemoglobin is < 10 g/dL and has not increased by<br />
1 g/dL after 4 weeks of therapy or<br />
2. Hemoglobin decreases below 10 g/dL<br />
Reduce Dose by 25% When: 1. Hemoglobin approaches 12 g/dL or,<br />
2. Hemoglobin increases > 1 g/dL in any 2-week period<br />
During therapy, hematological parameters should be monitored regularly. Doses must be<br />
individualized to ensure that hemoglobin is maintained at an appropriate level for each patient.<br />
Page 210<br />
For patients whose hemoglobin does not attain a level within the range of 10 to 12 g/dL despite the use<br />
of appropriate EPOGEN ® dose titrations over a 12-week period:<br />
� do not administer higher EPOGEN ® doses and use the lowest dose that will maintain a<br />
hemoglobin level sufficient to avoid the need for recurrent RBC transfusions,<br />
� evaluate and treat for other causes of anemia (see PRECAUTIONS: Lack or Loss of<br />
Response), and<br />
� thereafter, hemoglobin should continue to be monitored and if responsiveness improves,<br />
EPOGEN ® dose adjustments should be made as described above; discontinue EPOGEN ® if<br />
responsiveness does not improve and the patient needs recurrent RBC transfusions.<br />
Pretherapy Iron Evaluation: Prior to and during EPOGEN ® therapy, the patient’s iron stores,<br />
including transferrin saturation (serum iron divided by iron binding capacity) and serum ferritin, should<br />
be evaluated. Transferrin saturation should be at least 20%, and ferritin should be at least 100 ng/mL.<br />
Virtually all patients will eventually require supplemental iron to increase or maintain transferrin<br />
saturation to levels that will adequately support erythropoiesis stimulated by EPOGEN ® .<br />
Dose Adjustment: The dose should be adjusted for each patient to achieve and maintain hemoglobin<br />
levels between 10 to 12 g/dL.<br />
Increases in dose should not be made more frequently than once a month. If the hemoglobin is<br />
increasing and approaching 12 g/dL, the dose should be reduced by approximately 25%. If the<br />
hemoglobin continues to increase, dose should be temporarily withheld until the hemoglobin begins to<br />
decrease, at which point therapy should be reinitiated at a dose approximately 25% below the previous<br />
dose. If the hemoglobin increases by more than 1 g/dL in a 2-week period, the dose should be<br />
decreased by approximately 25%.<br />
If the increase in the hemoglobin is less than 1 g/dL over 4 weeks and iron stores are adequate (see<br />
PRECAUTIONS: Laboratory Monitoring), the dose of EPOGEN ® may be increased by approximately<br />
25% of the previous dose. Further increases may be made at 4-week intervals until the specified<br />
hemoglobin is obtained.<br />
Maintenance Dose: The maintenance dose must be individualized for each patient on dialysis. In the<br />
US phase 3 multicenter trial in patients on hemodialysis, the median maintenance dose was 75<br />
Units/kg TIW, with a range from 12.5 to 525 Units/kg TIW. Almost 10% of the patients required a dose<br />
of 25 Units/kg, or less, and approximately 10% of the patients required more than 200 Units/kg TIW to<br />
maintain their hematocrit in the suggested target range. In pediatric hemodialysis and peritoneal<br />
27
dialysis patients, the median maintenance dose was 167 Units/kg/week (49 to 447 Units/kg per week)<br />
and 76 Units/kg per week (24 to 323 Units/kg/week) administered in divided doses (TIW or BIW),<br />
respectively to achieve the target range of 30% to 36%.<br />
If the transferrin saturation is greater than 20%, the dose of EPOGEN ® may be increased. Such dose<br />
increases should not be made more frequently than once a month, unless clinically indicated, as the<br />
response time of the hemoglobin to a dose increase can be 2 to 6 weeks. Hemoglobin should be<br />
measured twice weekly for 2 to 6 weeks following dose increases. In adult patients with CRF not on<br />
dialysis, the dose should also be individualized to maintain hemoglobin levels between 10 to 12 g/dL.<br />
EPOGEN ® doses of 75 to 150 Units/kg/week have been shown to maintain hematocrits of 36% to 38%<br />
for up to 6 months.<br />
Lack or Loss of Response: If a patient fails to respond or maintain a response, an evaluation for<br />
causative factors should be undertaken (see WARNINGS: Pure Red Cell Aplasia, PRECAUTIONS:<br />
Lack or Loss of Response, and PRECAUTIONS: Iron Evaluation). If the transferrin saturation is less<br />
than 20%, supplemental iron should be administered.<br />
Zidovudine-treated HIV-infected Patients<br />
Prior to beginning EPOGEN ® , it is recommended that the endogenous serum erythropoietin level be<br />
determined (prior to transfusion). Available evidence suggests that patients receiving zidovudine with<br />
endogenous serum erythropoietin levels > 500 mUnits/mL are unlikely to respond to therapy with<br />
EPOGEN ® .<br />
In zidovudine-treated HIV-infected patients the dosage of EPOGEN ® should be titrated for each patient<br />
to achieve and maintain the lowest hemoglobin level sufficient to avoid the need for blood transfusion<br />
and not to exceed the upper safety limit of 12 g/dL.<br />
Starting Dose: For adult patients with serum erythropoietin levels ≤ 500 mUnits/mL who are receiving<br />
a dose of zidovudine ≤ 4200 mg/week, the recommended starting dose of EPOGEN ® is 100 Units/kg as<br />
an IV or SC injection TIW for 8 weeks. For pediatric patients, see PRECAUTIONS: PEDIATRIC USE.<br />
Increase Dose: During the dose adjustment phase of therapy, the hemoglobin should be monitored<br />
weekly. If the response is not satisfactory in terms of reducing transfusion requirements or increasing<br />
hemoglobin after 8 weeks of therapy, the dose of EPOGEN ® can be increased by 50 to 100 Units/kg<br />
TIW. Response should be evaluated every 4 to 8 weeks thereafter and the dose adjusted accordingly<br />
by 50 to 100 Units/kg increments TIW. If patients have not responded satisfactorily to an EPOGEN ®<br />
dose of 300 Units/kg TIW, it is unlikely that they will respond to higher doses of EPOGEN ® .<br />
Maintenance Dose: After attainment of the desired response (ie, reduced transfusion requirements or<br />
increased hemoglobin), the dose of EPOGEN ® should be titrated to maintain the response based on<br />
factors such as variations in zidovudine dose and the presence of intercurrent infectious or<br />
inflammatory episodes. If the hemoglobin exceeds the upper safety limit of 12 g/dL, the dose should be<br />
discontinued until the hemoglobin drops below 11 g/dL. The dose should be reduced by 25% when<br />
treatment is resumed and then titrated to maintain the desired hemoglobin.<br />
Cancer Patients on Chemotherapy<br />
Page 211<br />
Only prescribers enrolled in the ESA APPRISE Oncology Program may prescribe and/or dispense<br />
EPOGEN ® (see WARNINGS: ESA APPRISE Oncology Program).<br />
Although no specific serum erythropoietin level has been established which predicts which patients<br />
would be unlikely to respond to EPOGEN ® therapy, treatment of patients with grossly elevated serum<br />
28
erythropoietin levels (eg, > 200 mUnits/mL) is not recommended. Therapy should not be initiated at<br />
hemoglobin levels ≥ 10 g/dL. The hemoglobin should be monitored on a weekly basis in patients<br />
receiving EPOGEN ® therapy until hemoglobin becomes stable. The dose of EPOGEN ® should be<br />
titrated for each patient to achieve and maintain the lowest hemoglobin level sufficient to avoid the need<br />
for blood transfusion (see recommended Dose Modifications, below).<br />
Recommended Dose: The initial recommended dose of EPOGEN ® in adults is 150 Units/kg SC TIW<br />
or 40,000 Units SC Weekly. The initial recommended dose of EPOGEN ® in pediatric patients is 600<br />
Units/kg IV weekly. Discontinue EPOGEN ® following the completion of a chemotherapy course (see<br />
BOXED WARNINGS: Cancer).<br />
Dose Modification<br />
TIW Dosing<br />
Starting Dose:<br />
Adults 150 Units/kg SC TIW<br />
Reduce Dose by 25% when: Hemoglobin reaches a level needed to avoid transfusion or<br />
increases > 1 g/dL in any 2-week period.<br />
Withhold Dose if: Hemoglobin exceeds a level needed to avoid transfusion.<br />
Restart at 25% below the previous dose when the<br />
hemoglobin approaches a level where transfusions may be<br />
required.<br />
Increase Dose to 300 Units/kg TIW if: Response is not satisfactory (no reduction in transfusion<br />
requirements or rise in hemoglobin) after 4 weeks to<br />
achieve and maintain the lowest hemoglobin level<br />
sufficient to avoid the need for RBC transfusion.<br />
Discontinue: If after 8 weeks of therapy there is no response as measured by<br />
hemoglobin levels or if transfusions are still required.<br />
Weekly Dosing<br />
Starting Dose:<br />
Adults<br />
Pediatrics<br />
40,000 Units SC<br />
600 Units/kg IV (maximum 40,000 Units)<br />
Reduce Dose by 25% when: Hemoglobin reaches a level needed to avoid transfusion or<br />
increases > 1 g/dL in any 2-weeks.<br />
Withhold Dose if: Hemoglobin exceeds a level needed to avoid transfusion and<br />
restart at 25% below the previous dose when the hemoglobin<br />
approaches a level where transfusions may be required.<br />
Increase Dose if:<br />
For Adults: 60,000 Units SC<br />
Weekly<br />
For Pediatrics: 900 Units/kg IV<br />
(maximum 60,000 Units) if:<br />
Page 212<br />
Response is not satisfactory (no increase in hemoglobin by ≥ 1<br />
g/dL after 4 weeks of therapy, in the absence of a RBC<br />
transfusion) to achieve and maintain the lowest hemoglobin<br />
level sufficient to avoid the need for RBC transfusion.<br />
29
Discontinue: If after 8 weeks of therapy there is no response as measured by<br />
hemoglobin levels or if transfusions are still required.<br />
Surgery Patients<br />
Prior to initiating treatment with EPOGEN ® a hemoglobin should be obtained to establish that it is > 10<br />
to ≤ 13 g/dL. 17 The recommended dose of EPOGEN ® is 300 Units/kg/day subcutaneously for 10 days<br />
before surgery, on the day of surgery, and for 4 days after surgery.<br />
An alternate dose schedule is 600 Units/kg EPOGEN ® subcutaneously in once weekly doses (21, 14,<br />
and 7 days before surgery) plus a fourth dose on the day of surgery. 18<br />
All patients should receive adequate iron supplementation. Iron supplementation should be initiated no<br />
later than the beginning of treatment with EPOGEN ® and should continue throughout the course of<br />
therapy. Deep venous thrombosis prophylaxis should be strongly considered (see BOXED<br />
WARNINGS).<br />
PREPARATION AND ADMINISTRATION OF EPOGEN ®<br />
1. Do not shake. It is not necessary to shake EPOGEN ® . Prolonged vigorous shaking may denature<br />
any glycoprotein, rendering it biologically inactive.<br />
2. Protect the solution from light. Parenteral drug products should be inspected visually for<br />
particulate matter and discoloration prior to administration. Do not use any vials exhibiting<br />
particulate matter or discoloration.<br />
3. Using aseptic techniques, attach a sterile needle to a sterile syringe. Remove the flip top from the<br />
vial containing EPOGEN ® , and wipe the septum with a disinfectant. Insert the needle into the vial,<br />
and withdraw into the syringe an appropriate volume of solution.<br />
4. Single-dose: 1 mL vial contains no preservative. Use one dose per vial; do not re-enter the vial.<br />
Discard unused portions.<br />
Multidose: 1 mL and 2 mL vials contain preservative. Store at 2° to 8° C after initial entry and<br />
between doses. Discard 21 days after initial entry.<br />
5. Do not dilute or administer in conjunction with other drug solutions. However, at the time of SC<br />
administration, preservative-free EPOGEN ® from single-use vials may be admixed in a syringe with<br />
bacteriostatic 0.9% sodium chloride injection, USP, with benzyl alcohol 0.9% (bacteriostatic saline)<br />
at a 1:1 ratio using aseptic technique. The benzyl alcohol in the bacteriostatic saline acts as a<br />
local anesthetic which may ameliorate SC injection site discomfort. Admixing is not necessary<br />
when using the multidose vials of EPOGEN ® containing benzyl alcohol.<br />
HOW SUPPLIED<br />
EPOGEN ® , containing Epoetin alfa, is available in the following packages:<br />
1 mL Single-dose, Preservative-free Solution<br />
2000 Units/mL (NDC 55513-126-10)<br />
3000 Units/mL (NDC 55513-267-10)<br />
4000 Units/mL (NDC 55513-148-10)<br />
10,000 Units/mL (NDC 55513-144-10)<br />
40,000 Units/mL (NDC 55513-823-10)<br />
Page 213<br />
30
Supplied in dispensing packs containing 10 single-dose vials.2 mL Multidose, Preserved Solution<br />
10,000 Units/mL (NDC 55513-283-10)<br />
1 mL Multidose, Preserved Solution<br />
20,000 Units/mL (NDC 55513-478-10)<br />
Supplied in dispensing packs containing 10 multidose vials.<br />
STORAGE<br />
Store at 2 o to 8 o C (36 o to 46 o F). Do not freeze or shake. Protect from light.<br />
REFERENCES<br />
1. Egrie JC, Strickland TW, Lane J, et al. Characterization and Biological Effects of Recombinant<br />
Human Erythropoietin. Immunobiol. 1986;72:213-224.<br />
2. Graber SE, Krantz SB. Erythropoietin and the Control of Red Cell Production. Ann Rev Med.<br />
1978;29:51-66.<br />
3. Eschbach JW, Adamson JW. <strong>Anemia</strong> of End-Stage Renal Disease (ESRD). Kidney Intl.<br />
1985;28:1-5.<br />
Page 214<br />
4. Eschbach JW, Egrie JC, Downing MR, et al. Correction of the <strong>Anemia</strong> of End-Stage Renal Disease<br />
with Recombinant Human Erythropoietin. NEJM. 1987;316:73-78.<br />
5. Eschbach JW, Abdulhadi MH, Browne JK, et al. Recombinant Human Erythropoietin in Anemic<br />
Patients with End-Stage Renal Disease. Ann Intern Med. 1989;111:992-1000.<br />
6. Eschbach JW, Egrie JC, Downing MR, et al. The Use of Recombinant Human Erythropoietin (r-<br />
HuEPO): Effect in End-Stage Renal Disease (ESRD). In: Friedman, Beyer, DeSanto, Giordano,<br />
eds. Prevention of Chronic Uremia. Philadelphia, PA: Field and Wood Inc; 1989: 148-155.<br />
7. Egrie JC, Eschbach JW, McGuire T, Adamson JW. Pharmacokinetics of Recombinant Human<br />
Erythropoietin (r-HuEPO) Administered to Hemodialysis (HD) Patients. Kidney Intl. 1988;33:262.<br />
8. Paganini E, Garcia J, Ellis P, et al. Clinical Sequelae of Correction of <strong>Anemia</strong> with Recombinant<br />
Human Erythropoietin (r-HuEPO); Urea Kinetics, Dialyzer Function and Reuse. Am J Kid Dis.<br />
1988;11:16.<br />
9. Delano BG, Lundin AP, Golansky R, et al. Dialyzer Urea and Creatinine Clearances Not<br />
Significantly Changed in r-HuEPO Treated Maintenance Hemodialysis (MD) Patients. Kidney Intl.<br />
1988;33:219.<br />
10. Stivelman J, Van Wyck D, Ogden D. Use of Recombinant Erythropoietin (r-HuEPO) with High Flux<br />
Dialysis (HFD) Does Not Worsen Azotemia or Shorten Access Survival. Kidney Intl. 1988;33:239.<br />
11. Lim VS, DeGowin RL, Zavala D, et al. Recombinant Human Erythropoietin Treatment in Pre-<br />
Dialysis Patients: A Double-Blind Placebo Controlled Trial. Ann Int Med.<br />
1989;110:108-114.<br />
12. Stone WJ, Graber SE, Krantz SB, et al. Treatment of the <strong>Anemia</strong> of Pre-Dialysis Patients with<br />
Recombinant Human Erythropoietin: A Randomized, Placebo-Controlled Trial. Am J Med Sci.<br />
1988;296:171-179.<br />
13. Braun A, Ding R, Seidel C, Fies T, Kurtz A, Scharer K. Pharmacokinetics of recombinant human<br />
erythropoietin applied subcutaneously to children with chronic renal failure. Pediatr Nephrol.<br />
1993;7:61-64.<br />
14. Geva P, Sherwood JB. Pharmacokinetics of recombinant human erythropoietin (rHuEPO) in<br />
pediatric patients on chronic cycling peritoneal dialysis (CCPD). Blood. 1991;78 (Suppl 1):91a.<br />
31
15. Jabs K, Grant JR, Harmon W, et al. Pharmacokinetics of Epoetin alfa (rHuEPO) in pediatric<br />
hemodialysis (HD) patients. J Am Soc Nephrol. 1991;2:380.<br />
16. Kling PJ, Widness JA, Guillery EN, Veng-Pedersen P, Peters C, DeAlarcon PA. Pharmacokinetics<br />
and pharmacodynamics of erythropoietin during therapy in an infant with renal failure. J Pediatr.<br />
1992;121:822-825.<br />
17. deAndrade JR and Jove M. Baseline Hemoglobin as a Predictor of Risk of Transfusion and<br />
Response to Epoetin alfa in Orthoperdic Surgery Patients. Am. J. of Orthoped. 1996;25 (8):533-<br />
542.<br />
18. Goldberg MA and McCutchen JW. A Safety and Efficacy Comparison Study of Two Dosing<br />
Regimens of Epoetin alfa in Patients Undergoing Major Orthopedic Surgery. Am. J. of Orthoped.<br />
1996;25 (8):544-552.<br />
19. Faris PM and Ritter MA. The Effects of Recombinant Human Erythropoietin on Perioperative<br />
Transfusion Requirements in Patients Having a Major Orthopedic Operation. J. Bone and Joint<br />
surgery. 1996;78-A:62-72.<br />
20. <strong>Amgen</strong> Inc., data on file.<br />
21. Eschbach JW, Kelly MR, Haley NR, et al. Treatment of the <strong>Anemia</strong> of Progressive Renal Failure<br />
with Recombinant Human Erythropoietin. NEJM. 1989;321:158-163.<br />
22. The US Recombinant Human Erythropoietin Predialysis Study Group. Double-Blind, Placebo-<br />
Controlled Study of the Therapeutic Use of Recombinant Human Erythropoietin for <strong>Anemia</strong><br />
Associated with Chronic Renal Failure in Predialysis Patients. Am J Kid Dis. 1991;18:50-59.<br />
23. Ortho Biologics, Inc., data on file.<br />
Page 215<br />
24. Danna RP, Rudnick SA, Abels RI. Erythropoietin Therapy for the <strong>Anemia</strong> Associated with AIDS<br />
and AIDS Therapy and Cancer. In: MB Garnick, ed. Erythropoietin in Clinical Applications - An<br />
International Perspective. New York, NY: Marcel Dekker; 1990:301-324.<br />
25. Fischl M, Galpin JE, Levine JD, et al. Recombinant Human Erythropoietin for Patients with AIDS<br />
Treated with Zidovudine. NEJM. 1990;322:1488-1493.<br />
26. Laupacis A. Effectiveness of Perioperative Recombinant Human Eyrthropoietin in Elective Hip<br />
Replacement. Lancet. 1993;341:1228-1232.<br />
27. Campos A, Garin EH. Therapy of renal anemia in children and adolescents with recombinant<br />
human erythropoietin (rHuEPO). Clin Pediatr (Phila). 1992;31:94-99.<br />
28. Montini G, Zacchello G, Baraldi E, et al. Benefits and risks of anemia correction with recombinant<br />
human erythropoietin in children maintained by hemodialysis. J Pediatr. 1990;117:556-560.<br />
29. Offner G, Hoyer PF, Latta K, Winkler L, Brodehl J, Scigalla P. One year's experience with<br />
recombinant erythropoietin in children undergoing continuous ambulatory or cycling peritoneal<br />
dialysis. Pediatr Nephrol. 1990;4:498-500.<br />
30. Muller-Wiefel DE, Scigalla P. Specific problems of renal anemia in childhood. Contrib Nephrol.<br />
1988;66:71-84.<br />
31. Scharer K, Klare B, Dressel P, Gretz N. Treatment of renal anemia by subcutaneous erythropoietin<br />
in children with preterminal chronic renal failure. Acta Paediatr. 1993;82:953-958.<br />
32. Mueller BU, Jacobsen RN, Jarosinski P, et al. Erythropoietin for zidovudine-associated anemia in<br />
children with HIV infection. Pediatr AIDS and HIV Infect: Fetus to Adolesc. 1994;5:169-173.<br />
33. Zuccotti GV, Plebani A, Biasucci G, et al. Granulocyte-colony stimulating factor and erythropoietin<br />
therapy in children with human immunodeficiency virus infection. J Int Med Res. 1996;24:115-121.<br />
32
34. Raskin NH, Fishman RA. Neurologic Disorders in Renal Failure (First of Two Parts). NEJM.<br />
1976;294:143-148.<br />
35. Raskin NH and Fishman RA. Neurologic Disorders in Renal Failure (Second of Two Parts). NEJM.<br />
1976;294:204-210.<br />
36. Messing RO, Simon RP. Seizures as a Manifestation of Systemic Disease. Neurologic Clinics.<br />
1986;4:563-584.<br />
37. Besarab A, Bolton WK, Browne JK, et al. The effects of normal as compared with low hematocrit<br />
values in patients with cardiac disease who are receiving hemodialysis and epoetin. NEJM.<br />
1998;339:584-90.<br />
38. Henke, M, Laszig, R, Rübe, C., et al. Erythropoietin to treat head and neck cancer patients with<br />
anaemia undergoing radiotherapy: randomized, double-blind, placebo-controlled trial. The Lancet.<br />
2003; 362:1255-1260.<br />
39. Widness JA, Veng-Pedersen P, Peters C, Pereira LM, Schmidt RL, Lowe SL. Erythropoietin<br />
Pharmacokinetics in Premature Infants: Developmental, Nonlinearity, and Treatment Effects. J<br />
Appl Physiol. 1996;80 (1):140-148.<br />
40. Singh AK, Szczech L, Tang KL, et al. Correction of <strong>Anemia</strong> with Epoetin Alfa in Chronic Kidney<br />
Disease, N Engl j Med. 2006; 355:2085-98.<br />
41. Bohlius J, Wilson J, Seidenfeld J, et at. Recombinant HumanErythropoietins and Cancer Patients:<br />
Updated Meta-Analysis of 57 Studies Including 9353 Patients. J Natl Cancer Inst. 2006; 98:708-14.<br />
42. D’Ambra MN, Gray RJ, Hillman R, et al. Effect of Recombinant Human Erythropoietin on<br />
Transfusion Risk in Coronary Bypass Patients. Ann Thorac Surg. 1997; 64: 1686-93.<br />
43. Leyland-Jones B, Semiglazov V, Pawlicki M, et al. Maintaining Normal Hemoglobin Levels With<br />
Epoetin Alfa in Mainly Nonanemic Patients With Metastatic Breast Cancer Receiving First-Line<br />
Chemotherapy: A Survival Study. JCO. 2005; 23(25): 1-13.<br />
This product’s label may have been revised after this insert was used in production. For further product<br />
information and the current package insert, please visit www.amgen.com or call our medical information<br />
department toll-free at 1-800-77AMGEN (1-800-772-6436).<br />
Manufactured by:<br />
<strong>Amgen</strong> Manufacturing, Limited, a subsidiary of <strong>Amgen</strong> Inc.<br />
One <strong>Amgen</strong> Center Drive<br />
Thousand Oaks, CA 91320-1799<br />
©1989-2010 <strong>Amgen</strong> Inc. All rights reserved.<br />
1xxxxxx – v24<br />
Revised: 02/2010<br />
Page 216<br />
33
Technical Appendix 4 – Response to Voting Questions<br />
Technical Appendix 4 – Response to Voting Questions<br />
Page 217
SUMMARY OF THE EVIDENCE ADDRESSING PANEL VOTING QUESTIONS<br />
Evidence for Panel Voting Questions:<br />
Erythropoiesis-stimulating agents (ESA) were developed to fill the need unmet by red<br />
blood cell (RBC) transfusions and to avoid their inherent risks. Red blood cell<br />
transfusions and adjunctive iron are not therapeutically equivalent to ESAs for the<br />
treatment of anemia in chronic kidney disease (CKD) patients. Transfusions are<br />
transiently effective in the treatment of chronic anemia and are associated with a<br />
number of significant risks, including: acute side effects, cumulative exposure to<br />
blood-borne infections, and importantly, allo-sensitization to foreign antigens. Allosensitization<br />
can decrease a patient’s chances for successful transplantation and<br />
degrade the function of the transplanted kidney. Kidney transplantation is the<br />
preferred modality for patients with end stage renal disease because of its superior<br />
survival benefits, superior quality of life and decreased cost. Transfusions are<br />
therefore not considered appropriate as first-line chronic treatment for anemia in<br />
CKD patients and instead are reserved for treatment of acute anemia.<br />
Consequently, any evaluation of the evidence to determine the impact of ESA use on<br />
health care outcomes must, as we have done, include an assessment of the<br />
evidence regarding the impact of ESA on transfusion avoidance.<br />
<strong>Amgen</strong> Inc., the United States (US) license holder of Epoetin alfa and darbepoetin<br />
alfa, developed ESAs as supportive therapies to stimulate RBC production in order<br />
to elevate and maintain hemoglobin concentrations in patients with chronic renal<br />
failure (CRF). The FDA-approved EPOGEN ® (Epoetin alfa) Package Insert provides<br />
an example of the importance of transfusion avoidance as a core ESA clinical<br />
outcome:<br />
Page 218
SUMMARY OF THE EVIDENCE ADDRESSING PANEL VOTING QUESTIONS<br />
“EPOGEN ® is indicated for the treatment of anemia associated with CRF,<br />
including patients on dialysis and patients not on dialysis. EPOGEN ® is<br />
indicated to elevate or maintain the red blood cell level (as manifested by the<br />
hematocrit or hemoglobin determinations) and to decrease the need for<br />
transfusions in these patients.<br />
Non-dialysis patients with symptomatic anemia considered for therapy should<br />
have a hemoglobin less than 10 g/dL.<br />
EPOGEN ® is not intended for patients who require immediate correction of<br />
severe anemia. EPOGEN ® may obviate the need for maintenance<br />
transfusions but is not a substitute for emergency transfusion.”<br />
“EPOGEN ® -treated patients experienced improvements in exercise tolerance<br />
and patient-reported physical functioning at month 2 that was maintained<br />
throughout the study.”<br />
For the reasons stated above, <strong>Amgen</strong>’s response to the MEDCAC questions will only<br />
address the evidence supporting the use of ESA therapy to maintain or raise<br />
hemoglobin levels of anemic CKD patients.<br />
Iron is a necessary cofactor for RBC formation and is clearly necessary therapy for<br />
the patient who is iron deficient. However, iron alone does not replace erythropoietin<br />
in treating the anemia of CKD that results from endogenous erythropoietin<br />
deficiency. While <strong>Amgen</strong> has carefully considered the most frequently cited<br />
literature, we have not conducted any randomized controlled studies, nor are we<br />
aware of any studies or systemic literature that assess the efficacy or safety of using<br />
iron to raise or maintain the hemoglobin level to affect any of the health outcomes<br />
listed in the table below in patients with CKD on dialysis (dialysis) and CKD not on<br />
dialysis (CKD-NOD). In addition, no long-term safety studies of parenteral iron have<br />
been conducted as part of the registration programs for these products.<br />
We summarize the evidence supporting each panel voting question below. The level<br />
of confidence is a qualitative assessment and to date there is no standardized<br />
method of grading. Because there is no standard and well-accepted grading level,<br />
<strong>Amgen</strong> has chosen to leave this column blank.<br />
For further clarity in addressing the panel voting questions, we have separated the<br />
summary of evidence into two categories based on the hemoglobin target range<br />
when reported in the literature. This reference is based on the FDA-approved target<br />
Page 219
SUMMARY OF THE EVIDENCE ADDRESSING PANEL VOTING QUESTIONS<br />
hemoglobin range (10-12 g/dL), which was based on original registration trials that<br />
employed a hematocrit range 35 ± 3% (equivalent to hemoglobin of 10.7-12.7 g/dL).<br />
If a study addressing a specific question targeted a range above the FDA-approved<br />
target hemoglobin, then the study was summarized in a separate row in the table in<br />
order to provide the MEDCAC panel the opportunity to assess it separately. This<br />
separation by labeled range is used in responding to questions 1 – 4.<br />
In reviewing the evidence, we note that the hemoglobin enrollment criteria for the<br />
randomized and single arm studies supporting the registration of EPOGEN ® all used<br />
a pre-treatment hemoglobin of < 10 g/dL. Subsequent studies used a pre-treatment<br />
baseline hemoglobin of < 11 g/dL. Thus, the impact of ESA therapy on these<br />
outcomes will be summarized using the baseline hemoglobin levels specific to the<br />
available evidence for each outcome in 5b below.<br />
Finally, there are significant differences between dialysis and CKD-NOD patients:<br />
e.g., dialysis patients have more co-morbidities, greater intensity of care necessary<br />
for management, higher mortality rate, increased severity of erythropoietin deficiency<br />
and of anemia, and ongoing blood loss. Therefore, as described in our evidence<br />
review, we provide separate responses to the MEDCAC voting questions regarding<br />
the use of ESAs for the treatment of anemia for dialysis and CKD-NOD patients.<br />
Page 220
SUMMARY OF THE EVIDENCE ADDRESSING PANEL VOTING QUESTIONS<br />
Question 1: How confident are you that there is sufficient evidence to determine whether using a medical intervention (e.g., blood transfusion, iron therapy, or<br />
ESAs) to maintain or raise the hemoglobin or hematocrit levels of anemic CKD patients affects each of the health outcomes below?<br />
Health<br />
Outcome<br />
Exercise<br />
Tolerance<br />
Vascular<br />
events<br />
(including<br />
stroke, MI,<br />
CHF)<br />
Confidence<br />
Level<br />
Dialysis Patients CKD-NOD Patients<br />
Brief Response<br />
For ESAs there is a double-blind<br />
placebo-controlled RCT as well<br />
as single-arm trial data<br />
demonstrating significant<br />
improvements when treating to<br />
approximately the FDA-approved<br />
target hemoglobin (Hb) range (10-<br />
12 g/dL).<br />
Target Hb above the label<br />
range: There is data from one<br />
open-label RCT with defined and<br />
adjudicated endpoints showing<br />
elevated risks of vascular events<br />
when targeting a Hb level of 14<br />
g/dL (above the FDA-approved<br />
target Hb range [10-12 g/dL])<br />
compared to a target of 10 g/dL.<br />
There is one double-blind placebo<br />
controlled trial that demonstrated<br />
an excess in the adverse event of<br />
cerebrovascular disorder when<br />
targeting a Hb range of 11.5-13.5<br />
g/dL.<br />
Supporting<br />
Evidence<br />
Section: 1.4<br />
Figure: 5 and 6<br />
Appendix 1,<br />
Table 4<br />
Section : 1.5,<br />
1.8<br />
Appendix 1,<br />
Table 5<br />
Appendix 2,<br />
Besarab et al<br />
1998<br />
Parfrey 2005<br />
Confidence<br />
Level<br />
Brief Response<br />
For ESAs there is single-arm and nonexperimental<br />
studies data showing<br />
significant improvement when treating<br />
patients to approximately the FDAapproved<br />
target Hb range (10-12 g/dL).<br />
Target Hb above the label range:<br />
There are data from two open-label and<br />
one double-blind placebo-controlled<br />
RCTs with defined and adjudicated<br />
endpoints showing elevated risks of<br />
vascular events when targeting a Hb<br />
level of > 13 g/dL, which is above the<br />
FDA-approved target Hb range (10-<br />
12 g/dL).<br />
Supporting<br />
Evidence<br />
Section: 2.3<br />
Figure: 16, 17<br />
Appendix 1,<br />
Table 8<br />
Section : 2.4, 2.6<br />
Appendix 1,<br />
Table 5<br />
Appendix 2,<br />
Singh 2006;<br />
Pfeffer 2009<br />
Drueke 2006<br />
Page 221
SUMMARY OF THE EVIDENCE ADDRESSING PANEL VOTING QUESTIONS<br />
Question 1: How confident are you that there is sufficient evidence to determine whether using a medical intervention (e.g., blood transfusion, iron therapy, or<br />
ESAs) to maintain or raise the hemoglobin or hematocrit levels of anemic CKD patients affects each of the health outcomes below?<br />
Health<br />
Outcome<br />
Patient<br />
Perceived<br />
QoL<br />
Survival<br />
time<br />
Confidence<br />
Level<br />
Dialysis Patients CKD-NOD Patients<br />
Brief Response<br />
Target Hb to the label range:<br />
There are no RCT data evaluating<br />
these health outcomes when<br />
treating to the FDA-approved<br />
target Hb range (10-12 g/dL).*<br />
There is one double-blind placebo<br />
controlled RCT with defined and<br />
adjudicated endpoints and singlearm<br />
study data showing<br />
significant improvement when<br />
treating patients to approximately<br />
the FDA-approved Hb target<br />
range (10-12 g/dL).<br />
There is data from one open-label<br />
RCT with defined and adjudicated<br />
endpoints showing elevated risks<br />
of vascular events when targeting<br />
a Hb level of 14 g/dL (above the<br />
FDA-approved target Hb range<br />
[10-12 g/dL]) compared to a<br />
target of 10 g/dL.<br />
Supporting<br />
Evidence<br />
None available<br />
Section: 1.4<br />
Figure: 5 and 6<br />
Appendix 1,<br />
Table 4<br />
Section 1.5<br />
Figure : 9<br />
Appendix 1,<br />
Table 5<br />
Besarab et al<br />
1998<br />
Confidence<br />
Level<br />
Brief Response<br />
Target Hb to the label range: There<br />
are no RCT data evaluating these<br />
health outcomes when treating to the<br />
FDA-approved target Hb range (10-<br />
12 g/dL).<br />
There are single-arm and nonexperimental<br />
studies data showing<br />
significant improvement when treating<br />
patients to approximately the FDAapproved<br />
Hb target range (10-12 g/dL).<br />
There are data from one placebo<br />
controlled double-blind RCT and two<br />
open-label and RCTs with defined and<br />
adjudicated endpoints showing elevated<br />
risks of vascular events when targeting<br />
a Hb level of ≥ 13 g/dL, which is above<br />
the FDA-approved target Hb range (10-<br />
12 g/dL).<br />
Supporting<br />
Evidence<br />
None available<br />
Section: 2.3<br />
Figure: 16, 17<br />
Appendix 1,<br />
Table 8<br />
Section : 2.4, 2.6<br />
Appendix 1,<br />
Table 5<br />
Singh 2006;<br />
Pfeffer 2009<br />
Drueke 2006<br />
Page 222
SUMMARY OF THE EVIDENCE ADDRESSING PANEL VOTING QUESTIONS<br />
Question 1: How confident are you that there is sufficient evidence to determine whether using a medical intervention (e.g., blood transfusion, iron therapy, or<br />
ESAs) to maintain or raise the hemoglobin or hematocrit levels of anemic CKD patients affects each of the health outcomes below?<br />
Health<br />
Outcome<br />
Transfusion<br />
avoidance<br />
Confidence<br />
Level<br />
Dialysis Patients CKD-NOD Patients<br />
Brief Response<br />
There are no RCT data evaluating<br />
survival when treating to the FDAapproved<br />
target Hb range (10-12<br />
g/dL). The mortality rate in US<br />
dialysis patients in general clinical<br />
practice has declined over the<br />
past 20 years as evaluated by<br />
USRDS, which provides near<br />
complete surveillance of all US<br />
dialysis patients.<br />
A registrational double-blind<br />
placebo-controlled RCT provide<br />
substantial evidence<br />
demonstrating that treatment with<br />
EPOGEN ® to approximately the<br />
FDA-approved target Hb range<br />
(10-12 g/dL) markedly reduced<br />
transfusions (> 90% reduction) in<br />
dialysis patients.<br />
There is substantial evidence that<br />
transfusion avoidance reduces<br />
the likelihood of allo-sensitization,<br />
which can delay or preclude<br />
kidney transplantation and reduce<br />
transplant survival. Successfully<br />
Supporting<br />
Evidence<br />
Confidence<br />
Level<br />
Brief Response<br />
Appendix 2, There are no RCT data evaluating<br />
survival when treating to the FDAapproved<br />
target Hb range (10-12 g/dL).<br />
Section: 1.3,<br />
1.4, 1.5, 1.7<br />
Figure: 4, 7, 8,<br />
11, 12<br />
Appendix 1,<br />
Tables 1a, 1b,<br />
2, 3<br />
Appendix 2,<br />
Ibrahim et al.<br />
AJKD 2008<br />
Appendix 3<br />
One open-label single-arm study<br />
demonstrated a 70% reduction in<br />
transfusions over a six-month period<br />
with ESA treatment to approximately<br />
the FDA-approved target Hb range (10-<br />
12 g/dL).<br />
There is substantial evidence that<br />
transfusion avoidance reduces the<br />
likelihood of allo-sensitization, which<br />
can delay or preclude kidney<br />
transplantation and reduce transplant<br />
survival. Successfully transplanted<br />
patients have significantly greater 5-<br />
and 10-year survival.<br />
Supporting<br />
Evidence<br />
Appendix 2<br />
Section: 2.1, 2.2,<br />
2.3<br />
Figure: 14, 15<br />
Appendix 1,<br />
Tables 1a, 1b, 2,<br />
3<br />
Appendix 2,<br />
Ibrahim et al.<br />
2009<br />
Appendix 3<br />
Page 223
SUMMARY OF THE EVIDENCE ADDRESSING PANEL VOTING QUESTIONS<br />
Question 1: How confident are you that there is sufficient evidence to determine whether using a medical intervention (e.g., blood transfusion, iron therapy, or<br />
ESAs) to maintain or raise the hemoglobin or hematocrit levels of anemic CKD patients affects each of the health outcomes below?<br />
Health<br />
Outcome<br />
Confidence<br />
Level<br />
Dialysis Patients CKD-NOD Patients<br />
Brief Response<br />
transplanted patients have<br />
significantly greater 5- and 10year<br />
survival.<br />
Supporting<br />
Evidence<br />
Confidence<br />
Level<br />
Brief Response<br />
Supporting<br />
Evidence<br />
Page 224
SUMMARY OF THE EVIDENCE ADDRESSING PANEL VOTING QUESTIONS<br />
Question 2: For any health outcome listed in Question 1 for which the panel indicates at least intermediate confidence (mean score ≥ 2.5) in the sufficiency of<br />
evidence, how confident are you that maintaining or raising hemoglobin or hematocrit levels of anemic CKD patients improves each such health outcome?<br />
Health<br />
Outcome<br />
Exercise<br />
Tolerance<br />
Vascular<br />
events<br />
(including<br />
stroke, MI,<br />
CHF)<br />
Confidence<br />
Level<br />
Dialysis Patients CKD-NOD Patients<br />
Brief Response<br />
For ESAs there are RCT and<br />
single-arm trial data<br />
demonstrating significant<br />
improvements when treating to<br />
approximately the FDA-approved<br />
target Hb range (10-12 g/dL).<br />
Target Hb above the label<br />
range: There is data from one<br />
open-label RCT with defined and<br />
adjudicated endpoints showing<br />
elevated risks of vascular events<br />
when targeting a Hb level of 14<br />
g/dL (above the FDA-approved<br />
target Hb range [10-12 g/dL])<br />
compared to a target of 10 g/dL.<br />
There is one double-blind placebo<br />
controlled trial that demonstrated<br />
an excess in the adverse event of<br />
Cerebrovascular Disorder when<br />
targeting a Hb ≥ 13 g/dL<br />
Supporting<br />
Evidence<br />
Section: 1.4<br />
Figure: 5 and 6<br />
Appendix 1,<br />
Table 4<br />
Section : 1.5,<br />
1.8<br />
Appendix 1,<br />
Table 5<br />
Besarab et al<br />
1998<br />
Parfrey 2005<br />
Confidence<br />
Level<br />
Brief Response<br />
For ESAs there is single-arm and nonexperimental<br />
studies data showing<br />
significant improvement when treating<br />
patients to approximately the FDAapproved<br />
target Hb range (10-12 g/dL).<br />
Target Hb above the label range:<br />
There are data from one placebo<br />
controlled double-blind RCT and two<br />
open-label and RCTs with defined and<br />
adjudicated endpoints showing elevated<br />
risks of vascular events when targeting<br />
a Hb level of ≥ 13 g/dL, which is above<br />
the FDA-approved target Hb range (10-<br />
12 g/dL).<br />
Supporting<br />
Evidence<br />
Section: 2.3<br />
Figure: 16, 17<br />
Appendix 1,<br />
Table 8<br />
Section : 2.4, 2.6<br />
Appendix 1,<br />
Table 5<br />
Singh 2006;<br />
Pfeffer 2009<br />
Drueke 2006<br />
Page 225
SUMMARY OF THE EVIDENCE ADDRESSING PANEL VOTING QUESTIONS<br />
Question 2: For any health outcome listed in Question 1 for which the panel indicates at least intermediate confidence (mean score ≥ 2.5) in the sufficiency of<br />
evidence, how confident are you that maintaining or raising hemoglobin or hematocrit levels of anemic CKD patients improves each such health outcome?<br />
Health<br />
Outcome<br />
Patient<br />
Perceived<br />
QoL<br />
Survival<br />
time<br />
Confidence<br />
Level<br />
Dialysis Patients CKD-NOD Patients<br />
Brief Response<br />
Target Hb to the label range:<br />
There are no RCT data evaluating<br />
these health outcomes when<br />
treating to the FDA-approved<br />
target Hb range (10-12 g/dL).<br />
There are RCT and single-arm<br />
study data showing significant<br />
improvement when treating<br />
patients to approximately the<br />
FDA-approved Hb target range<br />
(10-12 g/dL).<br />
There is data from one RCT with<br />
defined and adjudicated<br />
endpoints showing elevated risks<br />
of mortality when targeting a Hb<br />
level of 14 g/dL (above the FDAapproved<br />
target Hb range [10-12<br />
g/dL]) compared to a target of 10<br />
g/dL.<br />
Supporting<br />
Evidence<br />
Appendix 2<br />
Section: 1.4<br />
Figure: 5 and 6<br />
Appendix 1,<br />
Table 4<br />
Section 1.5<br />
Figure : 9<br />
Appendix 1,<br />
Table 5<br />
Besarab et al<br />
1998<br />
Confidence<br />
Level<br />
Brief Response<br />
Target Hb to the label range: There<br />
are no RCT data evaluating these<br />
health outcomes when treating to the<br />
FDA-approved target Hb range (10-12<br />
g/dL).<br />
There are single-arm and nonexperimental<br />
studies data showing<br />
significant improvement when treating<br />
patients to approximately the FDAapproved<br />
Hb target range (10-12 g/dL).<br />
There are data from one placebo<br />
controlled double-blind RCT and two<br />
open-label and RCTs with defined and<br />
adjudicated endpoints showing elevated<br />
risks of vascular events when targeting<br />
a Hb level of ≥ 13 g/dL, which is above<br />
the FDA-approved target Hb range (10-<br />
12 g/dL).<br />
Supporting<br />
Evidence<br />
Appendix 2<br />
Section: 2.3<br />
Figure: 16, 17<br />
Appendix 1,<br />
Table 8<br />
Section : 2.4, 2.6<br />
Appendix 1,<br />
Table 5<br />
Singh 2006;<br />
Pfeffer 2009<br />
Page 226
SUMMARY OF THE EVIDENCE ADDRESSING PANEL VOTING QUESTIONS<br />
Question 2: For any health outcome listed in Question 1 for which the panel indicates at least intermediate confidence (mean score ≥ 2.5) in the sufficiency of<br />
evidence, how confident are you that maintaining or raising hemoglobin or hematocrit levels of anemic CKD patients improves each such health outcome?<br />
Health<br />
Outcome<br />
Transfusion<br />
avoidance<br />
Confidence<br />
Level<br />
Dialysis Patients CKD-NOD Patients<br />
Brief Response<br />
There are no RCT data evaluating<br />
survival when treating to the FDAapproved<br />
target Hb range (10-<br />
12 g/dL). The mortality rate in US<br />
dialysis patients in general clinical<br />
practice has declined over the<br />
past 20 years as evaluated by<br />
USRDS, which provides near<br />
complete surveillance of all US<br />
dialysis patients.<br />
RCTs provide substantial<br />
evidence demonstrating that<br />
treatment with EPOGEN ® to<br />
approximately the FDA-approved<br />
target Hb range (10-12 g/dL)<br />
markedly reduced transfusions (><br />
90% reduction) in dialysis<br />
patients.<br />
There is substantial evidence that<br />
transfusion avoidance reduces<br />
the likelihood of allo-sensitization,<br />
which can delay or preclude<br />
kidney transplantation and reduce<br />
transplant survival. Successfully<br />
transplanted patients have<br />
Supporting<br />
Evidence<br />
Confidence<br />
Level<br />
Brief Response<br />
Appendix 2, There are no RCT data evaluating<br />
survival when treating to the FDAapproved<br />
target Hb range (10-12 g/dL).<br />
Section: 1.3,<br />
1.4, 1.5, 1.7<br />
Figure: 4, 7, 8,<br />
11, 12<br />
Appendix 1,<br />
Tables 1a, 1b,<br />
2, 3<br />
Appendix 2,<br />
Ibrahim et al.<br />
AJKD 2008<br />
Appendix 3<br />
There is data from one placebocontrolled<br />
RCT demonstrating a near<br />
halving of transfusions when patients<br />
were treated to a Hb of 13 g/dL as<br />
compared to placebo with rescue at<br />
9 g/dL. 13 g/dL is above the FDA<br />
approved range of 10-12 g/dL.<br />
One open-label single-arm study<br />
demonstrated a 70% reduction in<br />
transfusions over a six-month period<br />
with ESA treatment to approximately<br />
the FDA-approved target Hb range (10-<br />
12 g/dL).<br />
There is substantial evidence that<br />
transfusion avoidance reduces the<br />
Supporting<br />
Evidence<br />
Appendix 2,<br />
Pfeffer 2009<br />
Section: 2.1, 2.2,<br />
2.3<br />
Figure: 14, 15<br />
Appendix 1,<br />
Tables 1a, 1b, 2,<br />
3<br />
Appendix 2,<br />
Ibrahim et al.<br />
2009<br />
Appendix 3<br />
Page 227
SUMMARY OF THE EVIDENCE ADDRESSING PANEL VOTING QUESTIONS<br />
Question 2: For any health outcome listed in Question 1 for which the panel indicates at least intermediate confidence (mean score ≥ 2.5) in the sufficiency of<br />
evidence, how confident are you that maintaining or raising hemoglobin or hematocrit levels of anemic CKD patients improves each such health outcome?<br />
Health<br />
Outcome<br />
Confidence<br />
Level<br />
Dialysis Patients CKD-NOD Patients<br />
Brief Response<br />
significantly greater 5- and 10year<br />
survival.<br />
Supporting<br />
Evidence<br />
Confidence<br />
Level<br />
Brief Response<br />
likelihood of allo-sensitization, which<br />
can delay or preclude kidney<br />
transplantation and reduce transplant<br />
survival. Successfully transplanted<br />
patients have significantly greater 5-<br />
and 10-year survival.<br />
Supporting<br />
Evidence<br />
Page 228
SUMMARY OF THE EVIDENCE ADDRESSING PANEL VOTING QUESTIONS<br />
Question 3: For any health outcome addressed in Question 2 for which the panel indicates at least intermediate confidence (mean score > 2.5), how<br />
confident are you that there is sufficient evidence to determine whether the use of ESAs to maintain or raise hemoglobin or hematocrit levels of CKD<br />
patients improves each such health outcome?<br />
Answer 3: <strong>Amgen</strong>’s response to question # 2 (above) provides a review of the evidence addressing the impact of raising hemoglobin levels with ESAs on<br />
the specific health outcomes.<br />
Page 229
SUMMARY OF THE EVIDENCE ADDRESSING PANEL VOTING QUESTIONS<br />
Question 4: How confident are you that there is sufficient evidence to determine whether the use of ESAs to maintain or raise the hemoglobin or hematocrit levels of<br />
anemic CKD patients worsens any health outcome listed in Question 1?<br />
Health<br />
Outcome<br />
Worsens<br />
Exercise<br />
Tolerance<br />
Worsens<br />
Vascular<br />
events<br />
including<br />
stroke, MI,<br />
CHF<br />
Confidence<br />
Level<br />
Dialysis Patients CKD-NOD Patients<br />
Brief Response<br />
There are RCT and single-arm study<br />
data showing significant improvement<br />
in exercise when treating patients to the<br />
FDA-approved labeled Hb range of 10-<br />
12 g/dL<br />
There is data from one RCT with<br />
defined and adjudicated endpoints<br />
showing elevated risks of mortality<br />
when targeting a Hb level of 14 g/dL<br />
(above the FDA-approved target Hb<br />
range [10-12 g/dL]) compared to a<br />
target of 10 g/dL.<br />
There is one double-blind placebo<br />
controlled trial that demonstrated an<br />
excess in the adverse event of<br />
cerebrovascular disorder when<br />
targeting a Hb ≥ 13 g/dL<br />
Supporting<br />
Evidence<br />
Section: 1.4<br />
Figure: 5 and 6<br />
Appendix 1,<br />
Table 4<br />
Section: 1.5,<br />
1.8<br />
Appendix 1,<br />
Table 5<br />
Appendix 2,<br />
Besarab 1998<br />
Parfrey 2005<br />
Confidence<br />
Level<br />
Brief Response<br />
For ESAs there are single-arm and<br />
non-experimental study data<br />
showing significant improvement<br />
when treating patients to the FDAapproved<br />
labeled Hb range of 10-12<br />
g/dL<br />
There are data from one placebo<br />
controlled double-blind RCT and<br />
two open-label RCTs with defined<br />
and adjudicated endpoints showing<br />
elevated risks of vascular events<br />
when targeting a Hb level of ≥ 13<br />
g/dL, which is above the FDAapproved<br />
target Hb range (10-12<br />
g/dL).<br />
There is one double-blind placebo<br />
controlled trial that demonstrated an<br />
excess in the adverse event of<br />
Cerebrovascular Disorder when<br />
targeting a Hb ≥ 13 g/dL<br />
Supporting<br />
Evidence<br />
Section: 2.3<br />
Figure: 16, 17<br />
Appendix 1,<br />
Table 8<br />
Section: 2.4, 2.6<br />
Appendix 1,<br />
Table 5<br />
Appendix 2,<br />
Singh 2006;<br />
Pfeffer 2009<br />
Drueke 2006<br />
Page 230
SUMMARY OF THE EVIDENCE ADDRESSING PANEL VOTING QUESTIONS<br />
Question 4: How confident are you that there is sufficient evidence to determine whether the use of ESAs to maintain or raise the hemoglobin or hematocrit levels of<br />
anemic CKD patients worsens any health outcome listed in Question 1?<br />
Health<br />
Outcome<br />
Worsens<br />
Vascular<br />
events<br />
including<br />
stroke, MI,<br />
CHF<br />
Worsens<br />
Patient<br />
Perceived QoL<br />
Worsens<br />
Survival time<br />
(RCT)<br />
Confidence<br />
Level<br />
Dialysis Patients CKD-NOD Patients<br />
Brief Response<br />
There are no RCT data evaluating<br />
these health outcomes when treating to<br />
the label Hb range (10-12 g/dL).<br />
There is a double-blind placebo<br />
controlled RCT and single-arm study<br />
data showing significant improvement<br />
when treating patients to the FDAapproved<br />
labeled Hb range of 10-12<br />
g/dL.<br />
There is data from one RCT showing<br />
elevated risks of mortality when<br />
targeting a Hb level of 14 g/dL (above<br />
the FDA-approved target Hb range (10-<br />
12 g/dL) compared to a target of 10<br />
g/dL.<br />
Supporting<br />
Evidence<br />
Section: 1.4<br />
Figure: 5 and 6<br />
Appendix 1,<br />
Table 4<br />
Section 1.5<br />
Figure: 9<br />
Appendix 1,<br />
Table 5<br />
Appendix 2,<br />
Besarab et al<br />
1998<br />
Confidence<br />
Level<br />
Brief Response<br />
There are no RCT data evaluating<br />
these health outcomes when<br />
treating to the label Hb range (10-<br />
12 g/dL).<br />
There are single-arm and nonexperimental<br />
studies data showing<br />
significant improvement when<br />
treating patients to the FDAapproved<br />
labeled range of 10-12<br />
g/dL.<br />
There are data from one placebo<br />
controlled double-blind RCT and<br />
two open-label RCTs with defined<br />
and adjudicated endpoints showing<br />
elevated risks of vascular events<br />
when targeting a Hb level of ≥ 13<br />
g/dL, which is above the FDAapproved<br />
target Hb range (10-12<br />
g/dL).<br />
Supporting<br />
Evidence<br />
Section: 2.3<br />
Figure: 16, 17<br />
Appendix 1,<br />
Table 8<br />
Section: 2.4, 2.6<br />
Appendix 1,<br />
Table 5<br />
Appendix 2,<br />
Singh 2006;<br />
Drueke 2006<br />
Page 231
SUMMARY OF THE EVIDENCE ADDRESSING PANEL VOTING QUESTIONS<br />
Question 4: How confident are you that there is sufficient evidence to determine whether the use of ESAs to maintain or raise the hemoglobin or hematocrit levels of<br />
anemic CKD patients worsens any health outcome listed in Question 1?<br />
Health<br />
Outcome<br />
Worsens<br />
Survival time<br />
Transfusion<br />
avoidance<br />
Confidence<br />
Level<br />
Dialysis Patients CKD-NOD Patients<br />
Brief Response<br />
There are no RCT data evaluating<br />
survival when treating to the label range<br />
(10-12 g/dL).<br />
The mortality rate in US dialysis<br />
patients in general clinical practice has<br />
declined over the past 20 years as<br />
evaluated by USRDS, which provides<br />
near complete surveillance of all US<br />
dialysis patients.<br />
For ESAs there is a placebo-controlled<br />
double-blind RCT and a single-arm<br />
study data showing significant<br />
improvement in transfusion<br />
avoidance/reduction when treating<br />
patients to the FDA-approved labeled<br />
Hb range of 10-12 g/dL.<br />
Supporting<br />
Evidence<br />
Section 1.5<br />
Figure : 9<br />
Appendix 1,<br />
Table 5<br />
Appendix 1,<br />
Table 3<br />
Appendix 2,<br />
Eschbach,<br />
1989<br />
Confidence<br />
Level<br />
Brief Response<br />
There are no RCT CV outcome<br />
data evaluating survival when<br />
treating to the label Hb range (10-<br />
12 g/dL).<br />
For ESAs there are single-arm and<br />
non-experimental study data<br />
showing significant improvement<br />
when treating patients to the FDAapproved<br />
labeled Hb range of 10-12<br />
g/dL.<br />
Supporting<br />
Evidence<br />
None available<br />
Section: 2.3<br />
Figure: 16, 17<br />
Appendix 1,<br />
Table 8<br />
Page 232
SUMMARY OF THE EVIDENCE ADDRESSING PANEL VOTING QUESTIONS<br />
Question 5a: Please discuss any impact of the following factors on the conclusion reached above.<br />
Answer 5a: There are significant differences between CKD not on dialysis and CKD on dialysis patients: e.g., co-morbidities, intensity of care necessary for<br />
management, mortality rate, severity of erythropoietin deficiency and of anemia, and ongoing blood loss. Therefore, as described in our evidence review, we<br />
provided separate responses regarding the use of ESAs for the treatment of anemia for CKD on dialysis and CKD not on dialysis patients for questions 1 -4 above,<br />
and for question 5 b below.<br />
Question 5b: For any health outcome listed in Question 1 for which the panel indicates at least intermediate confidence (mean score ≥ 2.5) in the sufficiency of<br />
evidence, how confident are you that maintaining or raising hemoglobin or hematocrit levels of anemic CKD patients improves each such health outcome, and<br />
whether this is different for different pre-treatment hemoglobin levels (
SUMMARY OF THE EVIDENCE ADDRESSING PANEL VOTING QUESTIONS<br />
5c. Whether an appropriate target hemoglobin or hematocrit has been set for the<br />
CKD patients?<br />
10-12 g/dL in dialysis, as specified in product labeling. Please see responses to<br />
questions 1-4 where we separately discuss the risks and benefits for dialysis and CKD-<br />
NOD patients<br />
10-12 g/dL in CKD-NOD, as specified in product labeling. Please see responses to<br />
questions 1-4 where we separately discuss the risks and benefits for dialysis and CKD-<br />
NOD patients<br />
5d. Whether the ESA dosing strategy has been implemented to minimize the<br />
rapidity of hemoglobin or hematocrit rise and/or oscillations in their levels.<br />
In dialysis, there are no prospective RCTs evaluating dosing algorithms other than those<br />
in the <strong>Amgen</strong> labels for EPOGEN ® and Aranesp ® . There are no RCTs specifically<br />
evaluating algorithms that modify rate of rise or variability.<br />
In CKD-NOD, there are no prospective RCTs evaluating dosing algorithms other than<br />
those in the <strong>Amgen</strong> labels for EPOGEN ® and Aranesp ® . There are no RCTs specifically<br />
evaluating algorithms that modify rate of rise or variability.<br />
5e. Whether the CKD patient has demonstrated a blunted or “non-response” to<br />
interventions to raise hemoglobin or hematocrit.<br />
Page 239<br />
Post hoc analysis of RCTs targeting hemoglobin concentrations ≥ 13 g/dL, suggest that<br />
hyporesponsive dialysis patients are at increased risk of cardiovascular events and<br />
mortality. None of these analyses can confirm or refute that this increased risk is related<br />
to ESA treatment or dose. While there is no RCT evidence for guiding management,<br />
<strong>Amgen</strong> has proactively modified its label to incorporate prudent dosing guidance for the<br />
hyporesponsive patient.<br />
Post hoc analysis of RCTs targeting hemoglobin concentrations ≥ 13 g/dL, suggest that<br />
hyporesponsive CKD-NOD patients are at increased risk of cardiovascular events and<br />
mortality. None of these analyses can confirm or refute that this increased risk is related<br />
to ESA treatment or dose. While there is no RCT evidence for guiding management,
SUMMARY OF THE EVIDENCE ADDRESSING PANEL VOTING QUESTIONS<br />
<strong>Amgen</strong> has proactively modified its label to incorporate prudent dosing guidance for the<br />
hyporesponsive patient.<br />
5f. Whether the CKD patient has been evaluated to determine the etiology (cause)<br />
of the anemia.<br />
<strong>Amgen</strong>’s ESAs are to be used for the indicated causes of anemia of which the anemia of<br />
dialysis is being discussed herein. The product labeling indicates that iron deficiency<br />
should be repaired at the time of and during the course of therapy. The label also<br />
outlines guidance for patients who lose or have an insufficient hemoglobin response.<br />
These warnings apply to dialysis.<br />
<strong>Amgen</strong>’s ESAs are to be used for the indicated causes of anemia, of which, the anemia<br />
of CKD-NOD is being discussed herein. The product labeling indicates that iron<br />
deficiency should be repaired at the time of and during the course of therapy. The label<br />
also outlines guidance for patients who lose or have an insufficient hemoglobin<br />
response. These warnings apply to CKD-NOD.<br />
5g. Whether the CKD patient demonstrates cardiac, cerebral or other vascular<br />
comorbidities.<br />
<strong>Amgen</strong> considers that safety signals derived from RCTs should be applied to all patients<br />
in the absence of compelling and high-quality evidence to identify a specific, at-risk<br />
subgroup. As such, safety signals with regard to cardiovascular morbidity and mortality<br />
are applied to all dialysis patients.<br />
<strong>Amgen</strong> considers the safety signals derived from RCTs should be applied to all patients<br />
in the absence of compelling and high-quality evidence to identify a specific subgroup at<br />
risk. As such, safety signals with regard to cardiovascular morbidity and mortality are<br />
applied to all CKD-NOD patients.<br />
6. What clinical trials designs would be most desirable to fill in any indentified<br />
evidence gaps?<br />
The totality of the evidence informing the benefit and risks of ESA in CKD patients was<br />
last reviewed at the September 2007 joint meeting between the FDA CRDAC & Drug<br />
Safety and Risk Management Advisory Committee. Three areas were identified for<br />
Page 240
SUMMARY OF THE EVIDENCE ADDRESSING PANEL VOTING QUESTIONS<br />
further study: hyporesponsiveness, variability and target hemoglobin.<br />
Hyporesponsiveness and hemoglobin variability, and dosing strategies that may<br />
minimize variability, are most relevant to dialysis patients. It was agreed that the<br />
completion of TREAT would be an important milestone in our understanding of the use<br />
of ESAs in CKD-NOD.<br />
Page 241<br />
Placebo controlled studies of optimal hemoglobin targets are most relevant to CKD-NOD<br />
patients as a randomized placebo controlled trial is not feasible in the dialysis<br />
population. Progress has been made, including the completion of TREAT and its<br />
communication to FDA, and we look forward to an upcoming DAC meeting with the FDA<br />
to guide future studies.