
You also want an ePaper? Increase the reach of your titles
YUMPU automatically turns print PDFs into web optimized ePapers that Google loves.
October 1, 2012<br />
Mr. Mark McPherson<br />
Equity Ventures<br />
200 Dahlia Street<br />
Denver, CO 80220<br />
<strong>SM</strong> <strong>ROCHA</strong>, <strong>LLC</strong><br />
Traffic and Transportation Consultants<br />
RE: Natural Grocers – Vitamin Cottage / Traffic Generation Analysis<br />
<strong>Jefferson</strong> <strong>County</strong>, Colorado<br />
Ref: 12-09212tg<br />
Dear Mr. McPherson,<br />
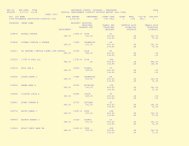
<strong>SM</strong> <strong>ROCHA</strong> <strong>LLC</strong> is pleased to provide traffic generation information for the proposed retail<br />
development entitled Natural Grocers – Vitamin Cottage. This development is located near the<br />
corner of Kipling Parkway and Coal Mine Avenue in <strong>Jefferson</strong> <strong>County</strong>, Colorado.<br />
The purpose of this analysis is to present traffic likely generated by the proposed development,<br />
evaluate potential impacts to the adjacent roadway network, and make recommendations for<br />
roadway improvements where appropriate. Also included is additional analysis and information<br />
requested by <strong>County</strong> Staff to address intersection operation concerns along Coal Mine Avenue.<br />
The following is a summary of analysis results.<br />
Site Description and Access<br />
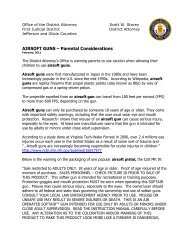
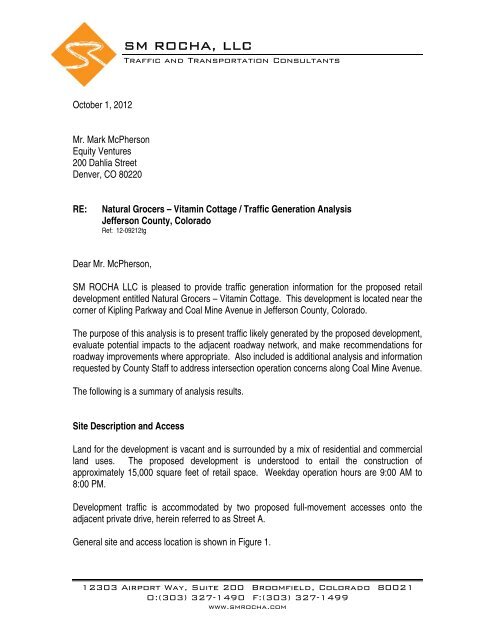
Land for the development is vacant and is surrounded by a mix of residential and commercial<br />
land uses. The proposed development is understood to entail the construction of<br />
approximately 15,000 square feet of retail space. Weekday operation hours are 9:00 AM to<br />
8:00 PM.<br />
Development traffic is accommodated by two proposed full-movement accesses onto the<br />
adjacent private drive, herein referred to as Street A.<br />
General site and access location is shown in Figure 1.<br />
12303 Airport Way, Suite 200 Broomfield, Colorado 80021<br />
O:(303) 327-1490 F:(303) 327-1499<br />
www.smrocha.com
Coal Mine Avenue<br />
<strong>SM</strong> <strong>ROCHA</strong>, <strong>LLC</strong><br />
Natural Grocers - Vitamin Cottage<br />
Traffic Generation Analysis<br />
<strong>Jefferson</strong> <strong>County</strong>, Colorado<br />
Kipling Parkway<br />
Figure 1<br />
SITE LOCATION<br />
October 2012 Page 2<br />
SITE<br />
Access<br />
Access<br />
Street A<br />
North<br />
Not to Scale
Mr. Mark McPherson October 1, 2012<br />
Natural Grocers – Vitamin Cottage Page 3<br />
Existing and Committed Surface Transportation Network<br />
Within the study area, Street A is the primary roadway that accommodates traffic to and from<br />
the proposed development. Secondary roadways include Coal Mine Avenue and Kipling<br />
Parkway. A brief description of each roadway is provided below:<br />
Street A is a north-south collector roadway with two through lanes (one lane in each direction)<br />
with a combination of exclusive or shared turn lanes at the critical intersections of Coal Mine<br />
Avenue and Kipling Parkway. No posted speed limit is provided.<br />
Coal Mine Avenue and Kipling Parkway are arterial roadways, with shared and exclusive<br />
turn lanes at intersections. The provided speed limit for Kipling Parkway is 45 MPH. Coal<br />
Mine Avenue is posted at 35 MPH.<br />
The Kipling Parkway intersection with Coal Mine Avenue is signalized, while the intersection of<br />
Street A operates under a stop-controlled condition. A stop-controlled intersection is defined<br />
as a roadway intersection where vehicle right-of-ways are controlled by one or more “STOP”<br />
signs.<br />
No specific improvements to Street A, Coal Mine Avenue, or Kipling Parkway are known to be<br />
planned or committed at this time. Each roadway is built out to its ultimate cross-section.<br />
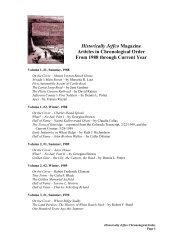
Existing Traffic Conditions<br />
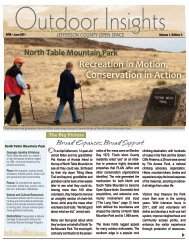
AM and PM Peak Hour traffic counts were collected at the Coal Mine Avenue intersections of<br />
Kipling Parkway and Street A. These counts are shown on Figure 2. Traffic count data is<br />
included in Appendix A.<br />
The Signalized and Unsignalized Intersection Analysis techniques, as published in the Highway<br />
Capacity Manual (HCM) by the Transportation Research Board and as incorporated into the<br />
SYNCHRO computer program, were used to analyze the study intersections for existing traffic<br />
conditions. These techniques allows for the determination of intersection Level of Service<br />
(LOS) based on the congestion and delay of each traffic movement.<br />
The level of service analyses results for existing conditions are summarized in Table 1.<br />
Definitions of Levels of Service are given in Appendix B, and capacity worksheets are provided<br />
in Appendix C.<br />
Ref: 12-09212tg
Coal Mine Avenue<br />
44 / 89<br />
681 / 948<br />
151 / 271<br />
76 / 55<br />
233 / 227<br />
157 / 92<br />
(23,610)<br />
Kipling Parkway<br />
Coal Coal<br />
<strong>SM</strong> <strong>ROCHA</strong>, <strong>LLC</strong><br />
Natural Grocers - Vitamin Cottage<br />
Traffic Generation Analysis<br />
<strong>Jefferson</strong> <strong>County</strong>, Colorado<br />
Kipling<br />
183 / 119<br />
217 / 281<br />
136 / 174<br />
65 / 118<br />
852 / 879<br />
142 / 154<br />
(12,260)<br />
41 / 47<br />
0 / 3<br />
33 / 71<br />
38 / 40<br />
456 / 600<br />
32 / 12<br />
53 / 71<br />
477 / 518<br />
0 / 2<br />
18 / 9<br />
0 / 0<br />
1 / 1<br />
Figure 2<br />
EXISTING TRAFFIC<br />
Volumes & Intersection Geometry<br />
AM / PM Peak Hour<br />
(ADT): Average Daily Traffic<br />
October 2012 Page 4<br />
.<br />
Str. A<br />
.<br />
(961)<br />
Street A<br />
North<br />
Not to Scale
Mr. Mark McPherson October 1, 2012<br />
Natural Grocers – Vitamin Cottage Page 5<br />
TABLE 1<br />
INTERSECTION CAPACITY ANALYSIS SUMMARY<br />
EXISTING TRAFFIC<br />
INTERSECTION LEVEL OF SERVICE<br />
LANE GROUPS AM PEAK HOUR PM PEAK HOUR<br />
Coal Mine Avenue / Kipling Parkway (Signalized) B (16.5) C (21.6)<br />
Coal Mine Avenue / Street A (Stop-Controlled)<br />
Eastbound Left A A<br />
Westbound Left A A<br />
Northbound Left, Through and Right C D<br />
Southbound Left C D<br />
Southbound Through C B<br />
Key: Signalized Intersection: Level of Service (Control Delay in sec/veh)<br />
Stop-Controlled Intersection: Level of Service<br />
Existing Traffic Analysis Results<br />
Under existing conditions, operational analysis shows that the study intersection of Coal Mine<br />
Avenue and Kipling Parkway has a LOS B operation during the AM Peak Hour and LOS C<br />
operation in the PM Peak Hour of traffic.<br />
The stop-controlled intersection of Street A and Coal Mine Avenue has operational analysis<br />
results that vary from LOS A to LOS D throughout peak traffic hours. As Table 1 shows, the<br />
majority of traffic movement operates at LOS C or better. However, southbound and<br />
northbound left turns onto Coal Mine Road operate at LOS D in only the PM Peak Hour. It is<br />
not uncommon for unsignalized turn movements to and from arterial roadways, in urban areas,<br />
to operate with noticeable delays during peak hours. It is, however, likely that the turn<br />
movements will operate better than the results obtained with this HCM Two Way Stop Control<br />
(TWSC) level of service analysis, as the analysis does not take into account platooning of<br />
vehicles, and gaps caused by upstream signals 1. The upstream signal control of Coal Mine<br />
Avenue and Kipling Parkway will tend to create additional gaps in the traffic stream for left turn<br />
movements at the Street A intersection.<br />
1 Transportation Research Board, Highway Capacity Manual, 2000, Washington DC, Section 17-13<br />
Ref: 12-09212tg
Mr. Mark McPherson October 1, 2012<br />
Natural Grocers – Vitamin Cottage Page 6<br />
Vehicle Trip Generation<br />
Standard traffic generation characteristics compiled by the Institute of Transportation Engineers<br />
(ITE) in their report entitled Trip Generation, 8 th Edition were applied to the proposed land use<br />
in order to estimate the average daily traffic (ADT) and peak hour vehicle trips for the<br />
development. A vehicle trip is defined as a one-way vehicle movement from point of origin to<br />
point of destination.<br />
ITE’s Trip Generation Manual provides no traffic generation characteristics information specific<br />
to the proposed Natural Grocer-Vitamin Cottage development. As such, traffic characteristics<br />
of Supermarket (ITE Land Use Code 850) and Pharmacy/Drugstore without drive through (ITE<br />
Land Use Code 880) were considered in effort to find the closest match to the proposed<br />
development. It was concluded that Supermarket provides the best fit.<br />
Table 2 presents trip generation rates used in this analysis.<br />
TABLE 2<br />
TRIP GENERATION RATES<br />
TRIP GENERATION RATES<br />
ITE 24 AM PEAK HOUR PM PEAK HOUR<br />
CODE LAND USE UNIT HOUR ENTER EXIT TOTAL ENTER EXIT TOTAL<br />
850 Supermarket KSF 102.24 2.19 1.40 3.59 5.36 5.15 10.50<br />
Key: KSF = Thousand Square Feet Gross Floor Area<br />
Table 3 illustrates the projected average daily traffic (ADT) and peak hour traffic volumes likely<br />
generated by the proposed land use.<br />
TABLE 3<br />
TRIP GENERATION SUMMARY<br />
TOTAL TRIPS GENERATED<br />
ITE 24 AM PEAK HOUR PM PEAK HOUR<br />
CODE LAND USE SIZE HOUR ENTER EXIT TOTAL ENTER EXIT TOTAL<br />
850 Supermarket 15 KSF 1,534 33 21 54 80 77 158<br />
20% Trip Reduction: 1,227 26 17 43 64 62 126<br />
Key: KSF = Thousand Square Feet Gross Floor Area<br />
Ref: 12-09212tg
Mr. Mark McPherson October 1, 2012<br />
Natural Grocers – Vitamin Cottage Page 7<br />
As Table 3 shows, the proposed development has the potential to generate approximately<br />
1,227 daily trips with 43 of those occurring during the AM Peak Hour and 126 during the PM<br />
Peak Hour.<br />
Adjustments to Trip Generation Rates<br />
A development of this type is likely to attract vehicle trips from the adjacent roadway system,<br />
defined by ITE Trip Generation Handbook as pass-by-trips. Moreover, the proposed<br />
development is considered a specialty store and is likely to generate less traffic volume than a<br />
typical supermarket. As such, a twenty percent trip reduction was used in this analysis. This<br />
reduction is also consistent with ITE published reduction rates for supermarkets.<br />
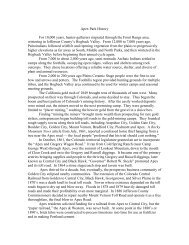
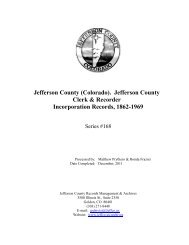
Trip Distribution<br />
The overall directional distribution of site-generated traffic was determined based on existing<br />
area land uses and the available roadway network.<br />
Figure 3 shows trip distribution patterns for the development.<br />
Project Trip Assignment<br />
Traffic assignment is how the site-generated and distributed trips are expected to be loaded on<br />
the roadway network. Applying trip distribution patterns to site-generated traffic provides the<br />
site-generated trip assignments shown on Figure 3.<br />
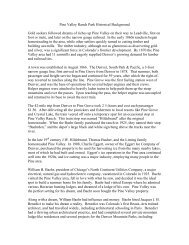
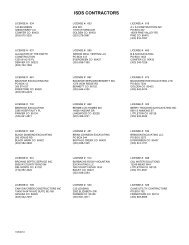
Future Traffic Forecasts with Proposed Development<br />
Site-generated traffic was added to existing traffic projections to develop total traffic<br />
projections. The focus of total traffic projections is the critical Coal Mine Avenue intersections<br />
of Kipling Parkway and Street A.<br />
For analysis purposes, it was assumed that development build out would occur by end of Year<br />
2012. No roadway improvements were considered for analysis.<br />
Figure 4 shows projected total traffic volumes and intersection geometry.<br />
Ref: 12-09212tg
Coal Mine Avenue<br />
(25%)<br />
7 / 16<br />
Kipling Parkway<br />
(25%)<br />
5 / 16<br />
<strong>SM</strong> <strong>ROCHA</strong>, <strong>LLC</strong><br />
Natural Grocers - Vitamin Cottage<br />
Traffic Generation Analysis<br />
<strong>Jefferson</strong> <strong>County</strong>, Colorado<br />
5 / 16<br />
4 / 15<br />
Access<br />
October 2012 Page 8<br />
SITE<br />
Access<br />
4 / 16<br />
4 / 15<br />
9 / 31<br />
9 / 31<br />
4 / 15<br />
12 / 32<br />
(25%)<br />
7 / 16<br />
7 / 16<br />
Street A<br />
12 / 32<br />
7 / 16<br />
7 / 16<br />
(25%)<br />
North<br />
Not to Scale<br />
Figure 3<br />
DISTRIBUTION<br />
(%) Overall<br />
SITE-GENERATED TRAFFIC<br />
AM / PM Peak Hour
Coal<br />
Coal Mine Avenue<br />
<strong>SM</strong> <strong>ROCHA</strong>, <strong>LLC</strong><br />
Natural Grocers - Vitamin Cottage<br />
Traffic Generation Analysis<br />
<strong>Jefferson</strong> <strong>County</strong>, Colorado<br />
Kipling<br />
44 / 89<br />
681 / 948<br />
151 / 271<br />
76 / 55<br />
240 / 243<br />
157 / 92<br />
(23,610)<br />
Kipling Parkway<br />
183 / 119<br />
222 / 297<br />
140 / 189<br />
65 / 118<br />
852 / 879<br />
147 / 170<br />
(12,870)<br />
50 / 78<br />
0 / 3<br />
37 / 86<br />
50 / 72<br />
456 / 600<br />
32 / 12<br />
60 / 87<br />
477 / 518<br />
0 / 2<br />
18 / 9<br />
0 / 0<br />
1 / 1<br />
Figure 4<br />
TOTAL TRAFFIC<br />
Volumes & Intersection Geometry<br />
AM / PM Peak Hour<br />
(ADT): Average Daily Traffic<br />
October 2012 Page 9<br />
Coal<br />
Access<br />
.<br />
SITE<br />
Access<br />
Str. A<br />
.<br />
(1,260)<br />
4 / 16<br />
4 / 15<br />
9 / 31<br />
7 / 16<br />
28 / 48<br />
32 / 63<br />
7 / 16<br />
34 / 42<br />
Street A<br />
12 / 32<br />
41 / 58<br />
Acc. .<br />
Str. A<br />
North<br />
Not to Scale
Mr. Mark McPherson October 1, 2012<br />
Natural Grocers – Vitamin Cottage Page 10<br />
Development Impacts<br />
As Figure 3 shows, peak hour traffic volumes anticipated for the proposed development are<br />
minimal. These minimal volumes are not likely to negatively impact operations of the existing<br />
Coal Mine Avenue intersections of Kipling Parkway and Street A.<br />
Since the roadway sections of Street A and Coal Mine Avenue are built out, the need for<br />
roadway improvements to accommodate traffic volume generated by the proposed land use is<br />
not anticipated.<br />
Peak Hour Intersection Levels of Service<br />
As with existing traffic, the operations of the study intersections were analyzed under projected<br />
total traffic conditions using the SYNCHRO computer program. Total traffic level of service<br />
analysis results for development build out are summarized in Table 4. Definitions of Levels of<br />
Service are given in Appendix B, and capacity worksheets are provided in Appendix C.<br />
TABLE 4<br />
INTERSECTION CAPACITY ANALYSIS SUMMARY<br />
TOTAL TRAFFIC<br />
INTERSECTION LEVEL OF SERVICE<br />
LANE GROUPS AM PEAK HOUR PM PEAK HOUR<br />
Coal Mine Avenue / Kipling Parkway (Signalized) B (16.6) C (21.9)<br />
Coal Mine Avenue / Street A (Stop-Controlled)<br />
Eastbound Left A A<br />
Westbound Left A A<br />
Northbound Left, Through and Right C D<br />
Southbound Left C E<br />
Southbound Through C B<br />
Key: Signalized Intersection: Level of Service (Control Delay in sec/veh)<br />
Stop-Controlled Intersection: Level of Service<br />
Total Traffic Analysis Results upon Development Build Out<br />
Table 4 shows that the existing signalized intersection of Coal Mine Avenue and Kipling<br />
Parkway upon development build out is projected to operate with an overall LOS B and LOS C<br />
during respective peak traffic hours, similar to existing conditions.<br />
Ref: 12-09212tg
Mr. Mark McPherson October 1, 2012<br />
Natural Grocers – Vitamin Cottage Page 11<br />
The stop-controlled intersection of Street A and Coal Mine Avenue is expected to have little to<br />
no operational change from that experienced in existing conditions. Eastbound and westbound<br />
left turn movements have current and projected LOS A operations during both peak hours. In<br />
the PM Peak Hour, operation for the southbound left turn movement changes from LOS D to<br />
LOS E. The un-avoidable peak hour delay is attributed to moderate eastbound and westbound<br />
traffic volumes on Coal Mine Avenue and the stop-controlled nature of intersection. The<br />
existing southbound turn lane helps to mitigate experienced delay for the left turn movement. It<br />
is, again, not uncommon for unsignalized turns onto an arterial roadway to operate with<br />
noticeable delays during peak hours. All other intersection turning movements have level of<br />
service operations similar to existing conditions.<br />
Table 4 and Figure 4 illustrate the minimal traffic impact the proposed development will have<br />
on current traffic volumes.<br />
Additional Analysis<br />
Pursuant to <strong>County</strong> Staff discussion, additional analysis was conducted to ascertain if signal<br />
timing or lane improvements are needed at study intersections with Coal Mine Avenue as well<br />
as any modifications to the adjacent roadway system. The following is response to understood<br />
concerns.<br />
Signal Timing – Operational results for the Coal Mine Avenue and Kipling Parkway intersection<br />
conclude that no adjustment to signal timing or lane improvement is needed to accommodate<br />
traffic generation of the proposed development.<br />
Street A – Vehicular traffic on Street A is shown to be minimal during peak traffic hours.<br />
Provision of exclusive turn lanes on Street A at proposed site access is not needed.<br />
Street A / Coal Mine Avenue – Separate turn and through lanes exist at the Street A and Coal<br />
Mine Avenue intersection. Total traffic operation results summarize little to no change from<br />
existing conditions. No further improvement to the intersection is needed. It is likely, however,<br />
that intersection operations will need to be monitored by <strong>County</strong> Staff as future Coal Mine<br />
Avenue traffic volume increases and future development occurs along Street A. Increased<br />
operational delay for northbound/southbound left turn movements at the stop-controlled<br />
intersection is plausible and appropriate mitigation measures, if any, will need further<br />
evaluation.<br />
Ref: 12-09212tg
Mr. Mark McPherson October 1, 2012<br />
Natural Grocers – Vitamin Cottage Page 12<br />
Conclusion<br />
This analysis assessed traffic generation and potential impacts to the adjacent roadway<br />
network for the development. The development is located near the corner of Kipling Parkway<br />
and Coal Mine Avenue in <strong>Jefferson</strong> <strong>County</strong>, Colorado.<br />
It is our professional opinion that the addition of site-generated traffic is expected to create no<br />
discernable impact to traffic operations of the existing intersections, access drives, and<br />
surrounding roadway network. Analysis results for the site-generated traffic condition conclude<br />
that the additional traffic volume is minimal and within character of the surrounding area.<br />
We trust that our findings will assist in the planning and approval of the proposed Natural<br />
Grocers – Vitamin Cottage development. Please contact us should further assistance be<br />
needed.<br />
Sincerely,<br />
<strong>SM</strong> <strong>ROCHA</strong>, <strong>LLC</strong><br />
Traffic and Transportation Consultants<br />
Mike Rocha, TSOS, TOPS<br />
Principal<br />
Attachment: Appendix A-C (23 pages)<br />
Ref: 12-09212tg
APPENDIX A<br />
Traffic Count Data
File Name : #1 KIPLING&COALMINEAM<br />
Site Code : 00000000<br />
Start Date : 9/25/2012<br />
Page No : 1<br />
Groups Printed- Class 1<br />
KIPLING PARKWAY COAL MINE AVENUE KIPLING PARKWAY COAL MINE AVENUE<br />
Southbound<br />
Westbound<br />
Northbound<br />
Eastbound<br />
Start Time Rght Thru Left Other Rght Thru Left Other Rght Thru Left Other Rght Thru Left Other Int. Total<br />
07:00 AM 5 125 23 1 41 55 23 0 49 207 12 0 37 60 20 1 659<br />
07:15 AM 13 175 34 1 39 56 27 0 41 166 18 0 41 62 15 0 688<br />
07:30 AM 8 149 50 1 48 34 30 0 17 212 11 0 33 72 22 0 687<br />
07:45 AM 12 196 38 0 52 79 49 0 46 278 22 0 51 53 24 0 900<br />
Total 38 645 145 3 180 224 129 0 153 863 63 0 162 247 81 1 2934<br />
08:00 AM 11 161 29 3 44 48 30 0 38 196 14 0 32 46 15 0 667<br />
08:15 AM 14 140 41 0 59 47 18 0 43 188 20 0 19 50 23 1 663<br />
08:30 AM 8 137 37 0 44 43 34 0 26 128 8 2 33 52 22 0 574<br />
08:45 AM 12 142 26 0 48 43 23 0 26 184 17 0 16 36 9 1 583<br />
Total 45 580 133 3 195 181 105 0 133 696 59 2 100 184 69 2 2487<br />
Grand Total 83 1225 278 6 375 405 234 0 286 1559 122 2 262 431 150 3 5421<br />
Apprch % 5.2 76.9 17.5 0.4 37 39.9 23.1 0 14.5 79.2 6.2 0.1 31 50.9 17.7 0.4<br />
Total % 1.5 22.6 5.1 0.1 6.9 7.5 4.3 0 5.3 28.8 2.3 0 4.8 8 2.8 0.1<br />
COAL MINE AVENUE<br />
Out In Total<br />
610 846 1456<br />
150<br />
Left<br />
431<br />
Thru<br />
262<br />
Rght<br />
3<br />
Other<br />
All Traffic Data Services<br />
Wheat Ridge,CO 80033<br />
303-668-0220<br />
KIPLING PARKWAY<br />
Out In Total<br />
2084 1592 3676<br />
83<br />
Rght<br />
Left<br />
122<br />
1225<br />
Thru<br />
Thru<br />
1559<br />
278<br />
Left<br />
9/25/2012 07:00 AM<br />
9/25/2012 08:45 AM<br />
Class 1<br />
North<br />
Rght<br />
286<br />
6<br />
Other<br />
Other<br />
2<br />
1721 1969 3690<br />
Out In Total<br />
KIPLING PARKWAY<br />
Rght<br />
375<br />
Thru<br />
405<br />
Left<br />
234<br />
Other<br />
0<br />
995 1014 2009<br />
Out In Total<br />
COAL MINE AVENUE
File Name : #1 KIPLING&COALMINEAM<br />
Site Code : 00000000<br />
Start Date : 9/25/2012<br />
Page No : 2<br />
KIPLING PARKWAY COAL MINE AVENUE KIPLING PARKWAY COAL MINE AVENUE<br />
Southbound<br />
Westbound<br />
Northbound<br />
Eastbound<br />
Start Time Rght Thru Left Other App. Total Rght Thru Left Other App. Total Rght Thru Left Other App. Total Rght Thru Left Other App. Total Int. Total<br />
Peak Hour Analysis From 07:00 AM to 08:45 AM - Peak 1 of 1<br />
Peak Hour for Entire Intersection Begins at 07:15 AM<br />
07:15 AM 13 175 34 1 223 39 56 27 0 122 41 166 18 0 225 41 62 15 0 118 688<br />
07:30 AM 8 149 50 1 208 48 34 30 0 112 17 212 11 0 240 33 72 22 0 127 687<br />
07:45 AM 12 196 38 0 246 52 79 49 0 180 46 278 22 0 346 51 53 24 0 128 900<br />
08:00 AM 11 161 29 3 204 44 48 30 0 122 38 196 14 0 248 32 46 15 0 93 667<br />
Total Volume 44 681 151 5 881 183 217 136 0 536 142 852 65 0 1059 157 233 76 0 466 2942<br />
% App. Total 5 77.3 17.1 0.6 34.1 40.5 25.4 0 13.4 80.5 6.1 0 33.7 50 16.3 0<br />
PHF .846 .869 .755 .417 .895 .880 .687 .694 .000 .744 .772 .766 .739 .000 .765 .770 .809 .792 .000 .910 .817<br />
COAL MINE AVENUE<br />
Out In Total<br />
326 466 792<br />
76<br />
Left<br />
233<br />
Thru<br />
157<br />
Rght<br />
0<br />
Other<br />
All Traffic Data Services<br />
Wheat Ridge,CO 80033<br />
303-668-0220<br />
KIPLING PARKWAY<br />
Out In Total<br />
1111 881 1992<br />
44<br />
Rght<br />
Left<br />
65<br />
681<br />
Thru<br />
Thru<br />
852<br />
151<br />
Left<br />
Rght<br />
142<br />
5<br />
Other<br />
Peak Hour Data<br />
Peak Hour Begins at 07:15 AM<br />
Class 1<br />
North<br />
Other<br />
0<br />
974 1059 2033<br />
Out In Total<br />
KIPLING PARKWAY<br />
Rght<br />
183<br />
Thru<br />
217<br />
Left<br />
136<br />
Other<br />
0<br />
526 536 1062<br />
Out In Total<br />
COAL MINE AVENUE
File Name : #1 KIPLING&COALMINEPM<br />
Site Code : 00000000<br />
Start Date : 9/25/2012<br />
Page No : 1<br />
Groups Printed- Class 1<br />
KIPLING PARKWAY COAL MINE AVENUE KIPLING PARKWAY COAL MINE AVENUE<br />
Southbound<br />
Westbound<br />
Northbound<br />
Eastbound<br />
Start Time Rght Thru Left Other Rght Thru Left Other Rght Thru Left Other Rght Thru Left Other Int. Total<br />
04:00 PM 26 199 55 0 17 41 42 0 35 213 32 0 20 49 19 0 748<br />
04:15 PM 17 211 52 2 26 52 37 1 42 187 26 0 14 53 19 0 739<br />
04:30 PM 22 230 64 0 38 81 39 0 30 222 30 0 26 55 13 0 850<br />
04:45 PM 19 230 69 0 28 66 49 0 34 209 32 0 22 53 11 0 822<br />
Total 84 870 240 2 109 240 167 1 141 831 120 0 82 210 62 0 3159<br />
05:00 PM 26 237 59 2 22 60 39 0 45 249 36 0 22 62 12 0 871<br />
05:15 PM 22 251 79 1 31 74 47 0 45 199 20 0 22 57 19 1 868<br />
05:30 PM 19 212 59 0 28 53 40 0 40 217 34 0 21 62 5 0 790<br />
05:45 PM 21 246 64 0 20 78 39 0 43 176 31 0 31 51 14 0 814<br />
Total 88 946 261 3 101 265 165 0 173 841 121 0 96 232 50 1 3343<br />
Grand Total 172 1816 501 5 210 505 332 1 314 1672 241 0 178 442 112 1 6502<br />
Apprch % 6.9 72.8 20.1 0.2 20 48.2 31.7 0.1 14.1 75.1 10.8 0 24.3 60.3 15.3 0.1<br />
Total % 2.6 27.9 7.7 0.1 3.2 7.8 5.1 0 4.8 25.7 3.7 0 2.7 6.8 1.7 0<br />
COAL MINE AVENUE<br />
Out In Total<br />
918 733 1651<br />
112<br />
Left<br />
442<br />
Thru<br />
178<br />
Rght<br />
1<br />
Other<br />
All Traffic Data Services<br />
Wheat Ridge,CO 80033<br />
303-668-0220<br />
KIPLING PARKWAY<br />
Out In Total<br />
1994 2494 4488<br />
172<br />
Rght<br />
Left<br />
241<br />
1816<br />
Thru<br />
Thru<br />
1672<br />
501<br />
Left<br />
9/25/2012 04:00 PM<br />
9/25/2012 05:45 PM<br />
Class 1<br />
North<br />
Rght<br />
314<br />
5<br />
Other<br />
Other<br />
0<br />
2326 2227 4553<br />
Out In Total<br />
KIPLING PARKWAY<br />
Rght<br />
210<br />
Thru<br />
505<br />
Left<br />
332<br />
Other<br />
1<br />
1257 1048 2305<br />
Out In Total<br />
COAL MINE AVENUE
File Name : #1 KIPLING&COALMINEPM<br />
Site Code : 00000000<br />
Start Date : 9/25/2012<br />
Page No : 2<br />
KIPLING PARKWAY COAL MINE AVENUE KIPLING PARKWAY COAL MINE AVENUE<br />
Southbound<br />
Westbound<br />
Northbound<br />
Eastbound<br />
Start Time Rght Thru Left Other App. Total Rght Thru Left Other App. Total Rght Thru Left Other App. Total Rght Thru Left Other App. Total Int. Total<br />
Peak Hour Analysis From 04:00 PM to 05:45 PM - Peak 1 of 1<br />
Peak Hour for Entire Intersection Begins at 04:30 PM<br />
04:30 PM 22 230 64 0 316 38 81 39 0 158 30 222 30 0 282 26 55 13 0 94 850<br />
04:45 PM 19 230 69 0 318 28 66 49 0 143 34 209 32 0 275 22 53 11 0 86 822<br />
05:00 PM 26 237 59 2 324 22 60 39 0 121 45 249 36 0 330 22 62 12 0 96 871<br />
05:15 PM 22 251 79 1 353 31 74 47 0 152 45 199 20 0 264 22 57 19 1 99 868<br />
Total Volume 89 948 271 3 1311 119 281 174 0 574 154 879 118 0 1151 92 227 55 1 375 3411<br />
% App. Total 6.8 72.3 20.7 0.2 20.7 49 30.3 0 13.4 76.4 10.3 0 24.5 60.5 14.7 0.3<br />
PHF .856 .944 .858 .375 .928 .783 .867 .888 .000 .908 .856 .883 .819 .000 .872 .885 .915 .724 .250 .947 .979<br />
COAL MINE AVENUE<br />
Out In Total<br />
488 375 863<br />
55<br />
Left<br />
227<br />
Thru<br />
92<br />
Rght<br />
1<br />
Other<br />
All Traffic Data Services<br />
Wheat Ridge,CO 80033<br />
303-668-0220<br />
KIPLING PARKWAY<br />
Out In Total<br />
1053 1311 2364<br />
89<br />
Rght<br />
Left<br />
118<br />
948<br />
Thru<br />
Thru<br />
879<br />
271<br />
Left<br />
Rght<br />
154<br />
3<br />
Other<br />
Peak Hour Data<br />
Peak Hour Begins at 04:30 PM<br />
Class 1<br />
North<br />
Other<br />
0<br />
1214 1151 2365<br />
Out In Total<br />
KIPLING PARKWAY<br />
Rght<br />
119<br />
Thru<br />
281<br />
Left<br />
174<br />
Other<br />
0<br />
652 574 1226<br />
Out In Total<br />
COAL MINE AVENUE
SITE ACCESS PRIVATE<br />
ROADWAY<br />
Southbound<br />
COAL MINE AVENUE<br />
Westbound<br />
Groups Printed- Class 1<br />
SITE ACCESS PRIVATE<br />
ROADWAY<br />
Northbound<br />
File Name : #2 AP&COALMINEAM<br />
Site Code : 00000000<br />
Start Date : 9/25/2012<br />
Page No : 1<br />
COAL MINE AVENUE<br />
Eastbound<br />
Start Time Rght Thru Left Other Rght Thru Left Other Rght Thru Left Other Rght Thru Left Other Int. Total<br />
07:00 AM 9 0 10 0 12 0 0 1 1 0 1 0 18 0 9 0 61<br />
07:15 AM 11 0 9 0 15 0 0 1 0 0 0 0 14 0 12 0 62<br />
07:30 AM 8 0 5 0 8 0 0 0 0 0 0 0 0 0 7 0 28<br />
07:45 AM 13 0 9 0 18 0 0 0 0 0 17 0 0 0 10 0 67<br />
Total 41 0 33 0 53 0 0 2 1 0 18 0 32 0 38 0 218<br />
08:00 AM 11 0 7 0 13 0 0 2 0 0 1 0 2 0 2 0 38<br />
08:15 AM 9 0 16 0 14 0 0 0 0 0 0 0 19 0 11 0 69<br />
08:30 AM 11 0 7 0 9 0 0 0 0 0 1 0 1 0 10 0 39<br />
08:45 AM 10 0 9 0 7 0 0 0 0 0 12 0 2 0 21 0 61<br />
Total 41 0 39 0 43 0 0 2 0 0 14 0 24 0 44 0 207<br />
Grand Total 82 0 72 0 96 0 0 4 1 0 32 0 56 0 82 0 425<br />
Apprch % 53.2 0 46.8 0 96 0 0 4 3 0 97 0 40.6 0 59.4 0<br />
Total % 19.3 0 16.9 0 22.6 0 0 0.9 0.2 0 7.5 0 13.2 0 19.3 0<br />
COAL MINE AVENUE<br />
Out In Total<br />
114 138 252<br />
82<br />
Left<br />
0<br />
Thru<br />
56<br />
Rght<br />
0<br />
Other<br />
All Traffic Data Services<br />
Wheat Ridge,CO 80033<br />
303-668-0220<br />
SITE ACCESS PRIVATE ROADWAY<br />
Out In Total<br />
178 154 332<br />
82<br />
Rght<br />
Left<br />
32<br />
0<br />
Thru<br />
Thru<br />
0<br />
72<br />
Left<br />
9/25/2012 07:00 AM<br />
9/25/2012 08:45 AM<br />
Class 1<br />
North<br />
Rght<br />
1<br />
0<br />
Other<br />
Other<br />
0<br />
56 33 89<br />
Out In Total<br />
SITE ACCESS PRIVATE ROADWAY<br />
Rght<br />
96<br />
Thru<br />
0<br />
Left<br />
0<br />
Other<br />
4<br />
73 100 173<br />
Out In Total<br />
COAL MINE AVENUE
SITE ACCESS PRIVATE<br />
ROADWAY<br />
Southbound<br />
COAL MINE AVENUE<br />
Westbound<br />
SITE ACCESS PRIVATE<br />
ROADWAY<br />
Northbound<br />
File Name : #2 AP&COALMINEAM<br />
Site Code : 00000000<br />
Start Date : 9/25/2012<br />
Page No : 2<br />
COAL MINE AVENUE<br />
Eastbound<br />
Start Time Rght Thru Left Other App. Total Rght Thru Left Other App. Total Rght Thru Left Other App. Total Rght Thru Left Other App. Total Int. Total<br />
Peak Hour Analysis From 07:00 AM to 08:45 AM - Peak 1 of 1<br />
Peak Hour for Entire Intersection Begins at 07:00 AM<br />
07:00 AM 9 0 10 0 19 12 0 0 1 13 1 0 1 0 2 18 0 9 0 27 61<br />
07:15 AM 11 0 9 0 20 15 0 0 1 16 0 0 0 0 0 14 0 12 0 26 62<br />
07:30 AM 8 0 5 0 13 8 0 0 0 8 0 0 0 0 0 0 0 7 0 7 28<br />
07:45 AM 13 0 9 0 22 18 0 0 0 18 0 0 17 0 17 0 0 10 0 10 67<br />
Total Volume 41 0 33 0 74 53 0 0 2 55 1 0 18 0 19 32 0 38 0 70 218<br />
% App. Total 55.4 0 44.6 0 96.4 0 0 3.6 5.3 0 94.7 0 45.7 0 54.3 0<br />
PHF .788 .000 .825 .000 .841 .736 .000 .000 .500 .764 .250 .000 .265 .000 .279 .444 .000 .792 .000 .648 .813<br />
COAL MINE AVENUE<br />
Out In Total<br />
59 70 129<br />
38<br />
Left<br />
0<br />
Thru<br />
32<br />
Rght<br />
0<br />
Other<br />
All Traffic Data Services<br />
Wheat Ridge,CO 80033<br />
303-668-0220<br />
SITE ACCESS PRIVATE ROADWAY<br />
Out In Total<br />
91 74 165<br />
41<br />
Rght<br />
Left<br />
18<br />
0<br />
Thru<br />
Thru<br />
0<br />
33<br />
Left<br />
Rght<br />
1<br />
0<br />
Other<br />
Peak Hour Data<br />
Peak Hour Begins at 07:00 AM<br />
Class 1<br />
North<br />
Other<br />
0<br />
32 19 51<br />
Out In Total<br />
SITE ACCESS PRIVATE ROADWAY<br />
Rght<br />
53<br />
Thru<br />
0<br />
Left<br />
0<br />
Other<br />
2<br />
34 55 89<br />
Out In Total<br />
COAL MINE AVENUE
SITE ACCESS PRIVATE<br />
ROADWAY<br />
Southbound<br />
COAL MINE AVENUE<br />
Westbound<br />
Groups Printed- Class 1<br />
SITE ACCESS PRIVATE<br />
ROADWAY<br />
Northbound<br />
File Name : #2 AP&COALMINEPM<br />
Site Code : 00000000<br />
Start Date : 9/25/2012<br />
Page No : 1<br />
COAL MINE AVENUE<br />
Eastbound<br />
Start Time Rght Thru Left Other Rght Thru Left Other Rght Thru Left Other Rght Thru Left Other Int. Total<br />
04:00 PM 11 0 8 0 14 0 0 0 0 0 3 0 2 0 9 0 47<br />
04:15 PM 9 0 20 0 18 0 1 2 0 0 0 0 4 0 9 0 63<br />
04:30 PM 18 2 20 0 18 0 1 0 0 0 3 0 2 0 11 0 75<br />
04:45 PM 10 0 17 0 19 0 0 0 0 0 4 0 2 0 9 0 61<br />
Total 48 2 65 0 69 0 2 2 0 0 10 0 10 0 38 0 246<br />
05:00 PM 10 1 14 0 16 0 0 3 1 0 2 0 4 0 11 0 62<br />
05:15 PM 13 0 11 0 14 0 0 1 0 0 2 1 1 0 10 0 53<br />
05:30 PM 16 0 11 0 12 0 0 0 0 0 1 0 3 0 10 0 53<br />
05:45 PM 11 0 12 0 13 0 0 0 0 0 0 0 1 0 13 0 50<br />
Total 50 1 48 0 55 0 0 4 1 0 5 1 9 0 44 0 218<br />
Grand Total 98 3 113 0 124 0 2 6 1 0 15 1 19 0 82 0 464<br />
Apprch % 45.8 1.4 52.8 0 93.9 0 1.5 4.5 5.9 0 88.2 5.9 18.8 0 81.2 0<br />
Total % 21.1 0.6 24.4 0 26.7 0 0.4 1.3 0.2 0 3.2 0.2 4.1 0 17.7 0<br />
COAL MINE AVENUE<br />
Out In Total<br />
113 101 214<br />
82<br />
Left<br />
0<br />
Thru<br />
19<br />
Rght<br />
0<br />
Other<br />
All Traffic Data Services<br />
Wheat Ridge,CO 80033<br />
303-668-0220<br />
SITE ACCESS PRIVATE ROADWAY<br />
Out In Total<br />
206 214 420<br />
98<br />
Rght<br />
Left<br />
15<br />
3<br />
Thru<br />
Thru<br />
0<br />
113<br />
Left<br />
9/25/2012 04:00 PM<br />
9/25/2012 05:45 PM<br />
Class 1<br />
North<br />
Rght<br />
1<br />
0<br />
Other<br />
Other<br />
1<br />
24 17 41<br />
Out In Total<br />
SITE ACCESS PRIVATE ROADWAY<br />
Rght<br />
124<br />
Thru<br />
0<br />
Left<br />
2<br />
Other<br />
6<br />
114 132 246<br />
Out In Total<br />
COAL MINE AVENUE
SITE ACCESS PRIVATE<br />
ROADWAY<br />
Southbound<br />
COAL MINE AVENUE<br />
Westbound<br />
SITE ACCESS PRIVATE<br />
ROADWAY<br />
Northbound<br />
File Name : #2 AP&COALMINEPM<br />
Site Code : 00000000<br />
Start Date : 9/25/2012<br />
Page No : 2<br />
COAL MINE AVENUE<br />
Eastbound<br />
Start Time Rght Thru Left Other App. Total Rght Thru Left Other App. Total Rght Thru Left Other App. Total Rght Thru Left Other App. Total Int. Total<br />
Peak Hour Analysis From 04:00 PM to 05:45 PM - Peak 1 of 1<br />
Peak Hour for Entire Intersection Begins at 04:15 PM<br />
04:15 PM 9 0 20 0 29 18 0 1 2 21 0 0 0 0 0 4 0 9 0 13 63<br />
04:30 PM 18 2 20 0 40 18 0 1 0 19 0 0 3 0 3 2 0 11 0 13 75<br />
04:45 PM 10 0 17 0 27 19 0 0 0 19 0 0 4 0 4 2 0 9 0 11 61<br />
05:00 PM 10 1 14 0 25 16 0 0 3 19 1 0 2 0 3 4 0 11 0 15 62<br />
Total Volume 47 3 71 0 121 71 0 2 5 78 1 0 9 0 10 12 0 40 0 52 261<br />
% App. Total 38.8 2.5 58.7 0 91 0 2.6 6.4 10 0 90 0 23.1 0 76.9 0<br />
PHF .653 .375 .888 .000 .756 .934 .000 .500 .417 .929 .250 .000 .563 .000 .625 .750 .000 .909 .000 .867 .870<br />
COAL MINE AVENUE<br />
Out In Total<br />
56 52 108<br />
40<br />
Left<br />
0<br />
Thru<br />
12<br />
Rght<br />
0<br />
Other<br />
All Traffic Data Services<br />
Wheat Ridge,CO 80033<br />
303-668-0220<br />
SITE ACCESS PRIVATE ROADWAY<br />
Out In Total<br />
111 121 232<br />
47<br />
Rght<br />
Left<br />
9<br />
3<br />
Thru<br />
Thru<br />
0<br />
71<br />
Left<br />
Rght<br />
1<br />
0<br />
Other<br />
Peak Hour Data<br />
Peak Hour Begins at 04:15 PM<br />
Class 1<br />
North<br />
Other<br />
0<br />
17 10 27<br />
Out In Total<br />
SITE ACCESS PRIVATE ROADWAY<br />
Rght<br />
71<br />
Thru<br />
0<br />
Left<br />
2<br />
Other<br />
5<br />
72 78 150<br />
Out In Total<br />
COAL MINE AVENUE
All Traffic Data Services, Inc<br />
9660 W 44th Ave<br />
Wheat Ridge,CO 80033<br />
www.alltrafficdata.net<br />
Page 1<br />
Site Code: 3<br />
Station ID: 3<br />
SITE ACCESS PRIVATE ROAD N/O BANKS NORTH<br />
Start 25-Sep-12<br />
Time Tue NB SB Total<br />
12:00 AM 3 5 8<br />
01:00 0 0 0<br />
02:00 2 0 2<br />
03:00 1 1 2<br />
04:00 3 2 5<br />
05:00 3 6 9<br />
06:00 28 21 49<br />
07:00 34 16 50<br />
08:00 29 21 50<br />
09:00 30 28 58<br />
10:00 48 32 80<br />
11:00 32 27 59<br />
12:00 PM 40 22 62<br />
01:00 35 26 61<br />
02:00 33 41 74<br />
03:00 32 29 61<br />
04:00 42 48 90<br />
05:00 40 39 79<br />
06:00 19 33 52<br />
07:00 27 19 46<br />
08:00 19 16 35<br />
09:00 6 8 14<br />
10:00 4 7 11<br />
11:00 2 2 4<br />
Total 512 449 961<br />
Percent 53.3% 46.7%<br />
AM Peak 10:00 10:00 10:00<br />
Vol. 48 32 80<br />
PM Peak 16:00 16:00 16:00<br />
Vol. 42 48 90<br />
Total 512 449 961<br />
Percent 53.3% 46.7%<br />
ADT Not Calculated
APPENDIX B<br />
Level of Service Definitions
The following information can be found in the Highway Capacity Manual, Transportation Research<br />
Board, 2000: Chapter 10 – Urban Streets Concepts Signalized Intersections and Chapter 17 –<br />
Unsignalized Intersections.<br />
Level Of Service (LOS) for Signalized Intersections<br />
Levels of service are defined to represent reasonable ranges in control delay.<br />
LOS A<br />
Describes operations with low control delay, up to 10 s/veh. This LOS occurs when progression is<br />
extremely favorable and most vehicles arrive during the green phase. Many vehicles do not stop at all.<br />
Short cycle lengths may tend to contribute to low delay values.<br />
LOS B<br />
Describes operations with control delay greater then 10 and up to 20 s/veh. This level generally<br />
occurs with good progressions, short cycle lengths, or both. More vehicles stop than with LOS A,<br />
causing higher levels of delay.<br />
LOS C<br />
Describes operations with control delay greater than 20 and up to 35 s/veh. These higher delays may<br />
result from only fair progression, longer cycle lengths, or both. Individual cycle failures may begin to<br />
appear at the level. Cycle failure occurs when a given green phase does not serve queued vehicles, and<br />
overflows occur. The number of vehicles stopping is significant at this level, though many still pass<br />
through the intersection without stopping.<br />
LOS D<br />
Describes operations with control delay greater than 35 and up to 55 s/veh. At LOS D, the influence<br />
of congestion becomes more noticeable. Longer delays may result from some combination of<br />
unfavorable progression, long cycle lengths, and high v/c ratios. Individual cycle failures are frequent.<br />
LOS E<br />
Describes operations with control delay greater than 55 and up to 80 s/veh. These high delay values<br />
generally indicate poor progression, long cycle lengths, and high v/c ratios. Individual cycle failures are<br />
frequent.<br />
LOS F<br />
Describes operations with control delay in excess of 80 s/veh. This level, considered unacceptable to<br />
most drivers, often occurs with over saturation, that is, when arrival flow rates exceed the capacity of lane<br />
groups. It may also occur at high v/c ratios with many individual cycle failures. Poor progression and<br />
long cycle lengths may also contribute significantly to high delay levels.<br />
Level of Service (LOS) for Unsignalized TWSC Intersections<br />
Level of Service Average Control Delay (s/veh)<br />
A 0 - 10<br />
B > 10 - 15<br />
C > 15 - 25<br />
D > 25 - 35<br />
E > 35 - 50<br />
F > 50
APPENDIX C<br />
Capacity Worksheets
Timings Existing Traffic Volumes<br />
1: Coal Mine Avenue & Kipling Parkway<br />
AM Peak Hour<br />
Lane Group EBL EBT EBR WBL WBT WBR NBL NBT NBR SBL SBT SBR<br />
Lane Configurations<br />
Total Lost Time (s) 4.0 4.0 4.0 4.0 4.0 4.0 4.0 4.0 4.0 4.0 4.0 4.0<br />
Satd. Flow (prot) 1770 3539 1583 1770 3539 1583 1770 3539 1583 3433 3539 1583<br />
Flt Permitted 0.605 0.520 0.950 0.950<br />
Satd. Flow (perm) 1127 3539 1583 969 3539 1583 1770 3539 1583 3433 3539 1583<br />
Satd. Flow (RTOR) 171 199 154 48<br />
Volume (vph) 76 233 157 136 217 183 65 852 142 151 681 44<br />
Lane Group Flow (vph) 83 253 171 148 236 199 71 926 154 164 740 48<br />
Turn Type pm+pt Free pm+pt Free Prot Free Prot Free<br />
Protected Phases 7 4 3 8 5 2 1 6<br />
Permitted Phases 4 Free 8 Free Free Free<br />
Total Split (s) 9.5 21.5 0.0 10.9 22.9 0.0 12.8 35.4 0.0 12.2 34.8 0.0<br />
Act Effct Green (s) 14.9 11.5 62.1 17.4 12.5 62.1 8.7 31.2 62.1 8.3 33.3 62.1<br />
Actuated g/C Ratio 0.23 0.18 1.00 0.27 0.19 1.00 0.13 0.50 1.00 0.13 0.54 1.00<br />
v/c Ratio 0.26 0.40 0.11 0.42 0.34 0.13 0.31 0.52 0.10 0.37 0.39 0.03<br />
Uniform Delay, d1 18.6 26.9 0.0 19.3 25.8 0.0 29.7 13.7 0.0 28.9 12.0 0.0<br />
Control Delay 19.6 26.2 0.1 22.0 24.8 0.2 33.8 17.6 0.1 32.2 15.1 0.0<br />
Queue Delay 0.0 0.0 0.0 0.0 0.0 0.0 0.0 0.0 0.0 0.0 0.0 0.0<br />
Total Delay 19.6 26.2 0.1 22.0 24.8 0.2 33.8 17.6 0.1 32.2 15.1 0.0<br />
LOS B C A C C A C B A C B A<br />
Approach Delay 16.3 15.7 16.2 17.3<br />
Approach LOS B B B B<br />
Queue Length 50th (ft) 24 50 0 45 45 0 28 168 0 33 127 0<br />
Queue Length 95th (ft) 58 90 0 95 82 0 71 247 0 68 191 0<br />
Internal Link Dist (ft) 1469 323 3217 860<br />
Turn Bay Length (ft) 275 150 275<br />
Base Capacity (vph) 322 905 1583 354 970 1583 244 1894 1583 459 1950 1583<br />
Starvation Cap Reductn 0 0 0 0 0 0 0 0 0 0 0 0<br />
Spillback Cap Reductn 0 0 0 0 0 0 0 0 0 0 0 0<br />
Storage Cap Reductn 0 0 0 0 0 0 0 0 0 0 0 0<br />
Reduced v/c Ratio 0.26 0.28 0.11 0.42 0.24 0.13 0.29 0.49 0.10 0.36 0.38 0.03<br />
Intersection Summary<br />
Cycle Length: 80<br />
Actuated Cycle Length: 62.1<br />
Control Type: Actuated-Uncoordinated<br />
Maximum v/c Ratio: 0.52<br />
Intersection Signal Delay: 16.5 Intersection LOS: B<br />
Intersection Capacity Utilization 55.2% ICU Level of Service B<br />
Analysis Period (min) 15<br />
Splits and Phases: 1: Coal Mine Avenue & Kipling Parkway<br />
September 2012 Synchro Report<br />
<strong>SM</strong> <strong>ROCHA</strong>, <strong>LLC</strong><br />
Appendix C - Capacity Worksheets - Page 1
HCM Unsignalized Intersection Capacity Analysis Existing Traffic Volumes<br />
2: Coal Mine Avenue & Street A<br />
AM Peak Hour<br />
Movement EBL EBT EBR WBL WBT WBR NBL NBT NBR SBL SBT SBR<br />
Lane Configurations<br />
Sign Control Free Free Stop Stop<br />
Grade 0% 0% 0% 0%<br />
Volume (veh/h) 38 456 32 0 477 53 18 0 1 33 0 41<br />
Peak Hour Factor 0.92 0.92 0.92 0.92 0.92 0.92 0.92 0.92 0.92 0.92 0.92 0.92<br />
Hourly flow rate (vph) 41 496 35 0 518 58 20 0 1 36 0 45<br />
Pedestrians<br />
Lane Width (ft)<br />
Walking Speed (ft/s)<br />
Percent Blockage<br />
Right turn flare (veh) 2<br />
Median type None None<br />
Median storage veh)<br />
Upstream signal (ft) 403<br />
pX, platoon unblocked 0.97 0.97 0.97 0.97 0.97 0.97<br />
vC, conflicting volume 576 530 838 1154 248 850 1132 259<br />
vC1, stage 1 conf vol<br />
vC2, stage 2 conf vol<br />
vCu, unblocked vol 576 492 807 1132 202 820 1109 259<br />
tC, single (s) 4.1 4.1 7.5 6.5 6.9 7.5 6.5 6.9<br />
tC, 2 stage (s)<br />
tF (s) 2.2 2.2 3.5 4.0 3.3 3.5 4.0 3.3<br />
p0 queue free % 96 100 92 100 100 86 100 94<br />
cM capacity (veh/h) 993 1041 242 188 785 252 195 740<br />
Direction, Lane # EB 1 EB 2 EB 3 EB 4 WB 1 WB 2 WB 3 WB 4 NB 1 SB 1 SB 2<br />
Volume Total 41 248 248 35 0 259 259 58 21 36 45<br />
Volume Left 41 0 0 0 0 0 0 0 20 36 0<br />
Volume Right 0 0 0 35 0 0 0 58 1 0 45<br />
cSH 993 1700 1700 1700 1700 1700 1700 1700 251 252 370<br />
Volume to Capacity 0.04 0.15 0.15 0.02 0.00 0.15 0.15 0.03 0.08 0.14 0.12<br />
Queue Length (ft) 3 0 0 0 0 0 0 0 7 12 10<br />
Control Delay (s) 8.8 0.0 0.0 0.0 0.0 0.0 0.0 0.0 20.6 21.7 16.1<br />
Lane LOS A C C C<br />
Approach Delay (s) 0.6 0.0 20.6 18.6<br />
Approach LOS C C<br />
Intersection Summary<br />
Average Delay 1.8<br />
Intersection Capacity Utilization 34.2% ICU Level of Service A<br />
Analysis Period (min) 15<br />
September 2012 Synchro Report<br />
<strong>SM</strong> <strong>ROCHA</strong>, <strong>LLC</strong><br />
Appendix C - Capacity Worksheets - Page 2
Timings Existing Traffic Volumes<br />
1: Coal Mine Avenue & Kipling Parkway<br />
PM Peak Hour<br />
Lane Group EBL EBT EBR WBL WBT WBR NBL NBT NBR SBL SBT SBR<br />
Lane Configurations<br />
Total Lost Time (s) 4.0 4.0 4.0 4.0 4.0 4.0 4.0 4.0 4.0 4.0 4.0 4.0<br />
Satd. Flow (prot) 1770 3539 1583 1770 3539 1583 1770 3539 1583 3433 3539 1583<br />
Flt Permitted 0.551 0.524 0.950 0.950<br />
Satd. Flow (perm) 1026 3539 1583 976 3539 1583 1770 3539 1583 3433 3539 1583<br />
Satd. Flow (RTOR) 100 129 164 89<br />
Volume (vph) 55 227 92 174 281 119 118 879 154 271 948 89<br />
Lane Group Flow (vph) 60 247 100 189 305 129 128 955 167 295 1030 97<br />
Turn Type pm+pt Free pm+pt Free Prot Free Prot Free<br />
Protected Phases 7 4 3 8 5 2 1 6<br />
Permitted Phases 4 Free 8 Free Free Free<br />
Total Split (s) 9.5 21.5 0.0 11.0 23.0 0.0 14.0 33.5 0.0 14.0 33.5 0.0<br />
Act Effct Green (s) 17.2 11.7 70.6 21.4 17.5 70.6 9.5 25.8 70.6 9.8 29.0 70.6<br />
Actuated g/C Ratio 0.23 0.17 1.00 0.30 0.25 1.00 0.13 0.37 1.00 0.14 0.41 1.00<br />
v/c Ratio 0.20 0.42 0.06 0.50 0.35 0.08 0.56 0.74 0.11 0.62 0.71 0.06<br />
Uniform Delay, d1 17.1 26.2 0.0 18.1 23.7 0.0 31.8 20.4 0.0 30.6 19.4 0.0<br />
Control Delay 20.4 28.3 0.1 24.9 25.4 0.1 39.2 22.4 0.1 35.9 21.8 0.1<br />
Queue Delay 0.0 0.0 0.0 0.0 0.0 0.0 0.0 0.0 0.0 0.0 0.0 0.0<br />
Total Delay 20.4 28.3 0.1 24.9 25.4 0.1 39.2 22.4 0.1 35.9 21.8 0.1<br />
LOS C C A C C A D C A D C A<br />
Approach Delay 20.2 20.0 21.1 23.2<br />
Approach LOS C C C C<br />
Queue Length 50th (ft) 19 54 0 66 66 0 55 185 0 67 206 0<br />
Queue Length 95th (ft) 45 88 0 118 104 0 #114 269 0 110 297 0<br />
Internal Link Dist (ft) 1469 323 3217 860<br />
Turn Bay Length (ft) 275 150 275<br />
Base Capacity (vph) 293 816 1583 376 965 1583 242 1411 1583 490 1481 1583<br />
Starvation Cap Reductn 0 0 0 0 0 0 0 0 0 0 0 0<br />
Spillback Cap Reductn 0 0 0 0 0 0 0 0 0 0 0 0<br />
Storage Cap Reductn 0 0 0 0 0 0 0 0 0 0 0 0<br />
Reduced v/c Ratio 0.20 0.30 0.06 0.50 0.32 0.08 0.53 0.68 0.11 0.60 0.70 0.06<br />
Intersection Summary<br />
Cycle Length: 80<br />
Actuated Cycle Length: 70.6<br />
Control Type: Actuated-Uncoordinated<br />
Maximum v/c Ratio: 0.74<br />
Intersection Signal Delay: 21.6 Intersection LOS: C<br />
Intersection Capacity Utilization 62.0% ICU Level of Service B<br />
Analysis Period (min) 15<br />
# 95th percentile volume exceeds capacity, queue may be longer.<br />
Queue shown is maximum after two cycles.<br />
September 2012 Synchro Report<br />
<strong>SM</strong> <strong>ROCHA</strong>, <strong>LLC</strong><br />
Appendix C - Capacity Worksheets - Page 3
Timings Existing Traffic Volumes<br />
1: Coal Mine Avenue & Kipling Parkway<br />
PM Peak Hour<br />
Splits and Phases: 1: Coal Mine Avenue & Kipling Parkway<br />
September 2012 Synchro Report<br />
<strong>SM</strong> <strong>ROCHA</strong>, <strong>LLC</strong><br />
Appendix C - Capacity Worksheets - Page 4
HCM Unsignalized Intersection Capacity Analysis Existing Traffic Volumes<br />
2: Coal Mine Avenue & Street A<br />
PM Peak Hour<br />
Movement EBL EBT EBR WBL WBT WBR NBL NBT NBR SBL SBT SBR<br />
Lane Configurations<br />
Sign Control Free Free Stop Stop<br />
Grade 0% 0% 0% 0%<br />
Volume (veh/h) 40 600 12 2 518 71 9 0 1 71 3 47<br />
Peak Hour Factor 0.92 0.92 0.92 0.92 0.92 0.92 0.92 0.92 0.92 0.92 0.92 0.92<br />
Hourly flow rate (vph) 43 652 13 2 563 77 10 0 1 77 3 51<br />
Pedestrians<br />
Lane Width (ft)<br />
Walking Speed (ft/s)<br />
Percent Blockage<br />
Right turn flare (veh) 2<br />
Median type None None<br />
Median storage veh)<br />
Upstream signal (ft) 403<br />
pX, platoon unblocked 0.97 0.97 0.97 0.97 0.97 0.97<br />
vC, conflicting volume 640 665 1027 1384 326 982 1320 282<br />
vC1, stage 1 conf vol<br />
vC2, stage 2 conf vol<br />
vCu, unblocked vol 640 622 995 1364 272 949 1298 282<br />
tC, single (s) 4.1 4.1 7.5 6.5 6.9 7.5 6.5 6.9<br />
tC, 2 stage (s)<br />
tF (s) 2.2 2.2 3.5 4.0 3.3 3.5 4.0 3.3<br />
p0 queue free % 95 100 94 100 100 61 98 93<br />
cM capacity (veh/h) 940 925 169 135 703 200 148 716<br />
Direction, Lane # EB 1 EB 2 EB 3 EB 4 WB 1 WB 2 WB 3 WB 4 NB 1 SB 1 SB 2<br />
Volume Total 43 326 326 13 2 282 282 77 11 77 54<br />
Volume Left 43 0 0 0 2 0 0 0 10 77 0<br />
Volume Right 0 0 0 13 0 0 0 77 1 0 51<br />
cSH 940 1700 1700 1700 925 1700 1700 1700 183 200 761<br />
Volume to Capacity 0.05 0.19 0.19 0.01 0.00 0.17 0.17 0.05 0.06 0.39 0.07<br />
Queue Length (ft) 4 0 0 0 0 0 0 0 5 42 6<br />
Control Delay (s) 9.0 0.0 0.0 0.0 8.9 0.0 0.0 0.0 25.9 33.8 11.6<br />
Lane LOS A A D D B<br />
Approach Delay (s) 0.6 0.0 25.9 24.6<br />
Approach LOS D C<br />
Intersection Summary<br />
Average Delay 2.6<br />
Intersection Capacity Utilization 37.1% ICU Level of Service A<br />
Analysis Period (min) 15<br />
September 2012 Synchro Report<br />
<strong>SM</strong> <strong>ROCHA</strong>, <strong>LLC</strong><br />
Appendix C - Capacity Worksheets - Page 5
Timings Total Traffic Volumes<br />
1: Coal Mine Avenue & Kipling Parkway<br />
AM Peak Hour<br />
Lane Group EBL EBT EBR WBL WBT WBR NBL NBT NBR SBL SBT SBR<br />
Lane Configurations<br />
Total Lost Time (s) 4.0 4.0 4.0 4.0 4.0 4.0 4.0 4.0 4.0 4.0 4.0 4.0<br />
Satd. Flow (prot) 1770 3539 1583 1770 3539 1583 1770 3539 1583 3433 3539 1583<br />
Flt Permitted 0.602 0.505 0.950 0.950<br />
Satd. Flow (perm) 1121 3539 1583 941 3539 1583 1770 3539 1583 3433 3539 1583<br />
Satd. Flow (RTOR) 171 199 160 48<br />
Volume (vph) 76 240 157 140 222 183 65 852 147 151 681 44<br />
Lane Group Flow (vph) 83 261 171 152 241 199 71 926 160 164 740 48<br />
Turn Type pm+pt Free pm+pt Free Prot Free Prot Free<br />
Protected Phases 7 4 3 8 5 2 1 6<br />
Permitted Phases 4 Free 8 Free Free Free<br />
Total Split (s) 9.5 21.5 0.0 11.1 23.1 0.0 12.8 35.2 0.0 12.2 34.6 0.0<br />
Act Effct Green (s) 15.1 11.7 62.2 17.9 12.8 62.2 8.7 31.2 62.2 8.4 33.3 62.2<br />
Actuated g/C Ratio 0.24 0.18 1.00 0.28 0.20 1.00 0.13 0.50 1.00 0.13 0.54 1.00<br />
v/c Ratio 0.26 0.41 0.11 0.42 0.34 0.13 0.31 0.52 0.10 0.37 0.39 0.03<br />
Uniform Delay, d1 18.5 26.9 0.0 19.1 25.7 0.0 29.8 13.8 0.0 29.0 12.2 0.0<br />
Control Delay 19.4 26.3 0.1 21.9 24.7 0.2 33.9 17.8 0.1 32.4 15.3 0.0<br />
Queue Delay 0.0 0.0 0.0 0.0 0.0 0.0 0.0 0.0 0.0 0.0 0.0 0.0<br />
Total Delay 19.4 26.3 0.1 21.9 24.7 0.2 33.9 17.8 0.1 32.4 15.3 0.0<br />
LOS B C A C C A C B A C B A<br />
Approach Delay 16.5 15.7 16.3 17.5<br />
Approach LOS B B B B<br />
Queue Length 50th (ft) 24 52 0 46 46 0 28 170 0 33 128 0<br />
Queue Length 95th (ft) 58 92 0 97 83 0 71 251 0 68 194 0<br />
Internal Link Dist (ft) 1469 323 3217 860<br />
Turn Bay Length (ft) 275 150 275<br />
Base Capacity (vph) 324 911 1583 360 986 1583 246 1883 1583 463 1940 1583<br />
Starvation Cap Reductn 0 0 0 0 0 0 0 0 0 0 0 0<br />
Spillback Cap Reductn 0 0 0 0 0 0 0 0 0 0 0 0<br />
Storage Cap Reductn 0 0 0 0 0 0 0 0 0 0 0 0<br />
Reduced v/c Ratio 0.26 0.29 0.11 0.42 0.24 0.13 0.29 0.49 0.10 0.35 0.38 0.03<br />
Intersection Summary<br />
Cycle Length: 80<br />
Actuated Cycle Length: 62.2<br />
Control Type: Actuated-Uncoordinated<br />
Maximum v/c Ratio: 0.52<br />
Intersection Signal Delay: 16.6 Intersection LOS: B<br />
Intersection Capacity Utilization 55.6% ICU Level of Service B<br />
Analysis Period (min) 15<br />
Splits and Phases: 1: Coal Mine Avenue & Kipling Parkway<br />
September 2012 Synchro Report<br />
<strong>SM</strong> <strong>ROCHA</strong>, <strong>LLC</strong><br />
Appendix C - Capacity Worksheets - Page 6
HCM Unsignalized Intersection Capacity Analysis Total Traffic Volumes<br />
2: Coal Mine Avenue & Street A<br />
AM Peak Hour<br />
Movement EBL EBT EBR WBL WBT WBR NBL NBT NBR SBL SBT SBR<br />
Lane Configurations<br />
Sign Control Free Free Stop Stop<br />
Grade 0% 0% 0% 0%<br />
Volume (veh/h) 50 456 32 0 477 60 18 0 1 37 0 50<br />
Peak Hour Factor 0.92 0.92 0.92 0.92 0.92 0.92 0.92 0.92 0.92 0.92 0.92 0.92<br />
Hourly flow rate (vph) 54 496 35 0 518 65 20 0 1 40 0 54<br />
Pedestrians<br />
Lane Width (ft)<br />
Walking Speed (ft/s)<br />
Percent Blockage<br />
Right turn flare (veh) 2<br />
Median type None None<br />
Median storage veh)<br />
Upstream signal (ft) 403<br />
pX, platoon unblocked 0.97 0.97 0.97 0.97 0.97 0.97<br />
vC, conflicting volume 584 530 864 1188 248 876 1158 259<br />
vC1, stage 1 conf vol<br />
vC2, stage 2 conf vol<br />
vCu, unblocked vol 584 492 834 1167 202 847 1136 259<br />
tC, single (s) 4.1 4.1 7.5 6.5 6.9 7.5 6.5 6.9<br />
tC, 2 stage (s)<br />
tF (s) 2.2 2.2 3.5 4.0 3.3 3.5 4.0 3.3<br />
p0 queue free % 94 100 91 100 100 83 100 93<br />
cM capacity (veh/h) 987 1040 226 177 785 238 185 740<br />
Direction, Lane # EB 1 EB 2 EB 3 EB 4 WB 1 WB 2 WB 3 WB 4 NB 1 SB 1 SB 2<br />
Volume Total 54 248 248 35 0 259 259 65 21 40 54<br />
Volume Left 54 0 0 0 0 0 0 0 20 40 0<br />
Volume Right 0 0 0 35 0 0 0 65 1 0 54<br />
cSH 987 1700 1700 1700 1700 1700 1700 1700 234 238 370<br />
Volume to Capacity 0.06 0.15 0.15 0.02 0.00 0.15 0.15 0.04 0.09 0.17 0.15<br />
Queue Length (ft) 4 0 0 0 0 0 0 0 7 15 13<br />
Control Delay (s) 8.9 0.0 0.0 0.0 0.0 0.0 0.0 0.0 21.8 23.2 16.4<br />
Lane LOS A C C C<br />
Approach Delay (s) 0.8 0.0 21.8 19.3<br />
Approach LOS C C<br />
Intersection Summary<br />
Average Delay 2.1<br />
Intersection Capacity Utilization 34.2% ICU Level of Service A<br />
Analysis Period (min) 15<br />
September 2012 Synchro Report<br />
<strong>SM</strong> <strong>ROCHA</strong>, <strong>LLC</strong><br />
Appendix C - Capacity Worksheets - Page 7
Timings Total Traffic Volumes<br />
1: Coal Mine Avenue & Kipling Parkway<br />
PM Peak Hour<br />
Lane Group EBL EBT EBR WBL WBT WBR NBL NBT NBR SBL SBT SBR<br />
Lane Configurations<br />
Total Lost Time (s) 4.0 4.0 4.0 4.0 4.0 4.0 4.0 4.0 4.0 4.0 4.0 4.0<br />
Satd. Flow (prot) 1770 3539 1583 1770 3539 1583 1770 3539 1583 3433 3539 1583<br />
Flt Permitted 0.529 0.504 0.950 0.950<br />
Satd. Flow (perm) 985 3539 1583 939 3539 1583 1770 3539 1583 3433 3539 1583<br />
Satd. Flow (RTOR) 100 129 182 89<br />
Volume (vph) 55 243 92 189 297 119 118 879 170 271 948 89<br />
Lane Group Flow (vph) 60 264 100 205 323 129 128 955 185 295 1030 97<br />
Turn Type pm+pt Free pm+pt Free Prot Free Prot Free<br />
Protected Phases 7 4 3 8 5 2 1 6<br />
Permitted Phases 4 Free 8 Free Free Free<br />
Total Split (s) 9.5 21.5 0.0 11.0 23.0 0.0 14.0 33.5 0.0 14.0 33.5 0.0<br />
Act Effct Green (s) 17.6 12.1 71.1 21.8 17.9 71.1 9.5 25.9 71.1 9.9 29.1 71.1<br />
Actuated g/C Ratio 0.23 0.17 1.00 0.31 0.25 1.00 0.13 0.36 1.00 0.14 0.41 1.00<br />
v/c Ratio 0.21 0.44 0.06 0.55 0.36 0.08 0.56 0.74 0.12 0.62 0.71 0.06<br />
Uniform Delay, d1 17.1 26.2 0.0 18.3 23.8 0.0 32.0 20.6 0.0 30.7 19.5 0.0<br />
Control Delay 20.4 28.4 0.1 26.3 25.5 0.1 39.6 22.7 0.2 36.2 22.0 0.1<br />
Queue Delay 0.0 0.0 0.0 0.0 0.0 0.0 0.0 0.0 0.0 0.0 0.0 0.0<br />
Total Delay 20.4 28.4 0.1 26.3 25.5 0.1 39.6 22.7 0.2 36.2 22.0 0.1<br />
LOS C C A C C A D C A D C A<br />
Approach Delay 20.6 20.7 21.1 23.5<br />
Approach LOS C C C C<br />
Queue Length 50th (ft) 20 58 0 73 71 0 56 187 0 67 208 0<br />
Queue Length 95th (ft) 45 93 0 128 109 0 #115 272 0 111 301 0<br />
Internal Link Dist (ft) 1469 323 3217 860<br />
Turn Bay Length (ft) 275 150 275<br />
Base Capacity (vph) 290 815 1583 370 968 1583 240 1404 1583 487 1474 1583<br />
Starvation Cap Reductn 0 0 0 0 0 0 0 0 0 0 0 0<br />
Spillback Cap Reductn 0 0 0 0 0 0 0 0 0 0 0 0<br />
Storage Cap Reductn 0 0 0 0 0 0 0 0 0 0 0 0<br />
Reduced v/c Ratio 0.21 0.32 0.06 0.55 0.33 0.08 0.53 0.68 0.12 0.61 0.70 0.06<br />
Intersection Summary<br />
Cycle Length: 80<br />
Actuated Cycle Length: 71.1<br />
Control Type: Actuated-Uncoordinated<br />
Maximum v/c Ratio: 0.74<br />
Intersection Signal Delay: 21.9 Intersection LOS: C<br />
Intersection Capacity Utilization 63.3% ICU Level of Service B<br />
Analysis Period (min) 15<br />
# 95th percentile volume exceeds capacity, queue may be longer.<br />
Queue shown is maximum after two cycles.<br />
September 2012 Synchro Report<br />
<strong>SM</strong> <strong>ROCHA</strong>, <strong>LLC</strong><br />
Appendix C - Capacity Worksheets - Page 8
Timings Total Traffic Volumes<br />
1: Coal Mine Avenue & Kipling Parkway<br />
PM Peak Hour<br />
Splits and Phases: 1: Coal Mine Avenue & Kipling Parkway<br />
September 2012 Synchro Report<br />
<strong>SM</strong> <strong>ROCHA</strong>, <strong>LLC</strong><br />
Appendix C - Capacity Worksheets - Page 9
HCM Unsignalized Intersection Capacity Analysis Total Traffic Volumes<br />
2: Coal Mine Avenue & Street A<br />
PM Peak Hour<br />
Movement EBL EBT EBR WBL WBT WBR NBL NBT NBR SBL SBT SBR<br />
Lane Configurations<br />
Sign Control Free Free Stop Stop<br />
Grade 0% 0% 0% 0%<br />
Volume (veh/h) 72 600 12 2 518 87 9 0 1 86 3 78<br />
Peak Hour Factor 0.92 0.92 0.92 0.92 0.92 0.92 0.92 0.92 0.92 0.92 0.92 0.92<br />
Hourly flow rate (vph) 78 652 13 2 563 95 10 0 1 93 3 85<br />
Pedestrians<br />
Lane Width (ft)<br />
Walking Speed (ft/s)<br />
Percent Blockage<br />
Right turn flare (veh) 2<br />
Median type None None<br />
Median storage veh)<br />
Upstream signal (ft) 403<br />
pX, platoon unblocked 0.97 0.97 0.97 0.97 0.97 0.97<br />
vC, conflicting volume 658 665 1096 1471 326 1051 1389 282<br />
vC1, stage 1 conf vol<br />
vC2, stage 2 conf vol<br />
vCu, unblocked vol 658 622 1067 1454 272 1020 1369 282<br />
tC, single (s) 4.1 4.1 7.5 6.5 6.9 7.5 6.5 6.9<br />
tC, 2 stage (s)<br />
tF (s) 2.2 2.2 3.5 4.0 3.3 3.5 4.0 3.3<br />
p0 queue free % 92 100 93 100 100 46 97 88<br />
cM capacity (veh/h) 926 925 138 114 703 172 129 716<br />
Direction, Lane # EB 1 EB 2 EB 3 EB 4 WB 1 WB 2 WB 3 WB 4 NB 1 SB 1 SB 2<br />
Volume Total 78 326 326 13 2 282 282 95 11 93 88<br />
Volume Left 78 0 0 0 2 0 0 0 10 93 0<br />
Volume Right 0 0 0 13 0 0 0 95 1 0 85<br />
cSH 926 1700 1700 1700 925 1700 1700 1700 150 172 743<br />
Volume to Capacity 0.08 0.19 0.19 0.01 0.00 0.17 0.17 0.06 0.07 0.54 0.12<br />
Queue Length (ft) 7 0 0 0 0 0 0 0 6 69 10<br />
Control Delay (s) 9.2 0.0 0.0 0.0 8.9 0.0 0.0 0.0 30.9 48.3 11.6<br />
Lane LOS A A D E B<br />
Approach Delay (s) 1.0 0.0 30.9 30.5<br />
Approach LOS D D<br />
Intersection Summary<br />
Average Delay 4.1<br />
Intersection Capacity Utilization 37.1% ICU Level of Service A<br />
Analysis Period (min) 15<br />
September 2012 Synchro Report<br />
<strong>SM</strong> <strong>ROCHA</strong>, <strong>LLC</strong><br />
Appendix C - Capacity Worksheets - Page 10