monsanto-2012-annual-report
monsanto-2012-annual-report
monsanto-2012-annual-report
Create successful ePaper yourself
Turn your PDF publications into a flip-book with our unique Google optimized e-Paper software.
MONSANTO COMPANY <strong>2012</strong> FORM 10-K<br />
Overview of Financial Performance (<strong>2012</strong> compared<br />
with 2011)<br />
The following section discusses the significant components of<br />
our results of operations that affected the comparison of fiscal<br />
year <strong>2012</strong> with fiscal year 2011.<br />
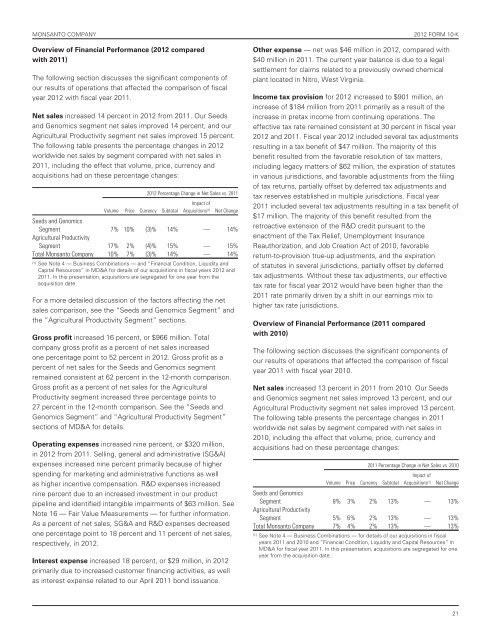
Net sales increased 14 percent in <strong>2012</strong> from 2011. Our Seeds<br />
and Genomics segment net sales improved 14 percent, and our<br />
Agricultural Productivity segment net sales improved 15 percent.<br />
The following table presents the percentage changes in <strong>2012</strong><br />
worldwide net sales by segment compared with net sales in<br />
2011, including the effect that volume, price, currency and<br />
acquisitions had on these percentage changes:<br />
<strong>2012</strong> Percentage Change in Net Sales vs. 2011<br />
Impact of<br />
Volume Price Currency Subtotal Acquisitions (1) Net Change<br />
Seeds and Genomics<br />
Segment<br />
Agricultural Productivity<br />
7% 10% (3)% 14% — 14%<br />
Segment 17% 2% (4)% 15% — 15%<br />
Total Monsanto Company 10% 7% (3)% 14% — 14%<br />
(1) See Note 4 — Business Combinations — and “Financial Condition, Liquidity and<br />
Capital Resources” in MD&A for details of our acquisitions in fiscal years <strong>2012</strong> and<br />
2011. In this presentation, acquisitions are segregated for one year from the<br />
acquisition date.<br />
For a more detailed discussion of the factors affecting the net<br />
sales comparison, see the “Seeds and Genomics Segment” and<br />
the “Agricultural Productivity Segment” sections.<br />
Gross profit increased 16 percent, or $966 million. Total<br />
company gross profit as a percent of net sales increased<br />
one percentage point to 52 percent in <strong>2012</strong>. Gross profit as a<br />
percent of net sales for the Seeds and Genomics segment<br />
remained consistent at 62 percent in the 12-month comparison.<br />
Gross profit as a percent of net sales for the Agricultural<br />
Productivity segment increased three percentage points to<br />
27 percent in the 12-month comparison. See the “Seeds and<br />
Genomics Segment” and “Agricultural Productivity Segment”<br />
sections of MD&A for details.<br />
Operating expenses increased nine percent, or $320 million,<br />
in <strong>2012</strong> from 2011. Selling, general and administrative (SG&A)<br />
expenses increased nine percent primarily because of higher<br />
spending for marketing and administrative functions as well<br />
as higher incentive compensation. R&D expenses increased<br />
nine percent due to an increased investment in our product<br />
pipeline and identified intangible impairments of $63 million. See<br />
Note 16 — Fair Value Measurements — for further information.<br />
As a percent of net sales, SG&A and R&D expenses decreased<br />
one percentage point to 18 percent and 11 percent of net sales,<br />
respectively, in <strong>2012</strong>.<br />
Interest expense increased 18 percent, or $29 million, in <strong>2012</strong><br />
primarily due to increased customer financing activities, as well<br />
as interest expense related to our April 2011 bond issuance.<br />
Other expense — net was $46 million in <strong>2012</strong>, compared with<br />
$40 million in 2011. The current year balance is due to a legal<br />
settlement for claims related to a previously owned chemical<br />
plant located in Nitro, West Virginia.<br />
Income tax provision for <strong>2012</strong> increased to $901 million, an<br />
increase of $184 million from 2011 primarily as a result of the<br />
increase in pretax income from continuing operations. The<br />
effective tax rate remained consistent at 30 percent in fiscal year<br />
<strong>2012</strong> and 2011. Fiscal year <strong>2012</strong> included several tax adjustments<br />
resulting in a tax benefit of $47 million. The majority of this<br />
benefit resulted from the favorable resolution of tax matters,<br />
including legacy matters of $62 million, the expiration of statutes<br />
in various jurisdictions, and favorable adjustments from the filing<br />
of tax returns, partially offset by deferred tax adjustments and<br />
tax reserves established in multiple jurisdictions. Fiscal year<br />
2011 included several tax adjustments resulting in a tax benefit of<br />
$17 million. The majority of this benefit resulted from the<br />
retroactive extension of the R&D credit pursuant to the<br />
enactment of the Tax Relief, Unemployment Insurance<br />
Reauthorization, and Job Creation Act of 2010, favorable<br />
return-to-provision true-up adjustments, and the expiration<br />
of statutes in several jurisdictions, partially offset by deferred<br />
tax adjustments. Without these tax adjustments, our effective<br />
tax rate for fiscal year <strong>2012</strong> would have been higher than the<br />
2011 rate primarily driven by a shift in our earnings mix to<br />
higher tax rate jurisdictions.<br />
Overview of Financial Performance (2011 compared<br />
with 2010)<br />
The following section discusses the significant components of<br />
our results of operations that affected the comparison of fiscal<br />
year 2011 with fiscal year 2010.<br />
Net sales increased 13 percent in 2011 from 2010. Our Seeds<br />
and Genomics segment net sales improved 13 percent, and our<br />
Agricultural Productivity segment net sales improved 13 percent.<br />
The following table presents the percentage changes in 2011<br />
worldwide net sales by segment compared with net sales in<br />
2010, including the effect that volume, price, currency and<br />
acquisitions had on these percentage changes:<br />
2011 Percentage Change in Net Sales vs. 2010<br />
Impact of<br />
Volume Price Currency Subtotal Acquisitions (1) Net Change<br />
Seeds and Genomics<br />
Segment<br />
Agricultural Productivity<br />
8% 3% 2% 13% — 13%<br />
Segment 5% 6% 2% 13% — 13%<br />
Total Monsanto Company 7% 4% 2% 13% — 13%<br />
(1) See Note 4 — Business Combinations — for details of our acquisitions in fiscal<br />
years 2011 and 2010 and “Financial Condition, Liquidity and Capital Resources” in<br />
MD&A for fiscal year 2011. In this presentation, acquisitions are segregated for one<br />
year from the acquisition date.<br />
21


