A Software Defined Radio for the Masses, Part 4 - ARRL
A Software Defined Radio for the Masses, Part 4 - ARRL
A Software Defined Radio for the Masses, Part 4 - ARRL

Create successful ePaper yourself
Turn your PDF publications into a flip-book with our unique Google optimized e-Paper software.
Table 5 –Cascaded Noise Figure and Gain Analysis from <strong>the</strong> SDR-1000 Level Analysis Spreadsheet<br />
BPF T1-4 PI5V331 INA163 ADC<br />
dB Noise Figure 0.0 0.0 0.0 3.0 58.6<br />
dB Gain 0.0 6.0 0.0 40.0 0.0<br />
Equivalent Power Factor Noise Factor 1.00 1.00 1.00 1.99 720,482<br />
Equivalent Power Factor Gain 1 4 1 10,000 1<br />
Clipping Level Vpk 1.0 13.0 6.4<br />
Clipping Level dBm 10.0 32.3 26.1<br />
Cascaded Gain dB 0.0 6.0 6.0 46.0 46.0<br />
Cascaded Noise Factor 1.00 1.00 1.00 1.25 19.06<br />
Cascaded Noise Figure dB 0.0 0.0 0.0 1.0 12.8<br />
Output Noise dBm/Hz –174.0 –174.0 –174.0 –173.0 –161.2<br />
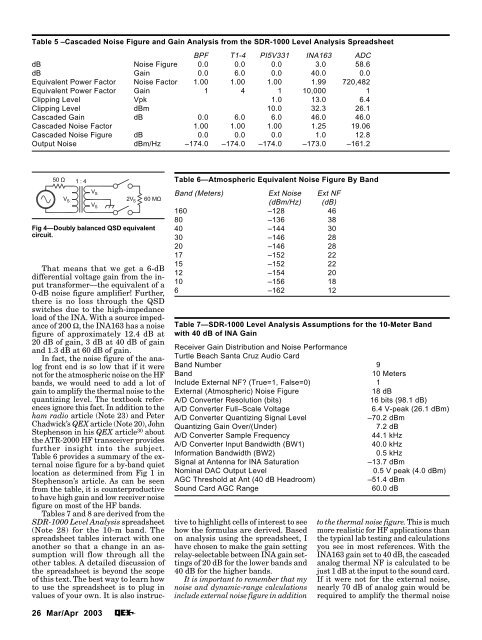
Fig 4—Doubly balanced QSD equivalent<br />
circuit.<br />
That means that we get a 6-dB<br />
differential voltage gain from <strong>the</strong> input<br />
trans<strong>for</strong>mer—<strong>the</strong> equivalent of a<br />
0-dB noise figure amplifier! Fur<strong>the</strong>r,<br />
<strong>the</strong>re is no loss through <strong>the</strong> QSD<br />
switches due to <strong>the</strong> high-impedance<br />
load of <strong>the</strong> INA. With a source impedance<br />
of 200 Ω, <strong>the</strong> INA163 has a noise<br />
figure of approximately 12.4 dB at<br />
20 dB of gain, 3 dB at 40 dB of gain<br />
and 1.3 dB at 60 dB of gain.<br />
In fact, <strong>the</strong> noise figure of <strong>the</strong> analog<br />
front end is so low that if it were<br />
not <strong>for</strong> <strong>the</strong> atmospheric noise on <strong>the</strong> HF<br />
bands, we would need to add a lot of<br />
gain to amplify <strong>the</strong> <strong>the</strong>rmal noise to <strong>the</strong><br />
quantizing level. The textbook references<br />
ignore this fact. In addition to <strong>the</strong><br />
ham radio article (Note 23) and Peter<br />
Chadwick’s QEX article (Note 20), John<br />
Stephenson in his QEX article 30 about<br />
<strong>the</strong> ATR-2000 HF transceiver provides<br />
fur<strong>the</strong>r insight into <strong>the</strong> subject.<br />
Table 6 provides a summary of <strong>the</strong> external<br />
noise figure <strong>for</strong> a by-band quiet<br />
location as determined from Fig 1 in<br />
Stephenson’s article. As can be seen<br />
from <strong>the</strong> table, it is counterproductive<br />
to have high gain and low receiver noise<br />
figure on most of <strong>the</strong> HF bands.<br />
Tables 7 and 8 are derived from <strong>the</strong><br />
SDR-1000 Level Analysis spreadsheet<br />
(Note 28) <strong>for</strong> <strong>the</strong> 10-m band. The<br />
spreadsheet tables interact with one<br />
ano<strong>the</strong>r so that a change in an assumption<br />
will flow through all <strong>the</strong><br />
o<strong>the</strong>r tables. A detailed discussion of<br />
<strong>the</strong> spreadsheet is beyond <strong>the</strong> scope<br />
of this text. The best way to learn how<br />
to use <strong>the</strong> spreadsheet is to plug in<br />
values of your own. It is also instruc-<br />
26 Mar/Apr 2003<br />
Table 6—Atmospheric Equivalent Noise Figure By Band<br />
Band (Meters) Ext Noise Ext NF<br />
(dBm/Hz) (dB)<br />
160 –128 46<br />
80 –136 38<br />
40 –144 30<br />
30 –146 28<br />
20 –146 28<br />
17 –152 22<br />
15 –152 22<br />
12 –154 20<br />
10 –156 18<br />
6 –162 12<br />
Table 7—SDR-1000 Level Analysis Assumptions <strong>for</strong> <strong>the</strong> 10-Meter Band<br />
with 40 dB of INA Gain<br />
Receiver Gain Distribution and Noise Per<strong>for</strong>mance<br />
Turtle Beach Santa Cruz Audio Card<br />
Band Number 9<br />
Band 10 Meters<br />
Include External NF? (True=1, False=0) 1<br />
External (Atmospheric) Noise Figure 18 dB<br />
A/D Converter Resolution (bits) 16 bits (98.1 dB)<br />
A/D Converter Full–Scale Voltage 6.4 V-peak (26.1 dBm)<br />
A/D Converter Quantizing Signal Level –70.2 dBm<br />
Quantizing Gain Over/(Under) 7.2 dB<br />
A/D Converter Sample Frequency 44.1 kHz<br />
A/D Converter Input Bandwidth (BW1) 40.0 kHz<br />
In<strong>for</strong>mation Bandwidth (BW2) 0.5 kHz<br />
Signal at Antenna <strong>for</strong> INA Saturation –13.7 dBm<br />
Nominal DAC Output Level 0.5 V peak (4.0 dBm)<br />
AGC Threshold at Ant (40 dB Headroom) –51.4 dBm<br />
Sound Card AGC Range 60.0 dB<br />
tive to highlight cells of interest to see<br />
how <strong>the</strong> <strong>for</strong>mulas are derived. Based<br />
on analysis using <strong>the</strong> spreadsheet, I<br />
have chosen to make <strong>the</strong> gain setting<br />
relay-selectable between INA gain settings<br />
of 20 dB <strong>for</strong> <strong>the</strong> lower bands and<br />
40 dB <strong>for</strong> <strong>the</strong> higher bands.<br />
It is important to remember that my<br />
noise and dynamic-range calculations<br />
include external noise figure in addition<br />
to <strong>the</strong> <strong>the</strong>rmal noise figure. This is much<br />
more realistic <strong>for</strong> HF applications than<br />
<strong>the</strong> typical lab testing and calculations<br />
you see in most references. With <strong>the</strong><br />
INA163 gain set to 40 dB, <strong>the</strong> cascaded<br />
analog <strong>the</strong>rmal NF is calculated to be<br />
just 1 dB at <strong>the</strong> input to <strong>the</strong> sound card.<br />
If it were not <strong>for</strong> <strong>the</strong> external noise,<br />
nearly 70 dB of analog gain would be<br />
required to amplify <strong>the</strong> <strong>the</strong>rmal noise