ARM Enhancements to HITRAN
ARM Enhancements to HITRAN
ARM Enhancements to HITRAN

You also want an ePaper? Increase the reach of your titles
YUMPU automatically turns print PDFs into web optimized ePapers that Google loves.
Introduction<br />
<strong>ARM</strong> <strong>Enhancements</strong> <strong>to</strong> <strong>HITRAN</strong><br />
Correct radiative transfer modeling relies on the proper<br />
characterization of the molecular absorption in the<br />
atmospheric path. The knowledge of absorption parameters<br />
not only pertains <strong>to</strong> gases that are objectives of energy<br />
budget studies, but <strong>to</strong> interfering species as well. Highresolution<br />
Transmission (<strong>HITRAN</strong>) is a keys<strong>to</strong>ne in the<br />
simulation studies, either through line-by-line calculations<br />
[including now the infrared (IR) cross-sections] or via bandmodel<br />
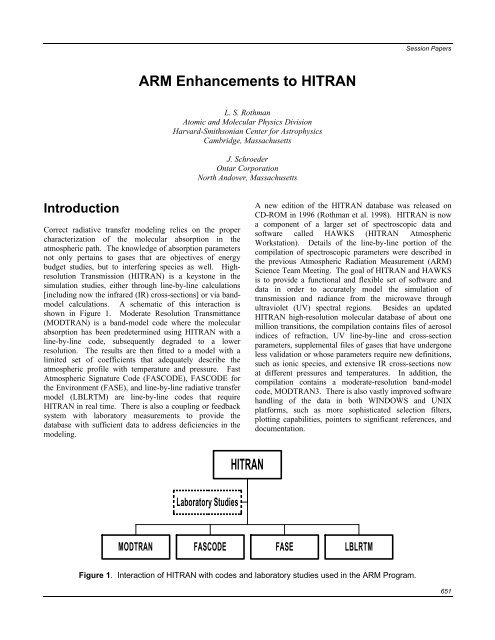
calculations. A schematic of this interaction is<br />
shown in Figure 1. Moderate Resolution Transmittance<br />
(MODTRAN) is a band-model code where the molecular<br />
absorption has been predetermined using <strong>HITRAN</strong> with a<br />
line-by-line code, subsequently degraded <strong>to</strong> a lower<br />
resolution. The results are then fitted <strong>to</strong> a model with a<br />
limited set of coefficients that adequately describe the<br />
atmospheric profile with temperature and pressure. Fast<br />
Atmospheric Signature Code (FASCODE), FASCODE for<br />
the Environment (FASE), and line-by-line radiative transfer<br />
model (LBLRTM) are line-by-line codes that require<br />
<strong>HITRAN</strong> in real time. There is also a coupling or feedback<br />
system with labora<strong>to</strong>ry measurements <strong>to</strong> provide the<br />
database with sufficient data <strong>to</strong> address deficiencies in the<br />
modeling.<br />
L. S. Rothman<br />
A<strong>to</strong>mic and Molecular Physics Division<br />
Harvard-Smithsonian Center for Astrophysics<br />
Cambridge, Massachusetts<br />
J. Schroeder<br />
Ontar Corporation<br />
North Andover, Massachusetts<br />
Labora<strong>to</strong>ry Studies<br />
<strong>HITRAN</strong><br />
Session Papers<br />
A new edition of the <strong>HITRAN</strong> database was released on<br />
CD-ROM in 1996 (Rothman et al. 1998). <strong>HITRAN</strong> is now<br />
a component of a larger set of spectroscopic data and<br />
software called HAWKS (<strong>HITRAN</strong> Atmospheric<br />
Workstation). Details of the line-by-line portion of the<br />
compilation of spectroscopic parameters were described in<br />
the previous Atmospheric Radiation Measurement (<strong>ARM</strong>)<br />
Science Team Meeting. The goal of <strong>HITRAN</strong> and HAWKS<br />
is <strong>to</strong> provide a functional and flexible set of software and<br />
data in order <strong>to</strong> accurately model the simulation of<br />
transmission and radiance from the microwave through<br />
ultraviolet (UV) spectral regions. Besides an updated<br />
<strong>HITRAN</strong> high-resolution molecular database of about one<br />
million transitions, the compilation contains files of aerosol<br />
indices of refraction, UV line-by-line and cross-section<br />
parameters, supplemental files of gases that have undergone<br />
less validation or whose parameters require new definitions,<br />
such as ionic species, and extensive IR cross-sections now<br />
at different pressures and temperatures. In addition, the<br />
compilation contains a moderate-resolution band-model<br />
code, MODTRAN3. There is also vastly improved software<br />
handling of the data in both WINDOWS and UNIX<br />
platforms, such as more sophisticated selection filters,<br />
plotting capabilities, pointers <strong>to</strong> significant references, and<br />
documentation.<br />
MODTRAN FASCODE FASE LBLRTM<br />
Figure 1. Interaction of <strong>HITRAN</strong> with codes and labora<strong>to</strong>ry studies used in the <strong>ARM</strong> Program.<br />
651
Session Papers<br />
IR Cross-Sections<br />
When it became evident that data on individual spectral<br />
lines belonging <strong>to</strong> certain heavy molecular species such as<br />
chlorofluorocarbons (CFCs), hydrochlorofluorocarbons<br />
(HCFCs), SF6, and oxides of nitrogen (for example, N2O5)<br />
could not be reasonably characterized and tabulated in the<br />
traditional <strong>HITRAN</strong> format, the approach <strong>to</strong> report spectral<br />
absorption cross-sections measured at atmospheric<br />
conditions was adopted (Massie and Goldman 1992). The<br />
previous two editions of the <strong>HITRAN</strong> compilation<br />
(Rothman et al. 1987; Rothman et al. 1992) introduced<br />
temperature-dependent cross-sections but neglected the<br />
effect of pressure broadening. The increasing use of the<br />
cross-sections in atmospheric modeling, especially for<br />
remote sensing, has given rise <strong>to</strong> numerous labora<strong>to</strong>ry<br />
programs for acquiring these data sets (Varanasi 1992a;<br />
Varanasi 1992b; Varanasi et al. 1992).<br />
The absorption cross-section, kν (cm 2 molecule -1 ), is defined<br />
as<br />
652<br />
( − ln τ ) / L<br />
kν = ν η<br />
in terms of the spectral transmittance τν at the wavenumber<br />
ν, temperature T, and pressure P, of column density η (in<br />
molecule/cm 3 ) along an optical path of length L (cm). It is<br />
presented at several (T,P) combinations representing<br />
atmospheric layers given in commonly tabulated<br />
atmospheric models as well as conditions encountered in the<br />
polar regions.<br />
Table 1 shows the datasets that have been added since the<br />
last edition of <strong>HITRAN</strong>. The cross-sections of CFC-11,<br />
CFC-12, HCFC-22, and SF6 were provided by Varanasi<br />
et al. (1994), Varanasi and Nemtchinov (1994), and Li and<br />
Varanasi (1994). These cross-sections, as well as other<br />
cross-section data in <strong>HITRAN</strong>, were measured using highresolution<br />
Fourier-transform spectrometers. For the four<br />
species listed above, a spectral resolution of 0.03 cm -1 was<br />
adequate for most of the broadening pressures used in the<br />
experiments, while at 40 <strong>to</strong>rr and lower, 0.01 cm -1 was used.<br />
The data were obtained at temperatures between 200 K and<br />
296 K and are free from instrumental dis<strong>to</strong>rtion, because the<br />
spectra were recorded at a spectral resolution that was<br />
sufficiently high at each broadening pressure used. The<br />
bands of CFC-12 were measured in the 810 cm -1 <strong>to</strong> 965 cm -1<br />
and 1040 cm -1 <strong>to</strong> 1200 cm -1 regions at temperatures ranging<br />
from 216 K <strong>to</strong> 296 K and pressures from 170 <strong>to</strong>rr <strong>to</strong><br />
760 <strong>to</strong>rr. The bands of CFC-11 in the 810 cm -1 <strong>to</strong> 880 cm -1<br />
and 1050 cm -1 <strong>to</strong> 1120 cm -1 regions were measured at<br />
temperatures in the range from 201 K <strong>to</strong> 296 K and<br />
pressures between 40 <strong>to</strong>rr and 760 <strong>to</strong>rr. Measurements of<br />
HCFC-22 and SF6 were made for bands in the 760 cm -1 <strong>to</strong><br />
860 cm -1 and 925 cm -1 <strong>to</strong> 955 cm -1 regions, respectively, at<br />
temperatures in the range from 216 K <strong>to</strong> 296 K and<br />
pressures from 40 <strong>to</strong>rr <strong>to</strong> 760 <strong>to</strong>rr.<br />
The cross-sections for the ClONO2 in the 1265 cm -1 <strong>to</strong><br />
1325 cm -1 region at 201 K, 211 K, and 222 K were provided<br />
by Orphal et al. (1994). They are made available along with<br />
those at 216 K and 296 K retained from the earlier editions<br />
of the database. The cross-sections of CCl4, listed at room<br />
Table 1. IR cross-section data added <strong>to</strong> latest editions of <strong>HITRAN</strong>.<br />
Wavenumber<br />
Molecule<br />
Range (cm -1 Temperature Pressure Number of<br />
) Range (K) Range (<strong>to</strong>rr) P,T Panels<br />
CCl4 770-810 170-310 — 12 (a)<br />
CFC-11<br />
810-880<br />
201-296<br />
40-760<br />
33<br />
(CCl3F )<br />
1050-1120<br />
201-296<br />
40-760<br />
33<br />
CFC-12<br />
810-965<br />
216-296<br />
170-760<br />
15<br />
(CCl2F2 )<br />
1040-1200<br />
216-296<br />
170-760<br />
15<br />
HCFC-22 (CHClF2) 760-860 216-294 40-760 7<br />
SF6 925-955 216-295 25-760 7<br />
ClONO2 1265-1325 201-222 — 3 (a)<br />
HFC-32<br />
995-1236<br />
203-297<br />
37-750<br />
17<br />
(CH2F2 )<br />
1385-1475<br />
203-297<br />
37-750<br />
17<br />
HFC-134<br />
(CHF2CHF2 )<br />
600-1700 203-297 37-750 9<br />
HFC-143a<br />
580-630<br />
203-297<br />
37-750<br />
9<br />
(CF3CH3 )<br />
750-1050<br />
203-297<br />
37-750<br />
9<br />
(a) Only temperature sets.<br />
1100-1500<br />
203-297<br />
37-750<br />
9
temperature in the previous editions of the database, have<br />
been augmented in this edition with data at 170 K, 223 K,<br />
248 K, 273 K, 298 K, and 310 K reported by Orlando et al.<br />
(1992).<br />
The data are presented as separate files for each individual<br />
molecule. Each portion of the file corresponding <strong>to</strong> a<br />
particular temperature-pressure pair begins with a header<br />
(see Table 2) that contains information on the wavenumber<br />
(cm -1 ) range, number of cross-section data in this set,<br />
Table 2. File structure and format (in FORTRAN) for cross-section files.<br />
Molecule vinit (1)<br />
(cm<br />
A10<br />
-1 )<br />
vfinal (1)<br />
(cm<br />
F10.4<br />
-1 )<br />
Number of<br />
points<br />
T (1)<br />
(EK)<br />
P (1)<br />
(<strong>to</strong>rr)<br />
F10.4 I10 F10.4 F10.4<br />
Cross-sections (10 per line)<br />
[ cm 2 /molecule @ T(1),P(1) ]<br />
Molecule<br />
A10<br />
Molecule<br />
A10<br />
Molecule<br />
A10<br />
vinit (1)<br />
(cm -1 )<br />
F10.4<br />
vinit (2)<br />
(cm -1 )<br />
F10.4<br />
vinit (2)<br />
(cm -1 )<br />
F10.4<br />
vfinal (1)<br />
(cm -1 )<br />
F10.4<br />
vfinal (2)<br />
(cm -1 )<br />
F10.4<br />
vfinal (2)<br />
(cm -1 )<br />
F10.4<br />
Number of<br />
points<br />
I10<br />
(10E10.3)<br />
Session Papers<br />
temperature (K), and pressure (<strong>to</strong>rr). The maximum value<br />
of the absorption cross-section (cm 2 /molecule) and<br />
additional information containing the reference <strong>to</strong> that<br />
observation are also presented in each header. The<br />
wavenumber spacing Δν of the cross-section listings is<br />
uniform for each of the pressure-temperature sets, and is<br />
determined by taking the difference between the maximum<br />
and minimum wavenumber and dividing by one less the<br />
number of points N (cross-section data in this set), i.e., Δν =<br />
(νmax - νmin)/(N - 1).<br />
T (2)<br />
(EK)<br />
F10.4<br />
P (2)<br />
(<strong>to</strong>rr)<br />
F10.4<br />
Cross-sections (10 per line)<br />
[ cm 2 /molecule @ T(2),P(2) ]<br />
(10E10.3)<br />
Number of<br />
p p p<br />
' ' '<br />
T (1) P (1)<br />
points (EK) (<strong>to</strong>rr)<br />
I10 F10.4 F10.4<br />
Cross-sections (10 per line)<br />
[ cm 2 /molecule @ T(1),P(1) ]<br />
Number of<br />
points<br />
I10<br />
(10E10.3)<br />
T (2)<br />
(EK)<br />
F10.4<br />
P (2)<br />
(<strong>to</strong>rr)<br />
F10.4<br />
Cross-sections (10 per line)<br />
[ cm 2 /molecule @ T(2),P(2) ]<br />
(10E10.3)<br />
Fmax<br />
E10.3<br />
Fmax<br />
E10.3<br />
Fmax<br />
E10.3<br />
Fmax<br />
E10.3<br />
Reference +<br />
Additional Info.<br />
3A10<br />
Reference +<br />
Additional Info.<br />
3A10<br />
Reference +<br />
Additional Info.<br />
3A10<br />
Reference +<br />
Additional Info.<br />
3A10<br />
Note: Data sets surviving from earlier editions are only given for different temperatures, not pressure-temperature<br />
pairs.<br />
653
Session Papers<br />
The increased use of hydrofluorocarbons (HFCs), which are<br />
expected <strong>to</strong> replace CFCs and HCFCs in many applications<br />
<strong>to</strong> reduce the deleterious effects of released chlorine on the<br />
atmospheric ozone layer, will add another absorber in the IR<br />
“window” region, 8 μm <strong>to</strong> 12 μm. Smith et al. (1998) have<br />
recently determined the cross-sections of HFC-134<br />
(CHF2CHF2) and HFC-143a (CF3CH3), and these data will<br />
be available on a future edition of <strong>HITRAN</strong>.<br />
Conclusions<br />
The <strong>HITRAN</strong>/HAWKS compilation has been steadily<br />
adding IR cross-sections for “heavy” molecular atmospheric<br />
species, where line-by-line parameters become highly<br />
impractical. The increased use of HFCs, which are expected<br />
<strong>to</strong> replace CFCs and HCFCs in many applications <strong>to</strong> reduce<br />
the deleterious effects of released chlorine on the<br />
atmospheric ozone layer, will add another absorber in the IR<br />
“window” region, 8 μm <strong>to</strong> 12 μm.<br />
An example of new modeling capabilities is the<br />
methodology of line coupling, which has large implications<br />
in remote-sensing retrievals. A recent scheme by Rodrigues<br />
et al. (1998) has been developed that includes line-mixing<br />
parameters (as auxiliary files <strong>to</strong> <strong>HITRAN</strong>) as well as the<br />
software <strong>to</strong> properly use these parameters in radiative<br />
transfer codes.<br />
Finally, all HAWKS software (editing, filtering, plotting,<br />
etc.) has been re-written in the JAVA language, so that one<br />
now has cross-platform conformity. This allows MAC<br />
users <strong>to</strong> have the full features of HAWKS that were only<br />
available previously in the WINDOWS and UNIX<br />
environments.<br />
Updates are released for the HAWKS compilation on the<br />
<strong>HITRAN</strong> web site (http://www.<strong>HITRAN</strong>.com) prior <strong>to</strong><br />
distribution of the final edition on CD-ROM. Other relevant<br />
information connected with the <strong>HITRAN</strong> spectroscopic<br />
database is also contained within this web-site.<br />
References<br />
Li, Z., and P. Varanasi, 1994: Measurement of the<br />
absorption cross-sections of CFC-11 at conditions representing<br />
various model atmospheres. JQSRT, 52, 137-144.<br />
Massie, S. T., and A. Goldman, 1992: Absorption<br />
parameters of very dense molecular spectra for the <strong>HITRAN</strong><br />
compilation. JQSRT, 48, 713-719.<br />
654<br />
Orlando, J. J., G. S. Tyndall, A. Huang, and J. G. Calvert,<br />
1992: Temperature dependence of the infrared absorption<br />
cross sections of the carbon tetrachloride. Geophys. Res.<br />
Lett., 19, 1005-1008.<br />
Orphal, J., M. Morillon-Chapey, and G. Guelachvili, 1994:<br />
High-resolution absorption cross sections of chlorine nitrate<br />
in the
Varanasi, P., A. Gopalan, and J. F. Brannon Jr., 1992:<br />
Infrared absorption coefficient data on SF6 applicable <strong>to</strong><br />
atmospheric remote sensing. JQSRT, 48, 141-145.<br />
Varanasi, P., and V. Nemtchinov, 1994: Thermal infrared<br />
absorption coefficients of CFC-12 at atmospheric<br />
conditions. JQSRT, 51, 679-687.<br />
Session Papers<br />
Varanasi, P., Z. Li, V. Nemtchinov, and A. Cherukuri, 1994:<br />
Spectral absorption-coefficient data on HCFC-22 and SF6<br />
for remote-sensing applications. JQSRT, 52, 323-332.<br />
655