Surface-Enhanced Raman Scattering Detection of Amphetamine ...
Surface-Enhanced Raman Scattering Detection of Amphetamine ...
Surface-Enhanced Raman Scattering Detection of Amphetamine ...

You also want an ePaper? Increase the reach of your titles
YUMPU automatically turns print PDFs into web optimized ePapers that Google loves.
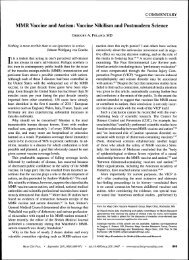
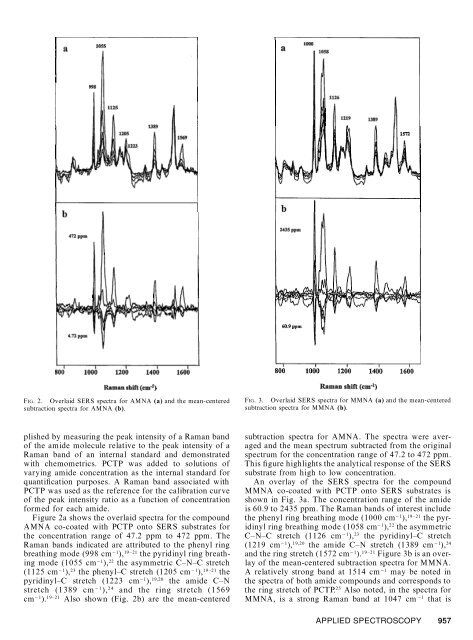
FIG. 2. Overlaid SERS spectra for AMNA (a) and the mean-centered<br />
subtraction spectra for AMNA (b).<br />
plished by measuring the peak intensity <strong>of</strong> a <strong>Raman</strong> band<br />
<strong>of</strong> the amide molecule relative to the peak intensity <strong>of</strong> a<br />
<strong>Raman</strong> band <strong>of</strong> an internal standard and demonstrated<br />
with chemometrics. PCTP was added to solutions <strong>of</strong><br />
varying amide concentration as the internal standard for<br />
quanti® cation purposes. A <strong>Raman</strong> band associated with<br />
PCTP was used as the reference for the calibration curve<br />
<strong>of</strong> the peak intensity ratio as a function <strong>of</strong> concentration<br />
formed for each amide.<br />
Figure 2a shows the overlaid spectra for the compound<br />
AMNA co-coated with PCTP onto SERS substrates for<br />
the concentration range <strong>of</strong> 47.2 ppm to 472 ppm. The<br />
<strong>Raman</strong> bands indicated are attributed to the phenyl ring<br />
breathing mode (998 cm 2 1 ), 19 ±21 the pyridinyl ring breathing<br />
mode (1055 cm 2 1 ), 22 the asymmetric C±N±C stretch<br />
(1125 cm 2 1 ), 23 the phenyl±C stretch (1205 cm 2 1 ), 19 ±21 the<br />
pyridinyl±C stretch (1223 cm 2 1 ), 19,20 the amide C±N<br />
stretch (1389 cm 2 1 ), 2 4 and the ring stretch (1569<br />
cm 2 1 ). 19±21 Also shown (Fig. 2b) are the mean-centered<br />
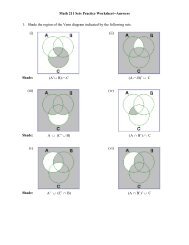
FIG. 3. Overlaid SERS spectra for MMNA (a) and the mean-centered<br />
subtraction spectra for MMNA (b).<br />
subtraction spectra for AMNA. The spectra were averaged<br />
and the mean spectrum subtracted from the original<br />
spectrum for the concentration range <strong>of</strong> 47.2 to 472 ppm.<br />
This ® gure highlights the analytical response <strong>of</strong> the SERS<br />
substrate from high to low concentration.<br />
An overlay <strong>of</strong> the SERS spectra for the compound<br />
MMNA co-coated with PCTP onto SERS substrates is<br />
shown in Fig. 3a. The concentration range <strong>of</strong> the amide<br />
is 60.9 to 2435 ppm. The <strong>Raman</strong> bands <strong>of</strong> interest include<br />
the phenyl ring breathing mode (1000 cm 2 1 ), 19 ±21 the pyridinyl<br />
ring breathing mode (1058 cm 2 1 ), 22 the asymmetric<br />
C±N±C stretch (1126 cm 2 1 ), 23 the pyridinyl±C stretch<br />
(1219 cm 2 1 ), 19,20 the amide C±N stretch (1389 cm 2 1 ), 24<br />
and the ring stretch (1572 cm 2 1 ). 19 ±21 Figure 3b is an overlay<br />
<strong>of</strong> the mean-centered subtraction spectra for MMNA.<br />
A relatively strong band at 1514 cm 2 1 may be noted in<br />
the spectra <strong>of</strong> both amide compounds and corresponds to<br />
the ring stretch <strong>of</strong> PCTP. 25 Also noted, in the spectra for<br />
MMNA, is a strong <strong>Raman</strong> band at 1047 cm 2 1 that is<br />
APPLIED SPECTROSCOPY 957