Surface-Enhanced Raman Scattering Detection of Amphetamine ...
Surface-Enhanced Raman Scattering Detection of Amphetamine ...
Surface-Enhanced Raman Scattering Detection of Amphetamine ...

Create successful ePaper yourself
Turn your PDF publications into a flip-book with our unique Google optimized e-Paper software.
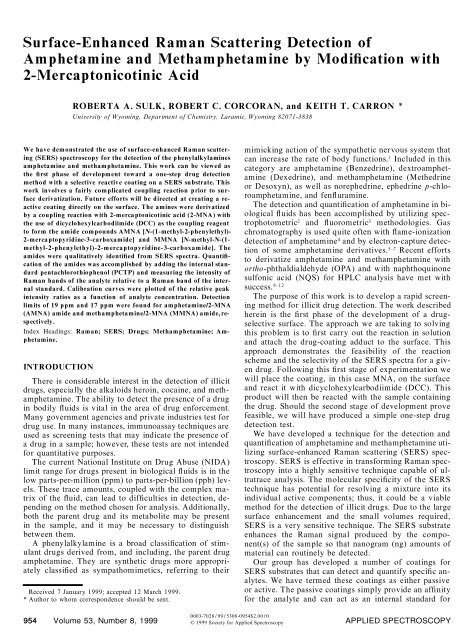
<strong>Surface</strong>-<strong>Enhanced</strong> <strong>Raman</strong> <strong>Scattering</strong> <strong>Detection</strong> <strong>of</strong><br />
<strong>Amphetamine</strong> and Methamphetamine by Modi® cation with<br />
2-Mercaptonicotinic Acid<br />
ROBERTA A. SULK, ROBERT C. CORCORAN, and KEITH T. CARRON *<br />
University <strong>of</strong> Wyoming, Department <strong>of</strong> Chemistry, Laramie, Wyoming 82071-3838<br />
We have demonstrated the use <strong>of</strong> surface-enhanced <strong>Raman</strong> scattering<br />
(SERS) spectroscopy for the detection <strong>of</strong> the phenylalkylamines<br />
amphetamine and methamphetamine. This work can be viewed as<br />
the ® rst phase <strong>of</strong> development toward a one-step drug detection<br />
method with a selective reactive coating on a SERS substrate. This<br />
work involves a fairly complicated coupling reaction prior to surface<br />
derivatization. Future efforts will be directed at creating a reactive<br />
coating directly on the surface. The amines were derivatized<br />
by a coupling reaction with 2-mercaptonicotinic acid (2-MNA) with<br />
the use <strong>of</strong> dicyclohexylcarbodiimide (DCC) as the coupling reagent<br />
to form the amide compounds AMNA [N-(1-methyl-2-phenylethyl)-<br />
2-mercaptopyridine-3-carboxamide] and MMNA [N-methyl-N-(1methyl-2-phenylethyl)-2-m<br />
ercaptopyridine-3-carboxam ide]. The<br />
amides were qualitatively identi® ed from SERS spectra. Quanti® -<br />
cation <strong>of</strong> the amides was accomplished by adding the internal standard<br />
pentachlorothiophenol (PCTP) and measuring the intensity <strong>of</strong><br />
<strong>Raman</strong> bands <strong>of</strong> the analyte relative to a <strong>Raman</strong> band <strong>of</strong> the internal<br />
standard. Calibration curves were plotted <strong>of</strong> the relative peak<br />
intensity ratios as a function <strong>of</strong> analyte concentration. <strong>Detection</strong><br />
limits <strong>of</strong> 19 ppm and 17 ppm were found for amphetamine/2-MNA<br />
(AMNA) amide and methamphetamine/2-MNA (MMNA) amide,respectively.<br />
Index Headings: <strong>Raman</strong>; SERS; Drugs; Methamphetamine; <strong>Amphetamine</strong>.<br />
INTRODUCTION<br />
There is considerable interest in the detection <strong>of</strong> illicit<br />
drugs, especially the alkaloids heroin, cocaine, and methamphetamine.<br />
The ability to detect the presence <strong>of</strong> a drug<br />
in bodily ¯ uids is vital in the area <strong>of</strong> drug enforcement.<br />
Many government agencies and private industries test for<br />
drug use. In many instances, immunoassay techniques are<br />
used as screening tests that may indicate the presence <strong>of</strong><br />
a drug in a sample; however, these tests are not intended<br />
for quantitative purposes.<br />
The current National Institute on Drug Abuse (NIDA)<br />
limit range for drugs present in biological ¯ uids is in the<br />
low parts-per-million (ppm) to parts-per-billion (ppb) levels.<br />
These trace amounts, coupled with the complex matrix<br />
<strong>of</strong> the ¯ uid, can lead to dif® culties in detection, depending<br />
on the method chosen for analysis. Additionally,<br />
both the parent drug and its metabolite may be present<br />
in the sample, and it may be necessary to distinguish<br />
between them.<br />
A phenylalkylamine is a broad classi® cation <strong>of</strong> stimulant<br />
drugs derived from, and including, the parent drug<br />
amphetamine. They are synthetic drugs more appropriately<br />
classi® ed as sympathomimetics, referring to their<br />
Received 7 January 1999; accepted 12 March 1999.<br />
* Author to whom correspondence should be sent.<br />
mimicking action <strong>of</strong> the sympathetic nervous system that<br />
can increase the rate <strong>of</strong> body functions. 1 Included in this<br />
category are amphetamine (Benzedrine), dextroamphetamine<br />
(Dexedrine), and methamphetamine (Methedrine<br />
or Desoxyn), as well as norephedrine, ephedrine p-chloroamphetamine,<br />
and fen¯ uramine.<br />
The detection and quanti® cation <strong>of</strong> amphetamine in biological<br />
¯ uids has been accomplished by utilizing spectrophotometric<br />
2 and ¯ uorometric 3 methodologies. Gas<br />
chromatography is used quite <strong>of</strong>ten with ¯ ame-ionization<br />
detection <strong>of</strong> amphetamine 4 and by electron-capture detection<br />
<strong>of</strong> some amphetamine derivatives. 5±7 Recent efforts<br />
to derivatize amphetamine and methamphetamine with<br />
ortho-phthaldialdehyde (OPA) and with naphthoquinone<br />
sulfonic acid (NQS) for HPLC analysis have met with<br />
success. 8±12<br />
The purpose <strong>of</strong> this work is to develop a rapid screening<br />
method for illicit drug detection. The work described<br />
herein is the ® rst phase <strong>of</strong> the development <strong>of</strong> a drugselective<br />
surface. The approach we are taking to solving<br />
this problem is to ® rst carry out the reaction in solution<br />
and attach the drug-coating adduct to the surface. This<br />
approach demonstrates the feasibility <strong>of</strong> the reaction<br />
scheme and the selectivity <strong>of</strong> the SERS spectra for a given<br />
drug. Following this ® rst stage <strong>of</strong> experimentation we<br />
will place the coating, in this case MNA, on the surface<br />
and react it with dicyclohexylcarbodiimide (DCC). This<br />
product will then be reacted with the sample containing<br />
the drug. Should the second stage <strong>of</strong> development prove<br />
feasible, we will have produced a simple one-step drug<br />
detection test.<br />
We have developed a technique for the detection and<br />
quanti® cation <strong>of</strong> amphetamine and methamphetamine utilizing<br />
surface-enhanced <strong>Raman</strong> scattering (SERS) spectroscopy.<br />
SERS is effective in transforming <strong>Raman</strong> spectroscopy<br />
into a highly sensitive technique capable <strong>of</strong> ultratrace<br />
analysis. The molecular speci® city <strong>of</strong> the SERS<br />
technique has potential for resolving a mixture into its<br />
individual active components; thus, it could be a viable<br />
method for the detection <strong>of</strong> illicit drugs. Due to the large<br />
surface enhancement and the small volumes required,<br />
SERS is a very sensitive technique. The SERS substrate<br />
enhances the <strong>Raman</strong> signal produced by the component(s)<br />
<strong>of</strong> the sample so that nanogram (ng) amounts <strong>of</strong><br />
material can routinely be detected.<br />
Our group has developed a number <strong>of</strong> coatings for<br />
SERS substrates that can detect and quantify speci® c analytes.<br />
We have termed these coatings as either passive<br />
or active. The passive coatings simply provide an af® nity<br />
for the analyte and can act as an internal standard for<br />
0003-7028 / 99 / 5308-0954$2.00 / 0<br />
954 Volume 53, Number 8, 1999 q 1999 Society for Applied Spectroscopy<br />
APPLIED SPECTROSCOPY
FIG. 1. Synthetic scheme for the derivatization <strong>of</strong> amphetamine (R5 H) or methamphetamine (R5 CH 3) with 2-mercaptonicotinic acid.<br />
normalizing the signal. <strong>Detection</strong> <strong>of</strong> chlorinated ethylenes<br />
on octadecylthiol-coated surfaces is an example <strong>of</strong> a passive<br />
coating. 13 Active coatings exhibit a different <strong>Raman</strong><br />
spectrum in the presence <strong>of</strong> the analyte. An example <strong>of</strong><br />
an active coating is our work with the pH active coatings<br />
on SERS substrates. 14 This work presents the ® rst step to<br />
a new type <strong>of</strong> coating. We have termed this type <strong>of</strong> coating<br />
as reactive. The concept is to put a reactive molecule<br />
onto a SERS substrate and analyze the reaction product<br />
with SERS.<br />
We propose a technique for the detection and quanti-<br />
® cation <strong>of</strong> amphetamine and methamphetamine utilizing<br />
SERS spectroscopy. This work describes a DCC coupling<br />
reaction whereby an amide is formed by coupling the<br />
amine with 2-mercaptonicotinic acid (2-MNA). 15±17 By<br />
derivatization <strong>of</strong> the amine with 2-MNA, a new compound<br />
is formed possessing functionalities useful for<br />
SERS analysis. 2-MNA was chosen due to its ability to<br />
bind to noble metals through both the thiol sulfur and the<br />
pyridine nitrogen. 18 We have recently shown that <strong>Raman</strong><br />
spectroscopy can be used to examine the responsivity to<br />
alkali m etal cations <strong>of</strong> diam inodibenzo-18-crown-6,<br />
which had been coupled to 2-MNA and attached to a<br />
SERS surface. 17<br />
The product formed between amphetamine or methamphetamine<br />
with 2-MNA can be coated onto a SERS<br />
substrate and a <strong>Raman</strong> spectrum obtained from the coated<br />
silver surface. Our detection scheme is based on bands<br />
observed in the <strong>Raman</strong> spectrum <strong>of</strong> the amide compared<br />
to the spectra <strong>of</strong> the starting materials. Quanti® cation <strong>of</strong><br />
the drug can be accomplished by adding a known quantity<br />
<strong>of</strong> pentachlorothiophenol (PCTP) as an internal standard.<br />
The co-adsorption <strong>of</strong> the amide and PCTP is a competitive<br />
process; however, within the range <strong>of</strong> our experimental<br />
concentrations the PCTP appears to cover the<br />
surface with a constant fractional coverage. The intensity<br />
<strong>of</strong> the <strong>Raman</strong> bands associated with the drug/2-MNA<br />
complex is measured relative to the intensity <strong>of</strong> a <strong>Raman</strong><br />
band associated with the internal standard. An important<br />
advantage <strong>of</strong> this technique is that the coupling reaction<br />
is not moisture sensitive so that it may be possible to<br />
apply this scheme to the detection <strong>of</strong> amphetamine and<br />
methamphetamine in biological ¯ uids.<br />
SYNTHESIS OF 2-MNA DERIVATIZED AMINES<br />
Materials and Solvents. D-<strong>Amphetamine</strong> sulfate and<br />
(1 )m etham phetam ine hydrochloride w ere purchased<br />
from Sigma. Absolute diethyl ether, 2-MNA, and DCC<br />
were purchased from Aldrich. Dichloromethane and ethyl<br />
acetate were purchased from Spectrum and EM Science,<br />
respectively. PCTP was purchased from TCI America.<br />
Absolute ethanol and methanol were purchased from<br />
Pharmco and Spectrum, respectively.<br />
Synthesis. The basic synthetic scheme is illustrated in<br />
Fig. 1. Reaction conditions were varied to examine the<br />
synthesis <strong>of</strong> the derivatized methamphetamine in chlorinated<br />
organic and aqueous alcohol solvent systems. The<br />
procedure for each will be provided in this section.<br />
Chlorinated Organic Solvent Conditions. <strong>Amphetamine</strong><br />
sulfate (363 mg, 1 mmol) or methamphetamine<br />
hydrochloride (186 mg, 1 mmol) was dissolved in 10 mL<br />
<strong>of</strong> an aqueous saturated solution <strong>of</strong> K 2CO 3 to neutralize<br />
the sulfate or hydrochloride. The freebase drug was then<br />
extracted from the aqueous solution by using 3 3 2 mL<br />
CH 2Cl 2. 2-MNA (155 mg, 1 mmol) and DCC (206 mg,<br />
1 mmol) were added to the combined extracts (6 mL) <strong>of</strong><br />
CH 2Cl 2 containing the drug. A condenser was attached to<br />
the reaction ¯ ask. The reaction mixture was gently re-<br />
¯ uxed overnight under a nitrogen atmosphere. The mixture<br />
was transferred to a separatory funnel with 20 mL<br />
<strong>of</strong> CH 2Cl 2 and washed with an aqueous saturated solution<br />
<strong>of</strong> NaHCO 3 (3 3 20 mL) to neutralize unreacted 2-MNA,<br />
followed by H 2O (2 3 10 mL) and a wash with a 10%<br />
HCl (1 3 10 mL) to neutralize unreacted freebase and<br />
DCC, and ® nally, dried over Na 2SO 4. The solvent was<br />
removed under reduced pressure.<br />
Either the amide <strong>of</strong> AMNA or the amide <strong>of</strong> MMNA<br />
was re-dissolved in 10 mL <strong>of</strong> CH 2Cl 2 and then further<br />
diluted with additional CH 2Cl 2 to make standard amide<br />
solutions. The internal standard <strong>of</strong> PCTP in CH 2Cl 2 was<br />
added to each solution for a ® nal concentration standard<br />
<strong>of</strong> 3 ppm per each amide solution.<br />
Aqueous/Ethanol Solvent Conditions. Methamphetamine<br />
hydrochloride (186 mg, 1 mmol) was dissolved in<br />
15 mL <strong>of</strong> saturated aqueous K 2CO 3 to neutralize the hydrochloride.<br />
The freebase <strong>of</strong> methamphetamine was then<br />
extracted from the aqueous solution by using 3 3 2 mL<br />
diethyl ether. The solvent was removed under reduced<br />
pressure and the methamphetamine redissolved in 8 mL<br />
<strong>of</strong> ethanol. 2-MNA (169 mg, 1.1 mmol) and DCC (228<br />
mg, 1.1 mmol) in 2 mL H 2O were added to the methamphetamine/ethanol<br />
mixture. A condenser was attached<br />
to the ¯ ask, and the mixture was gently re¯ uxed for 2 h<br />
under a nitrogen atmosphere. The reaction was followed<br />
by thin-layer chromatography (TLC) using a 50% ethanol/ethyl<br />
acetate eluent to monitor the disappearance <strong>of</strong><br />
starting materials. The ethanol was removed under reduced<br />
pressure. The reaction mixture was transferred to<br />
a separatory funnel with 10 mL <strong>of</strong> diethyl ether and extracted<br />
with additional ether (3 3 10 mL). The combined<br />
ether extracts were washed with saturated aqueous<br />
APPLIED SPECTROSCOPY 955
NaHCO 3 (3 3 20 mL), followed by a wash with H 2O (2<br />
3 10 mL), and then a wash with 10% HCl (1 3 10 mL).<br />
The organic layer was dried over Na 2SO 4. The solvent<br />
was removed under reduced pressure.<br />
Ten milligrams (10 mg) <strong>of</strong> MMNA was dissolved in 5<br />
mL methanol, then further diluted with additional methanol<br />
to make standard amide solutions. The internal standard<br />
<strong>of</strong> PCTP in CH 2Cl 2 was added to each solution for<br />
a ® nal concentration standard <strong>of</strong> 2 ppm per amide solution.<br />
Substrate Preparation. The surfaces were prepared<br />
by ® rst roughening 0.1 mm silver foil (99.9%, Aldrich)<br />
with 12 m m optical polishing paper. The largest enhancement<br />
was found when the silver foil was polished prior<br />
to etching; this procedure leads to a surface that appears<br />
homogeneous. The silver foil was then etched in a rapidly<br />
stirred 40% nitric acid solution for 10 to 20 s. The etched<br />
foil was rinsed ® rst in deionized water (Millipore, 18 V )<br />
followed by an ethanol rinse to remove traces <strong>of</strong> polishing<br />
material and any residual acid solution from the surface.<br />
The ethanol may also serve to reduce the silver sites<br />
(Ag 1 ) in preparation for the coating process. The SERS<br />
surface appears light gray in color after proper roughening<br />
and etching. A coated substrate was prepared by<br />
soaking the roughened/etched silver foil in the amide/<br />
PCTP solutions for 20 min. The coated substrates were<br />
removed from the amide solutions, rinsed with ethanol to<br />
wash <strong>of</strong>f excess unbound amide and PCTP, then air dried.<br />
<strong>Raman</strong> spectra <strong>of</strong> the amide coated substrates were obtained<br />
by cutting the silver foil substrates to ® t diagonally<br />
in a 10 mm glass cuvette.<br />
Instrumentation. A Spectra-Physics (Mountain View,<br />
CA) 2025 Kr 1 ion laser provided 647 nm light and was<br />
used to excite <strong>Raman</strong> scattering. The design <strong>of</strong> this system<br />
consists <strong>of</strong> the power supply, Kr 1 ion laser, spectrograph,<br />
charge-coupled device (CCD), and PC. The opticsbased<br />
<strong>Raman</strong> system consists <strong>of</strong> the following, all optimized<br />
for 647 nm excitation: a Kr 1 ion high-power excitation<br />
source (5±180 mW), beam steering and focusing<br />
optics with sample illumination provided by a 50 mm<br />
cylindrical lens (Melles Griot, Irvine, CA), a glass cuvette/sample<br />
holder, and optics for <strong>Raman</strong> scattering collection.<br />
Laser power was maintained between 5 and 30<br />
mW. Laser powers were measured at the sample, after the<br />
beam passed through an appropriate interference ® lter to<br />
remove plasma lines. The collection optics consisted <strong>of</strong><br />
an F1.8 Minolta camera lens and approximately 3:1 magni®<br />
cation for f-number matching with the f/5.4 mirrors <strong>of</strong><br />
the spectrograph. The excitation source and Rayleigh line<br />
are rejected with a holographic notch ® lter (Kaiser) designed<br />
for the speci® c excitation source. Spectra were<br />
collected with an HR320 (ISA) spectrograph with a 1200<br />
grooves/mm grating and a Photometrics CCD 9000 spectroscopic<br />
system for a TK512 CCD detector cooled to<br />
2 102 8 C. The spectrograph entrance slit was kept at 30<br />
m m and the grating was set from 695 to 717 nm for a<br />
spectral range <strong>of</strong> approximately 800 to 1650 cm 2 1 . Integration<br />
times varied between 5 and 30 s. The spectra were<br />
collected and stored with a PC workstation and analyzed<br />
by LABCALC (Galactic) and GRAMS/32 (Galactic) programs.<br />
A multipoint baseline correction and eleven-point<br />
Savitzky±Golay smoothing routine were employed for all<br />
spectra. Calibration curves were constructed with the use<br />
956 Volume 53, Number 8, 1999<br />
<strong>of</strong> an EXCEL (Micros<strong>of</strong>t) spreadsheet and GRAMS/32<br />
PLS-IQ.<br />
A <strong>Detection</strong> Limit, Inc. SOLUTION 633 <strong>Raman</strong> laser<br />
system provided 633 nm light and was also used to collect<br />
<strong>Raman</strong> data. This system is a portable <strong>Raman</strong> workstation<br />
that uses a ® ber-optic probe to excite and collect<br />
the <strong>Raman</strong> scattered light. The SOLUTION 633 system<br />
provided 25 mW <strong>of</strong> laser power at the sample and used<br />
a thermoelectric (TE) cooled CCD (2 10 8 C) for detection.<br />
The ® ber-optic designed system consists <strong>of</strong> the<br />
probe, HeNe laser, control unit, and compact PC. The epiillumination<br />
probe provided 1808 back-scattering. Excitation<br />
light enters the probe through a 50 m m silica ® ber.<br />
Folding mirrors are used for beam steering. A bandpass<br />
® lter removes plasma lines before the light reaches a dichroic<br />
beamsplitter that re¯ ects 633 nm light with 85%<br />
ef® ciency. The light is focused onto the sample by using<br />
a 6 mm focusing lens. Back-scattered light (l . 643 nm)<br />
is transmitted by the beamsplitter, through a long-pass<br />
® lter, and focused onto a collection ® ber. The control unit<br />
houses the power supply, a spectrograph with a 1200<br />
grooves/mm blazed ruled grating, and a Kodak 0400<br />
CCD detector. The spectral range observed was 500 to<br />
1800 cm 2 1 , and integration times <strong>of</strong> 1 to 30 s were used<br />
to collect spectra. The <strong>Raman</strong> data were automatically<br />
transferred to GRAMS/32 for storage and analysis. A<br />
multipoint baseline correction was employed for data<br />
analysis.<br />
RESULTS AND DISCUSSION<br />
We have demonstrated the quanti® cation <strong>of</strong> the phenylalkylamines<br />
amphetamine and methamphetamine, by<br />
derivatizing the amines with a reactive coating <strong>of</strong> 2-MNA<br />
by a DCC coupling reaction and by using SERS spectroscopy<br />
as a method <strong>of</strong> detection. The derivatized<br />
amines were isolated by solvent extraction with the use<br />
<strong>of</strong> either CH 2Cl 2 or diethyl ether. Reaction conditions<br />
were varied by using either an organic solvent or an aqueous<br />
alcohol solvent. The purpose <strong>of</strong> this was not only to<br />
eliminate the use <strong>of</strong> chlorinated solvents and to reduce<br />
amounts <strong>of</strong> waste solvent but also to reduce time-consuming<br />
steps by developing a reaction condition better<br />
matched to the sample. The advantages <strong>of</strong> using aqueous<br />
solvent conditions for the DCC coupling <strong>of</strong> amphetamine<br />
or methamphetamine with 2-MNA include a shorter reaction<br />
time, the solubility <strong>of</strong> the reactants, the elimination<br />
<strong>of</strong> chlorinated organic solvent, and the feasibility <strong>of</strong> carrying<br />
out the reaction in an aqueous biological matrix. It<br />
is necessary to use a separate SERS substrate for each<br />
concentration solution <strong>of</strong> either the AMNA or MMNA.<br />
Since the binding <strong>of</strong> the 2-MNA portion <strong>of</strong> the complex<br />
to the silver through both the thiol sulfur and the pyridine<br />
nitrogen is irreversible, it is not possible to wash the complex<br />
<strong>of</strong>f the substrate before sampling the next solution.<br />
Additionally, the use <strong>of</strong> an internal standard that is added<br />
to the amide solutions prevents the use <strong>of</strong> a single substrate<br />
for all measurements.<br />
The amide compounds were coated onto separate<br />
roughened/etched silver foil substrates and <strong>Raman</strong> spectra<br />
obtained. The compounds were qualitatively identi® ed<br />
by <strong>Raman</strong> bands corresponding to the amide molecule<br />
adduct. Quanti® cation <strong>of</strong> the compounds was accom-
FIG. 2. Overlaid SERS spectra for AMNA (a) and the mean-centered<br />
subtraction spectra for AMNA (b).<br />
plished by measuring the peak intensity <strong>of</strong> a <strong>Raman</strong> band<br />
<strong>of</strong> the amide molecule relative to the peak intensity <strong>of</strong> a<br />
<strong>Raman</strong> band <strong>of</strong> an internal standard and demonstrated<br />
with chemometrics. PCTP was added to solutions <strong>of</strong><br />
varying amide concentration as the internal standard for<br />
quanti® cation purposes. A <strong>Raman</strong> band associated with<br />
PCTP was used as the reference for the calibration curve<br />
<strong>of</strong> the peak intensity ratio as a function <strong>of</strong> concentration<br />
formed for each amide.<br />
Figure 2a shows the overlaid spectra for the compound<br />
AMNA co-coated with PCTP onto SERS substrates for<br />
the concentration range <strong>of</strong> 47.2 ppm to 472 ppm. The<br />
<strong>Raman</strong> bands indicated are attributed to the phenyl ring<br />
breathing mode (998 cm 2 1 ), 19 ±21 the pyridinyl ring breathing<br />
mode (1055 cm 2 1 ), 22 the asymmetric C±N±C stretch<br />
(1125 cm 2 1 ), 23 the phenyl±C stretch (1205 cm 2 1 ), 19 ±21 the<br />
pyridinyl±C stretch (1223 cm 2 1 ), 19,20 the amide C±N<br />
stretch (1389 cm 2 1 ), 2 4 and the ring stretch (1569<br />
cm 2 1 ). 19±21 Also shown (Fig. 2b) are the mean-centered<br />
FIG. 3. Overlaid SERS spectra for MMNA (a) and the mean-centered<br />
subtraction spectra for MMNA (b).<br />
subtraction spectra for AMNA. The spectra were averaged<br />
and the mean spectrum subtracted from the original<br />
spectrum for the concentration range <strong>of</strong> 47.2 to 472 ppm.<br />
This ® gure highlights the analytical response <strong>of</strong> the SERS<br />
substrate from high to low concentration.<br />
An overlay <strong>of</strong> the SERS spectra for the compound<br />
MMNA co-coated with PCTP onto SERS substrates is<br />
shown in Fig. 3a. The concentration range <strong>of</strong> the amide<br />
is 60.9 to 2435 ppm. The <strong>Raman</strong> bands <strong>of</strong> interest include<br />
the phenyl ring breathing mode (1000 cm 2 1 ), 19 ±21 the pyridinyl<br />
ring breathing mode (1058 cm 2 1 ), 22 the asymmetric<br />
C±N±C stretch (1126 cm 2 1 ), 23 the pyridinyl±C stretch<br />
(1219 cm 2 1 ), 19,20 the amide C±N stretch (1389 cm 2 1 ), 24<br />
and the ring stretch (1572 cm 2 1 ). 19 ±21 Figure 3b is an overlay<br />
<strong>of</strong> the mean-centered subtraction spectra for MMNA.<br />
A relatively strong band at 1514 cm 2 1 may be noted in<br />
the spectra <strong>of</strong> both amide compounds and corresponds to<br />
the ring stretch <strong>of</strong> PCTP. 25 Also noted, in the spectra for<br />
MMNA, is a strong <strong>Raman</strong> band at 1047 cm 2 1 that is<br />
APPLIED SPECTROSCOPY 957
FIG. 4. Calibration curve formed by plotting the peak intensity ratio<br />
(I 998/I 1514) as a function <strong>of</strong> AMNA concentration (ppm).<br />
attributed to residual nitrate 26 on the silver foil surface as<br />
a consequence <strong>of</strong> the etching process. This band was<br />
eliminated in subsequent experiments by a more thorough<br />
rinsing <strong>of</strong> the etched silver foil prior to surface coating.<br />
Peak intensities <strong>of</strong> the 998 and 1000 cm 2 1 <strong>Raman</strong><br />
bands <strong>of</strong> the AMNA and MMNA amide compounds, respectively,<br />
were measured relative to the peak intensity<br />
<strong>of</strong> the 1514 cm 2 1 band <strong>of</strong> PCTP. The peak intensity ratios<br />
I 998/I 1514 and I 1000/I 1514 were plotted as a function <strong>of</strong> concentration<br />
<strong>of</strong> the respective amide (Figs. 4 and 5). Average<br />
detection limits (DLs) <strong>of</strong> 19 ppm for AMNA and<br />
17 ppm for MMNA were determined. <strong>Detection</strong> limits<br />
were calculated by using the point at which the analyte<br />
peak is three times the noise level <strong>of</strong> the background.<br />
The error bars in Figs. 4 and 5 represent the spectroscopic<br />
noise expected from the measurement. The variation<br />
around the best-® t line indicates that the precision <strong>of</strong> this<br />
method is not limited by the instrument, but rather by the<br />
reproducibility <strong>of</strong> the SERS substrates.<br />
We have also demonstrated the use <strong>of</strong> chemometrics<br />
for quantitation. 27 Figure 6 illustrates development <strong>of</strong> a<br />
partial least-squares (PLS) model for AMNA. Prior to<br />
developing the model, we normalized the spectra by using<br />
the PCTP peak. Figure 6a shows the standard error<br />
<strong>of</strong> calibration as a function <strong>of</strong> the numbers <strong>of</strong> factors<br />
used. In this case, one factor produced the lowest error.<br />
Figure 6b shows the results <strong>of</strong> a cross-validation plotted<br />
as predicted vs. actual concentration. The R 2 <strong>of</strong> 0.987<br />
shows excellent correlation. Figure 6c shows the matrix<br />
representing the ® rst factor; comparison with Fig. 2a<br />
shows that this factor contains most <strong>of</strong> the spectral in-<br />
FIG. 5. Calibration curve formed by plotting the peak intensity ratio<br />
(I 1000/I 1514) as a function <strong>of</strong> MMNA concentration (ppm).<br />
958 Volume 53, Number 8, 1999<br />
FIG. 6. PLS quantitation <strong>of</strong> AMNA data: (a) calibration <strong>of</strong> standard<br />
error, (b) cross-validation plot, and (c) ® rst factor matrix.<br />
formation. Using this method we found a DL <strong>of</strong> 18.4<br />
ppm, which corresponds well with the 19 ppm value we<br />
obtained by using a simple ratio. The utility <strong>of</strong> using PLS<br />
is that it is easily automated and can solve for more than<br />
one component.<br />
CONCLUSION<br />
This work represents an extension <strong>of</strong> the use <strong>of</strong> speci® c<br />
surface coatings in SERS detection <strong>of</strong> illicit drugs. We<br />
developed a procedure for the derivatization <strong>of</strong> amphetamine<br />
and methamphetamine with 2-mercaptonicotinic<br />
acid to form the amide compounds N-(1-methyl-2-phenylethyl)-2-m<br />
ercaptopyridine-3-carboxam ide (AMNA)<br />
and N-methyl-N-(1-methyl-2-phenylethyl)-2-mercaptopyridine-3-carboxam<br />
ide (M MNA ). The derivatized<br />
amines can be identi® ed and quanti® ed from SERS spectra.<br />
The appearance <strong>of</strong> the C±N stretch <strong>of</strong> the amide is<br />
evidence <strong>of</strong> the new compounds.<br />
The DCC coupling reaction employed in this procedure<br />
is selective for primary and secondary amines; thus,<br />
alkaloids such as morphine, cocaine, and their respective<br />
derivatives would not form an amide bond with 2-MNA.<br />
ACKNOWLEDGMENTS<br />
The authors would like to acknowledge support from <strong>Detection</strong> Limit,<br />
Inc. through a subcontract to the University <strong>of</strong> Wyoming from HHS<br />
STTR Grant Number 1R41DA10670-01.<br />
1. R. G. Schlaadt and P. T. Shannon, Drugs <strong>of</strong> Choice (Prentice-Hall,<br />
Englewood Cliffs, New Jersey, 1986), 2nd ed.
2. J. E. Wallace, J. D. Biggs, and S. L. Ladd, Anal. Chem. 40, 2207<br />
(1968).<br />
3. J. Monforte, R. J. Bath, and I. Sunshine, Clin. Chem. 18, 1329<br />
(1972).<br />
4. (a) D. B. Campbell, J. Pharm. Pharmacol. 21, 129 (1969); (b) D.<br />
B. Campbell, J. Chromatogr. 49, 442 (1970).<br />
5. J. S. Noonan, P. W. Murdick, and R. S. Ray, J. Pharmacol. Exp.<br />
Ther. 168, 205 (1970).<br />
6. R. D. Budd and W. J. Leung, J. Chromatogr. 179, 355 (1979).<br />
7. R. B. Bruce and W. R. Maynard, Jr., Anal. Chem. 41, 977 (1969).<br />
8. J. F. Bowyer, P. Clausing, and G. D. Newport, J. Chromatogr. 666,<br />
214 (1995).<br />
9. C. Molins Legua, P. Campins Falco, and A. Sevillano Cabeza, Fresenius’<br />
J. Anal. Chem. 349, 311 (1994).<br />
10. P. Campins Falco, F. Bosch Reig, A. Sevillano Cabeza, and C. Molins<br />
Legua, Anal. Chim. Acta. 287, 41 (1994).<br />
11. P. Campins Falco, C. Molins Legua, R. Herraez Hernandez, and A.<br />
Sevillano Cabeza, J. Chromatogr. 663, 235 (1995).<br />
12. C. Molins Legua, P. Campins Falco, and A. Sevillano Cabeza, J.<br />
Chromatogr. 672, 81 (1995).<br />
13. K. Mullen and K. Carron, Anal. Chem. 66, 478 (1994).<br />
14. K. Mullen, D. Wang, L. Crane, and K. Carron, Anal. Chem. 64,<br />
930 (1992).<br />
15. J. Sheenan and C. Hess, J. Am. Chem. Soc. 77, 1067 (1955).<br />
16. A. Hassner and V. Alexanian, Tetrahedron Lett. 46, 4475 (1978).<br />
17. J. B. Heyns, L. M. Sears, R. C. Corcoran, and K. T. Carron, Anal.<br />
Chem. 66, 1572 (1994).<br />
18. D. Stern, L. Laguren-Davidson, D. Frank, J. Gui, C. Lin, F. Lu, G.<br />
Salaita, N. Walton, D. Zapien, and A. Hubbard, J. Am. Chem. Soc.<br />
111, 877 (1989).<br />
19. F. R. Dollish, W. G. Fateley, and F. F. Bentley, Characteristic <strong>Raman</strong><br />
Frequencies <strong>of</strong> Organic Compounds (John Wiley and Sons,<br />
New York, 1974).<br />
20. D. Lin-Vien, N. B. Colthup, W. G. Fateley, and J. G. Grasselli, The<br />
Handbook <strong>of</strong> Infrared and <strong>Raman</strong> Characteristic Frequencies <strong>of</strong><br />
Organic Molecules (Academ ic Press, Boston, 1991).<br />
21. (a) G. Varsanyi, Proc. 4th Intern. Meeting. Mol. Spectrom. 2, 939<br />
(1959); (b) G. Varsanyi, Vibrational Spectra <strong>of</strong> Benzene Derivatives<br />
(Academic Press, New York, 1969); (c) A. M. Bogomolov, Opt.<br />
Spektrosk. 9, 311 (1960); (d) A. M. Bogomolov, Opt. Spektrosk.<br />
10, 322 (1961).<br />
22. J. Green, D. Harrison, W. Kynaston, and H. Paisley, Spectrochim.<br />
Acta, Part A 26, 2139 (1970).<br />
23. G. Dellepiane and G. Zerbi, J. Chem. Phys. 48, 3573 (1968).<br />
24. T. Miyazawa, T. Shimanouchi, and S. Mizushima, J. Chem. Phys.<br />
24, 408 (1956).<br />
25. J. R. Nielsen and H. D. Brandt, J. Mol. Spectrosc. 17, 334 (1965).<br />
26. (a) A. J. Wells and E. B. Wilson, J. Chem. Phys. 9, 314 (1941);<br />
(b) J. P. Mathieu and D. Massignon, Ann. Phys. 16, 5 (1941); (c)<br />
D. C. Smith, C. Pan, and J. R. Nielsen, J. Chem. Phys. 18, 706<br />
(1950).<br />
27. (a) D. M. Haaland and E. V. Thomas, Anal. Chem. 60, 1193 (1988);<br />
(b) D. M. Haaland and E. V. Thomas, Anal. Chem. 60, 1202 (1988).<br />
APPLIED SPECTROSCOPY 959