SLAC-PUB-1706 - SLAC - Stanford University
SLAC-PUB-1706 - SLAC - Stanford University
SLAC-PUB-1706 - SLAC - Stanford University

You also want an ePaper? Increase the reach of your titles
YUMPU automatically turns print PDFs into web optimized ePapers that Google loves.
THE TOTAL HADRON CROSS SECTION, NEW PARTICLES, AND<br />
MUON ELECTRON EVENTS IN e+e- ANNIHILATION AT SPEAR*<br />
B . Richter t<br />
<strong>Stanford</strong> Linear Accelerator Center<br />
<strong>Stanford</strong> <strong>University</strong>, <strong>Stanford</strong>, California 94305<br />
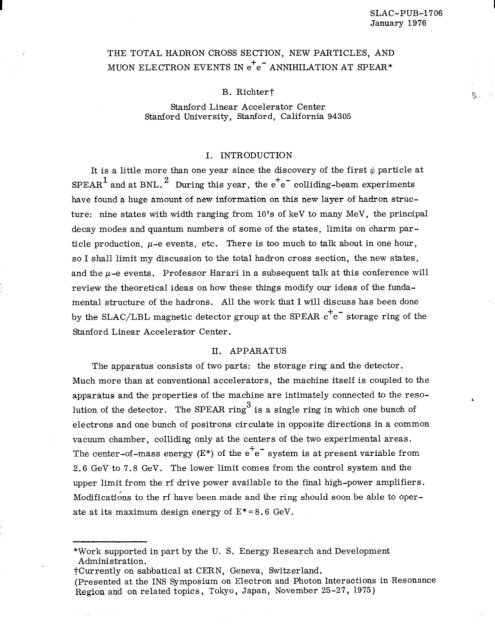
I. INTRODUCTION<br />
<strong>SLAC</strong>-<strong>PUB</strong>-<strong>1706</strong><br />
January 1976<br />
It is a little more than one year since the discovery of the first # particle at<br />
SPEAR’ and at BNL. 2 During this year, the e’e- colliding-beam experiments<br />
have found a huge amount of new information on this new layer of hadron struc-<br />
ture: nine states with width ranging from 10’s of keV to many MeV, the principal<br />
decay modes and quantum numbers of some of the states, limits on charm par-<br />
ticle production, p-e events, etc. There is too much to talk about in one hour,<br />
so I shall limit my discussion to the total hadron cross section, the new states,<br />
and the p-e events. Professor Harari in a subsequent talk at this conference will<br />
review the theoretical ideas on how these things modify our ideas of the funda-<br />
mental structure of the hadrons. All the work that I will discuss has been done<br />
by the <strong>SLAC</strong>/LBL magnetic detector group at the SPEAR e+e- storage ring of the<br />
<strong>Stanford</strong> Linear Accelerator Center.<br />
II. APPARATUS<br />
The apparatus consists of two parts: the storage-ring and the detector.<br />
Much more than at conventional accelerators, the machine itself is coupled to the<br />
apparatus and the properties of the machine are intimately connected to the reso-<br />
lution of the detector. The SPEAR ring3 is a single ring in which one bunch of<br />
electrons and one bunch of positrons circulate in opposite directions in a common<br />
vacuum chamber, colliding only at the centers of the two experimental areas.<br />
The center-of-mass energy (E*) of the e+e- system is at present variable from<br />
2.6 GeV to 7.8 GeV. The lower limit comes from the control system and the<br />
upper limit from the rf drive power available to the final high-power amplifiers.<br />
Modifications to the rf have been made and the ring should soon be able to oper-<br />
ate at its maximum design energy of E* = 8.6 GeV.<br />
*Work supported in part by the U. S. Energy Research and Development<br />
Administration.<br />
j-currently on sabbatical at CERN, Geneva, Switzerland.<br />
(Presented at the INS Symposium on Electron and Photon Interactions in Resonance<br />
Region and on related topics, Tokyo, Japan, November 25-27, 1975)
-2-<br />
The electron and positron bunches in the ring are quite small, having a size<br />
(gaussian standard deviation in x, y, z) of about 0.1 cmx0.01 cmx5 cm. The<br />
short bunch length gives about an 0.2 nsec collision time, providing a well-<br />
defined start signal for time-of-flight particle identification systems. The energy<br />
spread in the beams is proportional to the beam energy with a(E*) = 0.8 MeV at<br />
3 Gev.<br />
An exploded view of the <strong>SLAC</strong>/LBL magnetic detector is shown in Fig. 1. It<br />
is a large solenoid magnet with a coil about 3 meters in diameter and about 3 m<br />
long. The coil is coaxial with the beam direction, and the e+e- collision point is<br />
at the center of the magnet. The magnetic field is about 4 kilogauss.<br />
Figure 2 is a view along the axis of the solenoid at the center of the coil,<br />
The beam direction is perpendicular to the plane of the figure. A particle pro-<br />
duced in an e’e- interaction would encounter as it travelled out from the collision<br />
point the 0.15 mm stainless steel vacuum chamber; 2-8 mm thick cylindrical<br />
scintillation counters ; two cylindrical proportional chambers (not shown in the<br />
figure); 4 cylindrical magnetostrictive spark chambers, each with 4 planes having<br />
wires at *2’ and &4’ with respect to the field direction; one of 48 2.5 cm thick<br />
scintillators used in the trigger system and in a time-of-flight system for particle<br />
identification; the one-radiation-length thick aluminum magnet coil; one of 24 Pb-<br />
scintillator shower counters used for electron and photon identification; the 20<br />
cm thick steel return yoke of the magnet; and finally 2 layers of magnetostrictive<br />
spark chambers used for muon identification.<br />
The momentum resolution for a charged particle is about 2% x P (GeV/c) at<br />
9o”. The trigger solid angle is about 0.65 x 4~ (50’ < 0 < 1300), while the solid<br />
angle over which particles can be tracked is somewhat larger (0.75 x 4~). The<br />
trigger requires ~2 charged particles in the trigger solid angle.<br />
The time-of-flight system is capable of separating z from K (3~) up to about<br />
600 MeV/c, and K from p up to about 1.1 GeV/c. The shower counters have a<br />
fractional energy resolution for electrons or photons of about 25% (u) at 1 GeV.<br />
The apparatus is large and so is the group which built it and has done these<br />
experiments. The group is a collaboration of <strong>SLAC</strong> and LBL physicists who have<br />
all worked hard on different facets of the apparatus and the analysis. Their<br />
names are listed in Ref. 4.<br />
. III. TOTAL CROSS SECTION<br />
Electron-positron annihilation takes place in the state with the quantum num-<br />
bers of one photon, 3% 1--, strangeness, baryon nurnber and charge all equal
-3-<br />
to zero. Any particle coupled to the photon with these quantum numbers can be<br />
observed as an enhancement in the total annihilation cross section when the en-<br />
ergy in the e+e- system equals the mass of the state. The state is detected, of<br />
course, by observing its decay products.<br />
Figure 3 shows the total observed hadron prodnction cross section as a<br />
function of energy. The only features that stand out when the data are plotted on<br />
this scale are enormous peaks at the mass of the q(3.1) $(3.1) E $ and $(3.7)<br />
G(3.7) = $1 which were discovered last November. The peak cross section<br />
observed is not the true peak cross section for the 9 and $* have widths much<br />
narrower than the energy spread of the e’e- system:<br />
Equation (1) gives the rough relation between the observed and true peak heights<br />
for a resonance with a width lYR which is much narrower than the energy spread<br />
aEy in the beams. For the + , for example, lYR is about 70 keV while my is<br />
about 2 MeV.<br />
We have now completed a search for other narrow resonances over almost<br />
all of the mass region accessible to SPEAR.5 The technique used is to slowly<br />
sweep the energy of the ring and look for enhancements in the yield of hadrons.<br />
In practice, the ring energy is held constant for a minute or two while data are<br />
taken. The e+ and e- beam energies are then increased by about 1 MeV each,<br />
and data are taken again for one-two minutes, etc. The data are analyzed by the<br />
<strong>SLAC</strong> 370/168 computer system in real time and the cross section for one step<br />
is sent back to us while the machine is being changed to the next step. This<br />
technique is most sensitive to narrow resonances.<br />
Figure 4 shows the result of the scan from the $ mass to 7.7 GeV. The only<br />
statistically significant structure seen is the 9’ at 3.7 GeV (this technique was<br />
used to find the $‘). The sensitivity of the scan depends on the width of a reso-<br />
nance and on its mass for the energy spread in the electron-positron system<br />
depends on the beam energy. The limit on the area of a resonance less than about<br />
10 MeV wide (90% confidence) is given as a function of the resonance mass in<br />
Table I. (For comparison, the area under the $ is about lo4 nb-MeV). These<br />
limits increase as the width increases above 10 MeV and other techniques are<br />
better used to search for states wider than about 20-30 MeV. As we shall see,<br />
states of width 30-60 MeV exist with areas less than the limits of Table I, and<br />
this search will therefore have to be redone with increased sensitivity.
-4-<br />
Table I<br />
Results of the search for narrow resonances. Upper limits<br />
(90% confidence level) for the radiatively corrected integrated<br />
cross section of a possible narrow resonance. The width of<br />
this resonance is assumed to be small compared to the mass<br />
resolution.<br />
Mass Range Limit on J ‘aH dEc m<br />
WV) (nb MeV) ’ ’<br />
3.20 - 3.50 970<br />
3.50 --c 3.69 780<br />
3.72 - 4.00 850<br />
4.00 -, 4.40 620<br />
4.40 -4.90 580<br />
4.90 -, 5.40 780<br />
5.40 -5.90 800<br />
5.90 - 7.60 450<br />
Figure 5 shows the total cross section for hadron production excluding the<br />
es 9 and after radiative corrections. The errors shown are statistical with<br />
about a 10% systematic uncertainty added in quadrature. In addition, there is an<br />
overall normalization uncertainty of about 10% and there can be a further smooth<br />
variation in the relative cross sections from the lowest to the highest energy of<br />
about 15% (from slow model dependent changes in the detection efficiency). The<br />
cross section, except for the region around 4 GeV, shows a smooth decrease<br />
from about 30 nb at 3 GeV to about 7.5 nb at 7.8 GeV. The region around 4 GeV<br />
shows a complex structure.<br />
The more familiar ratio (R) of the total hadron cross section to the p-pair<br />
production cross section is shown in Fig. 6. The ratio R shows two plateau<br />
region: one where R N, 2.5 below 3.8 GeV, and the second above 5 GeV where<br />
R M 5.2. In the region around 4 GeV there is a complex structure with multiple<br />
peaks which is undoubtedly related somehow to the transition between the two<br />
plateau levels.<br />
This transition region is shown in more detail in Fig. 7. The open circles<br />
are our previously published data, 6 while the black points are more recent data<br />
(as of the Lepton-Photon Conference in August 1975). The new data give quite a<br />
different impression from the old. What was a single broad resonance at 4.15<br />
GeV now seems to have a narrower companion at 4.4 GeV and shows signs of<br />
more structure at 3.95 GeV.<br />
L :
-5 -<br />
We have taken further data in this region recently, and the results are<br />
shown on a more expanded scale in Fig. 8. What might have been a statistical<br />
fluctuation at 3.95 GeV before is now clearly seen to be some kind of a state, and<br />
the 4.4 GeV resonance is confirmed. There may be still more structure in this<br />
region, and considerably more data will be required to settle the question. We will<br />
try to have the answer in the next three to four months.<br />
The widths and areas of the states in this region are very difficult to obtain<br />
quantitatively. There are three reasons for the difficulty. First, all of this<br />
rapid cross section variation is taking place in a single angular momentum chan-<br />
nel, the PC = l-- state. The resonances may interfere with each other. Second,<br />
the transition between the low energy and high energy plateau regions indicates<br />
that new channels are opening in this region. It is well known that threshold<br />
effects can badly distort the shape of a classical Breit-Wigner line. Third, the<br />
shape of llbackgroundY1 in the transition region is not well known. The separation<br />
of the cross section into ‘lbackground” and “resonance” contributions is difficult,<br />
and line shapes can be further complicated by interference with the background.<br />
The masses, widths, areas, and couplings to the e+e- systems are sum-*-<br />
marized in Table II.<br />
Table II<br />
Summary of the masses, widths, areas, and couplings to<br />
the e+e- systems.<br />
Mass<br />
WV)<br />
3.1<br />
3.7<br />
3.95<br />
4.1<br />
4.4<br />
r tot<br />
WeV<br />
0.069<br />
0.225<br />
60.<br />
200<br />
40<br />
u dE* J<br />
re+e-<br />
(nb-GeV) WV)<br />
10.4 4.8<br />
3.7 2.2<br />
0.35 0.2<br />
2.5 1.8<br />
0.25 0.2<br />
The properties of $ and z+!J’ are well determined, but the widths and areas of the<br />
other three states are uncertain by 50%. In particular, I have assumed that the<br />
4.1 GeV region is a single state, which is by no means sure.<br />
In the next few months, we will go over this region with smaller energy steps<br />
and better statistics to determine if still more states exist. A study of Fig. 5 will<br />
convince you that there is no large energy span sufficiently well mapped to exclude<br />
either more 20-50 MeV wide states like the 4.4 or even more small, very narrow<br />
ones.
-6-<br />
IV. OTHER NEW STATES<br />
In addition to the Jq I-- states described above, at least four other states,<br />
all with C=+l, have been found in decays via one-photon emission from the q(3.7)<br />
or +(3.1). Three of these states with masses between + and Qt have been seen at<br />
SPEAR by the <strong>SLAC</strong>/LBL group. 793 One of these three states has also been seen<br />
by the DASP group, 9 and in addition another state slightly below the mass of the<br />
# has been found by the DASP group and the DESY-Heidelberg group. lo In this<br />
section I shall review the evidence of the <strong>SLAC</strong>/LBL group and summarize our<br />
knowledge of the number, widths, quantum numbers, and decay modes of these<br />
states.<br />
The first published attempt to observe monochromatic y-ray lines emitted in<br />
qt decay to other possible narrow states was by the Hofstadter groupll working<br />
at SPEAR. Using large NaI crystals, they set an upper limit of about 5% on the<br />
branching fraction of the $1 to a y-ray and a narrow state. The <strong>SLAC</strong>/LBL group<br />
and the DASP group looked not only for the y-ray lines but also for the decay<br />
products of the intermediate state, which allows a more sensitive search. Data<br />
on the first state were presented by DASP, who named it PC. The <strong>SLAC</strong>/LBL<br />
group has published the results of our work on this state, which has a higher<br />
statistical accuracy. Our experiment studies the decay<br />
e+ + e- -p++/J-+x ;<br />
where the energy of the e+e- system is equal to the #’ mass. The II-meson mo-<br />
menta are measured in the magnetic detector and the invariant mass of the p’p-<br />
system is determined. A large fraction of the dimuons have the mass of the $<br />
and these events include such decay modes as<br />
A typical ,u+p- mass distribution is shown in Fig. 9.<br />
+’<br />
-7r 77<br />
+ 3 Pa)<br />
00<br />
-T 7r 2) (3b)<br />
---772cI (3c)<br />
-Yw (3d)<br />
We look for the decay mode (3d) by three different methods. In the first,<br />
both y-rays are detected using the shower counters in the magnetic detectors.<br />
This proves the existence of the decay mode but does not have very good mass<br />
resolution. Also, the efficiency calculations are sufficiently complicated that it<br />
is difficult to determine an accurate branching fraction. In the second method,
-7-<br />
an e+e- pair is detected coming from the conversion of one of the two -y-rays in<br />
the beam pipe or the first trigger counters. This gives a very good energy reso-<br />
lution and hence a more accurate mass of the intermediate state. The statistical<br />
accuracy is low, however. In the third method, no y-ray is detected. The mis-<br />
sing mass distribution recoiling against the dimuon system is measured and cor-<br />
rected for processes such as those in Eq. (3b) and (3~). This method gives the<br />
best branching fraction.<br />
In the first method, the y-rays are detected by the shower counters that lie<br />
in a circle of -1.8-meter radius just outside the aluminum coil of the magnet.<br />
The y-ray position in the counter is determined to an accuracy of 20 cm (cr)<br />
from the relative pulse heights measured at each end of the counter and the known<br />
optical attenuation length along the counter. From the measurement of the p mo-<br />
mentum and the y-ray directions, a 2C fit can be made. Figure 10 shows the<br />
resulting mass distributions of the ~lr/ system. Two solutions exist for each<br />
event, for one does not know a priori which y-ray comes from the decay of the<br />
intermediate state. The two peaks in the graph come from this ambiguity and do<br />
not indicate the existence of two states. The solid curve shows the distribution<br />
expected from a single narrow state with a mass of roughly 3.5 or 3.27 GeV.<br />
The dotted curve shows the expected contribution from the 27r” decay mode of the<br />
z,9’ to the Z/J where only two of the four y-rays from T’ decay are detected. The<br />
dashed curve shows the expected mass distribution if two photons are emitted by<br />
the z$’ distributed according to invariant phase space with no narrow state present.<br />
Figure 10 demonstrates the existence of at least one state with a mass of<br />
3.5 or 3.27 GeV. The width is consistent with the resolution, which for this<br />
method is about 80 MeV full-width half-maximum (FWHM). If a state exists at<br />
3.4 GeV, it does not show up strongly in this decay mode.<br />
Figure 11 shows the y$ mass when one of the two y-rays converts in the beam<br />
pipe or first counter. The resolution is much improved (30 MeV FWHM). The<br />
events cluster around a mass of 3.5 or 3.28 GeV.<br />
Figure 12 shows the missing mass spectrum recoiling against the z/ (unshaded).<br />
The shaded region shows the distribution after subtracting half of the acceptance-<br />
corrected mass distribution from the reaction (3a). This removes the ?r” contri-<br />
bution to the spectrum from (3b) for the $’ has I spin= 0. This can be done accur-<br />
ately for the dimuon acceptance of the reactions (3a) and (3b) are identical. The<br />
dashed line in the figure shows the contribution of the direct radiative p-pair
production<br />
-8-<br />
e+e-- -PSI-l-Y l<br />
The peak at -0.3 GeV2 is from the decay<br />
$‘-q$ * (3c)<br />
After subtracting 2n0 contribution, the radiative contribution, and cutting out the<br />
region of the -q , we find<br />
l)’ -YP c PC++<br />
Zc, 4 all ’ P --L all<br />
c<br />
=3.6f0.7% .<br />
Since the Hofstadter group limit on single y-rays in this energy region is 5%, this<br />
state must decay principally to y$.<br />
We have also observed states with masses between those of the $’ and the $<br />
by observing the hadronic decay modes of these intermediate states as follows:<br />
1 X-<br />
r +-+- 7r7rlT7r<br />
1 -i- -+-+- 7r717T7rTr7f<br />
T+ ,-K+K-<br />
1 1;‘~~ and/or K’K-<br />
The one-constraint fitted mass distributions of the hadronic systems of reaction<br />
(6) are shown in Fig. 13. The shaded regions show those events consistent with<br />
the direct decay of the +’ into charged particles with no y-ray (4-constraint fits).<br />
The 4-pion mass distribution of Fig. 13a shows two distinct peaks, one at 3.41<br />
GeV with the FWHM of -20 MeV, consistent with our resolution, and the other<br />
at 3.53 GeV, with the FWHM of -60 MeV, which is considerably broader than our<br />
resolution. The peaks in the 6-pion and nnKK mass distributions tend to confirm<br />
the 4-pion results. There are insufficient data in these channels to prove inde-<br />
pendently the existence of two states.<br />
The 71~ or KK distribution of Fig. 13d shows only one peak at a mass of 3.41<br />
GeV corresponding to the lower of the two peaks in the 4-pion distribution. Be-<br />
cause of this decay mode, this state must have natural spin-parity as<br />
.<br />
well as<br />
even charge conjugation, i. e. , J PC&-+ , 2*, . . . Table III gives our measure-<br />
ments of the production branching fractions of the intermediate states for decay<br />
by a particular mode. Each of these branching fractions is the product of the<br />
(4)<br />
(6)
-9-<br />
Table III<br />
Branching fractions in % for various decay modes of the intermediate<br />
states x and PC.<br />
Decay mode x(3410) x(35 30) pC<br />
47r* 0.14 * 0.07 0.2i: 0.1 ?<br />
67r” -0.1 -0.2 ?<br />
7;rn-K+K- -0.07 -0.05 ?<br />
T+T- or K+K- 0.13 le 0.05 < 0.027
- 10 -<br />
of these states are consistent with those expected for the bound states of two<br />
heavy fermions. There may be some problems for the Charm-Quark model with<br />
the high-mass l-- states as far as their widths are concerned, and there will be<br />
serious problems if the 4.1 GeV state is split into further substates. The most<br />
serious problem with the Charm-Quark model is the lack of success so far of the<br />
experiments that are specifically hunting for charmed mesons 12 or baryons .<br />
Given the amount of effort now going into this search, such particles should be<br />
found within a year, if they exist at all.<br />
V. 12-e EVENTS<br />
As you have all heard by now, the <strong>SLAC</strong>/LBL group has found what we call<br />
l*anomalous p-e event@ in the data we have taken at SPEAR. Our first results<br />
have been published, 13 and a more detailed review of these data by M. Per1 will<br />
be published shortly in the proceedings of the 1975 <strong>SLAC</strong> Summer Institute on<br />
Particle Physics. There are many possibilities for the origin of these events.<br />
All of the hypotheses have in common the production of a pair of particles, each<br />
with an additive conserved quantum number which is zero for the e+e- system.<br />
Examples are the production and decay of a pair of new heavy leptons or perhaps<br />
of a boson pair with a quantum number such as Charm. Before speculating fur-<br />
ther on the origin of these events, I shall review the event selection criteria and<br />
the methods of data analysis.<br />
We have 86 such events (as of September, 1975)) of which about 25% are<br />
background. All these events are selected from the sample of data which has<br />
only two charged particles visible in the detector with any number of neutrals<br />
visible in the detector shower counters, and with any number of charged particles<br />
or neutrals escaping out of the ends of the detector. The largest single data sam-<br />
ple is that at E* =4.8 GeV, and I shall use this sample to illustrate the analysis<br />
procedure.<br />
The 4.8 GeV data set contains 9500 events with ~3 visible prongs and some<br />
25,000 2-prong events. Of these 2-prong events, about 20,000 are Bhabha scat-<br />
terings and around 1500 are quantum-electrodynamic p-pair production. In most<br />
Bhabha scattering and p-pair production, the planes defined by each final state<br />
particle and the beam direction are coincident, i. e. , the events are coplanar.<br />
Radiative corrections can make these events a-coplanar, but the cross section<br />
decreases rapidly with increasing coplanarity angle. To eliminate most Bhabha<br />
and p-pair events, we require 2-prong events to have a coplanarity angle ~20’.<br />
This cut leaves about 2500 of the original 25,000 events.<br />
L
- 11 -<br />
The sample is further reduced by momentum cuts and certain geometric<br />
restrictions. A p-meson must have a minimum momentum of 590 MeV/c to<br />
reach the muon chambers. Since we do not want to be at the edge of the range<br />
cutoff, we require all p-candidate prongs to have p > 650 MeV/c. In addition, at<br />
low momentum the shower counters are not very effective in discriminating be-<br />
tween electron and hadrons. For simplicity we require the e-candidates also to<br />
have ~2650 MeV/c. We also make certain geometric cuts requiring candidate<br />
events to have both tracks within the central 90% of the shower counters and to<br />
be aimed toward the efficient area of the muon chambers. All these cuts reduce<br />
the sample of 2-prong events to 5 13.<br />
These events are listed in Table IV. The events are classified there accord-<br />
ing to total charge, the number of associated photons (shower counters hit other<br />
Table IV<br />
2-prong events at Ecm =4.8. pI and p2 2.65 GeV, Q > 2o”.<br />
coplanar -<br />
Total Charge 0 Total Charge 2<br />
Extra Shower Counter Extra Shower Counter<br />
0 1 22 0 1 22<br />
ee 40 111 55 0 1 0<br />
ep 24 8 8 o- 0 3<br />
P/J 16 15 6 0 0 0<br />
eh 20 21 32 2 3 3<br />
Ph 17 14 31 4 0 5<br />
hh 14 10 30 10 4 6<br />
than the two hit by charged particles), and the computer particle classification:<br />
e, /J, or hadron (h). The ep events in Column 1 stand out as having a pattern<br />
different from the other types of events. These ep events can not come from 2-<br />
photon processes:<br />
e+e- - e+e-p+p- . (7)<br />
for this process should yield the same numbers of ep events with charge-0 and<br />
with charge-2.<br />
We now need to evaluate the background expected in the ep column from<br />
various kinds of particle misidentification. We have determined the hadron mis-<br />
identification probabilities from a study of the multiprong events, and lepton<br />
L
- 12 -<br />
misidentification probabilities from the study of a large number of coplanar<br />
Bhabha and p-pair events. In determining the hadron misidentification proba-<br />
bilities, we assume that all tracks in the 2 3 prong events are in fact hadrons.<br />
If there are real p’s and e’s in this<br />
sample (not from ordinary hadron<br />
decay) we are overestimating the<br />
Table V<br />
Particle misidentification probabilities.<br />
misidentification probability and P (h - e) 0.18 f 0.01<br />
compute a larger background than<br />
is in fact present. In determining<br />
these probabilities we weight the<br />
momentum distribution of the<br />
P (h - l-0<br />
P (e - 9<br />
P (e - Lo<br />
PGrt - h)<br />
P (f~ - e)<br />
0.20 f 0.01<br />
0.056 i 0.010<br />
0.011 * 0.002<br />
0.08 f 0.01<br />
2 extra photons, 8.6 rt 2.0 background ( 8 events seen).<br />
The calculated background agrees with the number of pe events seen with 2 1<br />
photon, but is very much smaller than the number of events seen with zero pho-<br />
tons. There is clearly an anomalous pe signal.<br />
The background can also be evaluated with less statistical accuracy using<br />
only the events of Column 1 of Table IV. This method gives 7.9 rt 3 background<br />
events, still leaving the anomalous ep signal.<br />
There is one further background check, which is more qualitative than quan-<br />
titative. In the +I decay, we have about 75,000 events involving hadronic decays<br />
other than to the z,6. Because of the large cross section of the $1, these events<br />
were obtained in a relatively small integrated luminosity. The number of ep<br />
events found in this sample is consistent with the background calculated as<br />
described above. If there were some subtle background effect in multihadron<br />
events, one might expect it to show up in this very large sample of hadronic<br />
decays.<br />
Data at all energies are treated as described above for 4.8 GeV. The re-<br />
sulting cross section is shown in Fig. 15. The observed cross section is plotted<br />
with no corrections for geometric acceptance or for the kinematic cuts made.<br />
These corrections cannot be determined without a knowledge of the origin of the<br />
events.
.-<br />
- 13 -<br />
We can examine various angular and momentum correlations and distribu-<br />
tions to seek further clues to the origin of these events. The simplest such cor-<br />
relation is the invariant mass of the ep system vs the missing mass recoiling<br />
-<br />
against the system. This is shown for the 4.8 GeV data in Fig. 16. We can see<br />
a broad spread in the ep mass and in the missing mass which tells us only that<br />
the ep combination does not come from the decay of what would be a very peculiar<br />
boson and that at least two particles escape detection.<br />
Figure 17 shows the distribution of collinearity angles between the e’s and<br />
p”‘s for three center-of-mass energy regions. The curves represent the expected<br />
distributions including the effects of our cuts, for the reaction-<br />
e+ + e- -u++ u- ,<br />
U-e+X; or p+X ,<br />
where X represents one or more neutral particles. For example, if U were a<br />
heavy lepton, X might be two neutrinos; while if U were a boson, X might be one<br />
neutrino or a neutrino plus KL. The solid curve in Fig. 17 represents the<br />
expected distribution for the 3-body decay of a 1.8 GeV mass heavy lepton via a<br />
V-A interaction. The spins of the lepton pair are assumed to be uncorrelated.<br />
The dotted curve represents the 2-body decay of a 1.9 GeV mass boson. No<br />
sharp conclusion can be drawn from this figure: -at best there is a mild prefer-<br />
ence for the 3-body decay.<br />
Figure 18 shows the momenta of all of the e’s and p’s vs the center-of-mass<br />
-<br />
energy at which the events were found. The curves on the graph indicate the<br />
maximum possible momentum for a lepton coming from a U particle decay,<br />
assuming that the neutral masses are zero. The data between 3.8 and 4 GeV<br />
might seem to rule out U masses above 1.8 GeV, but this is not the case. A<br />
glance at the cross section graph (Fig. 15) shows that the data in this energy in-<br />
terval are only one standard deviation above the feedthrough background, and<br />
these events could easily be a background fluctuation. Since all of the back-<br />
ground events are included in Fig. 18, we can say with reasonable certainty only<br />
that the U mass should be less than -2.2 GeV.<br />
We can look in more detail at the distributions in momentum. To do this we<br />
need a way to combine runs taken at different center-of-mass energies and there-<br />
fore we define a parameter<br />
P=<br />
p-O.65<br />
P max-0.65<br />
(8)<br />
(9)
- 14 -<br />
where p is the momentum of the lepton in GeV and pm, is the maximum possible<br />
momentum a lepton can have from a U-particle decay. Figure 19 shows the dis-<br />
tribution of the leptons vs p for three energy bands.<br />
- The parameter pm, is that<br />
for a 1.8 GeV mass particle. The solid and dotted curves are calculated for a<br />
3-body V-A decay and for a 2-body decay, respectively. The data mildly favors<br />
a 3-body decay, but even this conclusion is somewhat sensitive to the choice of<br />
U mass: using 2.2 GeV rather than 1.8 GeV makes the choice of the 3-body<br />
decay over the 2-body decay less compelling.<br />
The energy dependence of the observed cross section also does not help to<br />
distinguish between different types of U particles. The data can be fit equally<br />
well with the l/S dependence expected for a heavy lepton, the l/S3 dependence<br />
that might be expected for a pseudoscalar boson, or the l/S2 dependence that<br />
might be expected for a vector boson.<br />
I can summarize the situation as follows:<br />
(1) The anomalous ep events exist and only about 25% can be explained as<br />
backgrounds of one type or another.<br />
(2) The events are consistent with the hypothesis of the production of a pair<br />
of new particles.<br />
(3) The data mildly favor a 3-body decay of the new particle, but a 2-body<br />
decay is not excluded.<br />
(4) If the U particle is a heavy lepton, the production cross section is<br />
known and hence a branching fraction can be calculated. The branching fraction<br />
of the U--L e or p + neutrinos is about 17% each.<br />
(5) If U is a boson, the production cross section is not known, and hence no<br />
branching fraction can be calculated.<br />
What is really needed is more data taken with different kinds of apparatus<br />
with different types of biases. We expect roughly to double the data we have now<br />
with the <strong>SLAC</strong>/LBL magnetic detector in the next six months. In addition, two<br />
new experiments will be run at SPEAR in the coming year. One of these will look<br />
at the p-inclusive spectrum (not requiring two leptons), while the other will look<br />
at the e-inclusive spectrum. Further, the DASP and PLUTO spectrometers at<br />
DESY will begin to study these anomalous lepton events in the beginning of 1976.<br />
Hopefully, we can understand the origin of these phenomena during the coming<br />
year.
1.<br />
2.<br />
3.<br />
4.<br />
5.<br />
6.<br />
7.<br />
8.<br />
9.<br />
10.<br />
11.<br />
12.<br />
13.<br />
- 15 -<br />
References<br />
J. E. Augustin -- et al. , Phys. Rev. Letters -’ 33 1406 (1974).<br />
G. S. Abrams -- et al., Phys. Rev. Letters 33, 1453 (1974).<br />
J. J. Aubert et al., Phys. Rev. Letters%, 1404 (1974).<br />
For a description of the ring see SPEAR Storage Ring Group, Proceedings of<br />
IX International Conference on High Energy Accelerators, <strong>Stanford</strong>, 1974;<br />
P37.<br />
Members of the <strong>SLAC</strong>/LBL collaboration: G. S. Abrams, J. E. Augustin,<br />
A. M. Boyarski, M. Breidenbach, D. Briggs, F. Bulos, W. Chinowsky,<br />
G. J, Feldman, G. E. Fischer, C. E. Friedberg, D. Fryberger, G.<br />
Goldhaber, G. Hanson, D. L. Hartill, R. J. Hollebeek, B. Jean-Marie,<br />
J. A. Kadyk, R. R. Larsen, A. M. Litke, D. Lt.&e, B. A. Lulu, V. Ltith,<br />
H. L. Lynch, D. Lyon, C. C. Morehouse, J. M. Paterson, M. L. Perl,<br />
F. M. Pierre, T. P. Pun, P. Rapidis, B. Richter, B. Sadoulet, R. F.<br />
Schwitters , W. Tanenbaum, G. H. Trilling, F . Vannucci, J. S. Whitaker ,<br />
F. C. Winkelmann, J. E. Wiss, and J. E. Zipse.<br />
A. M. Boyarski et al., Phys. Rev. LettersE, 762 (1975).<br />
Part of this data has been published: J, E. Augustin et al., Phys. Rev.<br />
--<br />
Letters 34, 764 (1975).<br />
G. J. Feldman -- et al., Phys. Rev. Letters 35, 821 (1975).<br />
W. Tanenbaum -- et al. , Phys. Rev. Letters 35, 1323 (1975).<br />
W. Braunschweig -- et al. , Phys. Letters E, 407 (1975).<br />
B. Wiik, Report at the International Conference on Lepton-Photon Interac-<br />
tions, <strong>Stanford</strong> <strong>University</strong>, August 1975 (to be published).<br />
J. W. Simpson et al., Phys. Rev. Letters -’ 35 699 (1975).<br />
A. M. Boyarski -- et al., Phys. Rev. Letters -’ 35 196 (1975).<br />
M. L. Per1 -- et al., Phys. Rev. Letters - 35, 1489 (1975).<br />
.<br />
c
1.<br />
2.<br />
3.<br />
4.<br />
5.<br />
6.<br />
7.<br />
8.<br />
9.<br />
10.<br />
11.<br />
12.<br />
13.<br />
14.<br />
15.<br />
16.<br />
17.<br />
18.<br />
19.<br />
- 16 -<br />
Figure Captions<br />
Exploded view of the magnetic detector.<br />
Schematic end-view of the magnetic detector.<br />
Total cross section for e+e- to hadrons.<br />
Fine scan of total cross section from c.m. energy of 3.2 to 7.7 GeV.<br />
Total hadronic cross section vs c.m. energy, including results to September<br />
-<br />
1975. The radiative tails of the q resonances have been subtracted.<br />
R vs c.m. energy, with the data of Fig. 5.<br />
-<br />
R on an expanded scale covering the 3-5 GeV region. The open circles are<br />
from Ref. 6, and the solid circles include data up to the time of the Photon<br />
Conference.<br />
A further expansion of the energy scale for R, including the most recent data<br />
of October and November 1975.<br />
Dimuon mass distribution for c. m. energy equal to the q1 mass. The upper<br />
peak is the direct $’ decay to two muons plus the QED ,u-pair production,<br />
while the lower peak is from the cascade decay G1 - $ with the + decaying<br />
into two muons.<br />
The ye mass distribution as observed in the decay ~,6’ - $yy. The curves are<br />
explained in the text.<br />
Scatter plot of the two solutions for the mass of intermediate states in<br />
ZCI’ -c $ye+e-.<br />
(Missing mass)2 recoiling against the $ before and after subtraction of<br />
$’ - zpl7r.<br />
Invariant hadron mass distributions for the constrained fit of q’ -* y + hadrons.<br />
The hadron systems are (a) 47r, (b) 67r, (c) nrKK, (d) the sum of ?r’r- and<br />
K+K-.<br />
Energy level diagram of the new states.<br />
The observed cross section for the ,ue events.<br />
Distribution of the pe (invariant mass)2 z (missing mass)2 for the data at<br />
E*=4.8 GeV.<br />
Distribution of cos ocol for three different c.m. energy intervals. The<br />
curves are explained in the text.<br />
Distribution of p, and pp for all ep events. The curves are upper limits on<br />
p, or pp for the indicated U masses in GeV/c’. These limits are the same<br />
for a-body and 3-body decay provided all neutral masses are zero.<br />
The distribution in p for three intervals of c.m. energy. The solid and<br />
dotted curves are explained in the text.
MUON SPARK CHAMBERS<br />
FLUX RETURN \<br />
COMPENSATING SOLENOID<br />
VACUUM CHAMBER<br />
LUMINOSITY MONITOR<br />
Fig. 1<br />
TRIGGER COUNTERS<br />
SPARK CHAMBERS
I<br />
I meter<br />
I<br />
/ d--SHOWER COUNTERS’(24)<br />
Fig. 2<br />
-TRIGGER COUNTERS (48)<br />
CYLINDRICAL \<br />
WIRE CHAMBERS., \ L<br />
\<br />
\<br />
-<br />
l-<br />
--:<br />
b<br />
2322C3
2.5<br />
2.0<br />
1.5<br />
1.0<br />
0.5<br />
0<br />
-22<br />
0 2<br />
0.0
RELATIVE CROSS SECTION<br />
0 0 0<br />
0<br />
Ln 0 R x P<br />
07<br />
n-T-TG%<br />
n<br />
m m -4 m<br />
RE’ f-AWE .- CROSS SECTION<br />
- N w e<br />
-+---&<br />
I. n<br />
Q .<br />
h<br />
::<br />
P<br />
t
40<br />
30<br />
5;<br />
z 20<br />
b’<br />
IO<br />
0<br />
. .<br />
t tn~~<br />
I I<br />
‘It<br />
I I I<br />
0 2 3 4 5 6 7 8<br />
E c.m. (GeV)<br />
Fig. 5<br />
278OC18
8-<br />
1,<br />
I I I I I<br />
0 1 I I I I I<br />
0 2 3 4 5 6 7 8<br />
E c.m. fGeV)<br />
Fig. 6<br />
278OC27
6<br />
d 0<br />
I I I I I I I I I J<br />
0 3.2 3.4 3.6 3.8 4.0 4.2 4.4 4.6 4.8 5.0<br />
EC.,-,. (GeV > 2780121<br />
Fig. 7
R<br />
7<br />
6<br />
5 I-<br />
4<br />
3<br />
2<br />
>1<br />
-(-- I<br />
_ t<br />
I<br />
tt i<br />
0 -8 ’ I I<br />
- 0 3.8 4.0 4.2 4.4 4.6<br />
EC,,. (GeW 2893CI<br />
Fig. 8
100 -<br />
1<br />
O-<br />
25 . 30 35<br />
i (p+p-) (GeC) L<br />
Fig. 9
20<br />
15<br />
IO<br />
5<br />
I<br />
0 3 I<br />
.<br />
I<br />
\<br />
1<br />
/ I<br />
c<br />
1<br />
3.3 3.5<br />
$7 Mass (GeV/c2)<br />
Fig. 10<br />
37 .<br />
277901
32 .<br />
3.1<br />
l 8<br />
0 0<br />
\cI ‘-+rr<br />
t e+e-<br />
34<br />
. 3.5 3.6 3.7<br />
I n n I I<br />
9 Y Mass Higher Solution (GeV/c’) 2179A2<br />
Fig. 11<br />
L
150<br />
100<br />
50<br />
9I-q + neutrals<br />
0 Raw Events<br />
- EZ! l/2 ($‘--\c, +charged) _<br />
Subtracted<br />
--- Radiative Tail<br />
0<br />
-0.3 -0.2 -0.1 0 0.1 0.2 0.3 0.4<br />
Missing Mass Squared (GeV/c* )* 1BP,B,<br />
Fig. 12<br />
L
20<br />
I5<br />
IO<br />
5<br />
0<br />
5<br />
0<br />
IO<br />
5<br />
0<br />
5<br />
-<br />
-<br />
-<br />
I<br />
i<br />
0<br />
I-J<br />
I<br />
3.2 3.4 3.6<br />
I<br />
I<br />
lP<br />
I ’<br />
4T’<br />
(a)<br />
YT?T- or K+K-<br />
MASS ( GeV/c2)<br />
-Fig. 13<br />
(d)<br />
-<br />
3.8<br />
L
+-<br />
t<br />
YY<br />
PP<br />
c=+<br />
State<br />
X(2800)<br />
I --<br />
States<br />
Modes 1<br />
Fig. 14<br />
c=+<br />
States<br />
2893A2
30 1 I I 1 1<br />
20<br />
0<br />
i<br />
-O-<br />
3 5 6 7<br />
TOTAL ENERGY (GeV)<br />
Fig. 15<br />
J<br />
8<br />
L
0<br />
IIll II 11 11 11<br />
0 +5 + IO<br />
Fig. 16<br />
0 5 IO<br />
ML (GeV2) 27,511,
0<br />
IO<br />
5<br />
P<br />
E O<br />
3<br />
20<br />
15<br />
IO<br />
5<br />
0<br />
I]<br />
.<br />
. ..** : . :<br />
\<br />
I :<br />
1.0 0.5<br />
- 3-body decay of U<br />
--** 2- body decay of U<br />
I I I<br />
Fi<br />
JS = 4.8 GeV
3 -<br />
j -<br />
I<br />
. .<br />
- .<br />
.<br />
t<br />
.<br />
8 .<br />
.<br />
.<br />
.<br />
.<br />
.<br />
.<br />
.’<br />
.<br />
.<br />
.<br />
. .<br />
0.<br />
.<br />
:<br />
. .<br />
‘I l i<br />
. i l . .;*<br />
: .** :.<br />
l **<br />
.<br />
I i<br />
I I I I<br />
I I I I I I<br />
3<br />
I<br />
I I<br />
4 5 6 7<br />
8 9<br />
Ec.~. (GeV)<br />
Fig. 18<br />
:<br />
.<br />
.<br />
.