

Company overview 2011 - SBM Offshore
Company overview 2011 - SBM Offshore
Company overview 2011 - SBM Offshore

You also want an ePaper? Increase the reach of your titles
YUMPU automatically turns print PDFs into web optimized ePapers that Google loves.
4.1.4 Order Portfolio<br />
The year-end order portfolio at US$ 16.91 billion is up 47.0% from last year’s level of US$ 11.50 billion. The<br />
current order portfolio includes US$ 11.31 billion (2010: US$ 9.00 billion) for the non-discounted value of future<br />
revenues from the long-term charters of the lease fleet, of which US$ 4.5 billion (2010: US$ 4.7 billion) represents<br />
the bareboat element of the operating leases. Approximately 57% of the future bareboat revenues will be<br />
generated from the lease contracts which have yet to commence (FPSO Baleia Azul, MOPUstor Yme and<br />
MOPU Deep Panuke). The Turnkey Systems order portfolio more than doubled (US$ 2.30 billion in 2010) to US$<br />
5.33 billion, boosted by the finance lease treatment of the two new lease contracts, one turnkey sale FPSO and<br />
two large turret mooring systems, and represents approximately two years of turnover. Turnkey Services backlog<br />
increased by 38.1% to US$ 0.27 billion (approximately nine months of turnover).<br />
For the FPSO Cidade de Paraty (<strong>SBM</strong> share 50.5%) construction<br />
continued throughout <strong>2011</strong>. In July <strong>2011</strong> the charter contracts<br />
with Petrobras were concluded and a US$ 1 billion project loan<br />
arranged with a syndicate of banks. Drawdowns totalling US$ 284<br />
million (<strong>SBM</strong> share) were made during the second half of <strong>2011</strong>.<br />
The twelve-year lease contract with ENI for FPSO Xikomba is also<br />
accounted for as a finance lease. Turnover during construction is<br />
equal to our partner Sonangol’s 50% share of the investment plus<br />
the <strong>Company</strong>’s 50% share of the fair value of the lease, all on a<br />
percentage of completion basis.<br />
In <strong>2011</strong>, total Turnkey Systems turnover recognised in respect of<br />
construction of assets accounted for as finance leases amounted<br />
to US$ 1.159 million (2010: US$ 681 million).<br />
The ongoing charter contracts for FPSOs Mondo and Saxi<br />
Batuque are similarly accounted for as finance leases. Return on<br />
investment recognised in the Lease & Operate turnover in <strong>2011</strong> in<br />
respect of these contracts and the first two months of the FPSO<br />
Aseng charter amounted to US$ 20 million (2010: US$ 16 million).<br />
Order Portfolio<br />
The year-end order portfolio at US$ 16.91 billion is up 47.0% from<br />
last year’s level of US$ 11.50 billion. The current order portfolio<br />
includes US$ 11.31 billion (2010: US$ 9.00 billion) for the non-discounted<br />
value of future revenues from the long-term charters of the<br />
lease fleet, of which US$ 4.5 billion (2010: US$ 4.7 billion) represents<br />
the bareboat element of the operating leases. Approximately<br />
57% of the future bareboat revenues will be generated from the<br />
lease contracts which have yet to commence (FPSO Baleia<br />
Azul, MOPUstor Yme and MOPU Deep Panuke). The Turnkey<br />
Systems order portfolio more than doubled (US$ 2.30 billion in<br />
2010) to US$ 5.33 billion, boosted by the finance lease treatment<br />
of the two new lease contracts, one turnkey sale FPSO and two<br />
large turret mooring systems, and represents approximately two<br />
years of turnover. Turnkey Services backlog increased by 38.1%<br />
to US$ 0.27 billion (approximately nine months of turnover).<br />
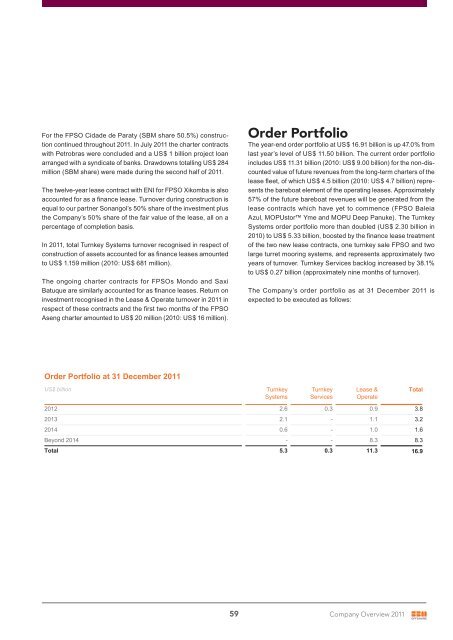
The <strong>Company</strong>’s order portfolio as at 31 December <strong>2011</strong> is<br />
expected to be executed as follows:<br />
The <strong>Company</strong>’s order portfolio as at 31 December <strong>2011</strong> is expected to be executed as follows:<br />
Order Portfolio at 31 December <strong>2011</strong><br />
US$ billion Turnkey<br />
Systems<br />
Turnkey<br />
Services<br />
Lease &<br />
Operate<br />
2012 2.6 0.3 0.9 3.8<br />
2013 2.1 - 1.1 3.2<br />
2014 0.6 - 1.0 1.6<br />
Beyond 2014 - - 8.3 8.3<br />
Total 5.3 0.3 11.3 16.9<br />
59<br />
Total


