High-Frequency Genetic Contents Variations in Clinical
High-Frequency Genetic Contents Variations in Clinical
High-Frequency Genetic Contents Variations in Clinical

You also want an ePaper? Increase the reach of your titles
YUMPU automatically turns print PDFs into web optimized ePapers that Google loves.
624 Regular Article<br />
Biol. Pharm. Bull. 34(5) 624—631 (2011)<br />
Vol. 34, No. 5<br />
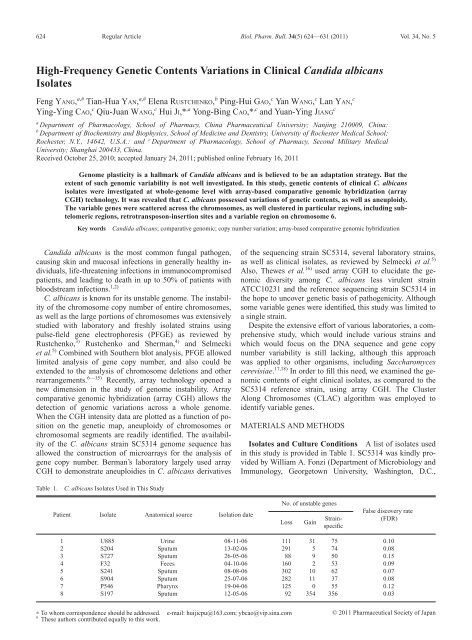
<strong>High</strong>-<strong>Frequency</strong> <strong>Genetic</strong> <strong>Contents</strong> <strong>Variations</strong> <strong>in</strong> Cl<strong>in</strong>ical Candida albicans<br />
Isolates<br />
Feng YANG, a,# Tian-Hua YAN, a,# Elena RUSTCHENKO, b P<strong>in</strong>g-Hui GAO, c Yan WANG, c Lan YAN, c<br />
Y<strong>in</strong>g-Y<strong>in</strong>g CAO, c Qiu-Juan WANG, c Hui JI,* ,a Yong-B<strong>in</strong>g CAO,* ,c and Yuan-Y<strong>in</strong>g JIANG c<br />
a Department of Pharmacology, School of Pharmacy, Ch<strong>in</strong>a Pharmaceutical University; Nanj<strong>in</strong>g 210009, Ch<strong>in</strong>a:<br />
b Department of Biochemistry and Biophysics, School of Medic<strong>in</strong>e and Dentistry, University of Rochester Medical School;<br />
Rochester, N.Y., 14642, U.S.A.: and c Department of Pharmacology, School of Pharmacy, Second Military Medical<br />
University; Shanghai 200433, Ch<strong>in</strong>a.<br />
Received October 25, 2010; accepted January 24, 2011; published onl<strong>in</strong>e February 16, 2011<br />
Genome plasticity is a hallmark of Candida albicans and is believed to be an adaptation strategy. But the<br />
extent of such genomic variability is not well <strong>in</strong>vestigated. In this study, genetic contents of cl<strong>in</strong>ical C. albicans<br />
isolates were <strong>in</strong>vestigated at whole-genome level with array-based comparative genomic hybridization (array<br />
CGH) technology. It was revealed that C. albicans possessed variations of genetic contents, as well as aneuploidy.<br />
The variable genes were scattered across the chromosomes, as well clustered <strong>in</strong> particular regions, <strong>in</strong>clud<strong>in</strong>g subtelomeric<br />
regions, retrotransposon-<strong>in</strong>sertion sites and a variable region on chromosome 6.<br />
Key words Candida albicans; comparative genomic; copy number variation; array-based comparative genomic hybridization<br />
Candida albicans is the most common fungal pathogen,<br />
caus<strong>in</strong>g sk<strong>in</strong> and mucosal <strong>in</strong>fections <strong>in</strong> generally healthy <strong>in</strong>dividuals,<br />
life-threaten<strong>in</strong>g <strong>in</strong>fections <strong>in</strong> immunocompromised<br />
patients, and lead<strong>in</strong>g to death <strong>in</strong> up to 50% of patients with<br />
bloodstream <strong>in</strong>fections. 1,2)<br />
C. albicans is known for its unstable genome. The <strong>in</strong>stability<br />
of the chromosome copy number of entire chromosomes,<br />
as well as the large portions of chromosomes was extensively<br />
studied with laboratory and freshly isolated stra<strong>in</strong>s us<strong>in</strong>g<br />
pulse-field gene electrophoresis (PFGE) as reviewed by<br />
Rustchenko, 3) Rustchenko and Sherman, 4) and Selmecki<br />
et al. 5) Comb<strong>in</strong>ed with Southern blot analysis, PFGE allowed<br />
limited analysis of gene copy number, and also could be<br />
extended to the analysis of chromosome deletions and other<br />
rearrangements. 6—15) Recently, array technology opened a<br />
new dimension <strong>in</strong> the study of genome <strong>in</strong>stability. Array<br />
comparative genomic hybridization (array CGH) allows the<br />
detection of genomic variations across a whole genome.<br />
When the CGH <strong>in</strong>tensity data are plotted as a function of position<br />
on the genetic map, aneuploidy of chromosomes or<br />
chromosomal segments are readily identified. The availability<br />
of the C. albicans stra<strong>in</strong> SC5314 genome sequence has<br />
allowed the construction of microarrays for the analysis of<br />
gene copy number. Berman’s laboratory largely used array<br />
CGH to demonstrate aneuploidies <strong>in</strong> C. albicans derivatives<br />
Table 1. C. albicans Isolates Used <strong>in</strong> This Study<br />
Patient Isolate Anatomical source Isolation date<br />
∗ To whom correspondence should be addressed. e-mail: huijicpu@163.com; ybcao@vip.s<strong>in</strong>a.com<br />
# These authors contributed equally to this work.<br />
of the sequenc<strong>in</strong>g stra<strong>in</strong> SC5314, several laboratory stra<strong>in</strong>s,<br />
as well as cl<strong>in</strong>ical isolates, as reviewed by Selmecki et al. 5)<br />
Also, Thewes et al. 16) used array CGH to elucidate the genomic<br />
diversity among C. albicans less virulent stra<strong>in</strong><br />
ATCC10231 and the reference sequenc<strong>in</strong>g stra<strong>in</strong> SC5314 <strong>in</strong><br />
the hope to uncover genetic basis of pathogenicity. Although<br />
some variable genes were identified, this study was limited to<br />
a s<strong>in</strong>gle stra<strong>in</strong>.<br />
Despite the extensive effort of various laboratories, a comprehensive<br />
study, which would <strong>in</strong>clude various stra<strong>in</strong>s and<br />
which would focus on the DNA sequence and gene copy<br />
number variability is still lack<strong>in</strong>g, although this approach<br />
was applied to other organisms, <strong>in</strong>clud<strong>in</strong>g Saccharomyces<br />
cerevisiae. 17,18) In order to fill this need, we exam<strong>in</strong>ed the genomic<br />
contents of eight cl<strong>in</strong>ical isolates, as compared to the<br />
SC5314 reference stra<strong>in</strong>, us<strong>in</strong>g array CGH. The Cluster<br />
Along Chromosomes (CLAC) algorithm was employed to<br />
identify variable genes.<br />
MATERIALS AND METHODS<br />
Isolates and Culture Conditions A list of isolates used<br />
<strong>in</strong> this study is provided <strong>in</strong> Table 1. SC5314 was k<strong>in</strong>dly provided<br />
by William A. Fonzi (Department of Microbiology and<br />
Immunology, Georgetown University, Wash<strong>in</strong>gton, D.C.,<br />
No. of unstable genes<br />
Loss Ga<strong>in</strong><br />
Stra<strong>in</strong>specific<br />
False discovery rate<br />
(FDR)<br />
1 U885 Ur<strong>in</strong>e 08-11-06 111 31 75 0.10<br />
2 S204 Sputum 13-02-06 291 5 74 0.08<br />
3 S727 Sputum 26-05-06 88 9 50 0.15<br />
4 F32 Feces 04-10-06 160 2 53 0.09<br />
5 S241 Sputum 08-08-06 302 10 62 0.07<br />
6 S904 Sputum 25-07-06 282 11 37 0.08<br />
7 P546 Pharynx 19-04-06 125 0 55 0.12<br />
8 S197 Sputum 12-05-06 92 354 356 0.03<br />
© 2011 Pharmaceutical Society of Japan
May 2011 625<br />
U.S.A.). Cl<strong>in</strong>ical isolates were obta<strong>in</strong>ed from Changhai Hospital<br />
of Shanghai, Ch<strong>in</strong>a.<br />
All samples were ma<strong>in</strong>ta<strong>in</strong>ed as 80 °C stocks <strong>in</strong> 30%<br />
glycerol. All isolates were cultivated <strong>in</strong> YEPD (1% yeast extract,<br />
2% peptone, 2% glucose) at 30 °C, with 200 rpm agitation.<br />
Genotyp<strong>in</strong>g Analysis Polymerase cha<strong>in</strong> reaction (PCR)<br />
for MTL status and the ribosomal RNA (rRNA) gene transcribed<br />
spacer region was done as previously described. 19)<br />
DNA Isolation C. albicans isolates stored at 80 °C<br />
were streaked on a Sabouraud agar plate. After <strong>in</strong>cubation<br />
overnight at 30 °C, several colonies were collected and<br />
<strong>in</strong>oculated overnight <strong>in</strong> 5 ml YEPD medium at 30 °C, harvested<br />
and washed with distilled water, resuspended <strong>in</strong><br />
200 ml lysis buffer (2% Triton X-100, 1% sodium dodecyl<br />
sulfate (SDS), 100 mM NaCl, 1 mM ethylenediam<strong>in</strong>etetraacetic<br />
acid (EDTA), 10 mM Tris, pH 8.0). DNA was isolated<br />
as described by Hoffman and W<strong>in</strong>son. 20) DNA was purified<br />
us<strong>in</strong>g the PCR Clean-up NucleoSp<strong>in</strong> Extract II Kit<br />
(Macherey-Nagel, Germany) accord<strong>in</strong>g to manufacturer’s<br />
<strong>in</strong>structions.<br />
Microarray Production For the production of spotted<br />
DNA-microarrays, 7925 70 mer oligonucleotides target<strong>in</strong>g<br />
the ORFeome of C. albicans were pr<strong>in</strong>ted triplicate on am<strong>in</strong>o<br />
silaned glass slides us<strong>in</strong>g a SmartArrayer TM microarrayer<br />
(CapitalBio Corp.). Prior to hybridization, the slides were<br />
rehydrated over 65 °C water for 10 s, UV cross-l<strong>in</strong>ked at<br />
250 mJ/cm 2 .<br />
DNA Label<strong>in</strong>g for Array CGH Analysis The generation<br />
of DNA fragments by sonication was performed with<br />
10 mg buffered DNA sample. For each label<strong>in</strong>g reaction,<br />
3.5 mg of fragmented DNA and 4 mg of random nonamer<br />
were heated to 95 °C for 3 m<strong>in</strong> and snap cooled on ice, then<br />
10Klenow buffer, dNTPs and Cy5-dCTP or Cy3-dCTP<br />
(GE HealthCare) were added at f<strong>in</strong>al concentrations of<br />
120 m M each dATP, dGTP, dTTP, 60 m M dCTP and 40 m M Cydye,<br />
respectively. Klenow enzyme (1 ml, Takara, Dalian,<br />
Ch<strong>in</strong>a) was added and reaction was performed at 37 °C for<br />
1 h. The labeled DNA was purified with a PCR Clean-up NucleoSp<strong>in</strong><br />
Extract II Kit. All samples had dye-swap replicates<br />
to remove any dye bias.<br />
Microarray Hybridization, Scann<strong>in</strong>g and Data Process<strong>in</strong>g<br />
For array CGH, the labeled control and test samples<br />
were mixed <strong>in</strong>to 80 ml hybridization solution (3SSC, 0.2%<br />
SDS, 50% formamide). DNA <strong>in</strong> hybridization solution was<br />
denatured at 95 °C for 3 m<strong>in</strong> prior to load<strong>in</strong>g on the microarray.<br />
The arrays were hybridized at 42 °C overnight and<br />
washed with two consecutive wash<strong>in</strong>g solutions (0.2% SDS,<br />
2SSC for 5 m<strong>in</strong> at 42 °C and 0.2% SSC for 5 m<strong>in</strong> at room<br />
temperature). Two types of arrays were performed under the<br />
same experimental conditions; one was a normal array (reference/reference<br />
hybridization) and the other test arrays (reference/test<br />
hybridization).<br />
Arrays were scanned with a confocal LuxScan TM scanner<br />
(CapitalBio Corp.), and the data of obta<strong>in</strong>ed images were<br />
extracted with LuxScan 3.0 software (CapitalBio Corp). A<br />
spatial and <strong>in</strong>tensity-dependent normalization based on a<br />
LOWESS program was employed. 21) The normalized log 2<br />
(test/control) ratio of signal <strong>in</strong>tensity was considered as a<br />
measure of the relative abundance of each gene relative to<br />
that of the reference isolate SC5314. We used CGH-M<strong>in</strong>er<br />
for statistical analysis of DNA copy number ga<strong>in</strong>s and<br />
losses. 22) CGH-M<strong>in</strong>er uses a “Cluster Along Chromosomes<br />
(CLAC)” algorithm, which builds a hierarchical cluster-style<br />
tree along each chromosome (or chromosome arm), and the<br />
neighbor<strong>in</strong>g genes with positive and negative ratios are separated<br />
<strong>in</strong>to different clusters. Ga<strong>in</strong>s and losses are then called<br />
significantly based on the height and width of clusters, and a<br />
false discovery rate (FDR) is estimated by comparison to<br />
normal–normal hybridization data. Consensus FDR, which is<br />
an estimator of the consensus result of the ga<strong>in</strong>/loss across all<br />
samples, is also calculated. For data smooth<strong>in</strong>g, the parameters<br />
were set for BAC analysis, to produce a mov<strong>in</strong>g w<strong>in</strong>dow<br />
of three ORFs for averag<strong>in</strong>g the hybridization signal. 18) And<br />
the cluster tree was built on whole chromosomes.<br />
Variable genes identified by array CGH were validated by<br />
quantitative real-time PCR (qPCR) us<strong>in</strong>g 7500 Real Time<br />
PCR system (Applied Biosystems) and SYBR Green I<br />
(Takara Bio, Tokyo, Japan). The DNA copy number of the<br />
variable genes was determ<strong>in</strong>ed relative to the gene TDH3<br />
(orf19.6814), a reference gene that array CGH showed not to<br />
vary <strong>in</strong> all the cl<strong>in</strong>ical isolates. We used the comparative Ct<br />
method (2 DDCt ) to determ<strong>in</strong>e target gene copy number <strong>in</strong> the<br />
test isolates relative to the reference gene and the reference<br />
DNA sample of SC5314. 23,24)<br />
Raw data have been deposited <strong>in</strong> NCBIs Gene Expression<br />
Omnibus (GEO) and are accessible through GEO series<br />
accession number GSE18819. Functional annotations and<br />
GO term association was done follow<strong>in</strong>g Candida Genome<br />
Database (CGD) annotations.<br />
RESULTS<br />
Characterization of Isolates A total of eight C. albicans<br />
isolates were isolated from eight different patients<br />
attend<strong>in</strong>g the same hospital <strong>in</strong> the year 2006 (Table 1). All<br />
the test isolates and the reference isolate SC5314 were ma<strong>in</strong>ta<strong>in</strong>ed<br />
on Sabouraud agar plates at 4 °C or as 80 °C stocks<br />
<strong>in</strong> 30% glycerol. Initially, the isolates were streaked for <strong>in</strong>dependent<br />
colonies on CHROMagar medium (CHROMagar<br />
Company, Paris, France) and <strong>in</strong>cubated, as recommended by<br />
manufacturer. If the green color of the colonies <strong>in</strong>dicated<br />
C. albicans, we then performed, <strong>in</strong> addition, polymerase<br />
cha<strong>in</strong> reaction (PCR) with primers that amplified the ITS1<br />
region of ribosomal DNA (rDNA), which also designated the<br />
ATP-b<strong>in</strong>d<strong>in</strong>g cassette (ABC) type of each isolate (ABC<br />
type). 19) ABC typ<strong>in</strong>g revealed that isolates SC5314, U885,<br />
S204 and S727 were of genotype A, isolates F32, S241 and<br />
S9-04 were of genotype B, and the rest two isolates (P546,<br />
S197) were of genotype C (data not shown).<br />
Statistical Analysis of Array CGH Data We estimated<br />
the DNA content of each of eight cl<strong>in</strong>ical isolates with array<br />
CGH approach, as compared to a control sequenc<strong>in</strong>g stra<strong>in</strong><br />
SC5314. Every microarray conta<strong>in</strong>ed 19056 probes represent<strong>in</strong>g<br />
6111 ORFs of SC5314 (Materials and Methods). We<br />
calculated the DNA content of every gene, as the ratio<br />
test/control and, subsequently, averaged the six values correspond<strong>in</strong>g<br />
to six data po<strong>in</strong>ts (Materials and Methods). Furthermore,<br />
we used CGH-M<strong>in</strong>er for statistical analysis of<br />
DNA copy number ga<strong>in</strong>s and losses (Materials and Methods).<br />
In order to determ<strong>in</strong>e if the differences <strong>in</strong> hybridization<br />
efficiency were due to divergence of the DNA sequence, we
626 Vol. 34, No. 5<br />
Table 2. Primers Used for PCR Amplification and Sequenc<strong>in</strong>g<br />
Name Sequence (5–3)<br />
orf19.5370 Fwd: AGCCTCTGAACACCTTATC<br />
Rev: GTAGTTGCCCTTCTCTCTG<br />
orf19.5469 Fwd: GGGATTTCTGTCGCATGAAC<br />
Rev: TGTCTAAAACACCGCACCTC<br />
orf19.5472 Fwd: CAACTGAAGCGGGTAGAAC<br />
Rev: ATCAAGGTGACGACGGACT<br />
orf19.5474 Fwd: ATGAGGTGCGGTGTTTTAG<br />
Rev: CTCGTTCCTCCAGTTGCTT<br />
orf19.5475 Fwd: CAACATACCCCCGCATCCT<br />
Rev: GTTCAAGAGCCAGCCCACG<br />
orf19.1831 Fwd: TTCTAACATCAGGCGGTCCCAT<br />
Rev: ACCAGACCCCTTATTGCTCGGC<br />
orf19.7475 Fwd: CGAGAAACCCTCCCTACTG<br />
Rev: CTTTGCGTAAGATTGCGTC<br />
orf19.101 Fwd: AGCAGAGGAGTGAACGAA<br />
Rev: AGCAGAGGAGTGAACGAA<br />
orf19.105 Fwd: TTCTACTCACCCATACCAA<br />
Rev: CACTTTCCCATCTTCAATC<br />
orf19.107 Fwd: GTGAAGCCAGAGATGAAAT<br />
Rev: AAGCGATACATACCGTGAG<br />
orf19.109 Fwd: ATCCTACGGCATCATCACTAC<br />
Rev: CAATCTTCTCATTTCACCCTT<br />
orf19.48 Fwd: CACCATCTCAACCACATA<br />
Rev: GACCATTCACCACACTTT<br />
orf19.6192 Fwd: GTCATCAATTATCCACGGGTT<br />
Rev: AGCAAGAAAGTTGGTAAGAAG<br />
compared the sequence of the 70 mer oligonucleotides between<br />
test stra<strong>in</strong>s and the reference stra<strong>in</strong> from 13 genes that<br />
displayed dim<strong>in</strong>ished hybridization signals <strong>in</strong> test stra<strong>in</strong>s.<br />
Fragments of 13 genes correspond<strong>in</strong>g to the 70 mer oligonucleotides<br />
were PCR-amplified from test stra<strong>in</strong>s and sequenced<br />
(Primer sequences are provided <strong>in</strong> Table 2). It was revealed<br />
that eight genes (orf19.5472, orf19.5474, orf19.5469,<br />
orf19.5475, orf19.109, orf19.48, orf19.107, orf19.6192) had<br />
from 100% to more than 97% similarity to the control sequences,<br />
while five genes (orf19.101, PHO81 (orf19.7475),<br />
orf19.5370, orf19.1831, HAL22 (orf19.105)) had from 92%<br />
to 70% similarity (data not shown). Thus, <strong>in</strong> approximately<br />
50% of cases, the sequence divergence might account for the<br />
dim<strong>in</strong>ished signal <strong>in</strong>tensities <strong>in</strong> the test stra<strong>in</strong>s.<br />
We used quantitative real-time PCR (qPCR) to validate the<br />
loss of DNA <strong>in</strong> the eight genes with 100% to more than 97%<br />
similarity to the control sequences. S<strong>in</strong>ce array CGH<br />
revealed that the variable genes were scattered across the<br />
chromosomes, as well clustered <strong>in</strong> particular regions, several<br />
genes from these locations were also <strong>in</strong>cluded <strong>in</strong> qPCR<br />
analysis, <strong>in</strong>clud<strong>in</strong>g the retrotransposon Tca4 open read<strong>in</strong>g<br />
frames (ORFs) (RHD2 (orf19.2668), orf19.2669), retrotransposon<br />
Tca8 ORFs (POL93 (orf19.6078), orf19.6079), two<br />
genes on chromosome 6 (HAL22 (orf19.105), orf19.111),<br />
one gene near right sub-telomeric region on chromosome 3<br />
(orf19.6191), two genes located on the arm of chromosome 2<br />
(orf19.4069, orf19.4070). qPCR revealed that, except one<br />
gene, orf19.48, all the genes analyzed possessed copy number<br />
variations as <strong>in</strong>dicated by array CGH. This f<strong>in</strong>d<strong>in</strong>g suggests<br />
that, <strong>in</strong> addition to sequence divergence, copy number<br />
variations might also account for the dim<strong>in</strong>ished hybridization<br />
signals <strong>in</strong> the test stra<strong>in</strong>s. Primer sequences and the results<br />
were provided <strong>in</strong> Tables 3 and 4, respectively.<br />
Determ<strong>in</strong><strong>in</strong>g Variable Genes For the self–self control<br />
Table 3. Primers Used for qPCR Validation of Array CGH Data<br />
Name Sequence (5–3)<br />
Orf19.6078 Fwd: TGCTTATGAACTTGATTTGCC<br />
Rev: TTCACTTTCTTTACCTGGACG<br />
Orf19.6079 Fwd: GCCGAAGCAAGGAACATTA<br />
Rev: CACTCCGAGCGAACATACC<br />
Orf19.2669 Fwd: GACTTAGGGTCTGGAACAA<br />
Rev: CCGTTAAGCATAGGAGAGT<br />
Orf19.2668 Fwd: TACCTGGATCATGTGTTTTA<br />
Rev: ATTCAAGTGTTTACCTGTGT<br />
Orf19.5472 Fwd: GTCTCGCCACATCATAC<br />
Rev: GGTGACGACGGACTACAT<br />
Orf19.5474 Fwd: TTCAAGAGCCAGCCCACG<br />
Rev: ATCCACCTCACCATCATCACAT<br />
Orf19.5469 Fwd: TCAGCGACTCTGAGGACG<br />
Rev: GATGACAACATTGCCACTT<br />
Orf19.5475 Fwd: CCGACAATACTCCGAAT<br />
Rev: GTGATGATGGTGAGGTGG<br />
Orf19.109 Fwd: TTTTATTCCCTACTCCA<br />
Rev: ATCTTCTCATTTCACCC<br />
Orf19.48 Fwd: AGATACCGTGGAAGACAGA<br />
Rev: TGGATAATGGTGGACAGAG<br />
Orf19.107 Fwd: CGCATGAAAGAACTAT<br />
Rev: CAAAGAACATCACCCT<br />
Orf19.6192 Fwd: CCCCGAGCAGTTTGAC<br />
Rev: AAGCGAACAAGGATAGGT<br />
Orf19.6191 Fwd: ATCCATAACCCAACTGCT<br />
Rev: ACTTCTTCGCTTCCTCTG<br />
Orf19.111 Fwd: TAACATCCCTCAAAGACAA<br />
Rev: CAATGGCAATCATAGAAACA<br />
Orf19.4069 Fwd: TTGGTAACGCTAATGCT<br />
Rev: CGAAAGTGGGACTGTATC<br />
Orf19.4070 Fwd: CATTACTAAACTTGCTGCTC<br />
Rev: AATGGCTCCTTGTCAATC<br />
Orf19.105 Fwd: GCAGTAAAGCGTGCCTCAT<br />
Rev: TTCTTCACCCACAATCTCG<br />
Orf19.101 Fwd: TTGTTTACTCCGAACTTATC<br />
Rev: AAGTAGGTTGCTGGACAT<br />
Orf19.7475 Fwd: CCTGCTTCCATTGTTTGAC<br />
Rev: GACACTGATCCTGGCGATA<br />
Orf19.5370 Fwd: ACTATGACTGGTCGTTGC<br />
Rev: AGATAAGGTGTTCAGAGGC<br />
Orf19.1831 Fwd: TTGTTATCTATTTAGTGTCGTT<br />
MTLa1 a)<br />
Rev: GGTGAATTTATTATTAGTCGT<br />
Fwd: AGAACAAACAGCCTAATCG<br />
Rev: ATCATCAATCCCACCAAGA<br />
MTLa2 a) Fwd: GTGTTAGAAGGGTGGTT<br />
Rev: TAGGGTTACAAAGAATG<br />
PAP1 a) Fwd: CTGATTTGTTAGAGCGAC<br />
Rev: CACCATCCCACTGTATTT<br />
PAPa a) Fwd: GAACACGAAGACATACGGAG<br />
Rev: GCCATTGAATCGGACAT<br />
OBPa a) Fwd: TGAAATGGATAACGAGGGA<br />
Rev: CACGCAAGAACTGAAACAA<br />
OBPa a) Fwd: TGGCATATTTCTCCTA<br />
Rev: GTAAACCTCGTTGTCC<br />
PIKa a) Fwd: TAATAACGAGTGCGAAT<br />
Rev: GTGAGTCAACCAGTCCG<br />
PIKa a) Fwd: GGCTGCCAAACTCTACT<br />
Rev: CACTATCAACACCACCA<br />
TDH3 b) Fwd: TAACATTATCCCATCTTCCA<br />
Rev: AGCATCTTCAGTGTAGCCCA<br />
a) Primer sequences of the MTL locus genes are also <strong>in</strong>cluded <strong>in</strong> this table. b)<br />
TDH3 is the reference gene used as <strong>in</strong>ternal control for qPCR.<br />
experiment, no genes with log 2 fluorescence ratio greater<br />
than 1 or less than 1 were yielded. Us<strong>in</strong>g CLAC method,<br />
we found a total of 1116 variable genes hav<strong>in</strong>g significant<br />
changes of signal <strong>in</strong>tensities among test isolates. Of the 1116
May 2011 627<br />
Table 4. qPCR Validation of Array CGH Data<br />
Gene<br />
genes, 702 genes were associated with dim<strong>in</strong>ished signal<br />
<strong>in</strong>tensities and, thus considered as absent/divergent, while a<br />
total of 383 genes were associated with <strong>in</strong>creased signal<br />
<strong>in</strong>tensities and thus considered as amplified. A small number<br />
of genes, 31, were either absent/divergent or amplified <strong>in</strong> different<br />
isolates. Different number of variable genes was identified<br />
<strong>in</strong> each isolate, rang<strong>in</strong>g from 97 to 446, as presented <strong>in</strong><br />
Table 1. Of the 1116 variable genes, 354 genes were shared<br />
between at least two isolates, <strong>in</strong>clud<strong>in</strong>g 196 putative genes of<br />
unknown function and 158 genes annotated with some molecular<br />
functions.<br />
The variable genes could be found randomly scattered on<br />
each of the eight chromosomes. However, clusters of variable<br />
genes could be clearly identified <strong>in</strong> some particular regions,<br />
as presented <strong>in</strong> Fig. 1 (also see below).<br />
Copy Number <strong>Variations</strong> of Genes Near Sub-telomeric<br />
Regions Clusters of variable genes were revealed at subtelomeric<br />
regions of chromosomes 1, 2, and 3 (Fig. 1). Near<br />
the right sub-telomeric region of chromosome 1, seven<br />
Ratio (test/control)<br />
P546 U885 F32 S241 S904 S204 S197 S727<br />
orf19.5472 aCGH 0.42 0.40 0.93 1.22 1.78 0.16 0.00 0.05<br />
qPCR 0.31 0.35 0.85 0.77 2.26 0.22 0.37 0.43<br />
orf19.5474 aCGH 0.59 0.23 0.96 1.17 1.40 0.11 0.00 0.06<br />
qPCR 0.37 0.11 0.72 1.36 0.84 0.18 0.44 0.15<br />
orf19.5469 aCGH 0.67 0.26 0.92 0.96 1.10 0.09 0.00 0.06<br />
qPCR 0.22 0.17 1.29 0.73 0.98 0.36 0.12 0.15<br />
orf19.5475 aCGH 0.54 0.40 0.76 1.39 2.13 0.12 0.01 0.07<br />
qPCR 0.23 0.03 0.81 1.83 2.06 0.10 0.01 0.22<br />
orf19.109 aCGH 1.10 1.09 1.05 1.02 1.01 1.08 0.70 0.54<br />
qPCR 0.84 0.96 1.27 0.62 1.14 0.92 0.89 0.66<br />
orf19.48 aCGH 0.12 0.10 0.18 0.67 0.14 0.30 0.16 0.09<br />
qPCR 1.06 1.02 1.41 1.18 2.02 0.84 1.19 0.31<br />
orf19.107 aCGH 1.14 1.02 1.53 1.30 0.75 1.34 0.59 0.45<br />
qPCR 0.93 0.85 1.39 1.11 0.87 0.88 0.31 0.51<br />
orf19.6192 aCGH 2.12 3.00 3.32 1.12 0.02 3.06 0.01 0.02<br />
qPCR 2.00 4.28 4.47 0.85 0.01 4.48 0.19 0.01<br />
orf19.6191 aCGH 0.56 0.50 0.79 0.63 0.44 0.45 0.55 0.30<br />
qPCR 0.68 0.09 0.21 0.38 0.86 0.29 0.23 0.18<br />
orf19.111 aCGH 0.76 0.72 0.67 0.96 0.88 0.69 0.75 0.56<br />
qPCR 0.33 0.15 0.01 1.19 1.18 1.29 1.27 0.73<br />
orf19.2668 aCGH 0.01 0.02 0.01 0.98 5.18 1.00 1.01 1.03<br />
qPCR 0.00 0.00 0.00 1.10 2.54 1.22 1.12 1.17<br />
orf19.2669 aCGH 0.10 0.06 0.04 0.96 4.61 1.16 1.10 1.03<br />
qPCR 0.00 0.00 0.00 1.18 2.36 1.06 1.36 1.22<br />
orf19.6079 aCGH 0.03 0.11 0.02 0.85 0.02 0.04 0.61 0.83<br />
qPCR 0.00 0.00 0.00 1.66 0.00 0.00 1.30 0.77<br />
orf19.6078 aCGH 0.09 0.16 0.12 0.79 0.09 0.10 0.55 0.80<br />
qPCR 0.00 0.01 0.04 1.80 0.00 0.00 1.36 0.85<br />
orf19.4069 aCGH 0.01 0.02 0.02 0.62 0.02 1.43 0.01 0.81<br />
qPCR 0.01 0.01 0.00 0.98 0.00 1.76 0.00 1.09<br />
orf19.4070 aCGH 0.10 0.23 0.09 0.86 0.12 1.51 0.08 1.69<br />
qPCR 0.11 0.08 0.08 1.13 0.01 2.24 0.04 2.20<br />
orf19.105 aCGH 0.44 0.67 0.21 0.41 0.55 0.24 0.57 1.17<br />
qPCR 0.52 0.24 0.35 0.02 0.28 0.54 0.15 0.94<br />
orf19.101 aCGH 0.65 0.48 0.90 1.10 0.79 1.61 0.76 0.51<br />
qPCR 0.38 0.00 0.75 0.69 0.40 2.30 0.44 0.38<br />
orf19.7574 aCGH 0.52 0.52 0.18 0.22 0.65 0.30 0.19 1.03<br />
qPCR 0.22 0.00 0.00 0.30 0.38 0.18 0.33 0.82<br />
orf19.5370 aCGH 0.28 0.48 0.54 0.51 0.76 0.21 0.31 0.16<br />
qPCR 0.34 0.05 0.53 0.30 0.30 0.75 0.41 0.36<br />
orf19.1831 aCGH 0.24 0.17 0.29 0.51 0.40 0.87 0.31 0.30<br />
qPCR 0.36 0.01 0.26 0.16 0.71 0.01 0.01 0.00<br />
consecutive genes (orf19.7276.1, orf19.7278, orf19.7271,<br />
orf19.7272, orf19.7274, orf19.7275, orf19.7277) spann<strong>in</strong>g<br />
approximately 7.2 kb displayed copy number variations <strong>in</strong><br />
multiple stra<strong>in</strong>s. In isolate P546, all the seven genes were<br />
absent. In isolate S197, three of the seven genes (orf19.7277,<br />
orf19.7276.1, orf19.7278) were absent. In isolate S904, five<br />
of the seven genes (orf19.7274, orf19.7275, orf19.7277,<br />
orf19.7276.1, orf19.7278) were amplified, and <strong>in</strong> isolate<br />
S204, six of the seven genes (orf19.7271, orf19.7272,<br />
orf19.7274, orf19.7275, orf19.7277, orf19.7276.1) were amplified.<br />
Consensus FDRs (see Materials and Methods) were<br />
0.192 for orf19.7271 and orf19.7272; 0.017 for orf19.7274,<br />
orf19.7275, and orf19.7278; as well as 0.002 for orf19.7277<br />
and orf19.7276.<br />
Near the right sub-telomeric region of chromosome 2,<br />
three consecutive genes (orf19.5370, orf19.5369, orf19.5368)<br />
spann<strong>in</strong>g approximately 4.6 kb were absent <strong>in</strong> three isolates<br />
(P546, S204, S727), and the consensus FDR was 0.017.<br />
Genes near both the left and the right sub-telomeric
628 Vol. 34, No. 5<br />
Fig. 1. Consensus Plot for Each Chromosome from Eight Test Arrays, as Determ<strong>in</strong>ed with CLAC Method<br />
Genes are ordered accord<strong>in</strong>g to the nucleotide position on 8 chromosomes. Both the height and the color of the vertical bar of each gene stand for the percentage of arrays <strong>in</strong><br />
which the correspond<strong>in</strong>g gene has DNA copy number variation. The ga<strong>in</strong>/loss regions are plotted <strong>in</strong> red/green, respectively. The relationship between the percentage and the colors<br />
as well as the height is illustrated <strong>in</strong> the legend. The distance between two background gray horizontal l<strong>in</strong>es is 20%. Black arrows <strong>in</strong>dicate the position of retrotransposons.<br />
regions of chromosome 3 showed copy number variations <strong>in</strong><br />
seven of the eight test isolates. Near the left sub-telomeric<br />
region of chromosome 3, five consecutive genes spann<strong>in</strong>g<br />
approximately 10 kb (orf19.5475, orf19.5474, orf19.5472,<br />
orf19.5469, orf19.5467) were absent <strong>in</strong> five test isolates<br />
(P546, U885, S204, S197, S727), while three of the five<br />
genes (orf19.5475, orf19.5474, orf19.5472) were amplified<br />
<strong>in</strong> isolate S904. In addition, one gene (orf19.5466) downstream<br />
of the five consecutive genes was also absent <strong>in</strong> the<br />
isolate S204, and two genes (orf19.5466, orf19.5465) downstream<br />
of the five consecutive genes were also absent <strong>in</strong> the<br />
isolate U885. The consensus FDR of this region was 0.01.<br />
Near the right sub-telomeric region of chromosome 3, four<br />
consecutive genes (orf19.6192, orf19.6191, orf19.6190,<br />
orf19.6189) spann<strong>in</strong>g approximately 12 kb were absent <strong>in</strong><br />
three test isolates (S904, S197, S727). The consensus FDR<br />
for these genes was 0.017.<br />
Variability of Retrotransposon-Encoded ORFs In this<br />
study, probes represent<strong>in</strong>g ORFs of 8 retrotranspons were<br />
spotted on the microarrays, thus, provid<strong>in</strong>g an opportunity to<br />
<strong>in</strong>vestigate the correspond<strong>in</strong>g ORFs copy number. As presented<br />
<strong>in</strong> Table 5 and Fig. 1, there were 4 patterns of copy<br />
change <strong>in</strong> test isolates: the copies of the non-long term<strong>in</strong>al<br />
repeat (LTR) retrotransposons Zorro3 and Zorro2 were<br />
equivalent to or more than SC5314; Copies of LTR-retrotransposons<br />
Tca2, Tca3, and Tca8 were equivalent to or less<br />
than SC5314; Copies of LTR-retrotransposon Tca17 were<br />
equivalent to SC5314 <strong>in</strong> all test isolates; and copies of LTRretrotransposons<br />
Tca4 and TCA11 were equivalent to, more<br />
or less than SC5314 <strong>in</strong> different isolates. Taken together, of<br />
the 354 shared variable genes, eleven genes (orf19.7274,<br />
orf19.7275, orf19.559, orf19.2371, orf19.2372, orf19.2219,<br />
orf19.6078, orf19.6079, orf19.2668, orf19.2669, orf19.6469)<br />
were retrotransposon ORFs. With<strong>in</strong> the retrotransposon sequence,<br />
<strong>in</strong> addition to the retrotransposon ORFs encod<strong>in</strong>g<br />
gag or pol prote<strong>in</strong>s, there are some other predicted ORFs<br />
with the sequence not similar to gag or pol region. There<br />
genes can be classified as predicted ORFs located <strong>in</strong> the<br />
Fig. 2. Scatter Plot for Chromosome 6 from Eight Cl<strong>in</strong>ical Isolates<br />
X axis <strong>in</strong>dicates the position of the genes on chromosome 6. Y axis is the average<br />
ratio (test/control) of each gene, as revealed by array CGH. Name of each cl<strong>in</strong>ical isolate<br />
is <strong>in</strong>dicated on the right. The black frame encompasses the variable region.<br />
retrotransposon. Array CGH revealed that, five variable<br />
genes (orf19.7272, orf19, 7277, orf19.562, orf19.6078.1,<br />
orf19.6465) belonged to this category.<br />
A Variable Region on Chromosome 6 In addition to<br />
sub-telomeric regions and retrotransposon <strong>in</strong>sertion sites, we<br />
found a region on chromosome 6 where genes displayed<br />
high-frequency loss or ga<strong>in</strong> of the copy number. This region<br />
spans approximately 11.782 kb with chromosomal coord<strong>in</strong>ates<br />
195973 to 207755 (Fig. 2) and conta<strong>in</strong>s eight ORFs:<br />
RIM9 (orf19.101), orf19.102, KAR5 (orf19.103), orf19.104,<br />
HAL22 (orf19.105), orf19.107, orf19.109, and CAN2
May 2011 629<br />
Table 5. Comparsion of Retrotransposon Copy Numbers between Control and Test Isolates as Revealed by Array CGH<br />
Retrotransposon Orf<br />
(orf19.111). A total of four genes RIM9, orf19.102; KAR5,<br />
and orf19.104 encode prote<strong>in</strong>s with unknown functions and<br />
the rest four genes are annotated with molecular functions:<br />
HAL22 is a putative phosphoadenos<strong>in</strong>e-5-phosphate (PAP)<br />
or 3-phosphoadenos<strong>in</strong>e 5-phosphosulfate (PAPS) phosphatase;<br />
orf19.107 is an RNA helicase; orf19.109 is an<br />
tyros<strong>in</strong>-tRNA ligase; while CAN2 is an arg<strong>in</strong><strong>in</strong>e transmembrane<br />
transporter. Consensus FDRs was less than 0.001 for<br />
this region. qPCR confirmed the copy number variations of<br />
the above genes (Table 4).<br />
Functional Analysis of Genes with Copy Number <strong>Variations</strong><br />
We attempted to analyze the molecular functions of<br />
158 annotated genes that were shared between at least two<br />
isolates, with the Gene Onthology (GO) Term F<strong>in</strong>der, as well<br />
as with GO Slim Mapper. Both tools are provided by the<br />
Candida Genome Database (CGD). Go Term F<strong>in</strong>der searches<br />
for GO terms significantly shared by the query genes. The<br />
p-value was set to be 0.1. GO Slim Mapper maps annotations<br />
of a group of genes to more general terms and/or b<strong>in</strong>s<br />
them <strong>in</strong>to broad categories. We used chi-square test for significance<br />
analysis of the GO Slim Mapper result. For Go<br />
Term F<strong>in</strong>der, the query set was the 158 variable genes with<br />
annotations of molecular functions, and the background set<br />
of genes was specified as the total of C. albicans genes annotated<br />
with molecular functions, exclud<strong>in</strong>g genes with unknown<br />
function. We found no enrichment <strong>in</strong> any functional<br />
category with the two tools.<br />
Aneuploidy of an Entire Chromosome or a Large Portion<br />
of Chromosome Array CGH unambiguously revealed<br />
chromosomal aneuploidy <strong>in</strong> two isolates: the duplication of<br />
an entire chromosome 1 <strong>in</strong> S197 and the loss of an approximately<br />
55 kb portion of chromosome R <strong>in</strong> S241, as presented<br />
<strong>in</strong> Fig. 3. The segmental aneuploidy <strong>in</strong> S241 extended from<br />
479692 to 535105 bp encompass<strong>in</strong>g a total of twenty genes.<br />
One gene, orf19.3746, was excluded from array CGH analysis<br />
because of the bad hybridization efficiency of genomic<br />
DNA from both SC5314 and S241 with the probes on the microarray.<br />
Ratios (S241/SC5314) of three genes, orf19.3749,<br />
orf19.3735, and orf19.3734, were approximately 1.0, thus,<br />
imply<strong>in</strong>g no change of the DNA amounts. A simple explanation<br />
of this result is the translocation of these genes on the<br />
other chromosome(s). Ratios of the rema<strong>in</strong><strong>in</strong>g sixteen genes<br />
were approximately 0.5, which <strong>in</strong>dicated the loss of one<br />
copy.<br />
In addition, we found that the MTLa locus on chromosome<br />
5 that spans approximately 9 kb is homozygous <strong>in</strong> S727. Although<br />
our microarrays lacked the probes represent<strong>in</strong>g the<br />
OBPa, PIKa, PAPa, and MTLa2 genes from the MTLa<br />
locus, we used PCR approach to amplify these genes from<br />
both MTL loci from the same batch of genomic DNA, which<br />
we used for array CGH. We found MTLa, but no MTLa<br />
locus (Fig. 4A, Table 6). Furthermore, we used qPCR to confirm<br />
that the MTLa locus is present <strong>in</strong> two copies (Fig. 4B,<br />
Table 3). Future research is needed to establish if the entire<br />
chromosome 5 or, alternatively, one copy of MTL was lost<br />
and subsequently duplicated.<br />
DISCUSSION<br />
Ratio (test/control)<br />
P546 U885 F32 S241 S904 S204 S197 S727<br />
Zorro2(0.017 a) ) Orf19.7274 0.94 1.41 1.25 1.03 1.42 1.68 0.88 1.47<br />
Orf19.7275 1.12 1.23 1.54 1.02 1.44 1.65 0.80 1.66<br />
Zorro3(0.19) Orf19.559 1.04 1.06 1.32 1.09 0.92 1.11 1.05 3.30<br />
Tca2(1.2E-06) Orf19.2371 0.01 0.46 0.97 0.36 1.00 0.52 0.01 0.48<br />
Orf19.2372 0.03 0.46 1.34 0.36 1.80 0.46 0.02 0.42<br />
Tca3(5.1E-05) Orf19.2219 0.42 0.68 0.30 0.41 0.39 0.80 0.25 0.86<br />
Tca8 (5.12E-05) Orf19.6078 0.42 0.39 0.58 0.97 0.30 0.33 0.75 0.81<br />
Orf19.6079 0.29 0.34 0.29 0.91 0.28 0.32 0.81 0.81<br />
Tca17(1) Orf19.6807 1.01 0.98 0.94 0.96 0.98 0.95 0.97 0.97<br />
Tca4(0.0016) Orf19.2668 0.10 0.10 0.07 0.97 1.89 1.03 1.00 0.93<br />
Orf19.2669 0.10 0.10 0.06 0.96 1.90 1.02 1.08 1.03<br />
Tca11(1.2E-06) Orf19.6469 0.26 0.53 0.22 1.59 1.08 0.49 0.12 1.20<br />
a) Consensus FDR across all the test samples.<br />
Fig. 3. Segmental Loss on Chromosome R <strong>in</strong> Isolate S241<br />
Panel A: Each row corresponds to a specific spot (gene) on the microarray. The genes<br />
are arranged accord<strong>in</strong>g to their chromosomal coord<strong>in</strong>ates on chromosome R. Each column<br />
corresponds to a test isolate. The status of each gene is <strong>in</strong>dicated as follows: black,<br />
present; red, amplified; green, absent. The hybridization ratios are <strong>in</strong> logarithmic scale.<br />
Panel B presents the systemic names and array CGH profiles of these genes.<br />
The extent of genomic variation with<strong>in</strong> a species is
630 Vol. 34, No. 5<br />
Fig. 4. Homozygosity at the MTL Locus <strong>in</strong> Isolate S727<br />
Panel A is the result of PCR amplification of the MTLa locus genes (MTLa1, PIKa, PAP1, OBPa) and the MTLa locus genes (MTLa2, PIKa, PAPa, OBPa) with genomic DNA<br />
of isolates SC5314 and S727 as templates. Panel B is the result of qPCR analysis of the copies of MTL locus genes <strong>in</strong> S727 as compared to SC5314. Array CGH profile of the<br />
MTLa locus genes is also presented.<br />
Table 6. Primers Used for PCR Amplification of MTL Locus Genes<br />
Name Sequence (5–3)<br />
MTLa1 Fwd: AGAATGAAGACAACGAGGA<br />
Rev: CTTACTGTGGGAAAAATGA<br />
MTLa2 Fwd: ATGAATTCACATCTGGAGGC<br />
Rev: CTGTTAATAGCAAAGCAGCC<br />
PIKa Fwd: CATCTGAGGTCATCAAGTAGG<br />
Rev: GTGAGTCAACCAGTCCGTAAA<br />
PIKa Fwd: GTTACCCCTTCTATTACGG<br />
Rev: TGACCATCTCCATCTACCA<br />
OBPa Fwd: AATTGCTGGTCGCTGATCG<br />
Rev: ATTATTCCCAATGTGTGCCAAC<br />
OBPa Fwd: AATTTATCCAGCGAACATGCAC<br />
Rev: CTTCTGTCCTGGAACAATCGG<br />
PAP1 Fwd: AATCAAGCATACGGTGTTACAC<br />
Rev: CCTCATGTCGCCAACCACAG<br />
PAPa Fwd: CAAGAGTGACCGATGAGATA<br />
Rev: CGCCTTCAGTAAAAGATGTA<br />
believed to contribute to the species survival <strong>in</strong> their natural<br />
environment. 25) Previous study of the C. albicans isolate<br />
ATCC10231 identified 42 variable genes, <strong>in</strong>clud<strong>in</strong>g 5 amplified,<br />
and 37 absent/divergent genes, as compared with<br />
SC5314. 16) It is of <strong>in</strong>terest, that we found that 20 of the 42<br />
variable genes <strong>in</strong> ATCC10231 were also amplified or<br />
absent/divergent <strong>in</strong> our isolates. However, <strong>in</strong> contrast to the<br />
ATCC10231, eight cl<strong>in</strong>ical isolates from this study revealed<br />
higher genomic variability. Of the 6111 chromosomal genes<br />
represented on our microarrays, approximately 1116 genes<br />
(18.3%) differed, as compared to the reference stra<strong>in</strong><br />
SC4314. The absent/divergent genes, rang<strong>in</strong>g from 88 to<br />
302, prevailed <strong>in</strong> a total of seven isolates, while the amplified<br />
genes prevailed <strong>in</strong> one isolate, S197, which was trisomic of<br />
chromosome 1. In this regard, full or segmental aneuploidy<br />
of different chromosomes that we found <strong>in</strong> three isolates also<br />
seems to be a frequent event. Aneuploidy of the entire chromosomes<br />
or large portions of chromosomes was previously<br />
largely <strong>in</strong>vestigated <strong>in</strong> C. albicans. 3,14,15,26) Aneuploidy was<br />
revealed <strong>in</strong> cl<strong>in</strong>ical isolates, 27—29) as well as <strong>in</strong> vitro experiments<br />
that established formation of a specific chromosome alteration<br />
<strong>in</strong> response to a specific stressful environment. 3,30—32)<br />
Our analysis with GO Term F<strong>in</strong>der showed no significant<br />
enrichment of any functional category among variable genes<br />
from different isolates. We <strong>in</strong>terpreted this fact, as an <strong>in</strong>dication<br />
that variability is not related to the function of the variable<br />
genes, but rather to the structural features of DNA. Indeed,<br />
substantial portion number of variations among genes<br />
occurred <strong>in</strong> the same regions on chromosomes <strong>in</strong> different<br />
isolates. These <strong>in</strong>cluded sub-telomeric regions, retrotransposon-<strong>in</strong>sertion<br />
sites, and other regions. Genome variability at<br />
sub-telomeric regions has been reported <strong>in</strong> such different<br />
organisms, as, for example, humans and S. cerevisiae, and is<br />
thought to result from ectopic recomb<strong>in</strong>ation. 33,34) C. albicans<br />
sub-telomeric regions conta<strong>in</strong> repetitive sequences, <strong>in</strong>clud<strong>in</strong>g,<br />
for example, CARE-2 or Rel-2. 35) These sequences<br />
might contribute to the sub-telomeric <strong>in</strong>stability.<br />
Retrotransposon-<strong>in</strong>sertion sites are known as regions that<br />
generate high genome diversity between yeast isolates and<br />
species. 36,37) In the stra<strong>in</strong> ATCC10231, 11 of the 42 variable<br />
genes were shown to be retrotransposon ORFs. 16) In this<br />
study, we revealed the high variability <strong>in</strong> retrotransposon<br />
composition, with copy number variations of retrotransposon
May 2011 631<br />
ORFs as well as predicted ORFs located with<strong>in</strong> retrotransposon.<br />
The high retrotransposon variability observed <strong>in</strong> this<br />
study raises the question whether the reduced number of<br />
retrotransposons could result from selective pressures that<br />
affect particular regions of the genome <strong>in</strong> response to adaptation<br />
to particular environments, and the <strong>in</strong>creased number of<br />
retrotransposons results from stress-activated transposition.<br />
Among the seven retrotransposons identified with copy number<br />
variations, Zorro2, Zorro3, and Tca2 are active. 38,39)<br />
In addition to sub-telomeric regions and retrotransposon<strong>in</strong>sertion<br />
sites, some variable genes were clustered <strong>in</strong> a region<br />
on chromosome 6 start<strong>in</strong>g from 19.5973 to 20.6049 kb. A<br />
total of 6 of the 8 genes <strong>in</strong> this region varied <strong>in</strong> at least 3 of<br />
the 8 test isolates. This region was previously reported highly<br />
polymorphic <strong>in</strong> C. albicans genome. 40)<br />
In summary, this work provides the first comprehensive<br />
evaluation of <strong>in</strong>traspecies genomic variation with cl<strong>in</strong>ical<br />
isolates of C. albicans. We found genomic variability <strong>in</strong> different<br />
chromosomal locations scattered across the chromosomes,<br />
as well as clustered with high-frequency <strong>in</strong> certa<strong>in</strong><br />
portions of chromosomes, <strong>in</strong>clud<strong>in</strong>g the sub-telomeric<br />
regions, retrotransposon-<strong>in</strong>sertion sites, as well as a variable<br />
region on chromosome 6. Genes of diverse molecular functions<br />
were <strong>in</strong>volved, thus, <strong>in</strong>dicat<strong>in</strong>g that, at least <strong>in</strong> some<br />
cases, the cause of the variability could be the structural features<br />
of the chromosomal regions. Further research is needed<br />
to elucidate the molecular mechanisms of the variability.<br />
Acknowledgements We thank Professor William A.<br />
Fonzi for the gift of SC5314. We are grateful to Dr. Liang<br />
Zhang, Dr. Yi-M<strong>in</strong> Sun, and Dr. Jian-Q<strong>in</strong>g Zhao of Beij<strong>in</strong>g<br />
CapitalBio Corporation for their k<strong>in</strong>d help of microarray<br />
experiment. This work was supported by National <strong>High</strong><br />
Technology Research and Development Program of Ch<strong>in</strong>a<br />
2008AA02Z128, Major State Basic Research Development<br />
Program 2005CB523105, and Shanghai Major Basic Research<br />
Development Program 08JC1405900.<br />
REFERENCES<br />
1) Eggimann P., Garb<strong>in</strong>o J., Pittet D., Lancet Infect. Dis., 3, 685—702<br />
(2003).<br />
2) Gudlaugsson O., Gillespie S., Lee K., Vande Berg J., Hu J., Messer S.,<br />
Herwaldt L., Pfaller M., Diekema D., Cl<strong>in</strong>. Infect. Dis., 37, 1172—<br />
1177 (2003).<br />
3) Rustchenko E., FEMS Yeast Res., 7, 2—11 (2007).<br />
4) Rustchenko E., Sherman F., “Fungi Pathogenic for Humans and Animals,”<br />
ed. by Howard D. H., Vol. 16, Marcel Dekker, New York, 2002.<br />
5) Selmecki A., Forche A., Berman J., Eukaryot. Cell., 9, 991—1008<br />
(2010).<br />
6) Iwaguchi S., Homma M., Tanaka K., J. Gen. Microbiol., 136, 2433—<br />
2442 (1990).<br />
7) Rustchenko-Bulgac E. P., J. Bacteriol., 173, 6586—6596 (1991).<br />
8) Thrash-B<strong>in</strong>gham C., Gorman J. A., Curr. Genet., 22, 93—100 (1992).<br />
9) Rustchenko E. P., Curran T. M., Sherman F., J. Bacteriol., 175, 7189—<br />
7199 (1993).<br />
10) Rustchenko E. P., Howard D. H., Sherman F., J. Bacteriol., 176,<br />
3231—3241 (1994).<br />
11) Perepnikhatka V., Fischer F. J., Niimi M., Baker R. A., Cannon R. D.,<br />
Wang Y. K., Sherman F., Rustchenko E., J. Bacteriol., 181, 4041—<br />
4049 (1999).<br />
12) Chibana H., Beckerman J. L., Magee P. T., Genome Res., 10, 1865—<br />
1877 (2000).<br />
13) Magee B. B., Sanchez M. D., Saunders D., Harris D., Berriman M.,<br />
Magee P. T., Fungal Genet. Biol., 45, 338—350 (2008).<br />
14) Andaluz E., Gomez-Raja J., Hermosa B., Ciudad T., Rustchenko E.,<br />
Calderone R., Larriba G., Fungal Genet. Biol., 44, 789—798 (2007).<br />
15) Ahmad A., Kabir M. A., Kravets A., Andaluz E., Larriba G.,<br />
Rustchenko E., Yeast, 25, 433—448 (2008).<br />
16) Thewes S., Moran G. P., Magee B. B., Schaller M., Sullivan D. J.,<br />
Hube B., BMC Microbiol., 8, 187 (2008).<br />
17) Daran-Lapujade P., Daran J. M., Kotter P., Petit T., Piper M. D., Pronk<br />
J. T., FEMS Yeast Res., 4, 259—269 (2003).<br />
18) Carreto L., Eiriz M. F., Gomes A. C., Pereira P. M., Schuller D., Santos<br />
M. A., BMC Genomics, 9, 524 (2008).<br />
19) McCullough M. J., Clemons K. V., Stevens D. A., J. Cl<strong>in</strong>. Microbiol.,<br />
37, 417—421 (1999).<br />
20) Hoffman C. S., W<strong>in</strong>ston F., Gene, 57, 267—272 (1987).<br />
21) Yang Y. H., Dudoit S., Luu P., L<strong>in</strong> D. M., Peng V., Ngai J., Speed T. P.,<br />
Nucleic Acids Res., 30, e15 (2002).<br />
22) Wang P., Kim Y., Pollack J., Narasimhan B., Tibshirani R., Biostatistics,<br />
6, 45—58 (2005).<br />
23) Brennan C., Zhang Y., Leo C., Feng B., Cauwels C., Aguirre A. J.,<br />
Kim M., Protopopov A., Ch<strong>in</strong> L., Cancer Res., 64, 4744—4748<br />
(2004).<br />
24) Nicolet C., Guer<strong>in</strong> E., Neuville A., Kerckaert J. P., Wicker N.,<br />
Bergmann E., Brigand C., Ked<strong>in</strong>ger M., Gaub M. P., Guenot D., Cancer<br />
Lett., 282, 195—204 (2009).<br />
25) Chaillou S., Daty M., Baraige F., Dudez A. M., Anglade P., Jones R.,<br />
Alpert C. A., Champomier-Verges M. C., Zagorec M., Appl. Environ.<br />
Microbiol., 75, 970—980 (2009).<br />
26) Selmecki A., Bergmann S., Berman J., Mol. Microbiol., 55, 1553—<br />
1565 (2005).<br />
27) Legrand M., Forche A., Selmecki A., Chan C., Kirkpatrick D. T.,<br />
Berman J., PLoS Genet., 4, e1 (2008).<br />
28) Wu W., Pujol C., Lockhart S. R., Soll D. R., <strong>Genetic</strong>s, 169, 1311—<br />
1327 (2005).<br />
29) Diogo D., Bouchier C., d’Enfert C., Bougnoux M. E., Fungal Genet.<br />
Biol., 46, 159—168 (2009).<br />
30) Rustad T. R., Stevens D. A., Pfaller M. A., White T. C., Microbiology,<br />
148, 1061—1072 (2002).<br />
31) Selmecki A., Forche A., Berman J., Science, 313, 367—370 (2006).<br />
32) Cowen L. E., Anderson J. B., Kohn L. M., Annu. Rev. Microbiol., 56,<br />
139—165 (2002).<br />
33) Liti G., Louis E. J., Annu. Rev. Microbiol., 59, 135—153 (2005).<br />
34) W<strong>in</strong>zeler E. A., Castillo-Davis C. I., Oshiro G., Liang D., Richards D.<br />
R., Zhou Y., Hartl D. L., <strong>Genetic</strong>s, 163, 79—89 (2003).<br />
35) Chibana H., Magee B. B., Gr<strong>in</strong>dle S., Ran Y., Scherer S., Magee P. T.,<br />
<strong>Genetic</strong>s, 149, 1739—1752 (1998).<br />
36) Fischer G., James S. A., Roberts I. N., Oliver S. G., Louis E. J., Nature<br />
(London), 405, 451—454 (2000).<br />
37) Garf<strong>in</strong>kel D. J., Cytogenet. Genome Res., 110, 63—69 (2005).<br />
38) Goodw<strong>in</strong> T. J., Ormandy J. E., Poulter R. T., Curr. Genet., 39, 83—91<br />
(2001).<br />
39) Holton N. J., Goodw<strong>in</strong> T. J., Butler M. I., Poulter R. T., Nucleic Acids<br />
Res., 29, 4014—4024 (2001).<br />
40) Jones T., Federspiel N. A., Chibana H., Dungan J., Kalman S., Magee<br />
B. B., Newport G., Thorstenson Y. R., Agabian N., Magee P. T., Davis<br />
R. W., Scherer S., Proc. Natl. Acad. Sci. U.S.A., 101, 7329—7334<br />
(2004).