Microbiology and Spoilage Trail in Nile Perch (Lates niloticus), Lake ...
Microbiology and Spoilage Trail in Nile Perch (Lates niloticus), Lake ...
Microbiology and Spoilage Trail in Nile Perch (Lates niloticus), Lake ...

Create successful ePaper yourself
Turn your PDF publications into a flip-book with our unique Google optimized e-Paper software.
1<br />
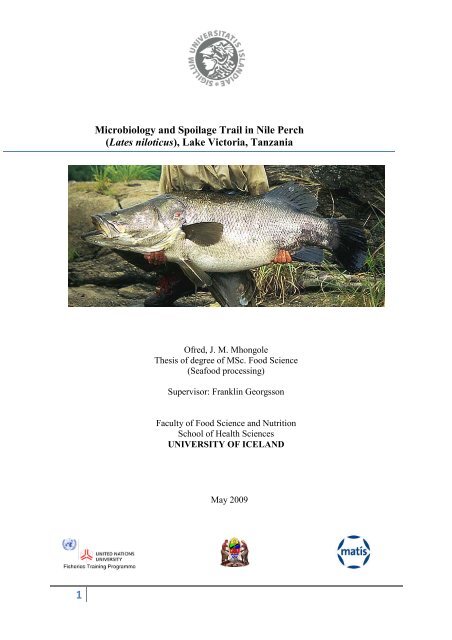
<strong>Microbiology</strong> <strong>and</strong> <strong>Spoilage</strong> <strong>Trail</strong> <strong>in</strong> <strong>Nile</strong> <strong>Perch</strong><br />
(<strong>Lates</strong> <strong>niloticus</strong>), <strong>Lake</strong> Victoria, Tanzania<br />
Ofred, J. M. Mhongole<br />
Thesis of degree of MSc. Food Science<br />
(Seafood process<strong>in</strong>g)<br />
Supervisor: Frankl<strong>in</strong> Georgsson<br />
Faculty of Food Science <strong>and</strong> Nutrition<br />
School of Health Sciences<br />
UNIVERSITY OF ICELAND<br />
May 2009
2<br />
<strong>Microbiology</strong> <strong>and</strong> <strong>Spoilage</strong> <strong>Trail</strong> <strong>in</strong> <strong>Nile</strong> perch<br />
(<strong>Lates</strong> <strong>niloticus</strong>) <strong>Lake</strong> Victoria, Tanzania<br />
A thesis submitted for a partial fulfilment of the requirement for the degree of<br />
Masters of Science <strong>in</strong> Food Science<br />
(Seafood Process<strong>in</strong>g)<br />
Faculty of Food Science <strong>and</strong> Nutrition,<br />
School of Health Sciences<br />
University of Icel<strong>and</strong><br />
Reykjavik, ICELAND.<br />
Franklín Georgsson, MSc.<br />
Gudjon Thorkelsson, MSc.<br />
Ofred, J. M. Mhongole<br />
National Fish Quality Control Laboratory (NFQCL)-Nyegezi<br />
(M<strong>in</strong>istry of Livestock Development <strong>and</strong> Fisheries)<br />
P. O. Box 1213, Mwanza, TANZANIA<br />
Email: nfqcl_mz@yahoo.co.uk; ojmmhongole@yahoo.co.uk<br />
©May 2009
i<br />
DECLARATION<br />
I wish to declare that this work is sole done by me.<br />
And was not done <strong>and</strong> submitted at any place before.
ii<br />
DEDICATION<br />
I sole dedicate output of this work to my beloved daughters (tw<strong>in</strong>s) <strong>and</strong> their mother<br />
For accept<strong>in</strong>g <strong>and</strong> miss<strong>in</strong>g my company through all of the study period
iii<br />
ABSTRACT<br />
The microbiological spoilage trail <strong>and</strong> storage time for iced whole <strong>Nile</strong> perch (<strong>Lates</strong><br />
<strong>niloticus</strong>) <strong>and</strong> chilled fillets were studied. Similarly, microorganisms of surface lake water,<br />
bottom sediments <strong>and</strong> whole <strong>Nile</strong> perch from fish<strong>in</strong>g grounds <strong>in</strong> Mwanza gulf was analysed<br />
<strong>in</strong> phase I. Phase II <strong>and</strong> III <strong>in</strong>cluded iced whole <strong>Nile</strong> perch, laboratory <strong>and</strong> four<br />
establishments’ chilled fillets, <strong>and</strong> all were stored at 0-3 o C dur<strong>in</strong>g shelf life study. Hence,<br />
the ma<strong>in</strong> goal of the study was to check prevalence of certa<strong>in</strong> human pathogens, ma<strong>in</strong><br />
spoilage organisms <strong>and</strong> establish shelf life (storage time) as well as effect of short <strong>and</strong> long<br />
storage of whole <strong>Nile</strong> perch <strong>in</strong> ice prior to process<strong>in</strong>g <strong>in</strong>to chilled fillets.<br />
The results showed variable bacteria counts for sediments <strong>and</strong> <strong>Nile</strong> perch guts while lake<br />
water results were approximately below method detection limit 0-20cfu/ml. It was<br />
concluded that human pathogens occasionally may be derived from fish<strong>in</strong>g grounds<br />
environments. The average keep<strong>in</strong>g quality (shelf life) <strong>in</strong> days for iced whole <strong>Nile</strong> perch,<br />
laboratory <strong>and</strong> establishments chilled fillets were 26-28; 17; 8-13 days respectively. Shelf<br />
life was short (8 days) for <strong>Nile</strong> perch fillets produced from long time (17 days) stored<br />
whole <strong>Nile</strong> perch <strong>in</strong> ice before process<strong>in</strong>g. In this work, the ma<strong>in</strong> spoilage organism’s<br />
composition <strong>in</strong> spoiled whole <strong>Nile</strong> perch <strong>and</strong> chilled fillets may <strong>in</strong>clude Shawenella<br />
putrefaciens, Vibrionaceae / Aeromonas, Pseudomonas, <strong>and</strong> Enterobacteriaceae. For both<br />
sensory/organoleptic (QIM score) assessment <strong>and</strong> microbiological methods were consistent<br />
while chemical method was not reliable dur<strong>in</strong>g early storages. Accord<strong>in</strong>gly it was suggested<br />
that the chemical (TVB-N) parameter is not reliable <strong>in</strong>dicator for freshness quality of iced<br />
whole <strong>Nile</strong> perch as well as chilled fillets.<br />
Keywords: <strong>Nile</strong> perch, chilled fillets, specific spoilage organisms (SSO); spoilage micro<br />
flora, chemical (TVB-N) <strong>and</strong> storage days.
iv<br />
TABLE OF CONTENTS<br />
DECLARATION ........................................................................................................................ I<br />
DEDICATION ........................................................................................................................... II<br />
ABSTRACT ............................................................................................................................. III<br />
1 INTRODUCTION .............................................................................................................. 1<br />
1.1 QUALITY AND SAFETY ASSURANCE OF EXPORTED FISH AND FISH PRODUCTS FROM TANZANIA ................. 2<br />
1.2 JUSTIFICATION OF THE STUDY ....................................................................................................................... 4<br />
1.2.1 Objectives............................................................................................................................................. 5<br />
2 BACK GROUND ............................................................................................................... 7<br />
2.1 MICROBIOLOGICAL SAFETY HAZARDS IN FISH INDUSTRY ............................................................................. 7<br />
2.2 RIGOR MORTIS AND POST HARVEST STORAGE OF FRESH FISH IN ICE .......................................................... 9<br />
2.3 FRESH FISH SPOILAGE .................................................................................................................................... 9<br />
2.3.1 Microbiological spoilage of fresh fish ................................................................................................ 10<br />
2.3.2 Biochemical spoilage of fresh fish ...................................................................................................... 14<br />
2.4 STAGES OF SPOILAGE FOR ICED FRESH FISH ............................................................................................... 16<br />
2.5 FACTORS CONTRIBUTING ON FISH SPOILAGE ............................................................................................. 18<br />
2.5.1 Temperature ...................................................................................................................................... 19<br />
2.6 METHODS FOR ASSESSMENT OF FRESH FISH QUALITY ............................................................................... 22<br />
2.6.1 Sensory (qualitative) methods ........................................................................................................... 22<br />
2.6.2 Physical methods ............................................................................................................................... 23<br />
2.6.3 Microbiological methods ................................................................................................................... 24<br />
2.6.4 Chemical methods ............................................................................................................................. 26<br />
3 MATERIALS AND METHODS ..................................................................................... 28<br />
3.1 STUDY AREA AND SAMPLING PLAN ............................................................................................................. 28<br />
3.2 SAMPLING .................................................................................................................................................... 29<br />
3.2.1 Phase I: <strong>Microbiology</strong> of Water, Sediments <strong>and</strong> <strong>Nile</strong> <strong>Perch</strong>. ............................................................. 29<br />
3.2.2 Phase II: Shelf life for Laboratory iced whole <strong>Nile</strong> perch <strong>and</strong> chilled fillets ....................................... 30<br />
3.2.3 Phase III: <strong>Microbiology</strong> of whole <strong>Nile</strong> perch swabs, on l<strong>in</strong>e fillets <strong>and</strong> shelf life of establishments<br />
chilled fillets ..................................................................................................................................................... 31<br />
3.3 PROCEDURES ............................................................................................................................................... 32<br />
3.3.1 Sensory (orgnoleptic) assessment ..................................................................................................... 32<br />
3.3.2 Microbiological analysis ..................................................................................................................... 33<br />
3.3.3 Chemical analysis ............................................................................................................................... 39<br />
3.3.4 Data analysis ...................................................................................................................................... 39
4 RESULTS......................................................................................................................... 40<br />
4.1 PHASE I: MICROBIOLOGY OF WATER, SEDIMENTS AND WHOLE NILE PERCH ............................................. 40<br />
4.1.1 Phase I trial 1: Water .......................................................................................................................... 40<br />
4.1.2 Phase I trial 2: Sediments ................................................................................................................... 41<br />
4.1.3 Phase I trial 3: Whole <strong>Nile</strong> perch ........................................................................................................ 41<br />
4.2 PHASE II: SHELF LIFE OF LABORATORY ICED WHOLE NILE PERCH AND CHILLED FILLETS ............................ 43<br />
4.2.1 Phase II trial 1: Shelf life of iced whole <strong>Nile</strong> perch ............................................................................. 43<br />
4.2.2 Phase II trial 2: Shelf life of laboratory chilled <strong>Nile</strong> perch fillets ........................................................ 47<br />
4.3 PHASE III: MICROBIOLOGY OF WHOLE NILE PERCH SWABS, ON LINE FILLETS AND SHELF LIFE OF<br />
ESTABLISHMENTS CHILLED FILLETS ....................................................................................................................... 49<br />
4.3.1 Phase III - Trial 1: <strong>Microbiology</strong> of whole <strong>Nile</strong> perch swabs <strong>and</strong> onl<strong>in</strong>e fillets ................................... 49<br />
4.3.2 Phase III – Trial 2: Shelf life of establishments chilled fillets .............................................................. 51<br />
4.4 PRESUMPTIVE SSOs ..................................................................................................................................... 56<br />
4.5 SHELF LIFE OF ICED WHOLE NILE PERCH AND CHILLED FILLETS .................................................................. 57<br />
5 DISCUSSION .................................................................................................................. 58<br />
5.1 PHASE I: NATURAL MICROBIOLOGY OF WATER, SEDIMENTS AND WHOLE NILE PERCH ............................ 58<br />
5.1.1 Phase I trial 1: Water .......................................................................................................................... 58<br />
5.1.2 Phase I trial 2: Sediments ................................................................................................................... 58<br />
5.1.3 Phase I trial 3: Whole <strong>Nile</strong> perch ........................................................................................................ 59<br />
5.2 PHASE II: SHELF LIFE OF LABORATORY ICED WHOLE NILE PERCH AND CHILLED FILLETS ............................ 59<br />
5.2.1 Phase II trial 1: Shelf life of iced whole <strong>Nile</strong> perch ............................................................................. 59<br />
5.2.2 Phase II trial 2: Shelf life of laboratory chilled fillets .......................................................................... 62<br />
5.3 PHASE III: MICROBIOLOGY OF WHOLE NILE PERCH SWABS, ON LINE FILLETS AND SHELF LIFE OF<br />
ESTABLISHMENTS CHILLED FILLETS ....................................................................................................................... 63<br />
5.3.1 Phase III - Trial 1: <strong>Microbiology</strong> of whole <strong>Nile</strong> perch swabs <strong>and</strong> onl<strong>in</strong>e fillets ................................... 63<br />
5.3.2 Phase III – Trial 2: Shelf life of establishments chilled <strong>Nile</strong> perch fillets ............................................ 65<br />
5.4 PRESUMPTIVE SSO ....................................................................................................................................... 68<br />
6 CONCLUSIONS AND RECOMMENDATION ............................................................. 69<br />
6.1 CONCLUSIONS ............................................................................................................................................. 69<br />
6.2 RECOMMENDATION .................................................................................................................................... 70<br />
ACKNOWLEDGEMENT ....................................................................................................... 71<br />
REFERENCES ......................................................................................................................... 72<br />
APPENDICES .......................................................................................................................... 83<br />
v
vi<br />
LIST OF FIGURES<br />
FIGURE 1: REPARIAN DISTRICTS ALONG LAKE VICTORIA SHORE LINE ( TANZANIA;<br />
UGANDA AND KENYA) ...................................................................................................................... 1<br />
FIGURE 2: SKETCH MAP OF THE SOUTH-EAST PART OF LAKE VICTORIA. FISHING GROUNDS OF<br />
THE VARIOUS LANDING SITES ARE INDICATED BY SHADING. S: SEMBA; I: IGOMBE AND<br />
K: KAYENZE, (FAO, 2009). ...................................................................................................................... 28<br />
FIGURE 3: 10 DAY’S WHOLE NILE PERCH (#1-3) FROM LEFT AND 33 DAYS WHOLE NILE PERCH<br />
(#4-SPOILED) RIGHT, RESPECTIVELY DURING STORAGE IN ICE AT LABORATORY CHILL<br />
ROOM (0-3 0 C). ........................................................................................................................................... 43<br />
FIGURE 4: QIM SCORE FOR WHOLE NILE PERCH DURING STORAGE IN ICE. .................................... 44<br />
FIGURE 5: MAIN CONTRIBUTING ATTRIBUTES TO QIM SCORE FOR WHOLE NILE PERCH DURING<br />
STORAGE IN ICE, (GA: GENERAL APPEARANCE). ........................................................................... 44<br />
FIGURE 6: CHANGES OF SPECIFIC SPOILAGE ORGANISM (SSO), TOTAL VIABLE COUNTS (TVC)<br />
AND ENTEROBACTERIACEAE (ENT.) ON ......................................................................................... 45<br />
FIGURE 7: CHANGES OF SPECIFIC SPOILAGE ORGANISM (SSO), TOTAL VIABLE COUNTS (TVC),<br />
ENTEROBACTERIACEAE (ENT.) AND QIM SCORE IN WHOLE NILE PERCH DURING STORAGE<br />
IN ICE. ........................................................................................................................................................ 46<br />
FIGURE 8: CHANGES OF SPECIFIC SPOILAGE ORGANISM (SSO), TOTAL VIABLE COUNTS (TVC),<br />
ENTEROBACTERIACEAE (ENT.) AND .................................................................................................... 46<br />
FIGURE 9: CHANGES OF TVB-N IN WHOLE NILE PERCH DURING STORAGE IN ICE. ........................ 47<br />
FIGURE 10: CHANGES OF QIM AND TVBN IN WHOLE NILE PERCH DURING STORAGE IN ICE...... 47<br />
FIGURE 11: CHANGES OF SPECIFIC SPOILAGE ORGANISM (SSO), TOTAL VIABLE COUNTS (TVC)<br />
AND ENTEROBACTERIACEAE (ENT.) IN CHILLED FILLETS FROM NEWLY CAUGHT NILE<br />
PERCH. ....................................................................................................................................................... 48<br />
FIGURE 12: CHANGES OF TVB-N IN CHILLED FILLETS FROM NEWLY CAUGHT NILE PERCH. ...... 48<br />
FIGURE 13: CHANGES OF SPECIFIC SPOILAGE ORGANISMS (SSO), TOTAL VIABLE COUNTS (TVC),<br />
ENTEROBACTERIACEAE (ENT.) AND TVB-N IN CHILLED FILLETS FROM NEWLY CAUGHT<br />
NILE PERCH. ............................................................................................................................................. 49<br />
FIGURE 14: WHOLE NILE PERCH IN STAINLESS CONTAINER AFTER WASHING AT<br />
ESTABLISHMENTS. ................................................................................................................................. 50<br />
FIGURE 15: CHANGES OF SPECIFIC SPOILAGE ORGANISMS (SSO), TOTAL VIABLE COUNTS (TVC)<br />
AND ENTEROBACTERIACEAE (ENT.) ON CHILLED FILLETS IN E1. ............................................... 52<br />
FIGURE 16: CHANGES OF TVB-N ON CHILLED FILLETS IN E1 ............................................................... 52<br />
FIGURE 17: CHANGES OF SPECIFIC SPOILAGE ORGANISM (SSO), TOTAL VIABLE COUNTS (TVC),<br />
ENTEROBACTERIACEAE (ENT.) AND TVB-N ON CHILLED FILLETS.............................................. 52<br />
FIGURE 18: CHANGES OF SPECIFIC SPOILAGE ORGANISM (SSO), TOTAL VIABLE COUNTS (TVC)<br />
AND ENTEROBACTERIACEAE (ENT.) ON CHILLED FILLETS. .......................................................... 53<br />
FIGURE 19: CHANGES OF TVB-N ON CHILLED FILLETS .......................................................................... 53<br />
FIGURE 20: CHANGES OF SPECIFIC SPOILAGE ORGANISM (SSO), TOTAL VIABLE COUNTS (TVC)<br />
AND ENTEROBACTERIACEAE (ENT.) AND TVB-N ON CHILLED FILLETS. .................................. 53<br />
FIGURE 21: CHANGES OF SPECIFIC SPOILAGE ORGANISM (SSO), TOTAL VIABLE COUNTS (TVC)<br />
AND ENTEROBACTERIACEAE (ENT.) ON CHILLED FILLETS. ........................................................ 54<br />
FIGURE 22: CHANGES OF TVB-N ON CHILLED FILLETS. ......................................................................... 54<br />
FIGURE 23: CHANGES OF SPECIFIC SPOILAGE ORGANISMS (SSO) TOTAL VIABLE COUNTS,<br />
ENTEROBACTERIACEAE (ENT.) AND TVB ON CHILLED FILLETS. ................................................. 54<br />
FIGURE 24: CHANGES OF SPECIFIC SPOILAGE ORGANISM (SSO), TOTAL VIABLE COUNTS (TVC)<br />
AND ENTEROBACTERIACEAE (ENT.) ON CHILLED FILLETS. ........................................................ 55<br />
FIGURE 25: CHANGES OF TVB-N ON CHILLED FILLETS. ......................................................................... 55<br />
FIGURE 26: CHANGES OF SPECIFIC SPOILAGE ORGANISM (SSO), TOTAL VIABLE COUNTS (TVC),<br />
ENTEROBACTERIACEAE (ENT.) AND TVB-N ON CHILLED FILLETS............................................. 55<br />
FIGURE 27: CHILLED FILLETS FROM ESTABLISHMENTS ....................................................................... 56<br />
FIGURE 28: FLOW CHART EMPLOYED FOR IDENTIFICATION OF GRAM-NEGATIVE SPECIFIC<br />
SPOILAGE BACTERIA IN SPOILING ICED WHOLE NILE PERCH AND CHILLED FILLETS<br />
STORED AT 0-3 O C. ................................................................................................................................... 57
vii<br />
LIST OF TABLES<br />
TABLE 1: NILE PERCH EXPORT PROCESSING FLOW DIAGRAM FROM UP-STREAM TO<br />
IMPORTERS AND ASSOCIATED QUALITY CONTROL MEASURES. ................................................ 4<br />
TABLE 2: RASFF NOTIFICATION: COUNTRY OF ORIGIN TANZANIA (EC, 2006). ................................. 7<br />
TABLE 3: IDENTIFICATION TEST OF GRAM-NEGATIVE BACTERIA ..................................................... 13<br />
TABLE 4: TYPICAL SPOILAGE COMPOUNDS DURING SPOILAGE OF FRESH FISH STORED<br />
AEROBICALLY PACKED IN ICE OR AT AMBIENT TEMPERATURE, (SOURCE: HUSS, H. 1995).<br />
..................................................................................................................................................................... 13<br />
TABLE 5: STAGES OF SPOILAGE OF FRESH FISH STORED IN MELTING ICE (SOURCE: ICMSF,<br />
(1980B). ....................................................................................................................................................... 17<br />
TABLE 6: CARDINAL TEMPERATURE FOR MICROBIAL GROWTH (ADAMS AND MOSS, 2008). ...... 20<br />
TABLE 7: GENERA THAT INCLUDE PSYCHROTROPHIC BACTERIA (ICMFS, 1980A) ......................... 20<br />
TABLE 8: METHODS FOR DETERMINATION OF THE CONTENT OF BACTERIA IN SEAFOOD (HUSS,<br />
1995) ............................................................................................................................................................ 24<br />
TABLE 9: COMMONLY USED AGAR MEDIA FOR ENUMERATION AND DETECTION OF BACTERIA<br />
ASSOCIATED WITH FISH SPOILAGE, (HOVDA, 2007). ..................................................................... 26<br />
TABLE 10: FRESHNESS RATINGS USING THE QUALITY ASSESSMENT SCHEME USED TO<br />
IDENTIFY THE QUALITY INDEX DEMERIT SCORE (LARSEN ET AL. 1992) MODIFIED. ............ 33<br />
TABLE 12: MICROORGANISMS OF SURFACE LAKE WATER ................................................................... 40<br />
TABLE 13: PATHOGENIC MICROORGANISMS OF SURFACE WATER .................................................... 40<br />
TABLE 14: MICROORGANISMS OF SEDIMENTS ......................................................................................... 41<br />
TABLE 15: PATHOGENIC MICROORGANISMS OF SEDIMENTS............................................................... 41<br />
TABLE 16: PATHOGENIC MICROORGANISMS ON NILE PERCH SKIN. .................................................. 42<br />
TABLE 17: MICROORGANISMS OF NILE PERCH GUTS ............................................................................. 42<br />
TABLE 18: PATHOGENIC MICROORGANISMS OF NILE PERCH GUTS ................................................... 42<br />
TABLE 19: WHOLE NILE PERCH SWABS BEFORE AND AFTER WASH AT ESTABLISHMENTS. ....... 50<br />
TABLE 20: ON LINE NILE PERCH FILLETS BEFORE AND AFTER WASH AT ESTABLISHMENTS. ... 51<br />
TABLE 21: SHELF LIFE (ESTIMATED) AND SPOILAGE MICRO FLORA OF ICED WHOLE NILE<br />
PERCH AND CHILLED FILLETS STORED AT 0-3 O C ........................................................................... 57
1 INTRODUCTION<br />
<strong>Nile</strong> perch (<strong>Lates</strong> <strong>niloticus</strong>) which is a native to Ethiopia country was <strong>in</strong>troduced <strong>in</strong> the<br />
<strong>Lake</strong> Victoria dur<strong>in</strong>g late 1950s <strong>and</strong> also to other lakes <strong>in</strong> Africa. <strong>Lake</strong> Victoria, world’s<br />
second largest fresh water body (second only to <strong>Lake</strong> Superior of North America <strong>in</strong> size)<br />
<strong>and</strong> the largest <strong>in</strong> the develop<strong>in</strong>g world, it occupies a surface area of 68,800km 2 , <strong>and</strong><br />
catchment area of 284,000 km 2 . It has a shore l<strong>in</strong>e of approximately 3,500km long. The<br />
lake touches the Equator <strong>in</strong> its northern reaches <strong>and</strong> lies between latitude 0.7 0 N - 3 0 S <strong>and</strong><br />
longitude 31.8 0 E - 34.8 0 E. It is a relatively shallow lake with an average depth of 40<br />
metres <strong>and</strong> a maximum depth approximate 80 metres. The lake is shared by three reparian<br />
countries whereas Tanzania occupies about 49 percent of the lake, <strong>and</strong>, Ug<strong>and</strong>a <strong>and</strong> Kenya<br />
share the rema<strong>in</strong><strong>in</strong>g portion by 45 <strong>and</strong> 6 percent respectively (figure 1; Source FAO, 2007).<br />
Figure 1: Reparian districts along <strong>Lake</strong> Victoria shore l<strong>in</strong>e ( Tanzania; Ug<strong>and</strong>a <strong>and</strong><br />
Kenya)<br />
Accord<strong>in</strong>g to the <strong>Lake</strong> Victoria Fisheries Organization (LVFO, 2009), the Fisheries of <strong>Lake</strong><br />
Victoria provide an immense source of <strong>in</strong>come, employment, food <strong>and</strong> foreign exchange for<br />
1
East Africa. The lake produces a fish catch of over 800,000 tonnes fish annually that currently<br />
leads to worth about US $590 million of which US $340 million is generated at the shore <strong>and</strong><br />
a further US$ 250 million a year is earned <strong>in</strong> exports from the <strong>Nile</strong> perch fishery. The lake<br />
fisheries employee’s as direct or <strong>in</strong>direct, almost 2 million people with household <strong>in</strong>comes<br />
<strong>and</strong> meet the annual fish consumption needs of about 22 million people <strong>in</strong> the region. The<br />
fishery is supported by three ma<strong>in</strong> important fish stocks, the <strong>Lates</strong> nilotucus (<strong>Nile</strong> perch),<br />
Rastr<strong>in</strong>eobola argentea (Dagaa/Sard<strong>in</strong>es) <strong>and</strong> Oreochromis <strong>niloticus</strong> (<strong>Nile</strong> Tilapia). Whereas<br />
over 75% of <strong>Nile</strong> perch is send directly to fish establishment for process<strong>in</strong>g <strong>and</strong> export to<br />
overseas especially to the lucrative European Market, while dagaa <strong>and</strong> tilapia serve the local<br />
region <strong>and</strong> domestic markets. <strong>Nile</strong> perch contribute about 60% of the total catch from the lake<br />
fishery supplies of which over 80% of the total fish <strong>and</strong> fish products have been exported to<br />
abroad/overseas markets.<br />
Accord<strong>in</strong>g to the Fisheries Division (FD) annual statistics report (2008). The total fish<br />
production <strong>in</strong> 2007 was 332,179.48mt whereas 98.68% (327,806.5mt) of production was<br />
from artisanal fisheries. Total revenues collection was about TZS 213 billion which<br />
generated TZS 7.5 billion as royalty. The fishery exports from <strong>Lake</strong> Victoria alone<br />
contributed about 92% of the total export where <strong>Nile</strong> perch fillets contributed 74% <strong>and</strong><br />
other <strong>Nile</strong> perch products <strong>and</strong> dagaa 13%. <strong>Lake</strong> Tanganyika contributed about 4% while<br />
Mar<strong>in</strong>e fishery export contributed about 5%. These fisheries employ more than 160,000<br />
direct fishers <strong>and</strong> about 4 million others <strong>in</strong> fisheries related activities. The overall<br />
contribution of fisheries sector to the economy of the country is 10% <strong>and</strong> to the Gross<br />
Domestic Production (GDP) about 3%.<br />
1.1 QUALITY AND SAFETY ASSURANCE OF EXPORTED FISH AND FISH<br />
PRODUCTS FROM TANZANIA<br />
Fish quality control st<strong>and</strong>ards <strong>and</strong> market<strong>in</strong>g section under Fisheries Division (FD) <strong>in</strong> the<br />
M<strong>in</strong>istry of Livestock Development <strong>and</strong> Fisheries is responsible for monitor<strong>in</strong>g,<br />
surveillance, quality control <strong>and</strong> certify<strong>in</strong>g fish <strong>and</strong> fishery products to meet national <strong>and</strong><br />
<strong>in</strong>ternational quality st<strong>and</strong>ards. This is enacted by the Fisheries Act No. 22 of 2003 <strong>and</strong><br />
Fisheries Regulations of 2005. Thus <strong>in</strong> order to efficiently implement these roles, FD<br />
established a National Fish Quality Control Laboratory (NFQCL)-Nyegezi <strong>in</strong> 1997 at <strong>Lake</strong><br />
2
Victoria Zone <strong>in</strong> Mwanza City follow<strong>in</strong>g the pressure from EU <strong>in</strong> respect to the export of<br />
<strong>Nile</strong> perch from <strong>Lake</strong> Victoria. Currently the laboratory verifies the effectiveness <strong>and</strong><br />
efficiency of quality <strong>and</strong> safety assurance management systems <strong>in</strong> fish process<strong>in</strong>g<br />
establishments, as well as monitor<strong>in</strong>g chemical residues <strong>and</strong> contam<strong>in</strong>ants <strong>in</strong> the<br />
environments associated to fish <strong>and</strong> fish products. The tests help the <strong>in</strong>spection services<br />
(regulatory body) to ensure enforcement of the Fisheries Act <strong>and</strong> its Regulations. The<br />
NFQCL-Nyegezi is currently accredited for microbiological analyses <strong>in</strong> fish (food <strong>and</strong><br />
feeds) which <strong>in</strong>clude; total plate count, coliforms, Enterobacteriaceae, Staphylococcus<br />
aureus, Salmonella, <strong>and</strong> Vibrio cholera. The criteria/guidel<strong>in</strong>es for fish <strong>and</strong> fis products are<br />
total plate count (1x10 5 cfu/g); coliforms (4x10 2 cfu/g), Enterobacteriaceae (1x10 3 cfu/g);<br />
Staphylococcus aureus (1x10 3 cfu/g); Salmonella (absent/25g), <strong>and</strong> Vibrio cholerae<br />
(absent/25g).<br />
To enable all these FD have ensured that fish establishments have put <strong>in</strong> place quality<br />
management <strong>and</strong> safety assurance programmes <strong>in</strong> l<strong>in</strong>e to the Fisheries Regulations 2005.<br />
The programmes <strong>in</strong>clude; Good Manufactur<strong>in</strong>g Practices (GMP), Good Hygiene Practices<br />
(GHP) <strong>and</strong> Hazards Analysis for Critical Control Po<strong>in</strong>ts (HACCP) <strong>and</strong> post process<br />
verification by <strong>in</strong>-plant laboratories.<br />
The <strong>Nile</strong> perch h<strong>and</strong>l<strong>in</strong>g cha<strong>in</strong> <strong>in</strong>cludes about six l<strong>in</strong>ks namely, the fishermen, middlemen,<br />
agents, <strong>and</strong> or fish process<strong>in</strong>g establishments, fish exporters, importers <strong>and</strong> retailers.<br />
Fish<strong>in</strong>g is undertaken ma<strong>in</strong>ly by artisanal fishers by us<strong>in</strong>g canoes, which are either paddled<br />
or with an out-board power. Fishers normally use drift nets which are set overnight, <strong>and</strong><br />
some use longl<strong>in</strong>es with baits. The fish are l<strong>and</strong>ed at various identified l<strong>and</strong><strong>in</strong>g sites for<br />
sale to traders (middlemen, agents or factories) who transport it to the factory or local retail<br />
markets. Only organoleptically (sensory) excellent <strong>and</strong> very good quality fish are selected<br />
for the factory process<strong>in</strong>g. Usually fishers do not ice fish just after capture, <strong>and</strong> the catch is<br />
first iced by the buyers/traders after pass<strong>in</strong>g several (i.e. ≤ 4- 6) hours at l<strong>and</strong><strong>in</strong>g sites. In<br />
accordance to the study by Karungi, Byaruhanga <strong>and</strong> Muyoga, (2004), there is little<br />
<strong>in</strong>formation available regard<strong>in</strong>g the quality changes that occur <strong>in</strong> <strong>Nile</strong> perch as a result of<br />
delays <strong>in</strong> ic<strong>in</strong>g <strong>and</strong> how this affects storage stability of the <strong>Nile</strong> perch <strong>and</strong> its products when<br />
eventually chilled/frozen <strong>and</strong> stored at refrigeration/ frozen temperatures. The general<br />
process<strong>in</strong>g flow diagram for <strong>Nile</strong> perch supply cha<strong>in</strong> for export products from up- stream<br />
(fish<strong>in</strong>g), establishments to importer is as shown <strong>in</strong> table 1.<br />
3
Table 1: <strong>Nile</strong> perch export process<strong>in</strong>g flow diagram from up-stream to importers <strong>and</strong><br />
associated quality control measures.<br />
1. Fish<strong>in</strong>g /fishers - No str<strong>in</strong>gent quality <strong>and</strong> safety checks <strong>and</strong> ic<strong>in</strong>g of catch<br />
2. Transportation - Canoes/boats to l<strong>and</strong><strong>in</strong>g sites without/with ice<br />
3. L<strong>and</strong><strong>in</strong>g sites - Physical <strong>and</strong> quality sensory checks <strong>and</strong> ic<strong>in</strong>g<br />
4. Transportation - Insulated trucks/boats with ice<br />
5. Fish establishment - Physical <strong>and</strong> Quality sensory checks<br />
6. Receiv<strong>in</strong>g/offload<strong>in</strong>g - Swabs by establishments<br />
7. Wash<strong>in</strong>g whole fish – treated potable water- microbiological checks<br />
8. Fillet<strong>in</strong>g/gutt<strong>in</strong>g - Swabs from personnel <strong>and</strong> contact surfaces<br />
9. Sk<strong>in</strong>n<strong>in</strong>g - Swabs from personnel <strong>and</strong> contact surfaces<br />
10. Trimm<strong>in</strong>g - Swabs from personnel <strong>and</strong> contact surfaces<br />
11. Shower wash<strong>in</strong>g – treated/ potable water<br />
12. Pre-pack<strong>in</strong>g –fillet samples<br />
13. Chill<strong>in</strong>g/Freez<strong>in</strong>g – Temperature checks/ fillet samples<br />
14. Pack<strong>in</strong>g - chilled fillets <strong>in</strong> styrofoam boxes <strong>and</strong> frozen <strong>in</strong> waxed cartons/ fillet samples<br />
15. Storage - Samples of f<strong>in</strong>ished chilled fillets for microbiological exam<strong>in</strong>ation by competent authority<br />
(analyses for safety <strong>and</strong> quality/hygiene microorganisms)<br />
16. Dispatch/Export - Temperature, packag<strong>in</strong>g checks <strong>and</strong> sensory checks/ supervision by Fish <strong>in</strong>spectors<br />
17. Importer receiv<strong>in</strong>g – Physical, microbiological quality <strong>and</strong> safety checks <strong>and</strong> feedback/ notification <strong>in</strong><br />
case of RASFF.<br />
1.2 JUSTIFICATION OF THE STUDY<br />
Accord<strong>in</strong>g to Mossel et al., (1995) the sole goal of microbiological control of food<br />
production is to supply safe, nutritious <strong>and</strong> palatable food with adequate shelf life at<br />
reasonable cost to consumers. The microbiological safety means the absence, exclusion or<br />
elim<strong>in</strong>ation of pathogenic organisms which is regarded different or separately from spoilage<br />
microorganisms. Therefore the key to microbiological control of both food safety <strong>and</strong><br />
spoilage lies to the underst<strong>and</strong><strong>in</strong>g <strong>and</strong> application of pr<strong>in</strong>cipals of microbial ecology which<br />
leads to the results of microbial growth, survival <strong>and</strong> or death. So far there are few studies on<br />
fresh water fish spoilage i.e. <strong>Lake</strong> Victoria <strong>Nile</strong> perch as well as on other tropical fresh water<br />
fishes compared to temperate water fishes. However, currently there are no analyses done for<br />
spoilage bacteria <strong>in</strong>dicators, i.e. TVB-N, TMA, <strong>and</strong> regular laboratory sensory tests<br />
throughout the <strong>Nile</strong> perch h<strong>and</strong>l<strong>in</strong>g cha<strong>in</strong>.<br />
4
1.2.1 Objectives<br />
The purpose of study was to carry out trials for microbiological shelf life of freshly iced<br />
<strong>and</strong> hygienically h<strong>and</strong>led <strong>Nile</strong> perch (<strong>in</strong> laboratory study) <strong>and</strong> normally factories<br />
(establishments) h<strong>and</strong>led fillets as well as the prevalence of certa<strong>in</strong> human pathogens. The<br />
study was divided <strong>in</strong>to three phases. Phase I: <strong>Microbiology</strong> of lake water, sediments <strong>and</strong><br />
whole <strong>Nile</strong> perch. Phase II: Shelf life of laboratory iced whole <strong>Nile</strong> perch <strong>and</strong> chilled fillets.<br />
Phase III: Shelf life study for normally processed chilled fillets at establishments.<br />
1.2.1.1 Specific objectives<br />
The specific objectives <strong>in</strong>clude:-<br />
1. To check prevalence of certa<strong>in</strong> human pathogens on whole <strong>Nile</strong> perch.<br />
2. To exam<strong>in</strong>e microbiological spoilage <strong>in</strong>dicator trail <strong>in</strong> iced whole <strong>Nile</strong> perch <strong>and</strong><br />
chilled fillets.<br />
3. To establish average storage time (shelf life) of iced whole <strong>Nile</strong> perch <strong>and</strong> chilled<br />
fillets.<br />
1.2.1.2 Specific questions<br />
The specific study questions <strong>in</strong>clude:-<br />
1. Are the pathogenic contam<strong>in</strong>ants <strong>in</strong> whole <strong>Nile</strong> perch derived from upstream (fish<strong>in</strong>g<br />
5<br />
ground or l<strong>and</strong><strong>in</strong>g sites)?<br />
2. Which are the dom<strong>in</strong>ant spoilage organisms <strong>in</strong> whole <strong>Nile</strong> perch <strong>and</strong> fillets from <strong>Lake</strong><br />
Victoria?<br />
3. What is the average keep<strong>in</strong>g quality (shelf life) <strong>in</strong> days for iced fresh <strong>Nile</strong> perch,<br />
chilled fillets; <strong>and</strong> establishments processed chilled <strong>Nile</strong> perch fillets?<br />
4. Is there significant difference <strong>in</strong> keep<strong>in</strong>g quality between the chilled <strong>Nile</strong> perch fillets<br />
processed after (long <strong>and</strong> short time) storage of fresh whole <strong>Nile</strong> perch <strong>in</strong> ice?
1.2.1.3 Output from the study<br />
The implementations of outputs from the study are expected to help:-<br />
6<br />
1. To strengthen <strong>and</strong> exp<strong>and</strong> microbiological services offered by NFQCL-Nyegezi<br />
to the official fish <strong>in</strong>spection <strong>and</strong> the fish (food <strong>and</strong> feeds) <strong>in</strong>dustry sector.<br />
2. To improve microbiological quality control <strong>and</strong> safety assurance measures,<br />
<strong>in</strong>crease fish <strong>and</strong> fish products shelf life, <strong>and</strong><br />
3. To reduce post harvest losses <strong>and</strong> hence <strong>in</strong>crease production <strong>and</strong> revenues.
2 BACK GROUND<br />
2.1 MICROBIOLOGICAL SAFETY HAZARDS IN FISH INDUSTRY<br />
In the recent years, the European Commission report (2006) lists some rapid alerts for food<br />
<strong>and</strong> feed (RASFF) notifications for Tanzania fish products exported to EU markets. These<br />
<strong>in</strong>clude about eight RASFF notifications from 2002 to 2006. Six of these RASFF<br />
notifications were on the presence of Salmonella species (<strong>Nile</strong> perch, <strong>in</strong> 2002 (2), <strong>in</strong> 2003<br />
(1) <strong>and</strong> <strong>in</strong> 2004 (1); <strong>in</strong> frozen octopus, <strong>in</strong> 2005 (2)) <strong>and</strong> <strong>in</strong> 2006 on rupture of the cold cha<strong>in</strong><br />
(i.e., high temperature <strong>in</strong> chilled fillets to 11-17 o C), see details table 2.<br />
Table 2: RASFF notification: Country of orig<strong>in</strong> Tanzania (EC, 2006).<br />
REFERENC<br />
E<br />
7<br />
DATE PRODUCT SOURCE OF<br />
CONTAMINATION<br />
2006/BTT 01/08/2006 Frozen <strong>Nile</strong> perch fillets<br />
(<strong>Lates</strong> <strong>niloticus</strong>)<br />
2006/BJB 12/06/2006 Refrigerated <strong>Nile</strong> perch<br />
fillets (<strong>Lates</strong> <strong>niloticus</strong>)<br />
2005/BCK 25/04/2005 Frozen octopus<br />
(Octopus vulgaris)<br />
2005/AIT 11/02/2005 Frozen octopus<br />
(Octopus vulgaris)<br />
2004/CNS 23/11/2004 Chilled fillets of <strong>Nile</strong><br />
perch(<strong>Lates</strong> <strong>niloticus</strong>)<br />
Too high content of E 452polyphosphates<br />
Bad temperature control (rupture of<br />
the cold cha<strong>in</strong> (+10 till +17 °C<br />
Salmonella spp. (presence /25g)<br />
Salmonella spp. (presence)<br />
Salmonella spp. (presence /25g)<br />
2003/BLM 2/07/2003 Fresh chilled <strong>Nile</strong> perch Salmonella braenderup (presence<br />
/25g) <strong>and</strong> Salmonella leoben<br />
(presence/25g)<br />
2002/BDQ 24/09/2002 <strong>Nile</strong> perch (<strong>Lates</strong><br />
<strong>niloticus</strong>)<br />
Salmonella spp. (presence /25g)<br />
2002/AQZ 14/06/2002 <strong>Nile</strong> perch fillets Salmonella spp. (presence n=5, c=0)<br />
Food is considered to be microbiologically unsafe ow<strong>in</strong>g to the presence of microorganisms<br />
which may <strong>in</strong>vade human body (i.e. Salmonella, Escherichia coli, Listeria monocytogenes,<br />
etc) <strong>and</strong> also those that produce tox<strong>in</strong>s <strong>in</strong>gested with a food such as Staphylococcus aureus,<br />
Clostridium botul<strong>in</strong>um <strong>and</strong> Bacilus cereus. The growth of these pathogens may not<br />
necessarily results <strong>in</strong> food spoilage. Hence the absence of deleterious sensory changes<br />
cannot be used as an <strong>in</strong>dicator for food microbiological safety (Border <strong>and</strong> Norton, (1997).<br />
Consequently many outbreaks are caused by bacteria orig<strong>in</strong>at<strong>in</strong>g <strong>in</strong> the animal/human
eservoir i.e. Salmonella, Shigella, E. coli, <strong>and</strong> Staphylococcus aureus, (Huss, Dalgaard <strong>and</strong><br />
Gram, 1997).<br />
Generally fish <strong>and</strong> shellfish are common vehicles of transmitt<strong>in</strong>g food borne diseases. On<br />
the other h<strong>and</strong>, pathogenic bacteria (<strong>in</strong>digenous bacteria) represent part of the natural flora<br />
on particularly fish from coast <strong>and</strong> estuar<strong>in</strong>e environment. Accord<strong>in</strong>g to Huss, Dalgaard <strong>and</strong><br />
Gram, (1997), the <strong>in</strong>digenous (pathogenic) bacteria <strong>in</strong>clude Vibrio spp., C. botul<strong>in</strong>um (Type<br />
E), L. monocytogenes, Aeromonas spp., <strong>and</strong> Shewanella alga. However, the level of<br />
contam<strong>in</strong>ation is normally quite low <strong>and</strong> it is unlikely that the numbers which are naturally<br />
present <strong>in</strong> uncooked seafood are sufficient to cause disease <strong>in</strong> healthy human be<strong>in</strong>g. Hence<br />
fish as food has far better record on safety than the mammalian meat.<br />
It is known that the primary source of cholera is feces of <strong>in</strong>fected persons <strong>and</strong> transmission<br />
of bacteria with water <strong>and</strong> food. However, at present it has also been found that <strong>in</strong> certa<strong>in</strong><br />
areas the aquatic environment is a natural reservoir (habitat) for Vibrio cholerae 01. This<br />
means that seafood may be contam<strong>in</strong>ated even if harvested <strong>in</strong> unpolluted waters, (Popovic<br />
et al., (1993), Huss, Dalgaard <strong>and</strong> Gram, 1997). Aeromonas spp. that is pathogenic to both<br />
fish <strong>and</strong> human can be present <strong>in</strong> aquatic environment, on fish or even <strong>in</strong> tap (dr<strong>in</strong>k<strong>in</strong>g)<br />
water (Gibson, 1992). The microbiologists have been tak<strong>in</strong>g the criteria to account that the<br />
presence of Escherichia coli <strong>in</strong> food <strong>in</strong>dicates the probability of contam<strong>in</strong>ation of the food<br />
products with the sewage of human or animal orig<strong>in</strong>. Consequently it has been referred as<br />
an <strong>in</strong>dicator for the presence of pathogenic <strong>in</strong>test<strong>in</strong>al bacteria. On the other h<strong>and</strong>, certa<strong>in</strong> E.<br />
coli stra<strong>in</strong>s (EnteropathogenicEPEC; Entero<strong>in</strong>vasive-EIEC; Enterotoxigenic-ETEC; <strong>and</strong><br />
Enterohaemorrhagic-EHEC) are pathogenic <strong>and</strong> lead to serious human diseases that can<br />
betransmitted with water <strong>and</strong> food (Doyle, 1990).<br />
The faecal coliforms <strong>and</strong> E. coli are particularly useful as <strong>in</strong>dicators of faecal contam<strong>in</strong>ation<br />
<strong>and</strong> poor h<strong>and</strong>l<strong>in</strong>g of seafood’s. This is because the organisms are absent from the fish at<br />
the time of capture except <strong>in</strong> grossly polluted waters. The aerobic plate counts (APC) or<br />
total viable count (TPC) is recommended for all fish <strong>and</strong> fish products because of its<br />
usefulness as an <strong>in</strong>dicator of utility, the condition <strong>and</strong> length of storage of products prior<br />
preservation processes such as freez<strong>in</strong>g. Accord<strong>in</strong>g to ICMSF, (1986), most aquatic animals<br />
at the time of harvest have counts <strong>in</strong> the region of 10 2 – 10 5 organisms per gram. While an<br />
<strong>in</strong>crease <strong>in</strong> APC/TVC to levels >10 6 per gram is an <strong>in</strong>dicative of long storage at chill<br />
8
temperatures or temperature abuse prior process<strong>in</strong>g. APC is thus an <strong>in</strong>dicative of quality<br />
<strong>and</strong> effectiveness of h<strong>and</strong>l<strong>in</strong>g procedures <strong>and</strong> storage conditions.<br />
2.2 RIGOR MORTIS AND POST HARVEST STORAGE OF FRESH FISH IN ICE<br />
The live fish muscles are limp <strong>and</strong> pliable, but soon after death the muscles contract <strong>and</strong><br />
become rigid, a state which is known to be <strong>in</strong> rigor. Rigor mortis refers to the processes that<br />
a fish undergoes immediately after death. This situation lasts for a period of time until the<br />
muscles relax <strong>and</strong> become soft aga<strong>in</strong> <strong>and</strong> the rigor is resolved. This phenomenon is<br />
important <strong>in</strong> fresh caught fish because the bacterial growth is retarded dur<strong>in</strong>g the rigor<br />
period. Consequently rigor mortis <strong>in</strong> fish attributes to the quality <strong>and</strong> shelf life of processed<br />
fish products. However, the onset <strong>and</strong> duration of rigor mortis is dependent on temperature,<br />
the catch<strong>in</strong>g method used <strong>and</strong> the glycogen reserves of the fish. Amlacher (1961) suggested<br />
that the rigor mortis process determ<strong>in</strong>es the subsequent shelf life on ice s<strong>in</strong>ce autolysis <strong>and</strong><br />
bacterial decomposition could not start until after rigor resolved.<br />
However, use of ice that is an ideal cool<strong>in</strong>g medium for fresh fish. It rapidly cools fish <strong>and</strong><br />
keeps it nearly at 0 o C throughout the distribution from fish<strong>in</strong>g to process<strong>in</strong>g. It also<br />
cont<strong>in</strong>uously washes away bacteria, blood <strong>and</strong> slimes as it melts <strong>and</strong> prevents dehydration<br />
of fresh fish. In addition ic<strong>in</strong>g <strong>and</strong> chill<strong>in</strong>g slow down bacterial <strong>and</strong> enzymic activities <strong>in</strong><br />
fish. The preservation effect of ic<strong>in</strong>g can last for up to 2-3 weeks which depends on fish<br />
species (Santos-Yap, 1995). For example due to bruises <strong>and</strong> cuts caused by poor h<strong>and</strong>l<strong>in</strong>g<br />
may lead to a nutritious environment for bacteria growth. The bruis<strong>in</strong>g may be reduced or<br />
avoided by not overfill<strong>in</strong>g fresh fish <strong>in</strong> a storage conta<strong>in</strong>ers <strong>and</strong> avoid throw<strong>in</strong>g fish.<br />
Hence, dur<strong>in</strong>g storage of newly caught fish, microorganisms may grow <strong>and</strong> result <strong>in</strong>to<br />
soften<strong>in</strong>g <strong>and</strong> discolor<strong>in</strong>g of some parts of flesh (muscles) of fresh fish. The rate for growth<br />
of microorganisms usually depends on the ability to tolerate the preservation conditions.<br />
2.3 FRESH FISH SPOILAGE<br />
Numerous works have been done <strong>in</strong> food products spoilage <strong>and</strong> still there is a need for<br />
more studies on various foods associated with complicated <strong>in</strong>teractions caus<strong>in</strong>g spoilage.<br />
9
<strong>Spoilage</strong> of food means to deprive it of its quality. In totality food spoilage is the results of<br />
metabolic processes that cause food to be undesirable for human consumption, (Adams <strong>and</strong><br />
Moss, 2008; Doyle, 2007; Gram et al., 2002, 1996). Therefore, generally spoilage is a<br />
subjective quality which means products may be accepted or rejected by one person while<br />
the same product may neither be accepted nor rejected by another person. Despite of the<br />
important role of microorganisms <strong>in</strong> food spoilage, the f<strong>in</strong>al decision for reject<strong>in</strong>g the<br />
spoiled food product concerned relies on sensory evaluation, (Gram et al., 2002; Connell,<br />
1975; <strong>and</strong> Re<strong>in</strong>eccius, 1990). This is because the microbial spoilage is normally associated<br />
with a sudden onset which is noticed at late stages of spoilage of products when they<br />
(microbial growth) are at log phases or the exponential growth phases. Therefore, it is<br />
easier to identify chemical compounds that are responsible for a particular sensory <strong>in</strong>dex<br />
such as off odours than the responsible spoilage organisms.<br />
Accord<strong>in</strong>g to Baird Parker, (2000) <strong>and</strong> Anonymous, (1985), the current world food post<br />
harvest <strong>and</strong>/or slaughter losses due to microbial spoilage estimates is about 25% of total<br />
food produced. This is a big loss which can be reduced if the ecology of specific spoilage<br />
organisms is well understood <strong>and</strong> controlled. However, every food product consistit of its<br />
own spoilage micro flora associated with the raw materials, or post contam<strong>in</strong>ation, effect of<br />
central process<strong>in</strong>g parameters <strong>and</strong> storage conditions.<br />
2.3.1 Microbiological spoilage of fresh fish<br />
Despite that muscles of fresh or live fish are sterile, it conta<strong>in</strong>s high load of bacteria on the<br />
surface slime of the sk<strong>in</strong>, on the gills <strong>and</strong> <strong>in</strong> the digestive tract. Bacterial loads on surfaces<br />
(sk<strong>in</strong>) of fish from catch can range from hundreds up to millions per square centimetre (10 2<br />
– 10 7 /cm 2 ); <strong>and</strong> <strong>in</strong> the gills <strong>and</strong> <strong>in</strong>test<strong>in</strong>es <strong>in</strong> the range of 10 3 – 10 9 /g (Adams <strong>and</strong> Moss,<br />
2008; Shewan, 1962; ICMSF, 1980b; Liston et al., 1976). These bacteria <strong>in</strong>clude Gram-<br />
negatives of the genera Pseudomonas, Shewanella, Psychrobacter, Vibrio, Flavobacterium,<br />
<strong>and</strong> Cytophaga <strong>and</strong> some Gram-positives such as coryneforms <strong>and</strong> micrococci. When the<br />
fish is dead, the immune system collapses <strong>and</strong> bacteria are able to multiply. The bacteria on<br />
the sk<strong>in</strong> surface to a large extent colonize the scale pockets <strong>and</strong> <strong>in</strong>vade the flesh by mov<strong>in</strong>g<br />
between the muscle fibres dur<strong>in</strong>g storage. <strong>Spoilage</strong> bacteria dom<strong>in</strong>ate <strong>and</strong> contam<strong>in</strong>ate the<br />
flesh/muscles through damaged parts of flesh <strong>and</strong> cause rapid spoilage of fish. Murray <strong>and</strong><br />
10
Shewan (1979) reported that only a very limited number of bacteria <strong>in</strong>vade the flesh dur<strong>in</strong>g<br />
ice storage. The rate of spoilage is slow from the sk<strong>in</strong>/surface <strong>in</strong> whole fish, <strong>in</strong>creases for<br />
gutted fish followed by fillets <strong>and</strong> m<strong>in</strong>ced fish (ICMSF, 1980b).<br />
Microbiological spoilage reactions <strong>in</strong> seafood depend on the <strong>in</strong>itial composition or fish<br />
species, orig<strong>in</strong>al environment <strong>and</strong> storage conditions, (Huss et al., 1997, Gram et al., 2002).<br />
<strong>Spoilage</strong> of fish is ma<strong>in</strong>ly due to the activity of psychrotrophic gram-negative bacteria such<br />
as Shewanella putrefaciens <strong>and</strong> Pseudomonas spp. Shewanella putrefaciens has been<br />
identified as the specific spoilage bacteria of mar<strong>in</strong>e temperate-water fish stored aerobically<br />
<strong>in</strong> ice. Some Pseudomonas spp. are the specific spoilers of iced stored tropical freshwater<br />
fish (Lima dos Santos, 1978; Gram et al., 1990) <strong>and</strong> are also, together with S. putrefaciens,<br />
spoilers of mar<strong>in</strong>e tropical fish stored <strong>in</strong> ice (Gillespie <strong>and</strong> MacRae, 1975; Gram et al.,<br />
1990). At ambient temperature, motile Aeromonads are the specific spoilers at aerobically<br />
stored freshwater fish (Gorzyka <strong>and</strong> Pek Poh Len, 1985; Gram et al., 1990). Barile et al.,<br />
(1985) found that a large proportion of the flora at ambient-stored mackerel consisted of S.<br />
putrefaciens; this <strong>in</strong>dicates that the bacterium may also take part <strong>in</strong> the spoilage of fish<br />
stored at ambient temperature.<br />
The studies on ambient stored <strong>Nile</strong> perch by Gram L, <strong>and</strong> others (1990), found out the<br />
follow<strong>in</strong>g composition of genera <strong>and</strong> species. The gram–negative Aeromonas spp,<br />
Ac<strong>in</strong>ebacter, Alcaligenes <strong>and</strong> Moraxeralla, <strong>and</strong> gram–positives <strong>in</strong>cluded Micrcoccus <strong>and</strong><br />
Staphylococci spp. The bacterial counts when <strong>Nile</strong> perch was spoiled <strong>and</strong> rejected was up to<br />
level of 10 8 /g <strong>in</strong> iron agar (IA) plates. The IA is used for enumerat<strong>in</strong>g hydrogen sulphite<br />
produc<strong>in</strong>g spoilage bacteria which forms black colonies <strong>in</strong> contrast to white colonies<br />
produced by other bacterial spp. Pseudomonas spp. dom<strong>in</strong>ated <strong>in</strong> spoiled <strong>Nile</strong> perch after<br />
33 days stored <strong>in</strong> ice. The situation was the same with spoiled iced cod. Gram et al.,<br />
(1990); Lima dos Santos, (1978); <strong>and</strong> Cowel <strong>and</strong> Liston (1962) had all noted that the<br />
“bacterial flora on tropical fish resembles the micro flora on temperate fish species”.<br />
However, fish <strong>and</strong> fish products spoil by different specific spoilage organisms (SSO)<br />
depend<strong>in</strong>g on the f<strong>in</strong>al treatment or preservation <strong>and</strong> storage temperature. Examples of SSO<br />
<strong>in</strong> different fish <strong>and</strong> fish products <strong>in</strong>clude Pseudomonas, Shewanella putrefaens,<br />
Photobactereum phosporeum, Aeromonas hydrophila, <strong>and</strong> Alteromonas putrefaciens,<br />
Vibrionaceae, Aeromodans, Moraxella, Ac<strong>in</strong>etobacter, Enterobacteriaceae; <strong>and</strong> Yeast <strong>and</strong><br />
molds. F<strong>in</strong>d<strong>in</strong>gs from some studies <strong>in</strong> fish <strong>and</strong> fish product on SSO <strong>in</strong>clude the follow<strong>in</strong>g:-<br />
11
• Pseudomonas <strong>and</strong> Shewanella putrifaciens are specific spoilage bacteria of iced fresh<br />
fish <strong>and</strong> fish products under refrigeration conditions (Gram <strong>and</strong> Huss 1996; Taoukis et<br />
al., 1999).<br />
• Pseudomonas which is a large <strong>and</strong> poorly def<strong>in</strong>ed group of microorganisms. The genus<br />
is <strong>in</strong> the group of aerobe Gram-negative, catalase <strong>and</strong> oxidase-positive rods. Many<br />
species have a psychrophilic nature <strong>and</strong> are regarded as part of the natural flora of fish<br />
(Hvda, 2007). The species can form aldehydes, ketones, esters <strong>and</strong> sulphides follow<strong>in</strong>g<br />
food spoilage, caus<strong>in</strong>g odours described as fruity, rotten <strong>and</strong> sulfhydryl-like (Lund et<br />
al., 2000).<br />
• Shewanella spp. <strong>and</strong> S. putrefaciens: The bacterium Shewanella is a facultative<br />
anaerobe Gram-negative, oxidase- <strong>and</strong> catalase- positive rod <strong>in</strong> the Shewanellacea<br />
family. S. putrefaciens is regarded as a specific spoilage bacterium of mar<strong>in</strong>e fish from<br />
temperate water, stored aerobically <strong>in</strong> ice (Gram et al., 1987; Gram & Huss, 1996).<br />
• Hozbor et al., (2006), identified bacterial flora <strong>in</strong> iced sea salmon that consisted of<br />
Pseudomonas spp., S. putrefaciens, <strong>and</strong> Aeromonas which dom<strong>in</strong>ated the spoilage trail<br />
as well as Moraxella spp., Ac<strong>in</strong>etobacter <strong>and</strong> lactose positive- Enterobactereaceae <strong>and</strong><br />
Vibrios spp. They are predom<strong>in</strong>ant spoilage species on chilled fresh fish under aerobic<br />
conditions, (Fonnesbech et al., 2005; Hozbor et al., 2006).<br />
• Aeromonas hydrophila, a fermentative Gram –negative bacteria, produces characteristic<br />
spoilage off-flavour <strong>in</strong> fish stored <strong>in</strong> ice.<br />
• Alteromonas putrefaciens (former Pseudomonas putrefaciens), non fermentative, H2S<br />
produc<strong>in</strong>g organism was detected by us<strong>in</strong>g Peptone iron agar (PIA), (Lev<strong>in</strong>, 1968) <strong>in</strong><br />
chilled fish <strong>and</strong> fish products).<br />
• Lactic acid bacteria (LAB) <strong>and</strong> Photobacterium phosphoreum grow <strong>in</strong> fish which is<br />
lightly salted, packed under CO2 <strong>and</strong> stored refrigerated. Preservation by vacuum <strong>and</strong><br />
CO2 pack<strong>in</strong>g tends to <strong>in</strong>hibit respiratory microorganisms <strong>and</strong> selects for Photobactrium<br />
phosphoreum <strong>and</strong> Lactic acid bacteria, (Dalgaard, 2000).<br />
• Preservation by organic acids favours growth of LAB <strong>and</strong> yeast, (Lyhs et al., 2004).<br />
Yeast <strong>and</strong> molds grow <strong>in</strong> heavily wet-salted <strong>and</strong> dry salted fish respectively, Gram et<br />
al., 1996)<br />
12
Da<strong>in</strong>ty, Shaw, Hard<strong>in</strong>ger, <strong>and</strong> Michanie, (1979); <strong>and</strong> Gram et al, (1990), used the scheme <strong>in</strong><br />
table 3 for the identification of Gram-negative bacteria or Gram-negative SSO <strong>in</strong> fish.<br />
Table 3: Identification test of Gram-negative bacteria<br />
13<br />
S. putrefasciens S. alga Pseudomonas spp. Vibrionance Enterobacteriaceae<br />
Gram reaction - - - - -<br />
Shape Rod Rod Rod Rod Rod<br />
Motility + + + (+) (+)<br />
Oxidase + + + + +<br />
Catalase + + + + +<br />
Glucose -/O -/O O F F<br />
TMAO + + (-) + +<br />
H2S + + (-) + (+)<br />
Ornith<strong>in</strong>e -<br />
decarboxylase + + (-) + ±<br />
In general different SSO are able to grow <strong>in</strong> different fish <strong>and</strong> fish products either <strong>in</strong><br />
association or succession <strong>and</strong> produce different spoilage <strong>in</strong>dicators or metabolites which<br />
<strong>in</strong>clude: see table 4 below.<br />
Table 4: Typical spoilage compounds dur<strong>in</strong>g spoilage of fresh fish stored aerobically<br />
packed <strong>in</strong> ice or at ambient temperature, (Source: Huss, H. 1995).<br />
Specific spoilage organism -SSO Typical spoilage compounds<br />
Shewanella putrefaciens TMA, H2S, CH3SH, (CH3)2S, Hx<br />
Photobacterium phosphoreum TMA, Hx<br />
Pseudomonas spp. ketones, aldehydes, esters, non-H2S sulphides<br />
Vibrionaceae spp. TMA, H2S<br />
Anaerobic spoilers NH3, acetic, butyric <strong>and</strong> propionic acid<br />
Legend: Typical spoilage compounds <strong>and</strong> substrates<br />
Symbol Compounds name Substrates<br />
TMA Trimethylam<strong>in</strong>e Trimethylam<strong>in</strong>e Oxide (TMAO)<br />
H2S Hydrogen sulphide Cyste<strong>in</strong>e<br />
CH3SH<br />
(CH3)2S<br />
Methylmercaptan Methion<strong>in</strong>e<br />
Dimethylsulphide Methion<strong>in</strong>e<br />
Hx Hypoxanth<strong>in</strong>e Inos<strong>in</strong>e <strong>and</strong> IMP (<strong>in</strong>os<strong>in</strong>e monophosphate)
NH3 Ammonia am<strong>in</strong>o acids <strong>and</strong> urea<br />
Acetate, CO2 (carbon dioxide), H2O<br />
(Water)<br />
14<br />
carbohydrate <strong>and</strong> lactate<br />
Esters, ketones, aldehydes am<strong>in</strong>o-acids (glyc<strong>in</strong>e, ser<strong>in</strong>e, leuc<strong>in</strong>e)<br />
2.3.2 Biochemical spoilage of fresh fish<br />
Fish is very perishable, high prote<strong>in</strong> food which conta<strong>in</strong>s high level of am<strong>in</strong>o acids. Total<br />
volatile basic am<strong>in</strong>es (TVBA), a general term which <strong>in</strong>cludes trimethylam<strong>in</strong>e,<br />
dimethylam<strong>in</strong>e, ammonia <strong>and</strong> other total volatile basic nitrogenous (TVB-N) are<br />
compounds associated with seafood spoilage. The levels of TVB-N <strong>and</strong> TMAO are<br />
different from each fish species <strong>and</strong> even <strong>in</strong> different parts of the fish. The TVB-N consists<br />
of ammonia (NH3), monomethylam<strong>in</strong>e (MMA), dimethylam<strong>in</strong>e (DMA), <strong>and</strong><br />
trimethylam<strong>in</strong>e (TMA). Their levels may change dur<strong>in</strong>g bacterial activity <strong>and</strong> or enzymic<br />
degradation of trimethylam<strong>in</strong>e oxide (TMAO) <strong>in</strong> fish. Mar<strong>in</strong>e fish <strong>and</strong> some freshwater fish<br />
conta<strong>in</strong> trymethylam<strong>in</strong>e oxide (TMAO) which is degraded by majority of spoilage microbes<br />
to trimethylam<strong>in</strong>e (TMA). The SSOs utilizes the available TMAO <strong>in</strong> anaerobic respiration<br />
<strong>and</strong> produces off-odours <strong>and</strong> off-flavours follow<strong>in</strong>g the formation of TMA, (Huss <strong>and</strong><br />
Larsen, 1980; Gram et al., 1987, 1990; Dalgaard et al,. 1993). Sulphur conta<strong>in</strong><strong>in</strong>g am<strong>in</strong>o<br />
acids; cyste<strong>in</strong>e <strong>and</strong> methion<strong>in</strong>e decompose to liberate off-odours <strong>and</strong> off-flavours; hydrogen<br />
sulphides <strong>and</strong> methylmercaptane; aldehydes, ketones, esters, hypoxanth<strong>in</strong>e as well as other<br />
low molecular weight compounds <strong>in</strong> spoil<strong>in</strong>g fish, Herbert <strong>and</strong> Shewan, (1975, 1976);<br />
R<strong>in</strong>go et al., (1974) <strong>and</strong> Shewan, (1962).<br />
Karnicki <strong>and</strong> Lima Dos Santos, (1985) reported estimates of TVB-N <strong>in</strong> <strong>Nile</strong> perch fillets<br />
stored for two days at ambient temperature <strong>in</strong> tightly closed bag to have <strong>in</strong>itial value of<br />
48.5 mg N/100g ris<strong>in</strong>g to 60.2 mg N/100g. TVB-N values for cod stored <strong>in</strong> ice are 35-40<br />
mg N/100g, (Ozogul, 2000) <strong>and</strong> levels of 30-35 mg N/100g (Connell, 1995 <strong>and</strong> Huss,<br />
1988) which have been considered the limits of acceptability for ice stored cold water fish.<br />
Therefore TVB-N values above these are regarded to <strong>in</strong>dicate spoilage of the fish stored <strong>in</strong><br />
ice.<br />
Ammonia (NH3) has been identified as a volatile component <strong>in</strong> a variety of spoil<strong>in</strong>g fishes. It<br />
is formed by the bacterial degradation/ deam<strong>in</strong>ation of prote<strong>in</strong>s, peptides <strong>and</strong> am<strong>in</strong>o acids as
well as produced by the autolytic breakdown of adenos<strong>in</strong>e monophosphate (AMP) <strong>in</strong> chilled<br />
seafood products. The level of ammonia <strong>in</strong> iced cod was not found to <strong>in</strong>crease substantially<br />
until the sixteenth day of storage, (LeBlanc, 1987).<br />
Generally there is no production of trymethylam<strong>in</strong>e TMA dur<strong>in</strong>g early stage of storage of<br />
fresh caught fish. At this stage bacteria obta<strong>in</strong> energy from an aerobic oxidation. The<br />
growth of the aerobic bacteria results <strong>in</strong> formation of anaerobic or microaerophilic niches <strong>in</strong><br />
fish. Then at later stages SSO make use of TMAO as an electron acceptor by reduc<strong>in</strong>g the<br />
compound to TMA. The level of TMA <strong>in</strong> fresh rejected/spoiled fish by sensory assessment<br />
is with<strong>in</strong> a level of 10-15 mg TMA-N/100g for aerobically stored fish <strong>and</strong> at the level of 30<br />
mg TMA-N/100g <strong>in</strong> vacuum packed cod, (Dalgaard et al., 1993).<br />
The DMA component is generated by activities of the fish enzyme TMAO dimethylase<br />
(TMAO-ase), which converts TMAO <strong>in</strong>to equimolar quantities of DMA <strong>and</strong> formaldehyde<br />
(FA). Dur<strong>in</strong>g frozen storage the DMA is produced by autolysis.<br />
The biogenic am<strong>in</strong>es are stable to thermal process<strong>in</strong>g, <strong>and</strong> if they are found present <strong>in</strong><br />
f<strong>in</strong>ished canned products, it is a good <strong>in</strong>dication that the raw material was spoiled prior to<br />
heat<strong>in</strong>g. Accord<strong>in</strong>g to Huss, (1995), fish muscle has the ability to support the bacterial<br />
activity <strong>in</strong> production of a wide variety of am<strong>in</strong>e compounds which result from the direct<br />
decarboxylation of am<strong>in</strong>o-acids. Most spoilage bacteria that possess decarboxylase activity<br />
do so. Hence the organisms may cause raise of pH of the growth medium/substrate through<br />
the production of am<strong>in</strong>es. Am<strong>in</strong>es <strong>in</strong>clude histam<strong>in</strong>e, putresc<strong>in</strong>e, cadaver<strong>in</strong>e <strong>and</strong> tyram<strong>in</strong>e<br />
which are produced from the decarboxylation of histid<strong>in</strong>e, ornith<strong>in</strong>e, lys<strong>in</strong>e <strong>and</strong> tyros<strong>in</strong>e,<br />
respectively. Dur<strong>in</strong>g fish spoilage the levels of each of the nucleotide catabolic<br />
<strong>in</strong>termediates rise <strong>and</strong> fall with<strong>in</strong> the tissue.<br />
Enzymes are <strong>in</strong>volved <strong>in</strong> autolytic breakdown of adenos<strong>in</strong>e triphosphate (ATP) to <strong>in</strong>os<strong>in</strong>e<br />
monophosphate (IMP). On other h<strong>and</strong>, the spoilage bacteria activities convert the IMP to<br />
<strong>in</strong>os<strong>in</strong>e (Ino) <strong>and</strong> then to hypoxanth<strong>in</strong>e (Hx). Also, Hx has been shown to accumulate<br />
slowly <strong>in</strong> sterile fish tissue <strong>in</strong> parallel to development of TMA. Both Jorgensen et al.,<br />
(1988) <strong>and</strong> Dalgaard et al. (1993) showed a l<strong>in</strong>ear correlation between the contents of TMA<br />
<strong>and</strong> hypoxanth<strong>in</strong>e dur<strong>in</strong>g iced storage of packed cod.<br />
15
Accord<strong>in</strong>g to Cornell, (1975), the primary oxidation products are lipid hydroperoxides. In<br />
the later stages of oxidation secondary oxidation products usually may be present <strong>and</strong> thus<br />
be <strong>in</strong>dicative of a history of autoxidation. These products consist of aldehydes, ketones,<br />
short cha<strong>in</strong> fatty acids <strong>and</strong> others, many of which are characterised by unpleasant odours<br />
<strong>and</strong> flavours associated with oxidized fish lipids.<br />
2.4 STAGES OF SPOILAGE FOR ICED FRESH FISH<br />
The spoilage starts as soon as the fish dies due to series of chemical, physical,<br />
bacteriological, <strong>and</strong> histological changes that occur <strong>in</strong> the muscle tissue, (Emilia <strong>and</strong><br />
Santos, 1996). When fish is be<strong>in</strong>g caught it uses a lot of energy from limited glycogen<br />
compound <strong>in</strong> the course of struggle to survive. The defensive power is reduced follow<strong>in</strong>g<br />
depletion of glycogen <strong>in</strong> the muscles of fish. Depletion of glycogen limits the degree of<br />
post mortem acidification of the tissue; hence the pH rema<strong>in</strong>s between 6.2-6.5 as compared<br />
to around pH 5.5 for red meat. The pH is generally reduced due to the formation of lactic<br />
acid from glycogen which plays a role on retard<strong>in</strong>g the growth of bacteria like <strong>in</strong> the case of<br />
the red animal meat. Therefore majority of fish spoil fast due to the favourable pH which<br />
supports the activity <strong>and</strong> growth of microorganisms. However prolonged keep<strong>in</strong>g quality<br />
has been observed to fish which have low pH such as halibut which has approximately pH<br />
5.6, (Adams <strong>and</strong> Mourice (2008). On the other h<strong>and</strong>, fish like halibut which conta<strong>in</strong>s<br />
natural fats <strong>in</strong> the form of phospholipids <strong>and</strong> is rich <strong>in</strong> trimethylam<strong>in</strong>e oxide (TMAO) can<br />
also be more vulnerable to fast spoilage compared to lean fish. The fish-fat is usually<br />
highly unsaturated <strong>and</strong> it is easily oxidized (Santos-Yap, 1995). The rapid deterioration or<br />
spoilage of fresh fish as opposed to other high prote<strong>in</strong> muscle foods is due to the large<br />
concentration of non prote<strong>in</strong> nitrogen (NPN) compounds <strong>in</strong> fish muscles. Usually there are<br />
about four stages of fish spoilage as categorized by the number of storage days <strong>in</strong> melt<strong>in</strong>g<br />
ice. Start<strong>in</strong>g from; 0-5 days, 5-10 days, 10-14, <strong>and</strong> after 14 days, <strong>in</strong> the follow<strong>in</strong>g table 5.<br />
16
Table 5: Stages of spoilage of fresh fish stored <strong>in</strong> melt<strong>in</strong>g ice (Source: ICMSF, (1980b).<br />
Stages Days<br />
In ice<br />
17<br />
Physicochemical<br />
reactions (substrate &<br />
spoilage compounds)<br />
I 0-5 Flesh undergoes rigor<br />
mortis<br />
ATP is converted to<br />
<strong>in</strong>os<strong>in</strong>e<br />
II 5-10 Inos<strong>in</strong>e is converted to<br />
hypoxant<strong>in</strong>e<br />
level of NH3 <strong>in</strong>creases<br />
Trymethylam<strong>in</strong>e oxide<br />
(TMAO) is converted to<br />
trymethyleam<strong>in</strong>e<br />
(TMA)<br />
III 10-14 Hypoxant<strong>in</strong>e is converted<br />
to xant<strong>in</strong>e <strong>and</strong> uric acid;<br />
etc.<br />
TMA, total volatile bases<br />
(TVB) <strong>and</strong> total volatile<br />
acids (TVA) <strong>in</strong>crease<br />
IV >14 Proteolysis<br />
TVA <strong>and</strong> TVB levels<br />
<strong>in</strong>crease rapidly<br />
H2S is produced<br />
Physical deterioration<br />
occurs<br />
Microbiological<br />
(SSO) growth<br />
& Bacteria<br />
counts<br />
The dom<strong>in</strong>ant<br />
bacteria change<br />
10 2 – 10 3 /cm 2<br />
Bacteria growth<br />
occurs<br />
10 3 – 10 6 /cm 2<br />
Rapid bacterial<br />
growth occurs<br />
10 6 – 10 8 /cm 2<br />
H2S is produced<br />
by SSO<br />
(bacteria)<br />
~ 10 8 /cm 2<br />
Bacteria number<br />
constant<br />
Organoleptic/sensory<br />
changes<br />
Eyes bright; Flesh firm<br />
Colour good; Gills bright<br />
Odour fresh<br />
Eyes beg<strong>in</strong> to dull;<br />
Colour good;<br />
Gills colour fades;<br />
Sk<strong>in</strong> colour fades<br />
Odour natural -<br />
slightly fishy<br />
Texture softens<br />
Eyes sunken<br />
Gills discoloured <strong>and</strong> slimy<br />
Sk<strong>in</strong> bleached<br />
Odour sour <strong>and</strong> fishy<br />
Texture soft<br />
Eyes opaque <strong>and</strong> sunken<br />
Gills bleached <strong>and</strong> slimy<br />
Texture very soft<br />
Odour offensive<br />
Chemical<br />
changes<br />
TMA ≤ 1-<br />
1.5mg%<br />
VRS ≤ 2-8units<br />
TMA20units<br />
TVB >30mg%<br />
TVA >60mg%<br />
H2S, <strong>in</strong>dole etc<br />
detected<br />
Legend: mg% = mgN/100g; i.e. TMA: Trimethyla<strong>in</strong>e expressed as mg/100g fish; TVB:<br />
Total volatile base expressed as mg/100g fish; TVA: Total volatile acids expressed as<br />
mg/100g fish; VRS: Volatile reduc<strong>in</strong>g substances expressed as mg/100g fish.<br />
The gram-negative, rod shaped bacteria dom<strong>in</strong>ate the growth <strong>in</strong> chill temperature stored<br />
fish, (Liston, 1978). Dur<strong>in</strong>g an aerobic iced storage of fish, after 1-2 weeks, the spoilage<br />
flora may consist almost exclusively of Pseudomonas spp. <strong>and</strong> S. putrefaciens. This is due<br />
to their relatively short generation time at chill temperatures (Morita, 1975; Devaraju <strong>and</strong><br />
Setty, 1985). These bacteria are able to grow at low temperature (< 5 0 C) by utiliz<strong>in</strong>g the<br />
NPN compounds which are ma<strong>in</strong>ly available substrates <strong>in</strong> fish at early stage of storage <strong>in</strong><br />
ice. The ma<strong>in</strong> spoilage bacteria at this stage are frequently Pseudomonas spp. Oxidative<br />
deam<strong>in</strong>ation follows, <strong>and</strong> leads to production of volatile am<strong>in</strong>es dom<strong>in</strong>ated by ammonia<br />
(NH3) <strong>and</strong> free fatty acids. Then reduc<strong>in</strong>g bacteria dom<strong>in</strong>ate by reduc<strong>in</strong>g the TMAO to<br />
TMA compounds. Huss et al., (1988) found that TMAO reduction to TMA started when the<br />
level of specific spoilage bacteria, hydrogen sulphite producers like S. putrefaciens (black<br />
colonies) reached 10 7 cfu/ml <strong>in</strong> fish slurry <strong>and</strong> Gram et al., (1990) 10 8 cfu/g <strong>in</strong> <strong>Nile</strong> perch<br />
(tropical fresh water fish) respectively when stored <strong>in</strong> ice. TMA is a major component<br />
which is associated with unacceptable odour of spoil<strong>in</strong>g fish. The total volatile base (TVB)<br />
<strong>and</strong> total volatile acid (TVA) components produced dur<strong>in</strong>g degradation of prote<strong>in</strong>s are used
as well as <strong>in</strong>dices of fish spoilage. <strong>Spoilage</strong> is also recognized when there is a significant<br />
accumulation of sulphur-conta<strong>in</strong><strong>in</strong>g compounds such as methyl mercaptan, dimethyl<br />
sulphide <strong>and</strong> H2S produced by Pseudomonas putrefaciens. In 1970 Walker P., Cann D., <strong>and</strong><br />
Shewan J. M., reported the bacteria spoilage association <strong>in</strong> the order of: the dom<strong>in</strong>ant flora<br />
at the first stage <strong>in</strong>cluded mixture of Ac<strong>in</strong>etobacter- Moraxella <strong>and</strong> Pseudomonas; then<br />
Ac<strong>in</strong>etobacter-Moraxella, Flavobacteria <strong>and</strong> Pseudomonas <strong>and</strong> f<strong>in</strong>ally dur<strong>in</strong>g the<br />
exponential phase the Pseudomonas became the dom<strong>in</strong>ant genus with partly Ac<strong>in</strong>etobacter<br />
<strong>and</strong> Moraxella.<br />
Studies by Gram et al., (1986); Ravn Jorgensen et al., (1988); <strong>and</strong> Gram, (1990) <strong>in</strong><br />
temperate <strong>and</strong> warm fish <strong>in</strong>dicated significance difference <strong>in</strong> keep<strong>in</strong>g qualities <strong>in</strong> ice.<br />
Temperate water-fish <strong>and</strong> fish products when stored <strong>in</strong> melt<strong>in</strong>g ice spoiled after 9-10days<br />
<strong>and</strong> seldom after 2-3 weeks (14-21days), while tropical water fishes generally spoiled after<br />
4 weeks (28 days) of ice storage (<strong>Nile</strong> perch). Accord<strong>in</strong>g to Gram et al, (1986,1990)<br />
temperate water fishes when stored at ambient temperature were rejected after one day <strong>and</strong><br />
warm water fish - <strong>Nile</strong> perch stored at 20 0 C- 30 0 C spoiled after 11-17 hours,. Fresh fish<br />
caught from warm tropical waters stored <strong>in</strong> melt<strong>in</strong>g ice was found to cause decrease <strong>in</strong><br />
bacterial counts <strong>and</strong> extend the bacterial lag phase from 5 to 7 days before exponential<br />
phase started. However <strong>in</strong> the fourth week of storage at the po<strong>in</strong>t of rejection the total<br />
counts usually reach 10 6 - 10 8 cfu/g; of which 10 6 – 10 7 cfu/g represent counts for H2S<br />
produc<strong>in</strong>g bacteria on spoiled <strong>and</strong> rejected <strong>Nile</strong> perch, (Gram et al., 1990).<br />
2.5 FACTORS CONTRIBUTING ON FISH SPOILAGE<br />
Factors contribut<strong>in</strong>g to spoilage of food (fish) <strong>in</strong>clude <strong>in</strong>sect’s <strong>in</strong>festations <strong>and</strong> rodents,<br />
parasites; <strong>and</strong> activities of bacteria, yeast <strong>and</strong> molds <strong>in</strong> food that may render food to<br />
become undesirable. Exposure of food products to the light may cause degradation of<br />
prote<strong>in</strong>s <strong>and</strong> fats to produce off flavours <strong>and</strong> off odours, (Doyle, 2007, Gram et al., 2002).<br />
Accord<strong>in</strong>g to Huss, (1995) review, the storage or shelf life of fish <strong>and</strong> fish products may be<br />
<strong>in</strong>fluenced by fish species, fish<strong>in</strong>g grounds, fish<strong>in</strong>g season, pH <strong>and</strong> hygienic h<strong>and</strong>l<strong>in</strong>g.<br />
Large, lean, thick sk<strong>in</strong>, high pH, <strong>and</strong> flat fish species keep longer than small, fatty, th<strong>in</strong><br />
sk<strong>in</strong>, low pH <strong>and</strong> round fish species. Bruis<strong>in</strong>g/damag<strong>in</strong>g fish dur<strong>in</strong>g h<strong>and</strong>l<strong>in</strong>g causes rapid<br />
spoilage. The wide range of micro flora <strong>in</strong> fish is reflected by its environmental habitats<br />
18
such as fresh <strong>and</strong> salt waters; tropical <strong>and</strong> arctic waters, pelagic <strong>and</strong> bottom fisheries,<br />
degree of pollution of waters <strong>and</strong> degree of process<strong>in</strong>g or preservation like ic<strong>in</strong>g, freez<strong>in</strong>g,<br />
cann<strong>in</strong>g, <strong>and</strong> atmosphere/vacuum pack<strong>in</strong>g (Gram et al., 1996). Hence the micro flora<br />
grow<strong>in</strong>g <strong>in</strong> fish products is determ<strong>in</strong>ed by <strong>in</strong>tr<strong>in</strong>sic <strong>and</strong> extr<strong>in</strong>sic factors like post mortem<br />
pH > 6.0, amount of non-prote<strong>in</strong>-nitrogen (NPN) / or presence of TMAO.<br />
The parameters which may be responsible for microbial spoilage <strong>in</strong> foods may be<br />
categorized <strong>in</strong>to four groups (Adams <strong>and</strong> Moss, 2008): Extr<strong>in</strong>sic parameters, <strong>in</strong>tr<strong>in</strong>sic<br />
parameters, central process<strong>in</strong>g parameters <strong>and</strong> implicity parameters. Intr<strong>in</strong>sic parameters<br />
<strong>in</strong>clude physical, chemical, <strong>and</strong> structural properties of the food itself, such as water<br />
activity, pH, redox potential (E h ), available nutrients, <strong>and</strong> natural antimicrobial substances.<br />
Extr<strong>in</strong>sic parameters or environmental factors <strong>in</strong>clude storage time, temperature, humidity,<br />
<strong>and</strong> the composition of the storage atmosphere. Modes of process<strong>in</strong>g <strong>and</strong> preservation<br />
treatments may change the characteristics of the food product, <strong>and</strong> microorganisms<br />
associated with the product. Implicit parameters or mutual factors antagonistically or <strong>in</strong><br />
association <strong>in</strong>fluence microbial growth. The growth of one bacterial sub-population may<br />
affect other sub-populations <strong>in</strong> a food product.<br />
2.5.1 Temperature<br />
Temperature is the ma<strong>in</strong> environmental factor that affects growth <strong>and</strong> viability of<br />
microorganisms. Despite that, the range of temperature which permits growth of specific<br />
organisms, seldom exceeds 35 o C, the microbial growth can occur at temperatures from<br />
about -8 o C to +90 o C (Adams <strong>and</strong> Moss, 2008). The microbial growth rate becomes stable at<br />
their optimal growth of about 20 to 30 o C for psychrotrophs <strong>and</strong> 35 to 45 o C for mesophiles,<br />
(ICMSF, 1980a). Consequently <strong>in</strong>hibition of their growth occurs at temperatures only<br />
slightly above the maximum optimal growth. However, there are four physiological groups<br />
of bacteria which are def<strong>in</strong>ed <strong>and</strong> dist<strong>in</strong>guished by their temperature ranges of growth <strong>in</strong><br />
(table 6): thermophiles, mesophiles, psychrophiles <strong>and</strong> psychrotrophs.<br />
19
Table 6: Card<strong>in</strong>al temperature for microbial growth (Adams <strong>and</strong> Moss, 2008).<br />
Bacteria group M<strong>in</strong>imum Optimum Maximum<br />
Thermophile 40 - 45 o C 55 -75 o C 60 - 90 o C<br />
Mesophiles 5 - 15 o C 30 - 45 o C 35 - 47 o C<br />
Psychrophiles -5- +5 0 C 12 - 15 o C 15 - 20 o C<br />
Psychrotrophs -5- +5 0 C 25 - 30 0 C 30- 35 0 C<br />
(Adapted <strong>in</strong> ICMF, 1980: Card<strong>in</strong>al temperature for Prokaryotic Microorganisms)<br />
Mesophiles <strong>in</strong>clude human or animal pathogens <strong>and</strong> food spoilage bacteria. In favourable<br />
medium <strong>and</strong> at optimum growth temperature their generation time is ≤ 0.5 hr. The<br />
psychrophiles <strong>in</strong>clude all organisms that are capable to grow at 0 o C. The psychrotrophs are<br />
found at wider range of temperatures <strong>and</strong> <strong>in</strong> more diverse range of habitats <strong>and</strong> thus they<br />
are of greater importance <strong>in</strong> the spoilage of chilled foods. The psychrotrophs <strong>in</strong>clude gram-<br />
negative <strong>and</strong> gram- positive bacteria; aerobes, anaerobes, <strong>and</strong> facultative anaerobes, motile<br />
<strong>and</strong> non-motile organisms; spore formers <strong>and</strong> non-spore formers. Some psychrotrophs<br />
species among them at least 27 genera are listed <strong>in</strong> table 7. Yeast <strong>in</strong>cludes psychrotrophic<br />
stra<strong>in</strong>s <strong>in</strong> the genera C<strong>and</strong>ida, Torulopsis, Cryptococcus <strong>and</strong> Rhodotorola. Psychrotrophic<br />
molds are found <strong>in</strong> the genera Penicillium, Trichothecium <strong>and</strong> Aspergillus.<br />
Table 7: Genera that <strong>in</strong>clude psychrotrophic bacteria (ICMFS, 1980a)<br />
Ac<strong>in</strong>etobacter Aeromonas Alkaligens Athrobacter<br />
Bacillus Chromobacterium C<strong>in</strong>etobacter Clostridium<br />
Corynebacterium Enterobacter Erw<strong>in</strong>ia Escherichia<br />
Flavobacterium Klebsiella Lactobacillus Leuconostoc<br />
Listeria Microbacterium Micrococcus Moraxella<br />
Proteus Pseudomonas Serratia Streptococcus<br />
Streptomyces Vibrio Yers<strong>in</strong>ia<br />
2.5.1.1 Effect of storage at ambient <strong>and</strong> refrigeration temperature (0-25 ° C)<br />
The storage temperature of world fresh fishery/seafood products is <strong>in</strong> the range with<strong>in</strong> 0-<br />
25 o C, (Huss, 1995). In this range of temperature the microbiological activities are important<br />
<strong>in</strong> the shelf life <strong>and</strong> spoilage of fresh fish stored at chill conditions <strong>in</strong> melt<strong>in</strong>g ice<br />
approach<strong>in</strong>g 0 o C <strong>and</strong> at ambient temperature; warm/tropical countries from between 10–<br />
30 o C. However at temperature below 10 o C mesophilic bacteria do not grow <strong>and</strong><br />
20
psychrotrophic organism grow at very slow rates with extended lag phases when the<br />
temperature is approach<strong>in</strong>g at 0 o C.<br />
The psychrotrophic gram-negative rod shaped bacteria belong<strong>in</strong>g to generas Pseudomonas,<br />
Moraxella, Ac<strong>in</strong>etobater, Shwewanella, Flavobacterium, Vibrio, Aeromonas <strong>and</strong><br />
Micrococcus dom<strong>in</strong>ate micro flora <strong>in</strong> temperate waters. While the Gram-positive bacteria<br />
such as Bacillus, Micrococcus, Clostridium, Lactobacillus <strong>and</strong> Corynebacterium are found<br />
to dom<strong>in</strong>ate <strong>in</strong> higher temperature waters <strong>in</strong> vary<strong>in</strong>g proportions (Liston, 1980 &1992;<br />
Hozbor, 2006; Gram et al., 1990). Fresh water fish’s micro flora is dom<strong>in</strong>ated by the<br />
Aeromonas spp. The micro flora consist<strong>in</strong>g of Pseudomonas, Ac<strong>in</strong>etobacter, Moraxella <strong>and</strong><br />
Vibrionaceae was reported <strong>in</strong> newly caught fish <strong>in</strong> tropical Indian mar<strong>in</strong>e waters studies<br />
(Surendran et al., 1989 <strong>and</strong> Huss, 1995). F<strong>in</strong>d<strong>in</strong>gs from studies suggested that fresh water<br />
fishes have micro flora loads similar to the temperate water fishes with slightly higher <strong>in</strong><br />
Gram-positive <strong>and</strong> enteric bacteria (Liston, 1980; Gram et al., 1990).<br />
At 0 o C the microorganism’s growth rate is less than one-tenth of the rate at the optimal<br />
growth rates. The relative rate of spoilage of tropical fish species stored at 20-30 o C is<br />
approximates 25 times higher than at 0 o C (Gibson <strong>and</strong> Ogden, 1987; Dalgaard <strong>and</strong> Huss,<br />
1994). At 0-5 0 C Shewanella putrefaciens, Photobacterium phosphoreum, Aeromonas spp.<br />
<strong>and</strong> Pseudomonas spp. are the dom<strong>in</strong>ant spoilage micro flora <strong>in</strong> iced stored fish. When fish<br />
is stored <strong>in</strong> ice the flora slowly doubles <strong>in</strong> one day (24hours) <strong>and</strong> after 2-3 weeks they reach<br />
numbers of 10 8 – 10 9 cfu/cm 2 /g. Tropical waters fishes first pass their lag phase after 1-2<br />
weeks when stored <strong>in</strong> ice, (Gram et al., 1990; Gram 1990). On the other h<strong>and</strong> at 15-30 o C<br />
Vibrionaceae spp. <strong>and</strong> Enterobacteriaceae spp. are the dom<strong>in</strong>ant spoilage micro flora <strong>in</strong><br />
fish, (Gram et al., 1987, Gram et al., 1990, Liston, 1992). At these ambient temperatures,<br />
the micro flora may grow up to counts of 10 7 – 10 8 cfu/cm 2 /g with<strong>in</strong> one day (24hrs).<br />
2.5.1.2 Effect of storage at super chill<strong>in</strong>g temperature at 0 o C to -4 0 C<br />
The extension of shelf life of chilled fish fillets is <strong>in</strong> high dem<strong>and</strong> <strong>in</strong> l<strong>in</strong>e with the<br />
transportation of fresh products to distant markets at lower cost (Olafsdottir et al. 2005).<br />
Superchill<strong>in</strong>g has proven to effectively extend bacterial growth lag phase <strong>and</strong> prolong the<br />
shelf life of chilled fish <strong>and</strong> fish products (Huss 1995, Chang et al. 1998). Super<br />
chill<strong>in</strong>g/partial freez<strong>in</strong>g at 0 o C to -4 o C, has been used <strong>in</strong> seafood products when ice storage<br />
21
is <strong>in</strong>sufficient for good quality <strong>and</strong> extension of their shelf life. At present super chill<strong>in</strong>g of<br />
fresh chilled fish products is applied by some fish establishments. Fish fillets/products are<br />
rapidly chilled to below 0 to -2 o C by us<strong>in</strong>g either blast, plate or tunnel freezers. Various<br />
types of cool<strong>in</strong>g systems have been used for super chill<strong>in</strong>g (at -4 to 0 o C) of seafood<br />
products. Examples of the cool<strong>in</strong>g systems <strong>in</strong>clude chilled <strong>and</strong> refrigerated seawater (Smith<br />
et al. 1980, Olafsdottir et al. 2000), liquid-ice <strong>and</strong> br<strong>in</strong>e solutions (Huidobro et al. 2002),<br />
flake ice or slurry ice (Losada et al. 2005, Zeng et al. 2005), subzero storage temperature; -<br />
2 <strong>and</strong> -3 o C, (Riaz-Fatima et al. 1988, Sivertsvik et al. 2003) <strong>and</strong> the use of cool<strong>in</strong>g agents<br />
like CO2, <strong>and</strong> snow (LeBlanc <strong>and</strong> LeBlanc 1992, Jeyasekaran et al. 2004).<br />
2.6 METHODS FOR ASSESSMENT OF FRESH FISH QUALITY<br />
The qualitative <strong>and</strong> quantitative detection methods for SSO are <strong>in</strong> place. They <strong>in</strong>clude<br />
physical, sensory, microbial <strong>and</strong> biochemical (chemical) determ<strong>in</strong>ation methods.<br />
2.6.1 Sensory (qualitative) methods<br />
Sensory evaluation is def<strong>in</strong>ed as the scientific discipl<strong>in</strong>e used to evoke, measure, analyze<br />
<strong>and</strong> <strong>in</strong>terpret reactions to quality attributes of food as perceived through the human senses.<br />
The most used sensory assessment of fish freshness employs tra<strong>in</strong>ed persons called<br />
panellist to assess the fish by us<strong>in</strong>g the five common senses of humans, by see<strong>in</strong>g (eye),<br />
touch<strong>in</strong>g (sk<strong>in</strong>), smell<strong>in</strong>g (nose), hear<strong>in</strong>g (ear) <strong>and</strong> taste (tongue) aga<strong>in</strong>st a pre-set rank<strong>in</strong>g<br />
criteria. EU scheme <strong>and</strong> Quality Index Method (QIM) have been the most promis<strong>in</strong>g<br />
methods <strong>in</strong> measur<strong>in</strong>g the freshness of whole fish, which are rapid <strong>and</strong> reliable. Instruments<br />
as well may be used to measure some sensory profiles (parameters) i.e. Instron, Bohl<strong>in</strong><br />
Rheometer for measur<strong>in</strong>g texture <strong>and</strong> other rheological properties; microscopic methods<br />
comb<strong>in</strong>ed with image analyser are used to assess structural changes <strong>and</strong> "the artificial nose"<br />
to evaluate odour profile (Nanto et al., 1993). The sensory evaluation is generally the<br />
satisfactory <strong>and</strong> important method for assessment of fish freshness <strong>and</strong> or spoilage,<br />
(Connell, 1975; Re<strong>in</strong>eccius, 1990). It has been commonly used <strong>in</strong> the fish sector <strong>and</strong> fish<br />
<strong>in</strong>spection services (Luten <strong>and</strong> Mart<strong>in</strong>sdóttir 1997).<br />
22
The Quality Index Method (QIM) that was developed by the Tasmanian Food Research unit<br />
(CSIRO), (Bremner et al., 1985) has been used <strong>in</strong> the Nordic <strong>and</strong> Europe countries. QIM<br />
was primarily used for the evaluation of whole <strong>and</strong> gutted fish. Up to now, QIM schemes<br />
have been developed for a number of fish species <strong>in</strong>clud<strong>in</strong>g: fresh herr<strong>in</strong>g (Larsen et al,<br />
1992), cod (Jonsdottir 1992), red fish (Mart<strong>in</strong>sdottir <strong>and</strong> Arnason 1992), Atlantic mackerel,<br />
horse mackerel <strong>and</strong> European sard<strong>in</strong>e (Andrade et al. 1997), brill, dab, haddock, pollock,<br />
sole, turbot, shrimp <strong>and</strong> gilthead seabream (Huidobro et al.2000), frozen cod fillets (Warm<br />
et al. 1998), farmed Atlantic salmon (Sve<strong>in</strong>sdottir et al. 2003) <strong>and</strong> fresh cod fillets (Bonilla<br />
et al. 2006). The application of QIM is excellent <strong>in</strong> the first part of the storage period i.e.<br />
fish stored <strong>in</strong> ice. Dur<strong>in</strong>g first stage of storage other <strong>in</strong>strumental methods results are<br />
<strong>in</strong>accurate <strong>and</strong> or not reliable (Nielsen et al. 1992).<br />
The QIM technique is based on select<strong>in</strong>g a number of significant sensory parameters (sk<strong>in</strong>,<br />
eyes, gills, etc) or characteristic for a particular species <strong>and</strong> allocat<strong>in</strong>g scores to each<br />
attribute depend<strong>in</strong>g on the state of freshness or quality of the selected fishery products<br />
(Mart<strong>in</strong>sdóttir 2002, Sve<strong>in</strong>sdóttir et al. 2003). QIM score grades from zero be<strong>in</strong>g the<br />
highest score (0) which is given for very fresh fish <strong>and</strong> <strong>in</strong>creas<strong>in</strong>g higher scores for the fish<br />
which is deteriorat<strong>in</strong>g, the grad<strong>in</strong>g scores are (0, 1, 2, & 3). The aim of an ultimate result is<br />
to be able to predict the rema<strong>in</strong><strong>in</strong>g storage life of fish stored <strong>in</strong> ice (Larsen et al. 1992,<br />
Nielsen <strong>and</strong> Jessen 1997, Hydilg <strong>and</strong> Nielsen 1998, Mart<strong>in</strong>sdóttir et al. 2001). It is<br />
suggested that, when the sum of score of a batch of fish reach demerit po<strong>in</strong>ts of 10, the<br />
rema<strong>in</strong><strong>in</strong>g keep<strong>in</strong>g time <strong>in</strong> ice may be estimated to about five days, (Huss, 1995). Example<br />
of freshness rat<strong>in</strong>gs us<strong>in</strong>g the quality assessment scheme used to identify the quality <strong>in</strong>dex<br />
demerit score developed by Larsen et al. (1992) is given <strong>in</strong> appendix 1.<br />
2.6.2 Physical methods<br />
Accord<strong>in</strong>g to Huss, (1995), there are some trials that have been done <strong>in</strong> develop<strong>in</strong>g physical<br />
methods for freshness assessment of fish through measur<strong>in</strong>g the micro-structural<br />
characterization of the fish muscle or texture, changes <strong>in</strong> electrical properties dur<strong>in</strong>g rigor<br />
mortis stages, changes <strong>in</strong> colour, pH, <strong>and</strong> Eh. The electrical properties of fish sk<strong>in</strong> <strong>and</strong> tissue<br />
changes after death are def<strong>in</strong>itely compell<strong>in</strong>g/dem<strong>and</strong><strong>in</strong>g the need for physical measurements<br />
dur<strong>in</strong>g the fish postmortem changes or spoilage. However, the wide differences <strong>in</strong> <strong>in</strong>tr<strong>in</strong>sic<br />
<strong>and</strong> extr<strong>in</strong>sic factors, <strong>and</strong> heterogeneity characteristics of fish species, are the major factors<br />
23
which are pos<strong>in</strong>g difficulties <strong>in</strong> develop<strong>in</strong>g physical measurements. Jason <strong>and</strong> Richards,<br />
(1975) came up with <strong>in</strong>strument, GR Torrymeter which can only grade batches of fish <strong>and</strong> is<br />
not able to measure quality or freshness of a s<strong>in</strong>gle fish. The pH is the only measurement<br />
which has been commonly used as physical method for quality assessment by us<strong>in</strong>g pH-meter<br />
directly <strong>in</strong>to the fish muscle or <strong>in</strong> suspension of fish flesh/muscles <strong>in</strong> distilled water.<br />
2.6.3 Microbiological methods<br />
The microbiological analysis is the second most used traditional method which determ<strong>in</strong>es<br />
the quantity of microbial cells <strong>in</strong> particular foods referred to as total counts. Traditional<br />
methods for bacteriological exam<strong>in</strong>ations can be laborious, time-consum<strong>in</strong>g, <strong>and</strong> costly<br />
compared to sensory <strong>and</strong> chemical methods which only take few hours, (Huss, 1995).<br />
Common traditional plate count agars (PCA) are still the substrates widely used for<br />
determ<strong>in</strong>ation of total counts. Total count represents the total number of bacteria that are<br />
capable of form<strong>in</strong>g visible colonies on a culture media at a given temperature. An example<br />
of different methods used for determ<strong>in</strong>ation of bacterial counts <strong>in</strong> fish <strong>and</strong> fish products are<br />
given <strong>in</strong> table 8 below.<br />
Table 8: Methods for determ<strong>in</strong>ation of the content of bacteria <strong>in</strong> seafood (Huss, 1995)<br />
Method Temperature, °C Incubation cfu/g Sensitivity<br />
Plate count or Iron agar 15-25 3-5 days 10<br />
"Redigel"/"Petrifilm(tm) SM" 15-25 3-5 days 10<br />
Microcolony-DEFT 15-30 3-4 hours 10 4 -10 5<br />
DEFT -- 30 m<strong>in</strong>. 10 4 -10 5<br />
ATP -- 1 hour 10 4 -10 5<br />
Limulus lysate test -- 2-3 hours 10 3 -10 4<br />
Microcalorimetry/<br />
Dye reduction/<br />
Conductance/Capacitance<br />
24<br />
15-25 4-40 hours 10<br />
When exam<strong>in</strong><strong>in</strong>g bacteria <strong>in</strong> seafoods, more nutrient rich agar (Iron Agar, Lyngby, <strong>and</strong><br />
Oxoid) gives significantly higher counts than PCA (Gram, 1990). Iron agar yields both the<br />
number of specific spoilage (hydrogen sulphide produc<strong>in</strong>g) <strong>and</strong> non spoilage bacteria. The<br />
<strong>in</strong>cubation temperature dictates <strong>in</strong> the total counts. Incubation at ≥30°C seems to be<br />
<strong>in</strong>appropriate when exam<strong>in</strong><strong>in</strong>g seafood products be<strong>in</strong>g held at chill temperatures. Pour
plat<strong>in</strong>g for 3-4 days <strong>and</strong> <strong>in</strong>cubation at 25°C for psychrotrophs is recommended by surface<br />
plat<strong>in</strong>g <strong>and</strong> <strong>in</strong>cubation at 15°C to avoid kill<strong>in</strong>g heat sensitive bacteria, (Huss, 1995). Ready<br />
made plates are available for easy h<strong>and</strong>l<strong>in</strong>g such as "Redigel"/"Petrifilm(tm) SM", (Fung et<br />
al., 1987). The Redigel (RCR Scientific) <strong>and</strong> Petrifilm TM SM (3M Company) are dried<br />
agars with a gell<strong>in</strong>g agent to which the samples are directly added.<br />
Direct microscopic count/ microcolony-DEFT: Microscopic exam<strong>in</strong>ation of foods is a rapid<br />
way of estimat<strong>in</strong>g bacterial levels. By phase contrast microscopy the level of bacteria <strong>in</strong> a<br />
sample can be determ<strong>in</strong>ed with<strong>in</strong> one log-unit. One cell per field of vision equals<br />
approximately 5-10 5 cfu/ml at 1000 X magnification. Whilst microscopic methods are very<br />
rapid, their low sensitivity is considered as their major drawbacks. With the ATP<br />
measurement & Limulus lysate test, the bacterial numbers <strong>in</strong> foods are estimated by<br />
measur<strong>in</strong>g the amount of bacterial adenos<strong>in</strong>e triphosphate (ATP), (Sharpe et al., 1970) or<br />
by measur<strong>in</strong>g the amount of endotox<strong>in</strong> (Gram-negative bacteria) by the Limulus<br />
amoebocytes lysate (LAL) test, (Gram, 1992). The former is very rapid but difficulties exist<br />
<strong>in</strong> separat<strong>in</strong>g bacterial <strong>and</strong> somatic ATP.<br />
Microcalorimetry, dye reduction, conductance <strong>and</strong> capacitance methods are used for rapid<br />
estimation of bacterial numbers, based on the withdrawn sample, <strong>in</strong>cubation at high<br />
temperature (20-25°C) <strong>and</strong> detection for a signal. The detection time (DT) is <strong>in</strong>versely<br />
related to the <strong>in</strong>itial number of bacteria, i.e., early reaction <strong>in</strong>dicates a high bacteria count <strong>in</strong><br />
the sample <strong>and</strong> reversely proportional to the bacterial count obta<strong>in</strong>ed <strong>in</strong> agar methods.<br />
2.6.3.1 Detection of specific spoilage organism (SSO)<br />
Currently there are different peptone-rich (i.e. IA) substrates conta<strong>in</strong><strong>in</strong>g ferric citrate or<br />
sulphur-conta<strong>in</strong><strong>in</strong>g am<strong>in</strong>o acids which have been employed for detection of H2S-produc<strong>in</strong>g<br />
(SSO) bacteria such as Shewanella putrefaciens that forms black colonies due to<br />
precipitation of FeS (Lev<strong>in</strong>, 1968; Gram et al., 1987). Similarly Vibrionaceae forms black<br />
colonies on an iron agar to which an organic sulphur source is added (e.g., Iron Agar,<br />
Lyngby). The use of IA has been described by Van Spreekens, (1974); Gram et al., (1987);<br />
Jensen <strong>and</strong> Schulz, (1980). Gram et al., 1987, <strong>and</strong> reported that detection medium which<br />
conta<strong>in</strong>s only sulphur is not sufficient to detect all spoilage organisms such as Aeromonas/<br />
25
Vibrionaceae at higher temperatures. Also there is still no selective or <strong>in</strong>dicative medium<br />
available for the Pseudomonas spp. which spoil some tropical <strong>and</strong> fresh water fish or for<br />
Photobacterium phosphoreum that spoil packed fresh fish. However there are some<br />
common used media <strong>in</strong> enumeration of some spoilage bacteria shown <strong>in</strong> table 9 below.<br />
Table 9: Commonly used agar media for enumeration <strong>and</strong> detection of bacteria associated<br />
with fish spoilage, (Hovda, 2007).<br />
Bacterium Medium Reference<br />
Photobacterium<br />
phosphoreum<br />
26<br />
Plate Count Agar, (PCA),<br />
modified by addition of 1 %<br />
NaCl<br />
Nordic Committee on<br />
Food Analysis, 2000<br />
Long <strong>and</strong> Hammer Van Spreekens, 1974<br />
Shewanella putrefaciens Iron agar (black colonies) Gram et al., 1987<br />
Aerobic plate count Iron agar (black + white<br />
colonies)<br />
Gram et al., 1987<br />
Long <strong>and</strong> Hammer Van Spreekens, 1974<br />
Pseudomonas Pseudomonas<br />
(PAB)<br />
agar base, Mead & Adams, 1977<br />
Brochothrix thermosphacta Streptomyc<strong>in</strong> thallous acetate<br />
actidione agar, (STAA)<br />
Gardner, 1966<br />
Lactic acid bacteria Man-Rogosa-Sharke, (MRS) Baird et al., 1987<br />
2.6.4 Chemical methods<br />
Besides sensory, microbiological <strong>and</strong> physical methods, also chemical analyses have been<br />
used to assess the freshness quality of fish (Gill, 1992). But like for the sensory methods,<br />
also for the chemical quantified analyses must also relay on <strong>in</strong>creases or decreases of the<br />
levels of microbial spoilage or autolysis. This is because some <strong>in</strong>dicator chemical<br />
compounds are not present/detected until the product is close to spoilage or after pass<strong>in</strong>g<br />
several days of storage of fresh fish <strong>in</strong> ice until the microbial counts become >10 7 cfu/g<br />
(Gram et al. 2002; Adams <strong>and</strong> Moss, 2008).<br />
Total volatile basic am<strong>in</strong>e (TVBA) is one of the most widely used measurements of seafood<br />
quality. It is a general term which <strong>in</strong>cludes the measurement of TMA (produced by spoilage<br />
bacteria), dimethylam<strong>in</strong>e (produced by autolytic enzymes dur<strong>in</strong>g frozen storage), ammonia<br />
(produced by the deam<strong>in</strong>ation of am<strong>in</strong>o-acids <strong>and</strong> nucleotide catabolites) <strong>and</strong> other volatile<br />
basic nitrogenous compounds associated with seafood spoilage. The TVBA measurements<br />
reflect only later stages of advanced spoilage <strong>and</strong> are generally considered unreliable for the
measurement of spoilage dur<strong>in</strong>g the first ten days of chilled storage of cod as well as<br />
several other species (Rehbe<strong>in</strong> <strong>and</strong> Oehlenschlager, 1982). Hence the TVB measurements<br />
values do not necessarily reflect the mode of spoilage but rather the quality of fresh<br />
products.<br />
Measurement of TVBA depends upon steam distillation of volatile am<strong>in</strong>es. The<br />
concentration of TVB-N <strong>in</strong> freshly caught fish is typically between 5 <strong>and</strong> 20mg N/100 g<br />
muscle, whereas levels of 30– 35mg N/100 g muscle are generally regarded as the limit of<br />
acceptability for ice stored temperate water fish (Huss 1988a; Connell, 1995).<br />
27
3 MATERIALS AND METHODS<br />
3.1 STUDY AREA AND SAMPLING PLAN<br />
This work was done at NFQCL-Nyegezi. The study was conducted <strong>in</strong> three phases. Phase I<br />
study was done on microbiology of on lake water, sediments <strong>and</strong> newly caught <strong>Nile</strong> perch,<br />
trials 1-3 respectively, from the fish<strong>in</strong>g grounds. Phase II study consisted of two trials; trial 1<br />
on the shelf life of laboratory iced whole <strong>Nile</strong> perch <strong>and</strong> trial 2 on chilled <strong>Nile</strong> perch fillets.<br />
While phase III study was composed of trial 1 on microbiology of whole <strong>Nile</strong> perch swabs<br />
<strong>and</strong> on l<strong>in</strong>e fillets, <strong>and</strong> trial 2, shelf life of establishments chilled <strong>Nile</strong> perch fillets.<br />
Phases I <strong>and</strong> II samples were procured from <strong>Lake</strong> Victoria along Mwanza gulf by trawl<strong>in</strong>g<br />
method us<strong>in</strong>g Nyegezi Fresh Water Fisheries Tra<strong>in</strong><strong>in</strong>g Institute (NFFI) MV Mdiria boat.<br />
Mwanza gulf is a reserved breed<strong>in</strong>g area, figure 2. Trawl<strong>in</strong>g was covered between latitude 2 0<br />
28 S <strong>and</strong> 2 0 32 S; <strong>and</strong> longitude 32 o 49E <strong>and</strong> 32 o 50 o E at an average depth of 20 meters.<br />
Samples of whole <strong>Nile</strong> perch, sediments <strong>and</strong> water were all sampled at the same time dur<strong>in</strong>g<br />
trawl<strong>in</strong>g. The phase III samples; whole <strong>Nile</strong> perch swabs, on l<strong>in</strong>e fillets <strong>and</strong> establishments<br />
chilled <strong>Nile</strong> perch fillets were procured from four establishments (E1; E2; E3 & E4) located <strong>in</strong><br />
Mwanza City. All samples were brought <strong>and</strong> stored at the laboratory chill room/refrigerator<br />
set at 0 to 3 o C prior sub sampl<strong>in</strong>g laboratory test samples for subsequent analyses.<br />
Figure 2: Sketch map of the South-East part of <strong>Lake</strong> Victoria. Fish<strong>in</strong>g grounds of the various<br />
l<strong>and</strong><strong>in</strong>g sites are <strong>in</strong>dicated by shad<strong>in</strong>g. S: Semba; I: Igombe <strong>and</strong> K: Kayenze, (FAO, 2009).<br />
28
29<br />
SAMPLING PLAN<br />
PHASE I PHASE II PHASE III<br />
Trial 1: <strong>Lake</strong> Water Trial 1: NP Swabs <strong>and</strong> onl<strong>in</strong>e fillets<br />
Trial 2: Sediments Trial 2: Establishments chilled fillets<br />
Trial 3: NP (Sk<strong>in</strong> <strong>and</strong> Guts)<br />
Note: NP = <strong>Nile</strong> <strong>Perch</strong><br />
3.2 SAMPLING<br />
Trial 1: Whole <strong>Nile</strong> <strong>Perch</strong> (NP)<br />
Trial 2: Lab. Chilled fillets<br />
3.2.1 Phase I: <strong>Microbiology</strong> of Water, Sediments <strong>and</strong> <strong>Nile</strong> <strong>Perch</strong>.<br />
Samples of Water, Sediments <strong>and</strong> whole <strong>Nile</strong> perch were sampled along side with subsequent<br />
trawls <strong>in</strong> Mwanza gulf. Total of five trawls were done dur<strong>in</strong>g sampl<strong>in</strong>g <strong>and</strong> two samples for<br />
each type were sampled from each trawl.<br />
3.2.1.1 Phase I-trial 1: Water<br />
Total of 5 duplicates (10) samples of <strong>Lake</strong> Water were sampled from five trawls us<strong>in</strong>g a<br />
sterile 250ml bottle. A bottle was tied up with a rope around the neck <strong>and</strong> directly released to<br />
fetch water from the surface. Immediately the bottle with water sample was placed with a cap<br />
<strong>and</strong> properly closed. The samples were stored <strong>in</strong> a cool box with ice <strong>and</strong> transported to the<br />
laboratory, then stored overnight <strong>in</strong> the laboratory refrigerator <strong>and</strong> analysed with<strong>in</strong> 24 hours<br />
from sampl<strong>in</strong>g the follow<strong>in</strong>g day.
3.2.1.2 Phase I- trial 2: Sediments<br />
Sediments were scooped from the bottom of the lake us<strong>in</strong>g crab sampler <strong>and</strong> placed on sterile<br />
sta<strong>in</strong>less steel tray at same trawls concurent with water samples. Then by us<strong>in</strong>g sterile spoon a<br />
sample of sediments was put <strong>in</strong>to sterile 250ml bottles. Immediately the bottle with sample<br />
was placed with a cap <strong>and</strong> properly closed. Two samples were sampled from each trawl to<br />
make total of 5 duplicates (10) samples. All samples were stored <strong>in</strong> a cool box with ice <strong>and</strong><br />
transported to the laboratory, then stored overnight <strong>in</strong> the laboratory refrigerator <strong>and</strong> analysed<br />
with<strong>in</strong> 24 hours from sampl<strong>in</strong>g the follow<strong>in</strong>g day.<br />
3.2.1.3 Phase I – Trial 3: Whole <strong>Nile</strong> perch<br />
Similarly total of 5 duplicates (10) samples (fishes) of whole <strong>Nile</strong> perch each with an avarage<br />
weight of 2 kg were sampled, two fishes from each trawl, <strong>in</strong>dividually placed <strong>in</strong>to a plastic<br />
bag <strong>and</strong> then stored <strong>in</strong> ice. Samples were transported to the laboratory, stored overnight <strong>in</strong> ice<br />
<strong>in</strong> the laboratory chill room prior to analysis the follow<strong>in</strong>g day.<br />
3.2.2 Phase II: Shelf life for Laboratory iced whole <strong>Nile</strong> perch <strong>and</strong> chilled fillets<br />
3.2.2.1 Phase II trial 1: Shelf life of iced whole <strong>Nile</strong> perch<br />
Samples (70 fishes) of whole <strong>Nile</strong> perch (<strong>Lates</strong> <strong>niloticus</strong>) (2-5 kg) were sampled from five<br />
trawls along Mwanza gulf fish<strong>in</strong>g ground <strong>in</strong> <strong>Lake</strong> Victoria <strong>and</strong> iced immediately after each<br />
trawl (catch). Each trawl lasted for 30 m<strong>in</strong>utes. Whole <strong>Nile</strong> perch samples were selected <strong>and</strong><br />
iced on spot <strong>and</strong> then transported to the laboratory. At the laboratory samples were re-iced<br />
properly to a ratio of 1:1 (fish to ice) <strong>in</strong> 300ltr plastic tub with lid. The plastic tub was kept at<br />
the laboratory chill room ma<strong>in</strong>ta<strong>in</strong>ed at 0-3 o C dur<strong>in</strong>g the shelf life study.<br />
3.2.2.2 Phase II trial 2: Shelf life of Laboratory chilled fillets<br />
Fifty (50) samples of whole <strong>Nile</strong> perch samples from the 5 trawls above were filleted at a fish<br />
process<strong>in</strong>g establishment <strong>and</strong> the fillets were chilled <strong>in</strong> an air-blast freezer to 0±1 o C before<br />
30
e<strong>in</strong>g packed <strong>in</strong> Styrofoam boxes accord<strong>in</strong>g to normal operat<strong>in</strong>g procedures at the<br />
establishment. Ten (10) Styrofoam boxes each with about 6-8 pieces of chilled fillets were<br />
taken to the laboratory <strong>and</strong> stored <strong>in</strong> a laboratory refrigerator at 0-3 o C dur<strong>in</strong>g the shelf life<br />
study.<br />
3.2.3 Phase III: <strong>Microbiology</strong> of whole <strong>Nile</strong> perch swabs, on l<strong>in</strong>e fillets <strong>and</strong> shelf life of<br />
31<br />
establishments chilled fillets<br />
Samples were collected from four establishments (E1, E2, E3, & E4). The whole <strong>Nile</strong> perch<br />
(fishes) were iced <strong>and</strong> stored <strong>in</strong> fish transportation boats until the day of fillet<strong>in</strong>g at the<br />
establishments. The fishes were caught from canoes <strong>and</strong> brought to transportation boats,<br />
approximately 4-6 hours after catch. The number of storage days <strong>in</strong> ice from the day of<br />
fish<strong>in</strong>g until fillet<strong>in</strong>g at establishments E1, E2, E3 <strong>and</strong> E4 were 10, 17, 6 <strong>and</strong> 5 respectively.<br />
All samples for each trial at each establishment collected corresponded to one batch/lot of raw<br />
material (whole <strong>Nile</strong> perch) <strong>in</strong> one transportation vessel.<br />
3.2.3.1 Phase III – trial 1: <strong>Microbiology</strong> of whole <strong>Nile</strong> perch swabs <strong>and</strong> on l<strong>in</strong>e fillets<br />
Four (4) swabs samples were taken from whole <strong>Nile</strong> perch, two before <strong>and</strong> two after wash<strong>in</strong>g<br />
from the process<strong>in</strong>g l<strong>in</strong>e of the establishments. Sterile swab sticks were used for sampl<strong>in</strong>g<br />
from a prescribed area of 50cm 2 of sk<strong>in</strong> surfaces us<strong>in</strong>g a template <strong>and</strong> then immediately<br />
placed <strong>in</strong> to a vial (bottle) with 10ml diluent (0.1% peptone <strong>and</strong> 0.85% salt solution) <strong>and</strong><br />
stored <strong>in</strong> a cool box with ice bags until analysed at the laboratory. Also four (4) on l<strong>in</strong>e<br />
sk<strong>in</strong>less fillet (SLF) samples were sampled, two before wash <strong>and</strong> two after wash at each<br />
establishment. Each of the four fillets sampled was put <strong>in</strong>to <strong>in</strong>dividual polythene bag <strong>and</strong><br />
stored <strong>in</strong> a cool box with ice bags. All samples were transported to the laboratory <strong>and</strong> stored<br />
<strong>in</strong> a laboratory refrigerator until analysed with<strong>in</strong> 24 hours after sampl<strong>in</strong>g. However, no swabs<br />
<strong>and</strong> on l<strong>in</strong>e samples from establishment E4 were sampled because there was no production <strong>in</strong><br />
progress. Therefore only the f<strong>in</strong>al packaged chilled fillets were sampled at establishment E4<br />
(see Phase III – trial 2).
3.2.3.2 Phase III – trial 2: Shelf life of establishments chilled <strong>Nile</strong> perch fillets<br />
Two samples (4-6 kg Styrofoam boxes) with newly processed fillets were sampled from a<br />
specific lot/batch at each establishment (E1, E2, E3, & E4) <strong>and</strong> transported to the laboratory<br />
<strong>and</strong> stored <strong>in</strong> the laboratory refrigerator at 0-3°C until analyzed.<br />
3.3 PROCEDURES<br />
In all samples mentioned above, analyses employed <strong>in</strong>clude sensory assessment on whole<br />
<strong>Nile</strong> perch (phase I trial 1), microbiological analysis on all samples above <strong>and</strong> chemical<br />
analysis on whole <strong>Nile</strong> perch <strong>and</strong> fillets. Sensory assessment, microbiological analysis <strong>and</strong> the<br />
preparation of chemical extracts for the TVB-N analysis were all carried out at NFQCL-<br />
Nyegezi, SANAS accredited test<strong>in</strong>g facility <strong>and</strong> the TVB-N analysis were done at Soko<strong>in</strong>e<br />
University of Agriculture (SUA), Morogoro, Tanzania.<br />
3.3.1 Sensory (orgnoleptic) assessment<br />
Samples of iced whole <strong>Nile</strong> perch were sampled on different days: 4, 7, 10, 13, 15, 20, 22,<br />
26, 28, 30 <strong>and</strong> 33 storage days <strong>in</strong> laboratory refrigerator at 0-3 o C, see appendix III -A.<br />
Organoleptic assessment was carried out us<strong>in</strong>g a checklist (table 10) accord<strong>in</strong>g to freshness<br />
rat<strong>in</strong>gs by apply<strong>in</strong>g a modified quality assessment scheme used to identify the quality <strong>in</strong>dex<br />
(QI) demerit score by Larsen et al., (1992), see appendix 1. The scheme employed the<br />
ma<strong>in</strong> three quality parameters; namely general appearance, eyes <strong>and</strong> gills aga<strong>in</strong>st the<br />
follow<strong>in</strong>g characters (attributes): Sk<strong>in</strong>, blood spot on gill cover, belly <strong>and</strong> smell; eye clarity;<br />
<strong>and</strong> gills colour <strong>and</strong> smell respectively. The excellent freshness quality fish ranked with<br />
quality <strong>in</strong>dex demerit score between 0-1, fish of good quality 1-2 <strong>and</strong> stale/spoiled fish had<br />
scores of 2-3. Three samples of iced whole <strong>Nile</strong> perch from phase II- trial 1 were sampled<br />
<strong>and</strong> placed for assessment each day of sampl<strong>in</strong>g. The panellists were comprised of<br />
untra<strong>in</strong>ed panellists from NFQCL-Nyegezi <strong>and</strong> NFFI staff. The number of panelists varied<br />
from three to maximum of seven.<br />
32
Table 10: Freshness rat<strong>in</strong>gs us<strong>in</strong>g the quality assessment scheme used to identify the quality<br />
<strong>in</strong>dex demerit score (Larsen et al. 1992) modified.<br />
Quality<br />
parameter<br />
General<br />
appearance<br />
33<br />
Character Score (ice/seawater)<br />
0 1 2 3<br />
Sk<strong>in</strong> Bright, sh<strong>in</strong><strong>in</strong>g Bright,<br />
Dull,<br />
Dull, opaque<br />
cloudy<br />
mucus<br />
Milky mucus mucus<br />
Bloodspot None<br />
Small, 10- Big, 30- Very big, 50on<br />
gill<br />
cover<br />
30%<br />
50%<br />
100%<br />
Stiffness Stiff, <strong>in</strong> rigor<br />
mortis<br />
Elastic<br />
Firm<br />
Soft<br />
Belly Firm , normal Firm/flat Soft Belly burst<br />
bulged<br />
concave<br />
Smell Fresh,<br />
Neutral Musty/sour Stale<br />
seaweed/metallic<br />
meat/rancid<br />
Eyes Clarity Clear, convex, Cloudy, dull Flat,<br />
bright pupil pupil<br />
opaque pupil<br />
Gills Colour Characteristic, Faded, less Discoloured,<br />
red /bright discoloured, Opaque<br />
colour, no<br />
Traces of mucus<br />
mucus<br />
mucus<br />
Smell Fresh, seaweed/ Neutral Sweaty/slight<br />
metallic, rancid<br />
ly rancid<br />
Sum of<br />
scores<br />
m<strong>in</strong>imum 0 <strong>and</strong> maximum 24<br />
Legend: Italics words added (modified)<br />
3.3.2 Microbiological analysis<br />
3.3.2.1 Phase I: Natural microbiology of Water, Sediments <strong>and</strong> <strong>Nile</strong> perch.<br />
3.3.2.1.1 Phase I-trial 1: Water<br />
The follow<strong>in</strong>g microbiological parameters were exam<strong>in</strong>ed:<br />
• Total Viable Counts (TVC) as per NMKL method #86, 4 th ed., 2006<br />
• Enterobacteriaceae as per NMKL method #144, 3 rd ed. 2005<br />
• Escherichia coli as per NMKL method # 125 4 th ed. 2005<br />
• Salmonella as per NMKL method # 71, 5 th ed. 1999 <strong>and</strong><br />
• Pathogenic Vibrio species as per NMKL method # 156, 2 nd ed. 1997<br />
Concave,<br />
Grey pupil<br />
Yellowish,<br />
Milky mucus<br />
Sour st<strong>in</strong>k<br />
/stale<br />
The undiluted water samples <strong>in</strong> bottles were thoroughly mixed by h<strong>and</strong> <strong>and</strong> made up to 1/100<br />
dilution us<strong>in</strong>g sterile diluent.
• Total viable counts (TVC): Volumes of 1ml from undiluted, 1/10 <strong>and</strong> 1/100 dilutions<br />
were pour-plated <strong>in</strong> duplicates with plate count agar (PCA) (Oxoid CM0325B) tempered<br />
at 45 0 C <strong>and</strong> thoroughly mixed. The plates were left to solidify <strong>and</strong> <strong>in</strong>cubated <strong>in</strong> an<br />
<strong>in</strong>cubator set at 22 0 C for 72 hours. After <strong>in</strong>cubation all colonies were counted <strong>and</strong> the<br />
results reported as cfu/ml.<br />
• Enterobacteriaceae: Volumes of 1ml from undiluted, 1/10 <strong>and</strong> 1/100 dilutions were pour-<br />
plated <strong>in</strong> duplicates with 10ml of Violet Red Bile Glucose Agar (VRBGA) (Oxoid<br />
CM0485B) tempered at 45 0 C <strong>and</strong> thoroughly mixed. The plates were left to solidify <strong>and</strong><br />
aga<strong>in</strong> added an overlay of 15ml VRBGA <strong>and</strong> allowed to solidify. The plates were then<br />
<strong>in</strong>cubated <strong>in</strong> an <strong>in</strong>cubator set at 30 0 C for 24 hours. After <strong>in</strong>cubation all typical colonies<br />
were counted <strong>and</strong> if possible up to 10 typical colonies were purified for confirmation on<br />
Nutrient agar (Oxoid CM0003B) <strong>in</strong>cubated at 37 0 C for 24 hours. After <strong>in</strong>cubation purified<br />
colonies were tested for oxidase. Enterobacteriaceae are oxidase negative <strong>and</strong> typically<br />
oxidase negative colonies were reported as cfu/ml Enterobacteriaceae.<br />
• Escherichia coli: Volumes of 1ml from undiluted, 1/10 <strong>and</strong> 1/100 dilutions were pour-<br />
plated <strong>in</strong> duplicates with 5ml of Tryptose Soya Agar (TSA), (Oxoid CM0131B)<br />
tempered at 45 0 C <strong>and</strong> thoroughly mixed. The plates were left to solidify <strong>and</strong> <strong>in</strong>cubated at<br />
room temperature at 22-24 o C for 2 hours, then added an overlay of 15ml Violet Red Bile<br />
Lactose Agar (VRBLA) (Oxoid CM0107B) <strong>and</strong> allowed to solidify. The plates were<br />
<strong>in</strong>cubated <strong>in</strong> an <strong>in</strong>cubator at 44 0 C ± 0.5 0 C for 24 hours. After <strong>in</strong>cubation all typical (dark<br />
red) colonies were counted <strong>and</strong> if possible up to 10 typical colonies were confirmed <strong>in</strong><br />
Escherichia coli (EC) broth (Oxoid CM0853B) at 44 0 C ± 0.5 0 C for 24 hours <strong>in</strong> a water<br />
bath. After <strong>in</strong>cubation the gas positive tubes were <strong>in</strong>oculated by us<strong>in</strong>g sterile loop <strong>in</strong>to<br />
tryptone broth tubes (Oxoid CM0087B) <strong>and</strong> <strong>in</strong>cubated at 44 0 C ± 0.5 0 C for 24 hours.<br />
Follow<strong>in</strong>g <strong>in</strong>cubation, 0.5ml of Kovacs <strong>in</strong>dole reagent was added <strong>in</strong>to the tryptone broth<br />
tubes (TB). TB tubes which developed red r<strong>in</strong>g were Kovacs <strong>in</strong>dole positive <strong>and</strong> the<br />
calculated results were reported as cfu/ml presumptive E. coli.<br />
• Salmonella detection: 25g (equivalent to 25ml) of undiluted water sample was weighed<br />
<strong>and</strong> added to 225ml of buffered peptone water (BPW) (Oxoid CM0509B) for pre-<br />
enrichment at 37 0 C for 24 hours. After <strong>in</strong>cubation, 0.1ml of the enrichment was<br />
transferred to Rappaport-Vassiliadis (RV) medium (Sigma) <strong>and</strong> <strong>in</strong>cubated at 42 0 C/24<br />
34
hours. After <strong>in</strong>cubation a loopfull of RV medium was streaked on to prepared plates of<br />
xylose lys<strong>in</strong>e desoxycholate (XLD) agar (Oxoid CM0469B) <strong>and</strong> Bismith sulphite agar<br />
(BSA), (Oxoid CM0201B) media. The plates were <strong>in</strong>cubated at 37 0 C for 24 hours <strong>and</strong> for<br />
48 hours for negative plates. Us<strong>in</strong>g a sterile loop, colonies from positive XLD/BSA plates<br />
were streaked for purification on nutrient agar (NA) plates <strong>and</strong> <strong>in</strong>cubated at 37 0 C for 24<br />
hours. After purification, us<strong>in</strong>g a sterile needle (straight loop), colonies were ioculated<br />
<strong>in</strong>to Triple Sugar Iron (TSI) agar (Oxoid CM0277B) – butt <strong>and</strong> slant respectively. TSI<br />
tubes were <strong>in</strong>cubated at 37 0 C for 24 hours. Positive TSI slants which produced gas with<br />
black butt <strong>and</strong> red slant were reported as presumptive Salmonella <strong>in</strong> 25ml of water<br />
samples.<br />
• Pathogenic Vibrio species detection: 25g (equivalent to 25ml) of water was weighed<br />
<strong>and</strong> added to 225ml of alkal<strong>in</strong>e peptone water (APW) (Oxoid CM1028B) for enrichment<br />
at 37 0 C for 24 hours. After <strong>in</strong>cubation a loopfull of APW enrichment was streaked onto<br />
prepared plates of selective Cholera TCBS medium (Oxoid CM0333B). The TCBS plates<br />
were <strong>in</strong>cubated at 37 0 C for 24 hours. After <strong>in</strong>cubation suspicious colonies were flat-<br />
yellow for the Vibrio cholerae (3-5mm-diameter) or blue- green for either Vibrio<br />
parahaemolytics (3-5mm -diameter) or Vibrio vulnificus (2-3mm-diameter). Suspected<br />
colonies were sub-cultured by streak<strong>in</strong>g on TSA agar plates for purification <strong>and</strong> <strong>in</strong>cubated<br />
at 37 0 C for 24 hours. After <strong>in</strong>cubation, pure colonies were subjected to biochemical tests<br />
<strong>in</strong> Hugh <strong>and</strong> Leifson (oxidation/fermentation (O/F)) test <strong>and</strong> TSI agar slants. After<br />
<strong>in</strong>cubation at 37 0 C for 24 hours presumptive results were read on O/F test tubes which<br />
produced a yellow colour with oxidation <strong>and</strong> or fermentation; <strong>and</strong> on TSI slants that<br />
developed a yellow colour without gas as presumptive Vibrio cholera <strong>in</strong> 25ml of water<br />
samples.<br />
3.3.2.1.2 Phase I- trial 2: Sediments<br />
Twenty grams (20g) of sediment samples was weighed <strong>in</strong>to a stomacher bag <strong>and</strong> mixed<br />
with 180ml of diluent. The mixture was stomached by 400 stomacher for 30 seconds to<br />
make 1/10 dilution. Subsequent dilutions up to 1/1000 were made. The above (3.3.2.1.1)<br />
described test procedures used for analysis of water were all followed.<br />
35
3.3.2.1.3 Phase I – Trial 3: Whole <strong>Nile</strong> perch<br />
Volume of 200ml (equivalent to 200g) of diluents (0.1% peptone <strong>and</strong> 0.85% salt solution)<br />
was used to r<strong>in</strong>se <strong>in</strong>dividual fish samples placed <strong>in</strong> polyethylene bags. The r<strong>in</strong>se solutions<br />
were treated as undiluted test samples. Volumes of 25ml of r<strong>in</strong>se solutions were added to<br />
225ml of Buffered peptone water (BPW) enrichment medium for detection of Salmonella.<br />
Similar volumes (25ml r<strong>in</strong>sed diluents) were added to 225ml of Alkal<strong>in</strong>e peptone water<br />
(APW) enrichment medium for pathogenic Vibrio spp. Subsequent analytical steps (<strong>in</strong><br />
3.3.2.1.1.) as for water analyses above were then followed for the Salmonella <strong>and</strong> Vibrio<br />
analysis.<br />
For exam<strong>in</strong>ation of TVC <strong>and</strong> Enterobacteriaceae <strong>in</strong> fish guts 20g of fish guts were weighed<br />
<strong>in</strong>to 180ml of diluents <strong>and</strong> stomached <strong>in</strong> 400 stomacher for 1 m<strong>in</strong>ute to make 1/10 dilution.<br />
Serial dilutions up to 1/1000 were made. Then subsequent analytical steps as for water <strong>and</strong><br />
sediments analyses (3.3.2.1.1 <strong>and</strong> 3.3.2.1.2) used above were then followed.<br />
3.3.2.2 Phase II: Laboratory- shelf life for iced whole <strong>Nile</strong> perch <strong>and</strong> chilled <strong>Nile</strong> perch<br />
36<br />
fillets<br />
3.3.2.2.1 Phase II trial 1: Shelf life of iced whole <strong>Nile</strong> perch<br />
Samples were sampled on different days: 4, 7, 10, 13, 15, 20, 22, 26, 28, 30 <strong>and</strong> 33 storage<br />
days <strong>in</strong> laboratory refrigerator at 0-3 o C, see appendix III -A.Whole <strong>Nile</strong> perch samples were<br />
sampled <strong>and</strong> put <strong>in</strong>to polyethylene bag, then stored <strong>in</strong> the laboratory refrigerator at 0-3°C<br />
prior to analysis. The laboratory samples were prepared accord<strong>in</strong>g to NMKL method #91,<br />
(2002). Plate Count Analysis was done accord<strong>in</strong>g to the Iron agar (IA) method, (Gram et al.,<br />
1987). The composition of the IA agar consists of the follow<strong>in</strong>g <strong>in</strong>gredients:<br />
• Peptone bacteriological (Oxoid LP0037B)<br />
• Bacteriological agar –No.1 (Oxoid LP00113B)<br />
• Yeast extract granules (Merck VM284953)<br />
• Beef extract powder (Highmedia RM002)<br />
• Ferric citrate salt<br />
• Sodium thiosulphate<br />
• Sodium chloride
Percentage (w/w) of IA constitutes used were the same as used by Gram et al., (1987), see<br />
appendix II.<br />
The Enterobacteriaceae analysis was carried out <strong>in</strong> accordance with the NMKL method #144<br />
3 rd ed. 2005 us<strong>in</strong>g VRBGA. The test samples were prepared by weigh<strong>in</strong>g out twenty grams<br />
(20g) of sk<strong>in</strong> from both sides of whole <strong>Nile</strong> perch <strong>in</strong>to a stomacher bag <strong>and</strong> mixed with 180ml<br />
of diluents. The mixture was homogenized by us<strong>in</strong>g the stomacher 400 for 1 m<strong>in</strong>ute to make<br />
1/10 dilution. Further dilutions were made up to the highest dilution required dur<strong>in</strong>g the shelf<br />
life study. Initially dilutions were 1/10 to 1/1000 <strong>and</strong> then <strong>in</strong>creased up to the highest dilution<br />
of 1/10 9 at the end of the storage time.<br />
• Total viable counts (TVC) <strong>and</strong> SSO: Volumes of 1ml from serial dilutions were pour-<br />
plated <strong>in</strong> duplicates with Iron agar (IA) tempered at 45 0 C <strong>and</strong> thoroughly mixed. The<br />
plates were left to solidify <strong>and</strong> aga<strong>in</strong> added an overlay of approximate 15ml IA <strong>and</strong><br />
allowed to solidify. The plates were then <strong>in</strong>cubated <strong>in</strong> an <strong>in</strong>cubator at 22 0 C for 72 hours.<br />
After <strong>in</strong>cubation, both typical black <strong>and</strong> white colonies were counted <strong>and</strong> the results were<br />
reported <strong>in</strong> cfu/g. The black (SSO) colonies were calculated <strong>and</strong> reported separately as<br />
cfu/g. The sum of black <strong>and</strong> white colonies was reported as total viable counts <strong>in</strong> cfu/g.<br />
Five (5) typical black colonies were purified on Nutrient agar (Oxoid CM0003B) <strong>and</strong><br />
<strong>in</strong>cubated at 37 0 C for 24 hours. After <strong>in</strong>cubation, purified colonies were tested for<br />
oxidase, catalase, Gram reaction <strong>and</strong> glucose fermentation (O/F) <strong>in</strong> Hugh <strong>and</strong> Leifsson<br />
medium.<br />
• Enterobacteriaceae/SSO: Volumes of 1ml from serial homogenate dilutions were pour-<br />
plated <strong>in</strong> duplicates with 10ml of VRBGA (Oxoid CM0485B) tempered at 45 0 C <strong>and</strong><br />
thoroughly mixed. The plates were left to solidify <strong>and</strong> aga<strong>in</strong> added an overlay of 15ml<br />
VRBGA <strong>and</strong> allowed to solidify. The plates were then <strong>in</strong>cubated <strong>in</strong> an <strong>in</strong>cubator at 30 0 C<br />
for 24 hours. After <strong>in</strong>cubation all typical (p<strong>in</strong>k to red) colonies were counted <strong>and</strong> 10<br />
colonies were purified on Nutrient agar (Oxoid CM0003B) <strong>in</strong>cubated at 37 0 C for 24<br />
hours. After <strong>in</strong>cubation, purified colonies were tested for oxidase. Enterobacteriaceae<br />
are oxidase negative <strong>and</strong> typical oxidase negative colonies were reported as cfu/g<br />
Enterobacteriaceae. Further tests for catalase, Gram reaction <strong>and</strong> glucose fermentation<br />
(O/F) <strong>in</strong> Hugh <strong>and</strong> Leifsson medium were performed for ascerta<strong>in</strong><strong>in</strong>g for SSO.<br />
37
3.3.2.2.2 Phase II trial 2: Shelf life of chilled <strong>Nile</strong> perch fillets<br />
Samples were sampled on different days: 2, 6, 10, 12, 15, 17, 19, 21 <strong>and</strong> 23 dur<strong>in</strong>g storage<br />
<strong>in</strong> laboratory refrigerator at 0-3 o C, see appendix III -C. The analyses for both TVC/SSO<br />
<strong>and</strong> Enterobacteriaceae for the chilled fillets used the same procedures as used <strong>in</strong> 3.3.2.2.1<br />
above. However twenty gram (20g) of chilled sk<strong>in</strong>less fillets from different areas was<br />
weighed <strong>in</strong>to stomacher bag followed by 180ml of diluent <strong>and</strong> then stomached <strong>in</strong> the<br />
stomacher 400 for 1 m<strong>in</strong>ute to br<strong>in</strong>g 1/10 dilution. Further dilutions were made up to the<br />
highest dilution required.<br />
3.3.2.3 Phase III: <strong>Microbiology</strong> of whole <strong>Nile</strong> perch swabs, on l<strong>in</strong>e fillets <strong>and</strong> shelf life of<br />
38<br />
establishments chilled <strong>Nile</strong> perch fillets<br />
3.3.2.3.1 Phase III– trial 1: <strong>Microbiology</strong> of whole <strong>Nile</strong> perch swabs <strong>and</strong> on l<strong>in</strong>e fillets<br />
Whole fish swabs: Swabs were analysed for TVC us<strong>in</strong>g Iron agar <strong>and</strong> Enterobacteriaceae<br />
us<strong>in</strong>g VRBGA. Swabs were thoroughly mixed by h<strong>and</strong> with the 10ml diluents <strong>in</strong> the swab<br />
vial <strong>and</strong> serial dilutions up to 1/1000 were made. The same procedures were then used as<br />
described <strong>in</strong> 3.3.2.2.1 for Total viable counts (TVC) <strong>and</strong> SSO us<strong>in</strong>g Iron agar <strong>and</strong> for<br />
Enterobacteriaceae us<strong>in</strong>g VRBGA. The counts were calculated from the actual counts per<br />
ml (cfu/ml) multiplied by 10mls of used diluents <strong>and</strong> divided by 50cm 2 swabbed area. Then<br />
the counts were reported <strong>in</strong> cfu/ cm 2 or logcfu/cm 2 .<br />
On-l<strong>in</strong>e fillets: The same procedures were used as <strong>in</strong> part 3.3.2.2 above.<br />
3.3.2.3.2 Phase III – trial 2: Shelf life of establishments chilled <strong>Nile</strong> perch fillets<br />
Samples for establishments E1 <strong>and</strong> E2 were sampled on different days: 2, 8, 12, <strong>and</strong> 15<br />
dur<strong>in</strong>g storage <strong>in</strong> laboratory refrigerator at 0-3 o C, see appendix III –D. Samples from<br />
establishments E3 <strong>and</strong> E4 were sampled from days: 2, 6, 10, 13, 15 <strong>and</strong> 17 dur<strong>in</strong>g storage <strong>in</strong><br />
laboratory refrigerator at 0-3 o C, see appendix III –E. The same procedures above for<br />
TVC/SSO <strong>and</strong> Enterobacteriaceae as <strong>in</strong> part 3.3.2.2.2 were used.
3.3.3 Chemical analysis<br />
3.3.3.1 Total volatile base nitrogen (TVB-N) <strong>and</strong> pH<br />
TVB-N was measured by us<strong>in</strong>g steam distillation method accord<strong>in</strong>g to Malle, P. <strong>and</strong><br />
Poumeyrol, M. (1989). Whole <strong>Nile</strong> perch sk<strong>in</strong> was removed <strong>and</strong> 100g of muscle/fillets<br />
were weighed <strong>in</strong>to a laboratory blender followed by 200ml (equivalent to 200g) of 7.5%<br />
Trichloroacetic Acid (TCA) <strong>and</strong> blended. About 75-100ml filtrate was filtered by us<strong>in</strong>g<br />
Watman filter paper number 3. The extracts/filtrates were stored <strong>in</strong> laboratory refrigerator<br />
at 0 o C for 1-2 months prior analysis. Volume of 25ml of filtrate was put <strong>in</strong>to a distillation<br />
flask <strong>and</strong> 6ml 10% alkal<strong>in</strong>e (NaOH) added. The mixture was distilled <strong>and</strong> generated free<br />
bases (distillates) which were collected <strong>in</strong>to 250ml conical flask conta<strong>in</strong><strong>in</strong>g 10ml of 4%<br />
Boric acid (with 0.04ml mixture of methyl red <strong>and</strong> bromocresol green <strong>in</strong>dicator). The<br />
volatile bases were titrated aga<strong>in</strong>st 0.025N Sulphuric acid <strong>and</strong> the amount of Sulphuric acid<br />
(H2SO4) used was measured as total bases distilled over. The bases (distillates) <strong>in</strong>clude<br />
mixture of ammonia, trimethylam<strong>in</strong>e <strong>and</strong> dimethylam<strong>in</strong>e each conta<strong>in</strong> one basic nitrogen<br />
atom per molecule. The TVB-N was calculated <strong>and</strong> expressed as mg nitrogen/100g of fish<br />
muscle us<strong>in</strong>g equation: TVB-Nmg/100g = [14mg/mol x A x B x 300]/25ml. Whereas A =<br />
ml of sulphuric acid <strong>and</strong> B = normality of sulphuric acid.<br />
The pH was measured from the homogenate of fish muscle suspended <strong>in</strong> distilled water<br />
us<strong>in</strong>g thermo Orion pH meter.<br />
3.3.4 Data analysis<br />
Data <strong>and</strong> results were statistically computed us<strong>in</strong>g normal Microsoft office excel 2007. The<br />
colony form<strong>in</strong>g units (cfu) per gram/ml/cm2 were all converted to log10 colony form<strong>in</strong>g<br />
units (logcfu) per g/ml/cm2 of sample for subsequent data analysis. Data <strong>in</strong> logcfu per<br />
g/ml/cm2 forms were presented by tabular <strong>and</strong> graphs forms.<br />
39
4 RESULTS<br />
4.1 PHASE I: MICROBIOLOGY OF WATER, SEDIMENTS AND WHOLE NILE<br />
PERCH<br />
4.1.1 Phase I trial 1: Water<br />
All results from samples of surface lake water were very low <strong>in</strong> total viable counts <strong>and</strong><br />
Enterobactericeae or zero <strong>in</strong> numbers (cfu) per ml (table 11). Only one sample among the<br />
five samples was presumptive E. coli <strong>in</strong> Kovacs (<strong>in</strong>dole) reagent which developed a red<br />
r<strong>in</strong>g.<br />
Table 11: Microorganisms of surface lake water<br />
40<br />
PARAMETERS<br />
SAMPLES (#TRAWLS)<br />
1 2 3 4 5 RANGE<br />
Total viale count cfu/ml 20 0 13 0 19<br />
0-20<br />
E. Coli cfu/ml 1 0 0 0 0 0-1<br />
Enterobacteriaceae cfu/ml 3 2 0 5 3 0-5<br />
One sample was presumptive V. cholerae per 25ml of water <strong>in</strong> TSI (table 12) <strong>and</strong> V.<br />
parahaemolyticus/V. vulnificus were absent <strong>in</strong> 25ml of water. Also Salmonella was absent<br />
<strong>in</strong> 25ml of water.<br />
Table 12: Pathogenic microorganisms of surface water<br />
PARAMETERS SAMPLE SIZE NUMBER OF PRESUMPTIVE<br />
SAMPLES<br />
SAMPLES<br />
Vibrio cholera 25ml 5 1 (20%)<br />
Vibrio parahaemolyticus/<br />
Vibrio vulnificus<br />
25ml 5 0 (0%)<br />
Salmonella 25ml 5 0 (0%)
4.1.2 Phase I trial 2: Sediments<br />
The microbiological counts for sediments were between 2.5 x 10 3 -2.2 x 10 4 cfu/g of<br />
sediment (table 13). These counts may imply that sediments from the bottom of water have<br />
likelihood of be<strong>in</strong>g good reservoir for many microorganisms. There was no<br />
Enterobacteriaceae <strong>and</strong> E. coli detected <strong>in</strong> the samples. Thus, it may be seem<strong>in</strong>gly, the<br />
Enterobacteriaceae <strong>and</strong> E. coli can not survive for long time <strong>in</strong> aquatic evnvironment<br />
(sediments) as compared to microorganisms represented <strong>in</strong> the TVC.<br />
Table 13: Microorganisms of sediments<br />
PARAMETERS<br />
41<br />
SAMPLES (#TRAWLS)<br />
1 2 3 4 5 RANGE<br />
Total viable count cfu/g 3500 22000 6100 2500 2800 2.5 x10 3 -2.2x10 4<br />
E. Coli cfu/g 0 0 0 0 0 0<br />
Enterobacteriaceae cfu/g 0 0 20 10 0 0-20<br />
The pathogenic Vibrios ssp. (V. cholerae, V. parahaemolyticus <strong>and</strong> V. vulnificus) as well as<br />
Salmonella were absent <strong>in</strong> 25g of sediments (table 14).<br />
Table 14: Pathogenic microorganisms of sediments<br />
PARAMETERS SAMPLE SIZE NUMBER OF PRESUMPTIVE<br />
SAMPLES SAMPLES<br />
Vibrio cholera<br />
Vibrio parahaemolyticus/<br />
25g 5 0 (0%)<br />
Vibrio vulnificus<br />
25g<br />
5<br />
0 (0%)<br />
Salmonella 25g 5 0 (0%)<br />
4.1.3 Phase I trial 3: Whole <strong>Nile</strong> perch<br />
All pathogenic V. cholerae, V. parahaemolyticus/ V. vulnificus were presumptively absent<br />
<strong>in</strong> 25ml of wash diluent of whole <strong>Nile</strong> perch (table 15). However, there was presumptive<br />
Salmonella <strong>in</strong> 25ml of wash diluent from one sample of <strong>Nile</strong> perch sk<strong>in</strong>.
Table 15: Pathogenic microorganisms on <strong>Nile</strong> perch sk<strong>in</strong>.<br />
PARAMETERS SAMPLE SIZE NUMBER OF PRESUMPTIVE<br />
SAMPLES<br />
SAMPLES<br />
Vibrio cholerae<br />
Vibrio parahaemolyticus/<br />
25ml 5 0 (0%)<br />
Vibrio vulnificus<br />
25ml<br />
5<br />
0 (0%)<br />
Salmonnela 25ml 5 1 (20%)<br />
The results from the total viable counts (TVC) of the <strong>Nile</strong> perch gut samples ranged from<br />
2.4x10 2 -1.0x10 6 cfu/g (table 16). It can be concluded that the fish guts are good reservoirs of<br />
<strong>in</strong>digenous micro flora that may contribute to contam<strong>in</strong>ation dur<strong>in</strong>g process<strong>in</strong>g if h<strong>and</strong>lers do<br />
not abide to good hygiene <strong>and</strong> operat<strong>in</strong>g practices. The results for Enterobacteriaceae<br />
ranged from 4.0x10 3 -3.8x10 4 cfu/g .The results <strong>in</strong>dicate that the fish guts can be an important<br />
reservoir of bacteria contam<strong>in</strong>ation of <strong>Nile</strong> perch dur<strong>in</strong>g process<strong>in</strong>g at establishments.<br />
Table 16: Microorganisms of <strong>Nile</strong> perch guts<br />
PARAMETERS<br />
42<br />
SAMPLES (TRAWLS)<br />
1 2 3 4 5 RANGE<br />
Total plate count cfu/g 16000 1000000 240 580 240000 2.4x10 2 -1.0x10 6<br />
Enterobacteriaceae cfu/g 17000 38000 0 6000 4000 4.0x10 3 -3.8x10 4<br />
One sample was presumptive V. cholerae per 25g of fish guts (table 17). The V.<br />
parahaemolyticus <strong>and</strong> or V. vulnificus were absent <strong>in</strong> 25g from all samples.<br />
Table 17: Pathogenic microorganisms of <strong>Nile</strong> perch guts<br />
PARAMETERS SAMPLE SIZE NUMBER OF PRESUMPTIVE<br />
SAMPLES<br />
SAMPLES<br />
Vibrio cholera<br />
Vibrio parahaemolyticus<br />
25g 5 1 (20%)<br />
/Vibrio vulnificus<br />
25g<br />
5<br />
0 (0%)
4.2 PHASE II: SHELF LIFE OF LABORATORY ICED WHOLE NILE PERCH<br />
43<br />
AND CHILLED FILLETS<br />
4.2.1 Phase II trial 1: Shelf life of iced whole <strong>Nile</strong> perch<br />
4.2.1.1 Sensory (organoleptic) assessment<br />
Freshness quality for whole <strong>Nile</strong> perch was assessed by untra<strong>in</strong>ed panellists accord<strong>in</strong>g to<br />
the freshness rat<strong>in</strong>gs us<strong>in</strong>g the quality assessment scheme used to identify the quality <strong>in</strong>dex<br />
(QI) demerit score by Larsen et al., (1992). Figure 3: #1-3 shows belly, clear red coloured<br />
eyes <strong>and</strong> gills as well as characteristic bright <strong>and</strong> sh<strong>in</strong><strong>in</strong>g sk<strong>in</strong> of whole <strong>Nile</strong> perch<br />
follow<strong>in</strong>g 10 days storage <strong>in</strong> ice. Figure 3: # 4 shows spoiled whole <strong>Nile</strong> perch with general<br />
appearance of dull <strong>and</strong> opaque sk<strong>in</strong> follow<strong>in</strong>g 33 days at the end of storage time <strong>in</strong> ice. The<br />
ma<strong>in</strong> QIM score contributors (figure 5) were change of the general appearance on stiffness:<br />
from stiff (very fresh fish) then eslastic, firm <strong>and</strong> soft (stale/spoiled fish) with average<br />
scored up to 2.50. Then followed by a general appearance of fish/gill smell: which were<br />
fresh/ seaweed/ metalic/ rancid for very fresh fish <strong>and</strong> stale meat/sour stick (stale/spoiled<br />
fish) both with average scores of ≥2. The appearance of sk<strong>in</strong> was changed from<br />
bright/sh<strong>in</strong><strong>in</strong>g (very fresh fish) to dull/opaque for stale/spoiled fish with average score of<br />
1.67.<br />
1 2 3 4<br />
Figure 3: 10 day’s whole <strong>Nile</strong> perch (#1-3) from left <strong>and</strong> 33 days whole <strong>Nile</strong> perch (#4spoiled)<br />
right, respectively dur<strong>in</strong>g storage <strong>in</strong> ice at laboratory chill room (0-3 0 C).
The excellent freshness fish grade (QIM score) was scored dur<strong>in</strong>g 15 days <strong>and</strong> good quality<br />
fish were scored dur<strong>in</strong>g 3-4 weeks of storage <strong>in</strong> ice. QIM scores characterized with a<br />
constant <strong>in</strong>crease (from 2-14 score) through out the 33 days storage time (figure 4). The<br />
quality of fish after 3 weeks of storage <strong>in</strong> ice was observed <strong>and</strong> was graded as not fit for<br />
process<strong>in</strong>g prime quality fresh chilled fillets for export.<br />
Figure 4: QIM score for whole <strong>Nile</strong><br />
perch dur<strong>in</strong>g storage <strong>in</strong> ice.<br />
4.2.1.2 Microbiological analysis<br />
44<br />
Figure 5: Ma<strong>in</strong> contribut<strong>in</strong>g attributes<br />
to QIM score for whole <strong>Nile</strong> perch<br />
dur<strong>in</strong>g storage <strong>in</strong> ice, (GA: General<br />
appearance).<br />
The test results for specific spoilage organisms (SSO), total viable counts (TVC) <strong>and</strong><br />
Enterobacteriaceae counts for Laboratory iced whole <strong>Nile</strong> perch stored <strong>in</strong> ice at 0-3 o C are<br />
shown <strong>in</strong> figure 6. The SSO counts were low up to 4 th day of storage <strong>in</strong> ice <strong>and</strong> then rapidily<br />
<strong>in</strong>creased from 2.75 - 6.15 log10 cfu/g after 15 days of storage. Similary the TVC counts<br />
were low but higher than the SSO counts on the 4 th day of storage but <strong>in</strong>creased from 4.12 -<br />
7.88 log10 cfu/g after 15 days of storage. The Enterobacteriaceae counts were similar to<br />
TVC counts after 4 days of storage i.e. 4.40log10 cfu/g <strong>and</strong> <strong>in</strong>creased up to 6.22 log10 cfu/g<br />
after 15 days of storage. These counts corresponded well to the excellent freshness quality<br />
scores for the same period of whole <strong>Nile</strong> perch for process<strong>in</strong>g <strong>in</strong>to very good quality fillets<br />
<strong>and</strong> or other products. After 15 days of storage <strong>and</strong> up to 22 days of storage of whole <strong>Nile</strong><br />
perch <strong>in</strong> ice all microbiological counts slowly <strong>in</strong>creased to 9.49log10cfu/g (SSO);<br />
9.84log10cfu/g (TVC) <strong>and</strong> 8.22log10cfu/g (Enterobacteriaceae). Then the counts <strong>in</strong>creased up<br />
to a stationary phase dur<strong>in</strong>g the fourth <strong>and</strong> fifth weeks of storage <strong>and</strong> reached maximum
counts of >10log10cfu/g (SSO), >10 log10cfu/g (TVC) <strong>and</strong> >9log10cfu/g (Enterobacteriaceae)<br />
on the sk<strong>in</strong>.<br />
The SSO counts were lower than the TVC counts at the beg<strong>in</strong>n<strong>in</strong>g period (4 days) but after<br />
that the difference between these counts varied only by very small marg<strong>in</strong>s. Even with the<br />
high sk<strong>in</strong> counts the fish still had a freshness good quality for process<strong>in</strong>g after 22 days of<br />
storage for other products preferably frozen fillets. Whereas dur<strong>in</strong>g the fourth week of<br />
storage <strong>in</strong> ice, the freshness of the fish was also evaluated fit for other <strong>Nile</strong> perch products<br />
markets or f<strong>in</strong>al consumers but not for process<strong>in</strong>g prime fresh chilled <strong>Nile</strong> perch products<br />
for export.<br />
45<br />
Figure 6: Changes of specific spoilage<br />
organism (SSO), total viable counts<br />
(TVC) <strong>and</strong> Enterobacteriaceae (Ent<strong>in</strong><br />
whole <strong>Nile</strong> perch dur<strong>in</strong>g storage <strong>in</strong> ice.<br />
The overall results on QIM score, spoilage micro flora <strong>and</strong> TVB-N dur<strong>in</strong>g shelf life study <strong>in</strong><br />
whole <strong>Nile</strong> perch stored <strong>in</strong> ice at 0-3 o C are shown <strong>in</strong> figures 7 <strong>and</strong> 8. Parallel trends were<br />
observed between all the results on the spoilage micro flora <strong>and</strong> QIM score imply<strong>in</strong>g that<br />
they are good quality parameters for decision mak<strong>in</strong>g on rat<strong>in</strong>g freshness quality attributes<br />
for whole <strong>Nile</strong> perch stored <strong>in</strong> ice (figure 7). However, Enteobacteriaceae counts <strong>and</strong> TVB-<br />
N were parallel <strong>and</strong> both characterized by a constant <strong>in</strong>crease dur<strong>in</strong>g all four weeks (26-28<br />
days) storage time (figure 8).
Figure 7: Changes of specific spoilage<br />
organism (SSO), total viable counts<br />
(TVC), Enterobacteriaceae (Ent.) <strong>and</strong><br />
QIM score <strong>in</strong> whole <strong>Nile</strong> perch dur<strong>in</strong>g<br />
storage <strong>in</strong> ice.<br />
4.2.1.3 Chemical analysis<br />
46<br />
Figure 8: Changes of specific spoilage<br />
organism (SSO), total viable counts<br />
(TVC), Enterobacteriaceae (Ent.) <strong>and</strong><br />
TVB-N <strong>in</strong> whole <strong>Nile</strong> perch dur<strong>in</strong>g<br />
storage <strong>in</strong> ice.<br />
The TVB-N results for whole <strong>Nile</strong> perch were stable with levels between 6-8 mgN/100g<br />
dur<strong>in</strong>g the first three weeks of storage <strong>in</strong> ice (figure 9). Then the levels <strong>in</strong>creased steadily<br />
up to 16.80mgN/100g after 33 days of storage. The relation between the TVB-N <strong>and</strong> QIM<br />
score changes dur<strong>in</strong>g the storage time is shown <strong>in</strong> figure 10. Generally there is no parallel<br />
relation between these parameters imply<strong>in</strong>g that they can not be used as a complimentary<br />
pair to make decision for the freshness quality of fresh whole <strong>Nile</strong> perch stored <strong>in</strong> ice. QIM<br />
scores showed a cont<strong>in</strong>uous <strong>in</strong>creas<strong>in</strong>g trend as opposed to TVB-N for the first 3 weeks of<br />
storage. TVB-N showed a constant lag phase for 3 weeks <strong>and</strong> <strong>in</strong>creas<strong>in</strong>g phase from 20-33<br />
days of storage. This implies that QIM score is better method than TVB-N values for<br />
evaluat<strong>in</strong>g the freshness quality of <strong>Nile</strong> perch dur<strong>in</strong>g storage <strong>in</strong> ice. The pH of whole <strong>Nile</strong><br />
perch sk<strong>in</strong> shifted from 7.01to 7.11 dur<strong>in</strong>g the storage time of 33 days.
Figure 9: Changes of TVB-N <strong>in</strong> whole<br />
<strong>Nile</strong> perch dur<strong>in</strong>g storage <strong>in</strong> ice.<br />
47<br />
Figure 10: Changes of QIM <strong>and</strong> TVBN<br />
<strong>in</strong> whole <strong>Nile</strong> perch dur<strong>in</strong>g storage <strong>in</strong><br />
ice.<br />
4.2.2 Phase II trial 2: Shelf life of laboratory chilled <strong>Nile</strong> perch fillets<br />
4.2.2.1 Microbiological analysis<br />
The maximum storage time of ice stored newly caught <strong>Nile</strong> perch fillets was 17-23 days.<br />
The freshness quality of the fillets was judged very good up to 17 storage days. The good<br />
quality fillets were accepted up 19-21 days <strong>and</strong> spoiled on the last two (22-23) storage days.<br />
The microbiological changes SSO, TVC <strong>and</strong> Enterobacteriacea counts <strong>in</strong> chilled <strong>Nile</strong><br />
perch fillets stored at laboratory refrigerator 0-3 o C, processed from newly caught whole<br />
<strong>Nile</strong> perch after 2 days storage <strong>in</strong> ice. The SSO counts of fillets after 2 days were about 2<br />
log10 cfu/g <strong>and</strong> rapidily <strong>in</strong>creased up to >5 log10 cfu/g after 6 days of storage. Then<br />
decreased from 5.72-4.93 log10 cfu/g up to 10 storage days, <strong>and</strong> <strong>in</strong>creased aga<strong>in</strong> up to 8.35<br />
log10 cfu/g after 17 days of storage. TVC counts slowly <strong>in</strong>creased from 4.42-6.48 log10 cfu/g<br />
after 6 storage days <strong>and</strong> up to 8.54log10cfu/g after 17 days of storage. The trend was<br />
different for Enterobactereaceae which showed a decrease <strong>in</strong> counts from 4.60-3.31 log10<br />
cfu/g after 6 days of storage <strong>and</strong> then slowly <strong>in</strong>creased to 4.50 log10 cfu/g after 17 days of<br />
storage. F<strong>in</strong>aly all parameters <strong>in</strong>creased up to a stationary phase dur<strong>in</strong>g 17-23 storage days,<br />
8.74-9.31log10cfu/g (SSO), 9.61-9.67log10cfu/g (TVC) <strong>and</strong> 8.10log10cfu/g<br />
(Enterobacteriaceae) are shown <strong>in</strong> figure 11.
4.2.2.2 Chemical analysis<br />
Changes of total volatile base nitrogen (TVB-N) <strong>in</strong> chilled <strong>Nile</strong> perch fillets stored at 0-3 o C is<br />
shown <strong>in</strong> figure 12. The TVB-N showed a stable trend with low <strong>in</strong>crease <strong>in</strong> the first 12 days<br />
of storage (6.72-7.67mgN/100g of fillet). Then the levels rapidly <strong>in</strong>creased up to<br />
26.92mgN/100g after 23 days of storage. The values are below the acceptability limits of 30-<br />
35mgN/100g. In view of these slow changes dur<strong>in</strong>g the first 2 weeks <strong>and</strong> steady <strong>in</strong>creas<strong>in</strong>g<br />
after 23 days of storage time, the TVB-N is not a good <strong>in</strong>dicator for mak<strong>in</strong>g decision on<br />
freshness quality of chilled fillets. The change <strong>in</strong> pH was from 6.4 to 7.0 units dur<strong>in</strong>g 23 days<br />
storage time.<br />
Figure 11: Changes of specific spoilage<br />
organism (SSO), total viable counts<br />
(TVC) <strong>and</strong> Enterobacteriaceae (Ent.) <strong>in</strong><br />
chilled fillets from newly caught <strong>Nile</strong><br />
perch.<br />
48<br />
Figure 12: Changes of TVB-N <strong>in</strong><br />
chilled fillets from newly caught <strong>Nile</strong><br />
perch.<br />
The specific micro flora (SSO, TVC) sharply <strong>in</strong>creased at the bign<strong>in</strong>g of storage <strong>and</strong><br />
followed with a constant <strong>in</strong>crease. The Enterobacteriaceae changes showed general lag<br />
phase at the first 2 weeks of storage but steady <strong>in</strong>crease for the rema<strong>in</strong><strong>in</strong>g storage period <strong>and</strong><br />
chemical changes were stagnant dur<strong>in</strong>g 13 days of atorage (figure 13). Rapid changes<br />
occurred dur<strong>in</strong>g 2-3 week of storage, then a constant /stationary phase were noted <strong>in</strong> all<br />
microbiological counts <strong>and</strong> TVB-N depicted exponential <strong>in</strong>crease up to the end of storage<br />
time (23 days).
49<br />
Figure 13: Changes of specific spoilage<br />
organisms (SSO), total viable counts<br />
(TVC), Enterobacteriaceae (Ent.) <strong>and</strong><br />
TVB-N <strong>in</strong> chilled fillets from newly<br />
caught <strong>Nile</strong> perch.<br />
4.3 PHASE III: MICROBIOLOGY OF WHOLE NILE PERCH SWABS, ON LINE<br />
FILLETS AND SHELF LIFE OF ESTABLISHMENTS CHILLED FILLETS<br />
4.3.1 Phase III - Trial 1: <strong>Microbiology</strong> of whole <strong>Nile</strong> perch swabs <strong>and</strong> onl<strong>in</strong>e fillets<br />
Whole <strong>Nile</strong> perch is normally collected from various l<strong>and</strong><strong>in</strong>g sites on shore <strong>and</strong> isl<strong>and</strong>s of<br />
<strong>Lake</strong> Victoria. Whole <strong>Nile</strong> perch is not washed nor guted at fish<strong>in</strong>g grounds/upstream. It is<br />
collected <strong>and</strong> iced <strong>in</strong> the transportation vessels, <strong>in</strong>sulated boats <strong>and</strong> trucks at isl<strong>and</strong>s or<br />
l<strong>and</strong><strong>in</strong>g sites. Usually collection vessels collect fish at m<strong>in</strong>imum of 3 days to maximum of 3<br />
weeks (21days), dur<strong>in</strong>g this period the fish is stored <strong>in</strong> ice until transported to the<br />
establishments. The fish is off loaded <strong>and</strong> washed at the receiv<strong>in</strong>g section of the<br />
establishments. There are at least two wash<strong>in</strong>g stages. At the first stage the fish is scrubbed<br />
us<strong>in</strong>g brush (coloured) <strong>and</strong> washed with runnig/shower water. Then it is r<strong>in</strong>sed <strong>in</strong> next<br />
(second) stage by another h<strong>and</strong>ler/person <strong>and</strong> f<strong>in</strong>ally size graded <strong>and</strong> placed <strong>in</strong> a conta<strong>in</strong>er<br />
(figure 14) with melt<strong>in</strong>g ice <strong>and</strong> stored chilled until they are subjected to alternative<br />
processes. The tables 18 <strong>and</strong> 19 below show the microbiological results for TVC <strong>and</strong><br />
Enterobacteriaceae before (BW) <strong>and</strong> after wash<strong>in</strong>g (AW) of whole <strong>Nile</strong> perch <strong>and</strong> onl<strong>in</strong>e<br />
fillets prior to the super chill<strong>in</strong>g stage at three fish process<strong>in</strong>g establishments (E1, E2, &<br />
E3).
Figure 14: Whole <strong>Nile</strong> perch <strong>in</strong> sta<strong>in</strong>less conta<strong>in</strong>er after wash<strong>in</strong>g at establishments.<br />
The results of whole <strong>Nile</strong> perch swabs samples taken at receiv<strong>in</strong>g po<strong>in</strong>ts of the<br />
establishments are shown <strong>in</strong> table 18. There was a significant reduction of microbiological<br />
loads <strong>in</strong> particularly for Enterobacteriaceae <strong>in</strong> all three establishments. The reduction for<br />
Enterobacteriaceae was between 1.04-2.20 log cfu/cm 2 <strong>in</strong> the three establishments. The<br />
reduction <strong>in</strong> TVC was greatest <strong>in</strong> E1 (1.48 log cfu/cm 2 ) followed by E2 (0.5 log cfu/cm 2 )<br />
but <strong>in</strong>creased slightly <strong>in</strong> E3 (-0.27 log cfu/cm 2 ). The microbial loads <strong>in</strong> the three<br />
establishments BW for Enterobacteriaeae are 2.33–3.57 log cfu/cm 2 <strong>and</strong> for TVC from<br />
5.08-6.12 log cfu/cm 2 .<br />
Table 18: Whole <strong>Nile</strong> perch swabs before <strong>and</strong> after wash at establishments.<br />
ESTABL.<br />
50<br />
SWABS BEFORE WASH (BW) AND AFFTER WASH (AW)<br />
TVC – LOG CFU/cm2 ENTEROBACTERIACEAE - LOG CFU/cm2<br />
BW AW BW-AW BW AW BW-AW<br />
E1 6,12 4,64 1,48 3,57 1,37 2,20<br />
E2 5,48 4,98 0,50 2,33 1,29 1,04<br />
E3 5,08 5,35 -0,27 3,49 1,76 1,73<br />
The results of onl<strong>in</strong>e sk<strong>in</strong> less fillets taken from three establishments are shown <strong>in</strong> table 19.<br />
The Enterobacteriaceae counts BW ranged from 2.91-4.55 log10cfu/g <strong>and</strong> 1.63-3.33 log10<br />
cfu/g AW. There was significant reduction for E2, 4.55-1.63 log10 cfu/g BW <strong>and</strong> AW<br />
respectively, but no change for the E1 & E3. The results for TVC <strong>in</strong> all three establishments
BW were 5.49-6.27 log10 cfu/g, less than 1 log10 cfu/g different between the establishments.<br />
The TVC after wash<strong>in</strong>g was between 3.54-6.03 log10 cfu/g, imply<strong>in</strong>g that there was a<br />
significant reduction <strong>in</strong> microbial loads between BW <strong>and</strong> AW. The (BW-AW) value for<br />
Enterobacteriaceae was between -0.02–2.93log10cfu/g <strong>and</strong> TVC between 0.24-<br />
1.95log10cfu/g <strong>in</strong> all three establishments.<br />
Table 19: On l<strong>in</strong>e <strong>Nile</strong> perch fillets before <strong>and</strong> after wash<strong>in</strong>g at the establishments.<br />
ESTABL.<br />
51<br />
ONLINE FILLETS BEFORE WASH (BW) AND AFFTER WASH (AW)<br />
TVC - LOGCFU/G ENTEROBACTERIACEAE - LOGCFU/G<br />
BW AW BW-AW BW AW BW-AW<br />
E1 6,27 6,03 0,24 3,31 3,33 -0,02<br />
E2 5,49 3,54 1,95 4,55 1,63 2,93<br />
E3 5,55 4,83 0,72 2,91 2,92 0,00<br />
4.3.2 Phase III – Trial 2: Shelf life of establishments chilled fillets<br />
4.3.2.1 Establishment E1 – chilled fillets (10 days iced whole <strong>Nile</strong> perch)<br />
<strong>Nile</strong> perch chilled fillets were sampled from a lot of raw fish stored <strong>in</strong> ice for 10 days before<br />
be<strong>in</strong>g processed. Figures 16-18 shows the changes <strong>in</strong> spoilage micro flora <strong>and</strong> TVB-N <strong>in</strong><br />
chilled fillets dur<strong>in</strong>g shelf life study. SSO <strong>and</strong> TVC <strong>in</strong>crease were considerably more than<br />
Enterobacteriaceae <strong>and</strong> TVB-N characterised no significant <strong>in</strong>crease dur<strong>in</strong>g the first 12<br />
days.The changes <strong>in</strong> SSO <strong>and</strong> TVC <strong>in</strong> chilled fillets dur<strong>in</strong>g the first 12 storage days after<br />
process<strong>in</strong>g showed slow <strong>in</strong>crease followed by a sharp <strong>in</strong>crease between days 12-15. The<br />
Enterobacteriaceae rema<strong>in</strong>ed more or less constant for the first 12 days of storage but<br />
<strong>in</strong>creased sharply like SSO <strong>and</strong> TVC between days 12-15 (figure 16). The results depict that<br />
the SSO <strong>and</strong> TVC counts are generally high compared to the laboratory chilled fillets. The<br />
general observation here is that SSO <strong>and</strong> TVC counts are differ<strong>in</strong>g <strong>in</strong> very small marg<strong>in</strong>s<br />
imply<strong>in</strong>g that the SSO were already <strong>in</strong> high numbers follow<strong>in</strong>g 10 days storage of whole <strong>Nile</strong><br />
perch <strong>in</strong> ice. The level of Enterobacteriaceae counts are lower compared to SSO <strong>and</strong> TVC<br />
counts which is similar as observed with laboratory chilled fillets. Figure 17 shows chemical<br />
(TVB-N) changes dur<strong>in</strong>g storage of chilled fillets. The results show very low <strong>in</strong>crease from<br />
6.55-8.65mgN/100g for up to 12 days of storage. Then the levels <strong>in</strong>creased rapidily to
21mgN/100g from days 12-15 which correlates with similar <strong>in</strong>crease <strong>in</strong> the microbiological<br />
counts for the same period. The changes <strong>in</strong> pH shifted from 6.7 to 7.0 units dur<strong>in</strong>g all 15 days<br />
of storage.<br />
Figure 15: Changes of specific spoilage<br />
organisms (SSO), total viable counts<br />
(TVC) <strong>and</strong> Enterobacteriaceae (Ent.) on<br />
chilled fillets <strong>in</strong> E1.<br />
52<br />
Figure 16: Changes of TVB-N on<br />
chilled fillets <strong>in</strong> E1<br />
Figure 17: Changes of specific spoilage<br />
organism (SSO), total viable counts<br />
(TVC), Enterobacteriaceae (Ent.) <strong>and</strong><br />
TVB-N on chilled fillets.<br />
4.3.2.2 Establishment E2 – chilled fillets (17 days iced whole <strong>Nile</strong> perch)<br />
<strong>Nile</strong> perch chilled fillets were processed <strong>and</strong> sampled from a lot of raw fish stored <strong>in</strong> ice for<br />
17 days before process<strong>in</strong>g. Establishment E2 showed a constant <strong>in</strong>crease for the SSO <strong>and</strong><br />
TVC counts dur<strong>in</strong>g the first 12 days of storage after process<strong>in</strong>g then followed by a rapid<br />
<strong>in</strong>crease up to 15 days of storage (figure 18). The <strong>in</strong>itial counts were >4 log10 cfu/g after 2<br />
days of storage <strong>and</strong> <strong>in</strong>creased <strong>in</strong> 1 week to about 7 log10 cfu/g <strong>and</strong> then sharply <strong>in</strong>creased to<br />
≥10 log10 cfu/g counts which were more than counts reached by spoiled <strong>Nile</strong> perch stored<br />
<strong>in</strong> ice for 33 days. The Enterobacteriaceae counts <strong>in</strong>creased from 2-4 log10 cfu/g up to the
end of the storage time. These results depict that from the beg<strong>in</strong><strong>in</strong>g of storage after<br />
process<strong>in</strong>g; the spoilage micro flora counts were generally high compared to the counts of<br />
laboratory chilled fillets. The <strong>in</strong>terest<strong>in</strong>g observation is that SSO <strong>and</strong> TVC were almost<br />
parallel imply<strong>in</strong>g that the SSOs were already <strong>in</strong> big numbers follow<strong>in</strong>g the 17 days storage<br />
of whole <strong>Nile</strong> perch <strong>in</strong> ice. Figure 19 shows chemical (TVB-N) changes dur<strong>in</strong>g storage of<br />
the chilled <strong>Nile</strong> perch fillets. The trend shows constant lag phase compared to the<br />
exponential changes of spoilage micro flora dur<strong>in</strong>g the first 12 days of storage. The changes<br />
were very narrow between 5-7mgN/100g up to 12 days of storage, but <strong>in</strong>creased to<br />
10mgN/100g dur<strong>in</strong>g 12-15 days of storage. The general trends shows rapid <strong>in</strong>crease of SSO<br />
<strong>and</strong> TVC dur<strong>in</strong>g the storage period, but moderate <strong>in</strong>crease <strong>in</strong> TVB-N for the first 12 days<br />
<strong>and</strong> then exponentially <strong>in</strong>crease from 12-15 days of storage The changes <strong>in</strong> pH shifted from<br />
6.62-6.82 units dur<strong>in</strong>g the 15 days of storage.<br />
Figure 18: Changes of specific spoilage<br />
organism (SSO), total viable counts<br />
(TVC) <strong>and</strong> Enterobacteriaceae (Ent.) on<br />
chilled fillets.<br />
53<br />
Figure 19: Changes of TVB-N on chilled<br />
fillets<br />
Figure 20: Changes of specific spoilage<br />
organism (SSO), total viable counts<br />
(TVC) <strong>and</strong> Enterobacteriaceae (Ent.)<br />
<strong>and</strong> TVB-N on chilled fillets.
4.3.2.3 Establishment E3 – chilled fillets (6 days iced whole <strong>Nile</strong> perch)<br />
Chilled fillets were processed <strong>and</strong> sampled from a lot of whole <strong>Nile</strong> perch stored <strong>in</strong> ice for 6<br />
days. Changes of spoilage micro flora on chilled fillets dur<strong>in</strong>g shelf life study showed<br />
constant <strong>in</strong>crease up to 15 days of storage (figure 23). The SSO <strong>and</strong> TVC counts produced<br />
parallel <strong>in</strong>crease dur<strong>in</strong>g the storage period but theTVB-N levels rema<strong>in</strong>ed more or less<br />
unchanged for the first 13 days <strong>and</strong> then <strong>in</strong>creased rapidily from days 13-17 of storage. The<br />
SSO <strong>and</strong> TVC <strong>in</strong>creased from 3-8 log10 cfu/g <strong>and</strong> the Enterobacteriaceae only from 2-3<br />
log10 cfu/g dur<strong>in</strong>g 13 days of storage as can be seen <strong>in</strong> figure 21. After 17 storage days, the<br />
counts <strong>in</strong>creased to >8 log10 cfu/g (SSO), <strong>and</strong> >9 log10 cfu/g (TVC) while there were no<br />
<strong>in</strong>crease for Enterobacteriaceae counts. The TVB-N values rema<strong>in</strong>ed constant between 5-<br />
7mgN/100g up to 15 storage days. It then <strong>in</strong>creased to >10mgN/100g dur<strong>in</strong>g days 15-17 of<br />
storage (figure 22). The TVB-N values were below the maximum acceptable limits. The<br />
changes <strong>in</strong> pH shifted with<strong>in</strong> 6.8-7.3 units dur<strong>in</strong>g all 17 storage days.<br />
Figure 21: Changes of specific<br />
spoilage organism (SSO), total viable<br />
counts (TVC) <strong>and</strong> Enterobacteriaceae<br />
(Ent.) on chilled fillets.<br />
54<br />
Figure 22: Changes of TVB-N on<br />
chilled fillets.<br />
Figure 23: Changes of specific spoilage<br />
organisms (SSO) total viable counts,<br />
Enterobacteriaceae (Ent.) <strong>and</strong> TVB on<br />
chilled fillets.
4.3.2.4 Establishment E4 – chilled fillets (5 days iced whole <strong>Nile</strong> perch)<br />
Chilled <strong>Nile</strong> perch fillets were processed from a lot of whole <strong>Nile</strong> perch stored <strong>in</strong> ice for 5<br />
days. Changes for spoilage bacteria on chilled fillets were constant up to 13 storage days<br />
(figure 24 <strong>and</strong> 25). The trend was characterised by an <strong>in</strong>crease for both SSO <strong>and</strong> TVC <strong>in</strong><br />
parralel <strong>and</strong> reached a stationary phase after 13-15 storage days. The changes <strong>in</strong> TVB-N<br />
showed moderate <strong>in</strong>crease from the beg<strong>in</strong>n<strong>in</strong>g up to 13 days <strong>and</strong> then very rapid <strong>in</strong>crease<br />
between days 13-15. The SSO <strong>and</strong> TVC <strong>in</strong>creased from 3-7log10cfu/g <strong>in</strong> the first 10 days of<br />
storage <strong>and</strong> to 9 log10 cfu/g after 15 days while the Enterobacteriaceae counts gave only a<br />
slight <strong>in</strong>crease from 2.5-3.7 log10 cfu/g. Aga<strong>in</strong> these results <strong>in</strong>dicate that the SSO counts are<br />
closely equals to TVC counts between 13-15 storage days. The chemical (TVB-N) changes<br />
dur<strong>in</strong>g 15 days storage of chilled <strong>Nile</strong> perch fillets show an <strong>in</strong>crease from about 5-<br />
13mgN/100g up to 15 storage days (figure 25 <strong>and</strong> 26). The changes <strong>in</strong> pH shifted from 6.5-<br />
6.9 units dur<strong>in</strong>g 15 storage days.<br />
Figure 24: Changes of specific spoilage<br />
organism (SSO), total viable counts<br />
(TVC) <strong>and</strong> Enterobacteriaceae (Ent.) on<br />
chilled fillets.<br />
55<br />
Figure 25: Changes of TVB-N on chilled<br />
fillets.<br />
Figure 26: Changes of specific spoilage<br />
organism (SSO), total viable counts<br />
(TVC), Enterobacteriaceae (Ent.) <strong>and</strong><br />
TVB-N on chilled fillets.
The results from chilled fillets (figure 27) from all four establishments show similar trends<br />
on both spoilage microflora <strong>and</strong> TVB-N. Changes <strong>in</strong> the spoilage micro flora on all chilled<br />
fillets dur<strong>in</strong>g storage, <strong>in</strong>itially were 3-4log10cfu/g <strong>and</strong> at the end of storage time were ≥8-<br />
9log10cfu/g (5 <strong>and</strong> 6 days <strong>in</strong> ice) <strong>and</strong> ≥10log10cfu/g (10 <strong>and</strong> 17 days <strong>in</strong> ice) respectively. The<br />
changes <strong>in</strong> total volatile base nitrogen (TVB-N) were from 10-21mgN/100g, the values were<br />
well below the maximum limits of 30-35mgN/100g of acceptability of fresh fish. The trends<br />
<strong>in</strong> SSO <strong>and</strong> TVC counts are better than Enterobacteriaceae <strong>and</strong> TVB-N imply<strong>in</strong>g that are<br />
good <strong>in</strong>dicators for mak<strong>in</strong>g decision of freshness quality of chilled fillets stored at low<br />
temperatures (0-3 o C).<br />
Figure 27: Chilled fillets from establishments<br />
4.4 PRESUMPTIVE SSOs<br />
At the end of storage time for whole <strong>Nile</strong> perch <strong>and</strong> chilled fillets, few colonies from plates<br />
of IA <strong>and</strong> VRBGA were confirmed. Most colonies results were Gram-negative, rod shaped,<br />
oxidase positive, catalase positive, <strong>and</strong> Hugh <strong>and</strong> Leifson (O/F – fermentative <strong>in</strong> glucose).<br />
Few colonies were oxidase/catalase negative <strong>and</strong> non fermentative <strong>in</strong> glucose. The<br />
Enterobacteriaceae colonies from VRBGA also were Gram-negative, rod shaped, oxidase<br />
negative, catalase positive, <strong>and</strong> Hugh <strong>and</strong> Leifson (O/F – fermentative <strong>in</strong> glucose). These<br />
results imply that the ma<strong>in</strong> SSO (H2S) on iced whole <strong>Nile</strong> perch <strong>and</strong> chilled fillets may be<br />
caused by Shewanella putrefaciens, Pseudomonas, Vibrios/Aeromonas <strong>and</strong><br />
Enterobactericeae (figure 28).<br />
56
Figure 28: Flow chart employed for identification of Gram-negative specific spoilage<br />
bacteria <strong>in</strong> spoil<strong>in</strong>g iced whole <strong>Nile</strong> perch <strong>and</strong> chilled fillets stored at 0-3 o C.<br />
4.5 SHELF LIFE OF ICED WHOLE NILE PERCH AND CHILLED FILLETS<br />
The summery of results for estimated shelf life for iced whole <strong>Nile</strong> perch (both sensory<br />
assesment <strong>and</strong> microbiological counts) <strong>and</strong> chilled fillets (microbiological counts) stored at<br />
0-3 o C are shown <strong>in</strong> table 20. Shelf life of newly caught iced whole <strong>Nile</strong> perch was<br />
estimated to be about 4 weeks (26-28 days). The laboratory chilled fillets had a long shelf<br />
life (17 days) compared to establishments chilled fillets. The estimated shelf life for<br />
establishment’s chilled fillets processed after long storage time of 17 days <strong>in</strong> ice was 8<br />
storage days compared to 10-13 storage days for other chilled fillets (processed after 10, 6<br />
<strong>and</strong> 5 storage days <strong>in</strong> ice).<br />
Table 20: Shelf life (Estimated) <strong>and</strong> spoilage micro flora of iced whole <strong>Nile</strong> perch <strong>and</strong><br />
chilled fillets stored at 0-3 o C<br />
TYPE OF<br />
SAMPLE<br />
LABORATORY/<br />
ESTABLSHMENTS<br />
57<br />
OXIDASE POSITIVE<br />
ROD SHAPE<br />
NO FERMENTATION - O/F<br />
Shewanella putrefaciens/<br />
Pseudomonas<br />
GRAM –NEGATIVE BACTERIA<br />
FERMENTATION - O/F<br />
Aeromonas/Vibrios<br />
OXIDASE NEGATIVE<br />
ROD SHAPE<br />
FERMENTATION - O/F<br />
Enterobacteriaceae<br />
FISH SKIN CHILLED FILLETS/<br />
ICEDE NILE PERCH<br />
LOGCFU/<br />
CM 2 INITIAL-TVC MAXIMUM-<br />
/G<br />
LOGCFU/G TVC LOGCFU/G<br />
EST. SHELF<br />
LIFE<br />
DAYS<br />
4 DAYS (LAB) 4 4 10 17<br />
5 DAYS (E4) - 4 9 10-13<br />
6 DAYS (E3) 5 3 10 13<br />
10 DAYS (E1) 6 5 9 12<br />
17 DAYS (E2) 5 5 10 8<br />
NILE PERCH 4LOGCFU/G* 4* 11* 26-28*<br />
*Results for newly caught whole <strong>Nile</strong> perch stored <strong>in</strong> ice
5 DISCUSSION<br />
5.1 PHASE I: NATURAL MICROBIOLOGY OF WATER, SEDIMENTS AND<br />
WHOLE NILE PERCH<br />
Bacteria <strong>in</strong> aquatic environment may be categorised <strong>in</strong>to two groups which <strong>in</strong>clude those<br />
that are naturally present <strong>in</strong> the aquatic environment (<strong>in</strong>digenous bacteria) <strong>and</strong> others that<br />
could be present as a result of contam<strong>in</strong>ation by human or animal or bird’s wastes or<br />
contam<strong>in</strong>ation dur<strong>in</strong>g post-harvest h<strong>and</strong>l<strong>in</strong>g <strong>and</strong> process<strong>in</strong>g. The general results on<br />
microbiology of surface water, the bottom sediments <strong>and</strong> surface sk<strong>in</strong> <strong>and</strong> guts of <strong>Nile</strong><br />
perch <strong>in</strong> connection to the aquatic environment <strong>in</strong>dicate different levels of microorganisms.<br />
5.1.1 Phase I trial 1: Water<br />
Low counts of microorganisms <strong>in</strong> water often <strong>in</strong>dicate that the water is not polluted by<br />
animal manures or human wastes. On the other h<strong>and</strong> it implies that the water is not rich<br />
habitat of microorganisms because it is poor <strong>in</strong> nutritional content required by the habitats<br />
<strong>and</strong> growth of most microorganisms (Adams <strong>and</strong> Moss, 2008). Presence of E. coli is<br />
obviously <strong>in</strong>dicat<strong>in</strong>g possibilities of resent contam<strong>in</strong>ation from animals or birds. While for<br />
presumptive Vibrio cholerae it could imply that Vibrio spp. is part of the <strong>in</strong>digenous micro<br />
flora of the aquatic environment where it is reported to occur naturally (Popovic et al.,<br />
1993).<br />
5.1.2 Phase I trial 2: Sediments<br />
The significant total viable counts results on sediments may be taken <strong>in</strong>to account that the<br />
sediments are natural reservoir of aquatic environmental (<strong>in</strong>digenous) micro flora that may<br />
contribute to the microbial load <strong>in</strong> liv<strong>in</strong>g fish. Sediments may be the major source of<br />
contam<strong>in</strong>ation <strong>in</strong> catches/ fishes but it depends on method of fish<strong>in</strong>g like trawl<strong>in</strong>g which<br />
may lead to high contam<strong>in</strong>ation, less with nets <strong>and</strong> least with long l<strong>in</strong>e methods. The low<br />
numbers of Enterobacteriaeceae, E. coli <strong>and</strong> the absence of pathogenic microorganisms <strong>in</strong><br />
sediments <strong>in</strong>dicate that this family (Enterobacteriaceae) do not survive well <strong>in</strong> sediment as<br />
it is only dom<strong>in</strong>ant <strong>in</strong> the guts of animals such as fish. It also implies that there was no<br />
58
contam<strong>in</strong>ation by human, animal or birds along Mwanza gulf fish<strong>in</strong>g area. The presence of<br />
these <strong>in</strong>dicators organisms <strong>and</strong> pathogens <strong>in</strong> sediments implies contam<strong>in</strong>ation from faeces<br />
of human or animal orig<strong>in</strong>, (Huss, Dalgaard <strong>and</strong> Gram, 1997; Doyle, 1990).<br />
5.1.3 Phase I trial 3: Whole <strong>Nile</strong> perch<br />
The presence of Salmonella may <strong>in</strong>dicate contam<strong>in</strong>ation by aquatic birds or from animal<br />
orig<strong>in</strong>. Salmonella contam<strong>in</strong>ation of Whole <strong>Nile</strong> perch <strong>and</strong> <strong>Nile</strong> perch products can also<br />
result from fish h<strong>and</strong>lers <strong>and</strong> contact surfaces if GMP/GHP/HACCP programmes are not<br />
properly adhered too. The results of this study show significant Total Viable Counts <strong>and</strong><br />
Enterobacteriaceae counts <strong>in</strong> <strong>Nile</strong> perch guts samples. The Total Viable Counts range from<br />
2.4 x 10 2 – 1.0 x 10 6 cfu/g <strong>and</strong> the Enterobacteriaceae counts from 0 – 3.8 x 10 4 cfu/g.<br />
Both TVC <strong>and</strong> Enterobacteriaceae are <strong>in</strong> agreement with the range of 10 3 -10 6 cfu/g of guts<br />
found by Adams <strong>and</strong> Moss (2008); Shewan (1962); ICMSF (1980b); <strong>and</strong> Liston et al.,<br />
(1976). Suspicious presence of Vibrio cholerae bacterium <strong>in</strong> one sample of <strong>Nile</strong> perch guts<br />
may be attributed to the feed<strong>in</strong>g habit of fish which is carnivorous. It could have been<br />
feed<strong>in</strong>g on other small pelagic fishes like sard<strong>in</strong>es or small tilapias prior it was caught.<br />
5.2 PHASE II: SHELF LIFE OF LABORATORY ICED WHOLE NILE PERCH<br />
59<br />
AND CHILLED FILLETS<br />
5.2.1 Phase II trial 1: Shelf life of iced whole <strong>Nile</strong> perch<br />
5.2.1.1 Sensory/organoleptic assessment<br />
The storage time of whole <strong>Nile</strong> perch was estimated 3- 4 weeks i.e. 26-28 days. The<br />
excellent <strong>and</strong> very good freshness quality fish scored < 10 <strong>and</strong> 10-12 total QIM scores<br />
respectively. This was <strong>in</strong> agreement to the ma<strong>in</strong> goal of QIM that enables processors to<br />
predict the rema<strong>in</strong><strong>in</strong>g storage time of fish stored <strong>in</strong> ice (Larsen et al. 1992, Nielsen <strong>and</strong><br />
Jessen 1997, Hydilg <strong>and</strong> Nielsen 1998, Mart<strong>in</strong>sdottir et al. 2001). When the QIM score<br />
equals to 10 the rema<strong>in</strong><strong>in</strong>g storage time <strong>in</strong> ice is estimated to be about 5 days (Huss, 1995).<br />
In this study, total QIM score was 10 when whole <strong>Nile</strong> perch storage time <strong>in</strong> ice was
etween 15-20 days (2-3 weeks). Hence the estimated shelf life was likely to be 4 weeks or<br />
around 26-28 storage days as mentioned above. This is <strong>in</strong> agreement with Gram et al.,<br />
(1990) who reported long shelf life of <strong>Nile</strong> perch stored <strong>in</strong> ice of 28-30 days. The results of<br />
this study also show agreement with the study by Gram et al., (1990) for <strong>Nile</strong> perch which<br />
was spoiled after 33 days storage time. The spoilage rate of tropical water fish <strong>in</strong> ice<br />
compared to temperate water fish is considerably slower as shown <strong>in</strong> a study by Gram et<br />
al., (1987); <strong>and</strong> Ravn Jorgensen et al., (1988). Their results demonstrated that the tropical<br />
water fish generally spoiled after 4 weeks compered to 9-10 days <strong>and</strong> rarely 2-3 weeks for<br />
temprate water fish.<br />
5.2.1.2 Microbiological analysis<br />
The microbiological parameters analysed on sk<strong>in</strong> of whole <strong>Nile</strong> perch showed parallel <strong>and</strong><br />
/correlated <strong>in</strong>crease <strong>in</strong> counts throughout the storage time <strong>in</strong> ice. The TVC counts were the<br />
highest followed by SSOs counts <strong>and</strong> the lowest Enterobacteriaceae counts. The SSOs<br />
started with relatively low count but rapidly doubled (2- 6 log10 cfu/g) compared to TVC (4-<br />
6 log10 cfu/g) with<strong>in</strong> the first week of storage <strong>in</strong> ice. At the end of storage time (33 days)<br />
both SSO <strong>and</strong> TVC were > 10 log10 cfu/g while Enterobacteriaceae was > 9 log10 cfu/g.<br />
These counts of Enterobacteriaeceae are high compared to1.2 - 4.2log10cfu/cm 2 ) reported<br />
<strong>in</strong> spoil<strong>in</strong>g whole un-gutted ra<strong>in</strong>bow trout (Onchorynchus mykiss) stored <strong>in</strong> ice for over 18<br />
days storage period (Chytiri et al., 2004) . Similar low counts were reported <strong>in</strong> different<br />
fresh Mediterranean product’s shelf life (Ordonez et al. 2000; Tejada <strong>and</strong> Huidobro, 2002).<br />
In this work all analysed parameters reached between 8-9 log10 cfu/g of sk<strong>in</strong> of <strong>Nile</strong> perch<br />
after17-22 days storage <strong>in</strong> ice. Similar counts of > 10 8 cfu/cm 2 for SSOs were reported by<br />
Gram et al., (1989, 1990) after 3 weeks storage time of of whole <strong>Nile</strong> perch <strong>in</strong> ice. IMCSF,<br />
(1980b) reported TVC counts of nearly 10 8 cfu/cm 2 that rema<strong>in</strong>ed constant after 14 (>14)<br />
days of fish stored <strong>in</strong> ice. Gram et al., (1990); Gram 1990; <strong>and</strong> Huss, (1995) reported that<br />
tropical water fish <strong>in</strong> ice has longer storage life than temprate water fish because of longer<br />
lag phase between 1-2 weeks for bacterial growth <strong>in</strong> tropical water fish compared to<br />
temprate fish.<br />
In this study QIM (Organoleptic/sensory assessment) scores were far below the maximum<br />
score of 20-24 (table 5). The bacterial counts were really <strong>in</strong> high numbers beyond 8 log10<br />
60
cfu/g after 2-3 weeks storage <strong>in</strong> ice. In this study it has been noted that storage time up to 3<br />
weeks (17-22 days <strong>in</strong> ice), freshness quality of whole <strong>Nile</strong> perch can be accepted to process<br />
good quality products (chilled fillets). The storage life can be extended to 28-30 days for<br />
products that can be frozen or heat treated. At the end of storage time after 33 days the<br />
microbial loads rema<strong>in</strong>ed constant at ≥ 10 log10 cfu/g when the fish was judged spoiled.<br />
The bacterial load on sk<strong>in</strong> is usually lowered by wash<strong>in</strong>g fish (with treated water) dur<strong>in</strong>g<br />
process<strong>in</strong>g at establishments <strong>and</strong> by low temperature treatment like chill<strong>in</strong>g/super chill<strong>in</strong>g<br />
<strong>and</strong> freez<strong>in</strong>g of processed fillets/products. In this context it is important to note that<br />
microbial loads <strong>in</strong> freshly caught fish may range from hundreds to millions (10 2 -10 7 ) per<br />
square centimetres on sk<strong>in</strong> depend<strong>in</strong>g on species <strong>and</strong> or fish<strong>in</strong>g areas (Adams <strong>and</strong> Moss<br />
(2008); Shewan (1962); ICMSF (1980b); <strong>and</strong> Liston et al., 1976).<br />
5.2.1.3 Chemical analysis<br />
Total volatile base nitrogen changes dur<strong>in</strong>g storage of whole <strong>Nile</strong> perch <strong>in</strong> ice was<br />
characterized with a small marg<strong>in</strong> of 6-8mgN/100g of fish flesh <strong>in</strong> the first 3 weeks of<br />
storage <strong>in</strong> ice but then <strong>in</strong>creased to 17mgN/100g at the end of storage after 33 days. This<br />
<strong>in</strong>dicates that TVB-N is not a good <strong>in</strong>dicator for the changes <strong>in</strong> freshness quality of whole<br />
<strong>Nile</strong> perch as the QIM scores <strong>and</strong> spoilage micro flora counts. It was reported by Gram et<br />
al., (1989), that TVB-N <strong>in</strong> <strong>Nile</strong> perch which hardly reached ≥ 14-24mgN/100g. Similar low<br />
levels of TVB-N approximate 14-20mgN/100g were reported on whole un-gutted ra<strong>in</strong>bow<br />
trout fresh water fish (Chytiri et al., 2004) <strong>and</strong> on European sea bass (Decentrarchus<br />
labrax) by Castro et al., (2006). In accordance with ICMSF, (1980b) these levels are very<br />
low compared to other species which may have TVB-N <strong>in</strong> the range of 20-30mgN/100g<br />
dur<strong>in</strong>g the first 2 weeks <strong>and</strong> > 30mg/100g after 2 weeks of storage <strong>in</strong> ice. Other athours<br />
have reported TVB-N values between 25mgN/100g (Castro et al., 2006) <strong>and</strong> 30-<br />
35mgN/100g (Connel, 1995; Huss, 1988) <strong>in</strong> European sea bass <strong>and</strong> ra<strong>in</strong>bow trout (Gimenez<br />
et al., 2002) stored <strong>in</strong> ice. Thus <strong>in</strong> this study the TVB-N value <strong>in</strong> <strong>Nile</strong> perch was well below<br />
the maximum limits 30-35mgN/100g <strong>and</strong> 25mgN/100g mentioned before. A noticed<br />
change <strong>in</strong> TVB-N occurred when the SSOs counts reached > 9 log10 cfu/g which is <strong>in</strong><br />
agreement with observation made by Dalgaard et al., (1993), who reported that counts 10 8 -<br />
10 9 cfu/g of S. putrefaens (SSO) are required for production of TMA. The TMA is one of<br />
61
the components contribut<strong>in</strong>g to TVB-N content. The value of TVB-N at which <strong>Nile</strong> perch is<br />
unacceptable is not well established, Karungi et al., (2004).<br />
The change/shift <strong>in</strong> pH units was constant (7.01-7.11) throughout storage time <strong>in</strong> ice. This<br />
was higher than the pH reported by Gram et al., (1989) which was 6.7-6.8 units but same<br />
small shift dur<strong>in</strong>g storage i.e. with<strong>in</strong> 0.1 units. Constant small shift has also been reported<br />
on ra<strong>in</strong>bow trout (Chytiri et al., 2004) <strong>and</strong> European sea bass, (Castro et al., 2006).<br />
5.2.2 Phase II trial 2: Shelf life of laboratory chilled fillets<br />
5.2.2.1 Microbiological analysis<br />
Storage time of Laboratory chilled <strong>Nile</strong> perch stored at 0-3 o C was between 17-23 days.<br />
Shelf life for good quality on freshness chilled fillets was 17 storage days. The average<br />
counts for both SSO <strong>and</strong> TVC were between 6-8 log10 cfu/g. Study on chilled <strong>Nile</strong> perch<br />
fillets stored at 0 o C by Gram et al., (1989) found total viable counts of 5 x 10 7 cfu/g <strong>and</strong><br />
SSO counts of 10 4 -10 5 cfu/g at the end of storage time (3 weeks). In the same study on<br />
contam<strong>in</strong>ated fillets with Pseudomonas, the SSO counts were 10 8 -10 9 cfu/g <strong>in</strong> 10 days of<br />
storage time <strong>and</strong> rema<strong>in</strong>ed constant for the rest of storage time which is <strong>in</strong> agreement with<br />
the present study. In this study the counts were stable from 20-23 days of storage. Counts of<br />
Enterobacteriaceae were constant around 4 log10 cfu/g dur<strong>in</strong>g the first 17 days of storage<br />
but then <strong>in</strong>creased to a stable 8 log10 cfu/g at day 18 until end of storage time. The growth<br />
rate of Enterobacteriaceae may be slower at low temperatures (0-3 o C) than that of other<br />
Gram-negative psychrotrophic spoilers (Chytiri et al., 2004). Mesophilic organisms like<br />
Enterobacteriaecea; require condition<strong>in</strong>g dur<strong>in</strong>g chill storage temperature before they can<br />
grow <strong>in</strong> big numbers. On the basis of this study Enterobacteriaceae may be considered as a<br />
part of the spoilage micro flora <strong>in</strong> chilled <strong>Nile</strong> perch fillets. Likewise, Hozbor et al., (2006)<br />
<strong>and</strong> Fonnesbech et al., (2005) reported Enterobacteriaceae <strong>in</strong> fresh salmon ice at aerobic<br />
storage conditions.<br />
62
5.2.2.2 Chemical analysis<br />
The level of Total volatile base nitrogen (TVB-N) <strong>in</strong> chilled <strong>Nile</strong> perch fillets was constant<br />
at 6-7mgN/100g for the first 12 days of storage but <strong>in</strong>creased rapidly after that to a value of<br />
27mgN/100g at the end of storage period of 23 days. This narrow change was also observed<br />
<strong>in</strong> whole <strong>Nile</strong> perch for the first 3 weeks. However the maximum TVB-N reached <strong>in</strong> chilled<br />
<strong>Nile</strong> perch 27mgN/100g was higher than the level on whole <strong>Nile</strong> perch which was<br />
16mgN/100g. Similar levels of TVB-N values of 18-26mgN/100g were reported on<br />
ra<strong>in</strong>bow trout fillets (Chytiri et al., 2004). This difference <strong>in</strong> TVB-N between whole <strong>Nile</strong><br />
perch <strong>and</strong> chilled fillets may be due to low numbers of spoilage bacteria penetration <strong>and</strong><br />
growth <strong>in</strong> the un-exposed flesh of whole <strong>Nile</strong> perch as compared to exposed chilled fillets<br />
(ICMSF, 1986). Rapid <strong>in</strong>crease <strong>in</strong> TVB-N corresponded with high counts (> 8 log10 cfu/g)<br />
of SSO <strong>and</strong> TVC <strong>in</strong> chilled fillets while similar changes corresponded with > 9 log10 cfu/g<br />
of the same counts <strong>in</strong> the sk<strong>in</strong> of whole <strong>Nile</strong> perch. This is <strong>in</strong> agreement with Chytiri et al.,<br />
(2004) results <strong>in</strong> similar study on ra<strong>in</strong>bow trout fillets stored <strong>in</strong> ice. In the present study the<br />
results are much lower than those earlier reported TVB-N of 48-60mgN/100g <strong>in</strong> <strong>Nile</strong> perch<br />
fillets stored at ambient temperature (Karnick <strong>and</strong> Lima dos Santos, 1985) <strong>and</strong> the limit of<br />
acceptability for iced stored cold water fish 30-35mgN/100g (Connell, 1995 <strong>and</strong> Huss,<br />
1988). The changes <strong>in</strong> concentration of TVB-N <strong>in</strong> spoil<strong>in</strong>g fish has been mentioned as<br />
unreliale <strong>in</strong>dicator for fish freshness, (Chytiri, et al., 2004; Dawood et al., 1986; Kyrana et<br />
al., 1997; Castro et al., 2006 <strong>and</strong> Tejada <strong>and</strong> Huidobro, 2002). The change <strong>in</strong> pH on chilled<br />
<strong>Nile</strong> perch fillets was with<strong>in</strong> the neutral pH range 6.4 to 7.0 units dur<strong>in</strong>g the storage of<br />
whole <strong>Nile</strong> perch above.<br />
5.3 PHASE III: MICROBIOLOGY OF WHOLE NILE PERCH SWABS, ON LINE<br />
FILLETS AND SHELF LIFE OF ESTABLISHMENTS CHILLED FILLETS<br />
5.3.1 Phase III - Trial 1: <strong>Microbiology</strong> of whole <strong>Nile</strong> perch swabs <strong>and</strong> onl<strong>in</strong>e fillets<br />
Swabs which were collected <strong>in</strong> three different establishments from whole <strong>Nile</strong> perch stored<br />
for long <strong>and</strong> short times (days) <strong>in</strong> ice (for 10 days - E1, 17 days - E2, <strong>and</strong> 6 days - E3 days)<br />
prior to process<strong>in</strong>g. Counts prior to wash for Enterobacteriaceae <strong>and</strong> TVC were 2-3 log10<br />
cfu/cm 2 <strong>and</strong> 5-6 log10 cfu/cm 2 respectively. Irrespective of the difference <strong>in</strong> storage days <strong>in</strong><br />
63
ice there was only a small marg<strong>in</strong> (different) of about 1 log10 cfu/cm 2 <strong>in</strong> both parameters on<br />
the sk<strong>in</strong> prior to wash between the three factories (establishments). The levels of TVC counts<br />
reflect that whole fish was stored <strong>in</strong> ice for considerably time. In accordance with ICMSF,<br />
(1986), normal micro flora counts on the sk<strong>in</strong> of fish at the time of harvest are <strong>in</strong> the region<br />
of 10 2 – 10 5 organisms per gram while an <strong>in</strong>crease to levels of > 10 6 per gram <strong>in</strong>dicates long<br />
storage <strong>in</strong> ice (chill conditions). Dur<strong>in</strong>g storage <strong>in</strong> ice, the bacteria loads, blood <strong>and</strong> slimes<br />
on sk<strong>in</strong> are cont<strong>in</strong>uously washed away by melt<strong>in</strong>g ice. The Total viable counts (prior-wash)<br />
<strong>in</strong> this study are with<strong>in</strong> the range reported by Adams <strong>and</strong> Moss (2008); Shewan (1962);<br />
ICMSF (1980b); <strong>and</strong> Liston et al., (1976); that, the bacterial loads on the sk<strong>in</strong> of fish from<br />
catch can range from hundreds up to millions per square centimetres (10 2 -10 7 numbers/cm 2 )<br />
of sk<strong>in</strong>. Gibson <strong>and</strong> Ogden, 1987; <strong>and</strong> Dalgaard <strong>and</strong> Huss, 1994), showed that the slow<br />
<strong>in</strong>crease <strong>in</strong> counts may be caused by effect of ice where by it retards the growth of<br />
microorganisms to less than one-tenth of the rate at optimal growth rates. While compared<br />
with the relative growth rate of microorganisms at 20-30 o C which is approximately 25 times<br />
higher than at 0 o C. The effect of wash<strong>in</strong>g whole fish on reduc<strong>in</strong>g bacterial loads was more<br />
significant for Enterobacteriaceae than for total viable counts. There were more than 1 log10<br />
cfu/cm 2 decreases after wash <strong>in</strong> Enterobacteriaceae at all three establishments but only <strong>in</strong><br />
one establishment <strong>in</strong> TVC counts. Hence these results reveal a good bacteriological<br />
freshness quality of whole fish for process<strong>in</strong>g as the counts were with<strong>in</strong> the limits refered to<br />
previously.<br />
The results prior <strong>and</strong> after wash<strong>in</strong>g for onl<strong>in</strong>e fillets correspond<strong>in</strong>g to the above different fish<br />
lots <strong>and</strong> establishments show some difference between establishments. Counts prior to fillets<br />
wash<strong>in</strong>g were 2,91 – 4,55 log10 cfu/g (Enterobacteriaceae) <strong>and</strong> 5,49 – 6,27 log10 cfu/g (TVC).<br />
A guidel<strong>in</strong>e on TVC level for fresh fish <strong>and</strong> fish products microbiological quality <strong>in</strong>clud<strong>in</strong>g<br />
fillets is 5x10 5 -10 7 colony form<strong>in</strong>g units per gram (cfu/g) of muscle (ICMSF, 1986) <strong>and</strong> for<br />
Enterobacteriaceae ≤ 10 3 cfu/g of muscles (fillets). Accord<strong>in</strong>g to the results before wash<strong>in</strong>g,<br />
the counts <strong>in</strong> 2 establishments were above levels of 10 3 cfu/g <strong>and</strong> <strong>in</strong> all 3 establishments above<br />
5x10 5 cfu/g for Enterobacteriaceae <strong>and</strong> TVC respectively. This is <strong>in</strong>dicat<strong>in</strong>g a likely<br />
contam<strong>in</strong>ation <strong>and</strong> or growth of microorganisms dur<strong>in</strong>g the subsequent process<strong>in</strong>g steps at<br />
establishments. However after wash the microbiological loads for E2 <strong>and</strong> E3 <strong>in</strong> fillets were<br />
significantly reduced below the maximum allowable limits < 10 3 cfu/g (Ent.) <strong>and</strong>
wash<strong>in</strong>g stage for fillets prior chill<strong>in</strong>g/freez<strong>in</strong>g is paramount important <strong>in</strong> order to reduce<br />
microbiological loads.<br />
5.3.2 Phase III – Trial 2: Shelf life of establishments chilled <strong>Nile</strong> perch fillets<br />
The estimates on storage time for chilled <strong>Nile</strong> perch fillets processed after long <strong>and</strong> short<br />
storage (10, 17, 6, & 5 days) of whole fresh <strong>Nile</strong> perch <strong>in</strong> ice from four establishments, E1-E4<br />
respectively was approximately 12, 8, <strong>and</strong> 10-13 days when the SSO/TVC counts reached 6-<br />
8 log10 cfu/g. The microbiological counts <strong>in</strong> long time (17 days) ice stored fish fillets were<br />
above the ICMSF-FAO/EU maximum guidel<strong>in</strong>es/limits (7 log10 cfu/g) after 8 storage days<br />
compared to the short time (5 days) ice stored fish which reached these counts after 10 -13<br />
days of storage (0-3 o C). The rate of spoilage has been reported be<strong>in</strong>g slow from sk<strong>in</strong> <strong>and</strong><br />
<strong>in</strong>creases for gutted, fillets <strong>and</strong> f<strong>in</strong>ally m<strong>in</strong>ced fish stored at chill conditions (ICMSF, 1980b).<br />
On the other h<strong>and</strong> long time storage of fish <strong>in</strong> ice allows growth of psychrotrophic bacteria<br />
(SSO) to big numbers, ICMSF, (1986) which def<strong>in</strong>itely reduce the shelf life of f<strong>in</strong>al processed<br />
fillets.<br />
Many studies have been published for the range of TVB-N values <strong>in</strong> <strong>Nile</strong> perch (Karungi et<br />
al., 2004). Many of these studies reported a concern that this parameter is not good <strong>in</strong>dicator<br />
for fish products freshness at ice/chill storage as <strong>in</strong> 5.2.2.2 laboratory chilled fillets above.<br />
This was also reported by Rehbe<strong>in</strong> <strong>and</strong> Olchlenschlager, (1982); Chytiri et al, (2004); Castro<br />
et al., 2006. The total volatile base am<strong>in</strong>e (TVB-N) produced dur<strong>in</strong>g later/advanced stages on<br />
chill/ice stored fish. Several authours have reported TVB-N value of ≤ 25mgN/100g for<br />
ra<strong>in</strong>bow trout, European sea bass <strong>and</strong> fresh Mediterranean fish (Chytiri et al., (2004); Castro<br />
et al., (2006); Kyrara <strong>and</strong> Lougovois, (2002) <strong>and</strong> Gimenez et al., (2002).<br />
5.3.2.1 Establishment E1 (10 days iced whole <strong>Nile</strong> perch)<br />
The storage life of fillets was approximately 12 days prior the beg<strong>in</strong>n<strong>in</strong>g of a rapid log<br />
phase with rapid <strong>in</strong>crease <strong>in</strong> the numbers of SSO, TVC <strong>and</strong> Enterobacteriaceae from 12-15<br />
storage days. It seems that the <strong>in</strong>crease <strong>in</strong> number of psychrotrophic bacteria (SSO, TVC) is<br />
relatively slow <strong>in</strong> the first 2 weeks at chill storage (0-3 o C). In this trial a common trend was<br />
observed to the laboratory chilled fillets trial <strong>in</strong> that both studies gave similar counts<br />
65
(around 6 log10 cfu/g) after 12 storage days regardless of the longer storage time of whole<br />
<strong>Nile</strong> perch <strong>in</strong> ice prior process<strong>in</strong>g at establishments. The long shelf life of fillets with <strong>in</strong>itial<br />
high counts of > 4 log10 cfu/g can be expla<strong>in</strong>ed by the lower psycrophilic counts <strong>in</strong><br />
tropical/fresh water fish compared to temprate water fish (Disney (1976) <strong>and</strong> Shwewan<br />
(1977).<br />
Total volatile base nitrogen changes were small <strong>and</strong> parallel with the Enterobacteriaceae<br />
counts dur<strong>in</strong>g the first 12 days of storage. The <strong>in</strong>crease <strong>in</strong> TVB-N levels depend on<br />
numbers of SSO, H2S (black colonies) produc<strong>in</strong>g bacteria i.e. Aeromonas <strong>and</strong> Shewanella<br />
(Gram et al., 1990). Likewise Enterobacteriaceae <strong>and</strong> non H2S (white colonies) produc<strong>in</strong>g<br />
bacteria which <strong>in</strong>clude Pseudomonas, Alcaligens, Moraxella, <strong>and</strong> Ac<strong>in</strong>etobacter can also<br />
produce TVB-N (Gram et al., 1987). In all spoilage micro flora <strong>and</strong> chemical changes were<br />
rapid after 12 days of storage. This means bacterial activity <strong>in</strong> the fish flesh leads to<br />
accumulation of TVB-N. The TVB-N content <strong>in</strong>clude TMA which is produced by bacteria<br />
when they are at higher numbers i.e. ≥ 10 8 -10 9 cfu/g (Chytiri et al., 2004; Rehbe<strong>in</strong> <strong>and</strong><br />
Oehbe<strong>in</strong>schlager, 1982).<br />
5.3.2.2 Establishment E2 (17 days iced whole <strong>Nile</strong> perch)<br />
Estimated storage life for the fillets based on the spoilage microbiological (SSO <strong>and</strong> TVC)<br />
counts is 8 days. This br<strong>in</strong>gs <strong>in</strong>to attention that <strong>Nile</strong> perch fillets that are aimed to be stored<br />
for a long time i.e. (>10 days) should be processed from a fish stored <strong>in</strong> ice for a maximum<br />
of 10-14 days. In Establishment E2 the whole fish had been stored <strong>in</strong> ice for 17 days prior<br />
to process<strong>in</strong>g. Here the fillets showed a spontaneously log phase from the beg<strong>in</strong>n<strong>in</strong>g of<br />
storage to the end with highest counts up to > 10 log10 cfu/g which has rarely been reported.<br />
The ICMSF, (1980b), reported four stages of fresh fish when stored <strong>in</strong> ice (table 4). At<br />
stage IV (> 14 storage days <strong>in</strong> ice) microbiological counts may reach ≥ 10 8 cfu/cm 2 <strong>and</strong><br />
rema<strong>in</strong> constant dur<strong>in</strong>g the rema<strong>in</strong><strong>in</strong>g storage time. The same was observed <strong>in</strong> the present<br />
work <strong>and</strong> also <strong>in</strong> a study by Gram et al., (1989). Although super chill<strong>in</strong>g treatment may<br />
have arrested or killed most of the microbial load there are still many which have survived<br />
<strong>and</strong> can account for the fast multiplication to levels beyond 10 log10 cfu/g with<strong>in</strong> 2 weeks of<br />
storage. This period (2 weeks) is declared by processors as the maximum shelf life/storage<br />
time for chilled fillets. However, it is important to fulfill the markets/ consumers<br />
requirements with respect to set shelf life as well as means of transportation <strong>and</strong> storage<br />
66
conditions which will ma<strong>in</strong>ta<strong>in</strong> the cold cha<strong>in</strong>. The shelf life can be extended if storage is at<br />
super chill<strong>in</strong>g conditions < 0 o C unlike the 0-3 o C used for this trial. Storage at sub zero<br />
temperatures (-2 <strong>and</strong> -3 o C) is reported to <strong>in</strong>crease shelf life (Riaz-Fatima et al., 1988 <strong>and</strong><br />
Sivertisvik et al., 2003; Huss 1995; Chang et al., 1998).<br />
The TVB-N changes were parallel to changes <strong>in</strong> the spoilage micro flora above. However<br />
the TVB-N changed from approximate 7-11mgN/100g which is well below the maximum<br />
acceptability to temperate water fish of 30-35mgN/100g, (Rehbe<strong>in</strong> <strong>and</strong> Olchlenschlager,<br />
1982; Connel, 1995; Huss, 1988).<br />
5.3.2.3 Establishment E3 (6 days iced whole <strong>Nile</strong> perch)<br />
The estimated storage life was 13 days. It is <strong>in</strong>terest<strong>in</strong>g that these results show shelf life that<br />
is close to that of the fillets from the whole fish that was stored longer <strong>in</strong> ice or for 10 days.<br />
The spoilage flora was characterised by very short lag phase <strong>and</strong> dom<strong>in</strong>ated by a log phase<br />
for 2-13 storage days <strong>and</strong> resulted <strong>in</strong> a stationary phase (≥ 8-9 log10 cfu/g) after 13-17<br />
storage days. Similar results was reported by Gram et al. (1989) <strong>in</strong> contam<strong>in</strong>ated<br />
(Pseudomonas) <strong>Nile</strong> perch fillets with counts from 10 8 -10 9 cfu/g after 10 storage days that<br />
rema<strong>in</strong>ed constant dur<strong>in</strong>g the rest of the storage time. Refer also to 5.2.2.1 <strong>and</strong> 5.3.2 above.<br />
Remarkably the TVB-N changes rema<strong>in</strong>ed constant for the first 13 storage days<br />
(6mgN/100g) <strong>and</strong> f<strong>in</strong>ally <strong>in</strong>creased to approximately 11mgN/100g at the end of storage. As<br />
previously the TVB-N (5.3.1.3 above) is low compared to the maximum limits 30-<br />
35mgN/100g. Accord<strong>in</strong>gly it was not good quality <strong>in</strong>dicator for fillets dur<strong>in</strong>g storage at<br />
chill conditions, see 5.2.2 .2 <strong>and</strong> 5.3.2 above. The same can be said for the pH shift from<br />
6.8 to 7.3 units.<br />
5.3.2.4 Establishment E4 (5 days iced whole <strong>Nile</strong> perch)<br />
Storage time was estimated approximately 10-13 days. Changes <strong>in</strong> both spoilage micro<br />
flora <strong>and</strong> chemical TVB-N gave similar trends as mentioned before <strong>in</strong> 5.2.2.2. The TVB-N<br />
slowly <strong>in</strong>creased from 5-13mgN/100g as described <strong>in</strong> 5.3.2 above.<br />
67
5.4 PRESUMPTIVE SSO<br />
There are two types of colonies-counts which are reported from growth on Iron Agar (IA),<br />
SSO H2S producers (black colonies) that may <strong>in</strong>clude bacteria like Shewanella putrefaciens<br />
<strong>and</strong> Vibrionaceae/ Aeromonas <strong>and</strong> the SSO non H2S producers (white colonies) that<br />
<strong>in</strong>clude Pseudomonas spp as well as Enterobacteriaceae spp (figure 34). These SSOs were<br />
identified by Gram et al., (1989) <strong>in</strong> whole <strong>Nile</strong> perch <strong>and</strong> fillets stored at 0 o C. Similar<br />
studies by Chytiri et al., (2004) <strong>in</strong> ra<strong>in</strong>bow trout; Fonnesbech et al., (2005) <strong>and</strong> Hozbor et<br />
al., (2006) <strong>in</strong> sea salmon all identified similar SSOs as Gram-negative, rod shaped, oxidase<br />
positive <strong>and</strong> glucose fermentative/non fermentative <strong>and</strong> or H2S producers <strong>and</strong> non H2S<br />
producers <strong>in</strong> IA.<br />
68
6 CONCLUSIONS AND RECOMMENDATION<br />
6.1 CONCLUSIONS<br />
<strong>Microbiology</strong> of fish<strong>in</strong>g grounds <strong>in</strong> Mwanza gulf showed remarkable bacteria counts <strong>in</strong><br />
sediments <strong>and</strong> whole <strong>Nile</strong> perch guts while lake water counts were approximately to detection<br />
limits i.e. 0-20cfu/ml. The human pathogen Salmonella <strong>and</strong> Vibrios spp were only detected <strong>in</strong><br />
2 samples out of 20 tested, one sample of lake water was positive for V. cholerae <strong>and</strong> one<br />
sample of <strong>Nile</strong> perch was positive for Salmonella. Therefore it may be concluded that these<br />
human pathogens occasionally may be derived from the fish<strong>in</strong>g environments of <strong>Nile</strong> perch.<br />
The average keep<strong>in</strong>g quality (shelf life) <strong>in</strong> days for iced whole <strong>Nile</strong> perch, laboratory <strong>and</strong><br />
establishments chilled fillets were 26-28; 17; 8-13 days respectively. Shelf life was short (8<br />
days) for long time (17 days) stored whole <strong>Nile</strong> perch <strong>in</strong> ice before process<strong>in</strong>g. Hence it may<br />
be suggested that the preferably maximum storage time for freshness good quality whole <strong>Nile</strong><br />
perch <strong>in</strong> ice is 1-2 weeks. While for longer storage periods of approximately of 2-3 weeks the<br />
fish can be processed for other products like frozen than chilled fillets respectively. In this<br />
work, the ma<strong>in</strong> spoilage organism’s composition <strong>in</strong> spoiled whole <strong>Nile</strong> perch <strong>and</strong> chilled<br />
fillets could <strong>in</strong>clude Shewanella putrefaciens, Vibrionaceae/ Aeromonas, Pseudomonas, <strong>and</strong><br />
Enterobacteriaceae.<br />
Both sensory/organoleptic (QIM score) assessment <strong>and</strong> microbiological methods were<br />
consistent/good while the chemical method was not good enough dur<strong>in</strong>g the early storage for<br />
whole <strong>Nile</strong> perch <strong>in</strong> iced <strong>and</strong> chilled fillets. Hence the chemical (TVB-N) parameter is not<br />
suggested as a reliable <strong>in</strong>dicator for freshness quality of iced whole <strong>Nile</strong> perch as well as<br />
chilled fillets.<br />
69
6.2 RECOMMENDATION<br />
1. Similar shelf life study is recommended to be repeated at different storage<br />
70<br />
temperatures such as at sub zero (-1 to +1 o C); 3-5 o C; 6-8 o C <strong>and</strong> 20-24 o C. Shelf life<br />
studies <strong>in</strong> other commercial fishes like <strong>Nile</strong> tilapia <strong>and</strong> Cat fish are also recommended.<br />
2. Fish establishments should ensure that chilled fillets are only processed from short<br />
time iced whole <strong>Nile</strong> perch i.e. 1-2 weeks.<br />
3. To establish appropriate quality <strong>in</strong>dex measurement (QIM) for whole <strong>Nile</strong> perch<br />
freshness sensory/organoleptic assessment.<br />
4. More characterization for ma<strong>in</strong> SSOs possibly to a species level is required. To enable<br />
closer identification of the specific spoilage organisms <strong>in</strong>clud<strong>in</strong>g Pseudomonas spp.,<br />
Vibrio/Aeromonas spp., S. putrefaciens, Enterobacteriaceae <strong>and</strong> others.<br />
5. To extend study on food safety microorganisms <strong>in</strong> fish <strong>and</strong> environment of <strong>Lake</strong><br />
Victoria is highly recommended.<br />
6. To establish maximum limits of acceptance for freshness quality chemical parameters<br />
<strong>in</strong>clud<strong>in</strong>g TVB-N <strong>and</strong> others <strong>in</strong> <strong>Nile</strong> perch products.<br />
7. To establish guidel<strong>in</strong>es on bacterial count limits for ascerta<strong>in</strong><strong>in</strong>g rema<strong>in</strong><strong>in</strong>g storage<br />
time or acceptability of raw fish for process<strong>in</strong>g of various fish products.
ACKNOWLEDGEMENT<br />
I gratefully acknowledge Frankl<strong>in</strong> Georgsson for his aspirated <strong>and</strong> valuable supervision for<br />
technical guidance <strong>and</strong> comments from the beg<strong>in</strong>n<strong>in</strong>g without despair<strong>in</strong>g until to the end of<br />
this work.<br />
I also wish to convey my many thanks to UNU-FTP Dr. Tumi Tomasson <strong>and</strong> Thor Heidar<br />
Asgeirsson (Directors) for offer<strong>in</strong>g fully scholarship. Also my thanks extends to Sigridur<br />
Krist<strong>in</strong> Ingvarsdottir for her tireless <strong>and</strong> punctuality <strong>in</strong> tak<strong>in</strong>g care <strong>and</strong> particularly for her<br />
excellent adm<strong>in</strong>istration.<br />
I extend my appreciation to Mr. G. F. Nanyaro, the Director of Fisheries (Tz) for accept<strong>in</strong>g<br />
my request to attend the programme. I am <strong>in</strong>debted to all NFQCL-Nyegezi <strong>and</strong> NFFI staff <strong>in</strong><br />
particular Mr. S. A. Lukanga (NFQCL-Nyegezi – Incharge) <strong>and</strong> J. Makene (NFFI- Pr<strong>in</strong>cipal)<br />
for their support <strong>and</strong> encouragement dur<strong>in</strong>g the research works.<br />
I am also <strong>in</strong>debted to thank the management of fish establishments <strong>in</strong> particular Tanzania fish<br />
processors Ltd, Mwanza fish<strong>in</strong>g Co. Ltd, Omega fish Ltd, Nie perch fisheries Ltd <strong>and</strong> Vicfish<br />
Ltd for accept<strong>in</strong>g to give samples for my studies <strong>and</strong> offer<strong>in</strong>g valuable assistance dur<strong>in</strong>g my<br />
study.<br />
71
REFERENCES<br />
Adams M. R. <strong>and</strong> Moss, M. O., (2008): Food <strong>Microbiology</strong>, Third Edition. The Royal Society<br />
of Chemistry, Thomas Graham House, Science Park, Milton Road, Cambridge CB4 0WF,<br />
UK.<br />
Amlacher, E. (1961): Rigor mortis <strong>in</strong> fish. In: Amlacher, E. Editor. Fish as food. London <strong>and</strong><br />
New York, Academic Press p. 385-409.<br />
Anonymous, (1985): Subcommittee <strong>in</strong> Microbiological Criteria; Committee on Food<br />
Production. In Food spoilage-<strong>in</strong>teractions between food spoilage bacteria, Gram et al.,<br />
(2002), Int. J. of Food <strong>Microbiology</strong>. (78), 79-97.<br />
Baird Parker, T. C., (2000): The production of microbiologically safe <strong>and</strong> stable foods. In<br />
Fish spoilage bacteria – problems <strong>and</strong> solutions by Gram et al., 2002. Elsevier Science Ltd.<br />
Current op<strong>in</strong>ion <strong>in</strong> Biotechnology, (13), 262-266.<br />
Barile L. E, Estrada M. H., Miller A. D., Relley A., <strong>and</strong> Villadsen A., (1985): <strong>Spoilage</strong><br />
patterns of Mackerel (Rastrelliger faughni Matsui) 2. Mesophilic versus psychrophilic fish<br />
spoilage of tropical fish. ASEAN Food J. (1), 3. In Gram et al., (1996): Microbiological<br />
spoilage of fish <strong>and</strong> fish products. Int. J. Food <strong>Microbiology</strong>, (33), 121-137.<br />
Bonilla, A.C., Sve<strong>in</strong>sdóttir, K., Mart<strong>in</strong>sdóttir, E., (2006): Development of Quality Index<br />
Method (QIM) scheme for fresh cod (Gadus morhua) fillets <strong>and</strong> application <strong>in</strong> shelf life study.<br />
Food Control. In Press.<br />
Border P. <strong>and</strong> Norton M. (1997): Safer eat<strong>in</strong>g: microbiological food poison<strong>in</strong>g <strong>and</strong> its<br />
prevention. The Parliamentary Office of Science <strong>and</strong> Technology, London.<br />
Bremner, H.A. <strong>and</strong> Hallett I.C., (1985): Muscle fiber-connective tissue junctions <strong>in</strong> the blue<br />
grenadier (Macruronus novaezel<strong>and</strong>iae). A scann<strong>in</strong>g electron microscope study J. Food Sci.<br />
(50), 975-980.<br />
Castro, P., Padron, J. C. P., Cans<strong>in</strong>o, M. J. C., Velasquez, E. S. <strong>and</strong> Milian De Larriva, R.,<br />
(2006): Total volatile base nitrogen <strong>and</strong> its use to assess freshness <strong>in</strong> Europe sea bass stored<br />
<strong>in</strong> ice. J. Food Control. (17), 245-248.<br />
Chang, K. L. B., Chang, J. J., Shiau, C. Y., Pan, B. S., (1998): Biochemical microbiological<br />
<strong>and</strong> sensory changes of sea bass (Lateolabrax japonicus) under partial freez<strong>in</strong>g <strong>and</strong><br />
refrigerated storage. Journal of Agricultural <strong>and</strong> Food Chemistry 46(2), 682-686.<br />
Chytiri, S., Chouriara, I., Savvaidis, I. N. And Kontom<strong>in</strong>as, M. G., (2004): Microbiological,<br />
chemical <strong>and</strong> sensory assessment of iced whole <strong>and</strong> filleted ra<strong>in</strong>bow trout. J. Food<br />
<strong>Microbiology</strong>. (21), 157-165.<br />
72
Connell, J. J., (1995): Control of fish quality .4th ed. London: Fish<strong>in</strong>g News Boks Limited.<br />
Connell, J.J., (1975): Control of fish quality. Fish<strong>in</strong>g News (Books) Ltd., Farnham, Surrey,<br />
UK.<br />
Cowel R. R, <strong>and</strong> Liston J, (1962): Bacteria flora for seven species collected from Rongelap<br />
<strong>and</strong> En<strong>in</strong>otek Atols. Pacific Sci. (16), 264-270.<br />
Curran, C.A. <strong>and</strong> Disney J., (1979): The iced storage life of tropical fish. Paper presented at<br />
IPFC Workshop on Fish Technology. Jakarta, Indonesia, September 1979.<br />
Da<strong>in</strong>ty, R. H., Shaw, B. G., Hard<strong>in</strong>ger, C. D., <strong>and</strong> Michanie, S., (1979): The spoilage of<br />
vacuum packed beaf by cold tolerant bacteria. In Hozbor M. C., Saiz A. I., Yeannes, M. I.<br />
<strong>and</strong> Fritz, R. (2006): Microbiological changes <strong>and</strong> its correlation with quality <strong>in</strong>dices dur<strong>in</strong>g<br />
aerobic iced storage of sea salmon (Pseudopercis semifasciata). J. of LWT-FoodSci Technol<br />
(39), 99–104.<br />
Dalgaard P., <strong>and</strong> Huss H. H., (1994): Mathematical modell<strong>in</strong>g used for evaluation <strong>and</strong><br />
prediction of microbial fish spoilage. In: D.E. Kramer, F. Shahidi <strong>and</strong> Y. Jones (eds.).<br />
Dalgaard, P., (1995): Qualitative <strong>and</strong> quantitative characterization of spoilage bacteria from<br />
packed fish. International Journal of Food <strong>Microbiology</strong> (26), 319–333.<br />
Dalgaard, P., (2000): Fresh <strong>and</strong> lightly preserved seafood. In Shelf-Life Evaluation of Foods.<br />
2nd ed. Edited by Man CMD, Jones AA. London: Aspen Publishers, Inc. 110-139.<br />
Dalgaard, P., Gram, L., <strong>and</strong> Huss, H. H., (1993): <strong>Spoilage</strong> <strong>and</strong> shelf-life of cod fillets packed<br />
<strong>in</strong> vacuum or modified atmospheres. International Journal of Food <strong>Microbiology</strong> 19(4), 283–<br />
294.<br />
Dawood A. A., Roy R. N., Williams, <strong>and</strong> C. S., (1986): Quality of ra<strong>in</strong>bow trout chilled<br />
stored after post-catch hold<strong>in</strong>g. J. Sci. Agriculture. (37), 421-427.<br />
Determ<strong>in</strong>ation <strong>in</strong> foods at 30 °C, 20 °C or 6.5 °C. NMKL method No. 86, 4 th Ed.,<br />
Devaraju, A.N. <strong>and</strong> Setty T.M.R., (1985): Comparative study of fish bacteria from tropical<br />
<strong>and</strong> cold/temperate mar<strong>in</strong>e waters. In: Reilly, A. (ed.) <strong>Spoilage</strong> of tropical fish <strong>and</strong> product<br />
development. FAO Fish. Rep. (317) Suppl., 97-107.<br />
Disney J. G., (1976): The spoilage of fish <strong>in</strong> the tropics. In Cobb B. F, <strong>and</strong> Stockton A. B,<br />
(eds.) Proceed<strong>in</strong>g of the first annual tropical <strong>and</strong> subtropical fisheries technology conference,<br />
Vol. 1; Texas A & M University sea grant, College station, Texas, p. 23.<br />
Disney, J.G., Cameron, J.D., Hoffmann, A. <strong>and</strong> Jones N.R., (1969). Quality assessment <strong>in</strong><br />
Tilapia species. In: Kreuzer, R. (ed.) Fish Inspection <strong>and</strong> Quality Control. Fish<strong>in</strong>g News<br />
Books, Ltd. London. 71-72.<br />
73
Doyle M. P., (1990): Pathogenic Escherichia coli, Yers<strong>in</strong>ia enterocolitica <strong>and</strong> Vibrio<br />
parahaemolyticus. The Lancent 336, 111-1115. In Huss H. H, Jakobsen M, <strong>and</strong> Liston J<br />
(1992): Quality assurance <strong>in</strong> the fish <strong>in</strong>dustry. Proceed<strong>in</strong>gs of the International Conference,<br />
Copenhagen, Denmark, 26-30, August 1991.<br />
Doyle, M. E., (2007): Microbial food spoilage – Losses <strong>and</strong> control strategies, (A brief<br />
review of the Literature), FRI Brief<strong>in</strong>gs (www.wisc.edu/fri/).<br />
Fonnesbech V. B., Venkateswaran K., satomi M., <strong>and</strong> Gram L., (2005): Identification of<br />
Shewanella baltica as the most important H2S produc<strong>in</strong>g species dur<strong>in</strong>g iced storage of<br />
Danish mar<strong>in</strong>e fish. App Environ Microbiol. (71), 6689–6697.<br />
Fung, D.Y. C., Hart, R. E., <strong>and</strong> Cha<strong>in</strong> V., (1987): Rapid methods <strong>and</strong> automated procedures<br />
for microbiological evaluation of seafood. In: D.E. Kramer <strong>and</strong> J. Liston (eds.) Seafood<br />
Quality Determ<strong>in</strong>ation. Proceed<strong>in</strong>gs of an International Symposium coord<strong>in</strong>ated by the<br />
University of Alaska Sea Grant College Program, Anchorage, Alaska, USA, 10-14 November<br />
1986. Elsevier, Amsterdam, 247-253.<br />
Gibson D. M., (1992): Pathogenic microorganisms of importance <strong>in</strong> seafood. In Huss H. H.,<br />
Jakobsen M., <strong>and</strong> Liston J., (1992): Quality assurance <strong>in</strong> the fish <strong>in</strong>dustry. Proceed<strong>in</strong>gs of the<br />
International Conference, Copenhagen, Denmark. 26-30, August, 1991.<br />
Gibson D. M., <strong>and</strong> Ogden I. D., (1987): Estimat<strong>in</strong>g shelf life of packaged fish. In Kramer D.<br />
E., Liston J., (Eds.), Seafood quality determ<strong>in</strong>ation, proceed<strong>in</strong>gs of the <strong>in</strong>ternational<br />
symposium on seafood quality determ<strong>in</strong>ation, 10-14 November 1986, Anchorage, Alaska,<br />
USA, pp.437-451.<br />
Gillespie N. C., <strong>and</strong> MacRae I. C., (1975): The bacterial flora of some queenesl<strong>and</strong> fish <strong>and</strong><br />
its ability to cause spoilage. J. of Appl. Bacteriol. (39), 91-100.<br />
Gimenez, B., Roncales, P., Beltran, <strong>and</strong> J. A., (2002): Modified atmosphere pack<strong>in</strong>g of filleted<br />
ra<strong>in</strong>bow trout. J. Sci. Food Agric. (84), 1154-1159.<br />
Gorzyka, E., <strong>and</strong> Pek Poh Len, (1985): Mesophilic spoilage of bay trout (Arripis trutta),<br />
bream (Acanthropagrus butcheri) <strong>and</strong> mullet (Aldrichetta forsterri). Reilley A (Eds), FAO<br />
fish report (317) suppl. 474p., 123-132.<br />
Gram L., Christ<strong>in</strong>a Wedell-Neergaard <strong>and</strong> Huss H. H., (1990): The bacteriology of fresh <strong>and</strong><br />
spoil<strong>in</strong>g <strong>Lake</strong> Victoria <strong>Nile</strong> perch (<strong>Lates</strong> <strong>niloticus</strong>). Int. J. of food <strong>Microbiology</strong>. (10), 303-<br />
316.<br />
Gram, L. <strong>and</strong> Huss, H.H., (1996): Microbial spoilage of fish <strong>and</strong> fish products. International<br />
Journal of Food <strong>Microbiology</strong>. (33), 121-137.<br />
74
Gram, L., (1989): Identification, characterization <strong>and</strong> <strong>in</strong>hibition of bacteria isolated from<br />
tropical fish. Ph.D. Thesis. The Technological Laboratory of the Danish M<strong>in</strong>istry of Fisheries<br />
<strong>and</strong> The Royal Veter<strong>in</strong>ary <strong>and</strong> Agricultural University.<br />
Gram, L., (1990): <strong>Spoilage</strong> of three Senegalese fish species stored <strong>in</strong> ice <strong>and</strong> at ambient<br />
temperature. Paper presented at SEAFOOD 2000 <strong>in</strong> Halifax, Canada. 12-16 May 1990.<br />
Gram, L., (1992): Evaluation of the bacteriological quality of seafood. J. Food Microbiol. 16,<br />
25-39.<br />
Gram, L., Dalgaard, P., (2002): Fish spoilage bacteria — problems <strong>and</strong> solutions. Current<br />
Op<strong>in</strong>ion <strong>in</strong> Biotechnology. (130), 262–266.<br />
Gram, L., Huss, H.H., (2000): Fresh <strong>and</strong> processed fish <strong>and</strong> shellfish. In Fish spoilage<br />
bacteria - problems <strong>and</strong> solutions. Elsevier Science Ltd. Current op<strong>in</strong>ion <strong>in</strong> Biotechnology,<br />
(13), 262-266.<br />
Gram, L., Ravn, L., Rasch, M., Bruhn, J.B., Christensen, A.B., Givskov, M., (2002): Food<br />
spoilage-<strong>in</strong>teractions between food spoilage bacteria. Intertional Journal of Food<br />
<strong>Microbiology</strong>. (78), 79–97.<br />
Herbert R. A., <strong>and</strong> Shewan J. M., (1975): Precursors of the volatile sulphides <strong>in</strong> spoil<strong>in</strong>g<br />
North Sea cod (Gadus morhua). J. Sci. Food Agric. (27), 1195-1202.<br />
Hobbs, G. <strong>and</strong> Hodgkiss, W., (1982): The bacteriology of fish h<strong>and</strong>l<strong>in</strong>g <strong>and</strong> process<strong>in</strong>g. In<br />
Davis, R. Eds. Developments <strong>in</strong> food microbiology, Vol. 1 (pp. 71–117). London <strong>and</strong> New<br />
Jersey: Applied Science Publishers.<br />
Hovda, M. B., (2007): Application of PCR <strong>and</strong> DGGE to characterise the microflora of<br />
farmed fish. Dissertation for the degree philosophiae doctor (PhD) at the University of<br />
Bergen, Norway.<br />
Hozbor M. C., Saiz A. I., Yeannes, M. I., <strong>and</strong> Fritz, R., (2006): Microbiological changes <strong>and</strong><br />
its correlation with quality <strong>in</strong>dices dur<strong>in</strong>g aerobic iced storage of sea salmon (Pseudopercis<br />
semifasciata). J. of LWT-FoodSci Technol (39), 99–104.<br />
Huidobro, A., Pastor, A., <strong>and</strong> Tejada, M., (2000): Quality <strong>in</strong>dex method developed for raw<br />
gilthead seabream (Sparus aurata). Journal of Food Science 65(7), 1202–1205.<br />
Huss H., Dalgaard, P. <strong>and</strong> Gram L., (1997): <strong>Microbiology</strong> of fish <strong>and</strong> fish products. In Luten<br />
J. B., Børresen T., <strong>and</strong> Oihlenschlager J., (1997): Seafood from producer to consummer,<br />
<strong>in</strong>tergrated approach to quality. Development <strong>in</strong> food science 38. Proceed<strong>in</strong>gs of the<br />
International Seafood Conference on the occasion of the 25th anniversary of the WEFTA,<br />
held <strong>in</strong> Noordwijkerhout, The Netherl<strong>and</strong>s, 13-16 November, 1995.<br />
75
Huss, H. H. <strong>and</strong> Larsen A., (1980): Changes <strong>in</strong> the oxidation-reduction potential (Eli) of<br />
smoked <strong>and</strong> salted fish dur<strong>in</strong>g storage. Lebensm.-Wiss. & Technol., (13) 40-43.<br />
Huss, H. H., (1988): Fresh fish-quality <strong>and</strong> quality changes. Roma: FAO Fisheries series No.<br />
29.<br />
Huss, H. H., (1995): Quality changes <strong>in</strong> fresh fish. FAO Fisheries Technical Paper No. 348,<br />
Food <strong>and</strong> Agriculture Organization of the United Nations, Rome.<br />
Huss, H. H., (1995): Quality changes <strong>in</strong> fresh fish. FAO Fisheries Technical Paper No. 348,<br />
Food <strong>and</strong> Agriculture Organization of the United Nations, Rome.<br />
Huss, H.H, (1994): Assurance of Seafood Quality. FAO Fisheries Technical paper No: 334,<br />
Roma.<br />
Huss, H.H., Dalgaard, P., <strong>and</strong> Gram L, (1997): <strong>Microbiology</strong> of fish <strong>and</strong> fish products. In J. B.<br />
Luten, T. Borresen, & J. Oehlenschlager (Eds.), seafood from producer to consumer,<br />
<strong>in</strong>tegrated approach to quality (pp. 413-430). Amseterdam: Elsevier Science Publish<strong>in</strong>g.<br />
Huss, H.H., Trolle, G. <strong>and</strong> Gram, L., (1988): New rapid methods <strong>in</strong> microbial evaluation of<br />
fish quality. In D. E. Kramer <strong>and</strong> J. Liston (eds.): Seafood quality determ<strong>in</strong>ation. Elsevier<br />
Amsterdam pp. 299-308.<br />
Hyldig, G. <strong>and</strong> Nielsen, J., (1998): A rapid sensory method for quality management. In<br />
Methods to determ<strong>in</strong>e the freshness of fish <strong>in</strong> research <strong>and</strong> <strong>in</strong>dustry, pp. 297–300. Paris:<br />
Institut International du Froid.<br />
International Commission on Microbiological Specification for Foods (ICMSF), (1986):<br />
Microorganisms <strong>in</strong> foods 2. Sampl<strong>in</strong>g for microbiological analysis: Pr<strong>in</strong>ciples <strong>and</strong> specific<br />
applications. 2nd Ed. International Commission on Microbiological Specifications for Foods.<br />
Blackwell Scientific Publications.<br />
International Commission for Microbiologist Specifications for Foods (ICMSF), (1980b):<br />
<strong>Microbiology</strong> ecology of foods- Food commodities Vol. 2. Academic Press Inc. London Ltd.<br />
International Commission for Microbiologist Specifications for Foods (ICMSF), (1980a):<br />
Factors affect<strong>in</strong>g Life <strong>and</strong> Death of Microorganisms. Microbial Ecology of Foods Vol I.<br />
Academic Press, Inc, 111 Fifth Avenue, New York, New York 10003.<br />
Jason, A.C. <strong>and</strong> Richards J.C.S., (1975): The development of an electronic fish freshness<br />
meter. J. Phys. E. Sci. Instrum. 8, 826- 830.<br />
Jensen M. <strong>and</strong> E. Schulz, (1980): In Gram, L., Trolle, G. <strong>and</strong> Huss, H.H. (1987): Detection of<br />
specific spoilage bacteria from fish stored at low (0 0 C) <strong>and</strong> high (20 0 C) temperatures. Int. J.<br />
of food <strong>Microbiology</strong>. (4), 65-72.<br />
76
Jeyasekaran G., Ganesan P., Jeya Shakila R., Maheswari K., Sukumar D., (2004): Dry ice as a<br />
noval chill<strong>in</strong>g medium along with water ice for short-term preservation of fish Emperor<br />
breams, lethr<strong>in</strong>us (Lethr<strong>in</strong>us m<strong>in</strong>iatus). Innovative Food Science <strong>and</strong> Emerg<strong>in</strong>g. (5), 485-493.<br />
Jonsdottir, S. (1992): Quality <strong>in</strong>dex method <strong>and</strong> TQM system. In: R. Olafsson <strong>and</strong> A.H.<br />
Ingthorsson (eds.) Quality Issues <strong>in</strong> the Fish Industry. The Research Liaison Office.<br />
University of Icel<strong>and</strong>.<br />
Jorgensen, B. R. <strong>and</strong> Huss H. H., (1989): Growth <strong>and</strong> activity of Shewanella putrefaciens<br />
isolated from spoil<strong>in</strong>g fish. Int. J. Food Microbiol. 9, 51-62.<br />
Karnicki, Z., <strong>and</strong> Lima Dos Santos, (1985): Storage life of African Chilled fish species. In<br />
storage life <strong>in</strong> chilled fish <strong>and</strong> fish products. Arbeldeen. UK. 169 -175.<br />
Karungi, C., Byruhanga, Y. B, <strong>and</strong> Muyoga, J. H., (2004): Effect of pre-ic<strong>in</strong>g duration on<br />
quality deteriation on <strong>Nile</strong> perch (<strong>Lates</strong> <strong>niloticus</strong>). Department of Food Science <strong>and</strong><br />
Technology, Makerere University, P. O. Box 7062, Kampala Ug<strong>and</strong>a. J. of Food Chemistry<br />
(85), 13-17.<br />
Kyrana, V. R., <strong>and</strong> Lougovois, V. P., (2002): Sensory chemical <strong>and</strong> microbiological<br />
assessment of farm raised European sea bass (Dicentrarchus labrax) stored <strong>in</strong> melt<strong>in</strong>g ice.<br />
International journal of Food Science <strong>and</strong> Technology. (37), 319-328.<br />
<strong>Lake</strong> Victoria Fisheries Organization (LVFO), (2009): Plot No. 2 Oboja Road & 28 Kis<strong>in</strong>ja<br />
Road P.O. Box 1625, J<strong>in</strong>ja 256 Ug<strong>and</strong>a. 5 th March, 2009. http://www.lvfo.org.<br />
Larsen E.P., J. Heldbo, C.M. Jespersen <strong>and</strong> J. Nielsen (1992): Development of a st<strong>and</strong>ard for<br />
quality assessment on fish for human consumption. In: Huss, H.H., Jacobsen M. <strong>and</strong> Liston J.<br />
(eds.) Quality Assurance <strong>in</strong> the Fish Industry. Proceed<strong>in</strong>gs of an International Conference,<br />
Copenhagen, Denmark, August 1991. Elsevier, Amsterdam, 351-358.<br />
LeBlanc R. J., LeBlanc E. L., (1992): The effect of superchill<strong>in</strong>g with CO2 snow on the quality<br />
of commercially processed cod (Gadus morhua) <strong>and</strong> w<strong>in</strong>ter flounder (Pseudopleuronectes<br />
americanus) fillets. In: Huss, H.H., Jakobsen, M., Liston, J. eds. Quality Assurance <strong>in</strong> the Fish<br />
Industry. Amsterdam. The Netherl<strong>and</strong>s. Elsev Sci Pub B.V. 115-123.<br />
Lev<strong>in</strong>, R. E., (1968): Detection <strong>and</strong> <strong>in</strong>cidence of specific species of spoilage bacteria on fish.<br />
1. Methodology. Appl. Microbiol., (16), 1734-1737.<br />
Lima dos Santos, (1978): Bacteriological spoilage of Amazonian fresh water catfish<br />
(Brachyplastistoma vaillant). In Gram et al., (1990): The bacteriology of fresh <strong>and</strong> spoil<strong>in</strong>g<br />
<strong>Lake</strong> Victoria <strong>Nile</strong> perch (<strong>Lates</strong> <strong>niloticus</strong>). Int. J. of food <strong>Microbiology</strong>. (10), 303-316.<br />
Lima dos Santos, C.A.M. (1981): The storage life of tropical fish <strong>in</strong> ice - A review. Trop. Sci.<br />
(23), 97-127.<br />
77
Liston J, (1992): Bacterial spoilage <strong>in</strong> see foods. In H. H. Huss, M. Jacobsen, & J. Liston<br />
(eds.), Development <strong>in</strong> food science, Vol. 30: Quality assurance <strong>in</strong> the sea fish <strong>in</strong>dustry.<br />
Proceed<strong>in</strong>gs of an <strong>in</strong>ternational conference (pp. 93-105) Copenhagen, Denmark: Elsevier<br />
Science Publish<strong>in</strong>g.<br />
Liston, J., (1978): Microbial spoilage of fish <strong>and</strong> seafood. Proc. Int. Conf. Global Impacts<br />
Appl. Microbiol. 4 th , 1973 pp 645 -660.<br />
Liston, J., (1980): <strong>Microbiology</strong> <strong>in</strong> fishery science. In Chytiri et al., (2004): Microbiological,<br />
chemical <strong>and</strong> sensory assessment iced whole <strong>and</strong> filleted aquaculacultured ra<strong>in</strong>bow trout.<br />
J.Food <strong>Microbiology</strong>. (21), 157 -165.<br />
Liston, J., Stansby, M. E., <strong>and</strong> Olcott H. S., (1976): Bacteriological <strong>and</strong> chemical basis for<br />
deteriorative changes. In Stansby M. E. (ed.). Industrial Fishery Technology. Robert E.<br />
Krieger, New York, pp. 345-358.<br />
Lund, B. M., Baird-Parker, T. C. <strong>and</strong> Gould, G. W. (2000): The Microbiological Safety <strong>and</strong><br />
Quality of Food. Aspen Publisher Inc., Gaithersburg, Maryl<strong>and</strong>.In Hovda M. B., (2007):<br />
Application of PCR <strong>and</strong> DGGE to characterise the microflora of farmed fish. Dissertation for<br />
the degree philosophiae doctor (PhD) at the University of Bergen, Norway.<br />
Luten J. B., <strong>and</strong> Mart<strong>in</strong>sdóttir E., (1997): QIM an European tool for fish freshness evaluation<br />
<strong>in</strong> the fishery cha<strong>in</strong>. In Olafsdottir G, Luten J,Dalgaard P, Careche M, Verez-Bagns V,<br />
Marnsdottir E, Heia K, (Eds.), Methods to Evaluate Fish Freshness <strong>in</strong> Resarch <strong>and</strong> Industry.<br />
International Institute of Refrigeration (IIR), Paris, pp. 247-354.<br />
Luten J. B., Børresen T., <strong>and</strong> Oihlenschlager, J., (1997): Seafood from producer to<br />
consummer, <strong>in</strong>tergrated approach to quality. Development <strong>in</strong> food science 38. Proceed<strong>in</strong>gs of<br />
the International Seafood Conference on the occasion of the 25th anniversary of the WEFTA,<br />
held <strong>in</strong> Noordwijkerhout, The Netherl<strong>and</strong>s, 13-16 November, 1995.<br />
Lyhs U, Koort JMK, Lundstrom HS, <strong>and</strong> Bjorkroth KJ, (2004): Leuconostoc gelidum <strong>and</strong><br />
Leuconostoc gasicomitatum stra<strong>in</strong>s dom<strong>in</strong>ated the lactic acid bacterium population<br />
associated with strong slime formation <strong>in</strong> an acetic-acid herr<strong>in</strong>g preserve. Int J Food<br />
Microbiol 90:207–218.<br />
Mart<strong>in</strong>sdóttir, E., (2002): Quality management of stored fish. In Bremner, H.A. eds. Safety<br />
<strong>and</strong> quality issues <strong>in</strong> fish process<strong>in</strong>g, pp. 360–378. Engl<strong>and</strong>: Woodhead Publish<strong>in</strong>g Limited.<br />
Mart<strong>in</strong>sdóttir, E., Sve<strong>in</strong>sdóttir, K., Luten, J. B., Schelvis-Smit, R. <strong>and</strong> Hyldig, G., (2001):<br />
Reference manual for the fish sector: Sensory evaluation of fish freshness. The Netherl<strong>and</strong>s:<br />
QIM Eurofish.<br />
Morita, R.Y., (1975): Psychrophilic bacteria. Bacteriol. Rev. (39), 144-167.<br />
78
Mossel, D. A. A, Corry J. E. L., Strijk C. B. <strong>and</strong> Baird R. M., (1995): Essentials of the<br />
<strong>Microbiology</strong> of Foods. John Willey & Sons Ltd. Baff<strong>in</strong>s Lane, Chichester, West Sussex<br />
PO19 1UD, Engl<strong>and</strong>.<br />
Murray, C. K. <strong>and</strong> Shewan J. M., (1979): The microbial spoilage of fish with special<br />
reference to the role of psychrotrophs. In: Russell, A.D. <strong>and</strong> R. Fuller (eds.) Cold tolerant<br />
microbes <strong>in</strong> spoilage <strong>and</strong> the environment, Academic Press, 117-136.<br />
Nanto, H., Sokooshi H., <strong>and</strong> Kawai, T., (1993): Alum<strong>in</strong>ium-doped ZnO th<strong>in</strong> film gas sensor<br />
capable of detect<strong>in</strong>g freshness of sea foods. Sensors an actuators 13-14.<br />
Nielsen, J., <strong>and</strong> Jessen, K., (1997): New developments <strong>in</strong> sensory analysis for fish <strong>and</strong> fishery<br />
products. In Luten J.B., Børresen, T. <strong>and</strong> Oehlenschläger, J. eds. Seafood from Producer to<br />
Consumer, Integrated Approach to Quality, pp. 537–547. Amsterdam: Elsevier Science BV.<br />
Nielsen, J., Hansen, T. K., Jonsdottir, S., Larsen, E. P., (1992): Development of methods for<br />
quality <strong>in</strong>dex of fresh fish. FAR Meet<strong>in</strong>g, Noordwijkerhout, Netherl<strong>and</strong>s.<br />
Nordic Committee on Food Analysis (NMKL) (2005): Thermotolerant coliform bacteria <strong>and</strong><br />
Escherichia coli enumeration <strong>in</strong> food <strong>and</strong> feed. NMKL method No. 125 4 th Ed.<br />
Nordic Committee on Food Analysis (NMKL) (2006): Aerobic microorganisms.<br />
Nordic Committee on Food Analysis (NMKL), (1997): Pathogenic Vibrio species detection<br />
<strong>and</strong> enumeration <strong>in</strong> foods. NMKL No.156, 2 nd Ed.<br />
Nordic Committee on Food Analysis (NMKL), (1999): Salmonella. Detection <strong>in</strong> foods.<br />
NMKL method No. 71, 5 th Ed.<br />
Nordic Committee on Food Analysis (NMKL), (2002): Sampl<strong>in</strong>g <strong>and</strong> pre-treatment of foods<br />
<strong>and</strong> animal feed stuffs for quantitative microbiological exam<strong>in</strong>ation. NMKL Method No 91,<br />
4th Ed.<br />
Nordic Committee on Food Analysis (NMKL), (2005): Enterobacteriaceae. Determ<strong>in</strong>ation<br />
<strong>in</strong> foods <strong>and</strong> feeds. NMKL Method No. 144, 3rd Ed.<br />
Olafsdottir, G, Lauzon, H. L., Mart<strong>in</strong>sdottir E., Oehlenschlager J., Kristbergsson K., (2005):<br />
Shelf-life extension of superchilled cod (Gadus morhua) fillets <strong>and</strong> <strong>in</strong>fluence of temperature<br />
fluctuations on microbial growth <strong>and</strong> metabolites. In: Volatile compounds as quality<br />
<strong>in</strong>dicators <strong>in</strong> fish dur<strong>in</strong>g chilled storage: Evaluation of microbial metabolites by an electronic<br />
nose. Reykjavik.<br />
Ordonez, J. A., Lopez-Galvez, D. E., Fern<strong>and</strong>ez, M., Hierro, E., Hoz L., (2000): Microbial<br />
<strong>and</strong> physicochemical modifications of Hake (Merluccius merluccius) Steaks stored under<br />
carbon dioxide enriched atmosphere. J. Sci. Food Agric. 80 1831-1840.<br />
79
Ozogul, F. <strong>and</strong> Ozugul, Y., (2000): Comparisons of methods used for determ<strong>in</strong>ation of<br />
volatile basic nitrogen (TVB-N) <strong>in</strong> Ra<strong>in</strong>bow trout (Oncorhyncus mykiss). Turk J. Zool, (24)<br />
113-120.<br />
Peterson, A. C., <strong>and</strong> Gurnderson M. F., (1960): Roles of psychrotrophilic bacteria <strong>in</strong> frozen<br />
food spoilage. Food Technol. (14), 413-417.<br />
Popovic, T., Olsvik Ø., Blake, P. A., <strong>and</strong> Wachsmuth K., (1993): Chorerae <strong>in</strong> the Amecas.<br />
Food borne aspects. J. Food Prot. 56, 811-821. In Huss H, Dalgaard P <strong>and</strong> Gram L, (1997):<br />
<strong>Microbiology</strong> of fish <strong>and</strong> fish products. Proceed<strong>in</strong>gs of the Symposium New Developments <strong>in</strong><br />
Seafood Science <strong>and</strong> Technology, CIFST, Vancouver, Canada.<br />
Ravn Jorgensen B. R., Gibson D. M., Huss H. H., (1988): Microbiological quality <strong>and</strong> shelf<br />
life prediction of chilled fish. Int. J. Food <strong>Microbiology</strong>. (6), 295-307.<br />
Rehbe<strong>in</strong>, H. <strong>and</strong> Oehlenschlager, J., (1982): Zur Zusammensetzung der TVB-N fraktion<br />
(fluchtige Basen) <strong>in</strong> sauren Extrakten und alkalischen Destillaten von Seefischfilet. Arch.<br />
Lebensmittelhyg. (33), 44-48.<br />
Re<strong>in</strong>eccius G., (1990): Off-flavours <strong>in</strong> foods. Griet. Rev. Food Sci. Nutr., (29) 381-402).<br />
Riaz-Fatima R., Khan M. A., Qadri R. B., (1988): Shelf life of shrimp (Penaeus merguiensis)<br />
stored <strong>in</strong> ice (0°C) <strong>and</strong> partially frozen (-3°C). Journal of the Science of Food <strong>and</strong><br />
Agriculture. (42), 235-247.<br />
R<strong>in</strong>go, E., Stenberg, E. <strong>and</strong> Strom, A., 1984. Am<strong>in</strong>o acid <strong>and</strong> lactate catabolism <strong>in</strong><br />
trimethylam<strong>in</strong>e oxide respiration of Alteromonas putrefaciens. NCMB 1735. Appl. <strong>and</strong><br />
Environ. Microbiol. (47), 1084-1089.<br />
Ryder, J. M., (1985): Determ<strong>in</strong>ation of adenos<strong>in</strong>e triphosphate <strong>and</strong> its breakdown products <strong>in</strong><br />
fish muscle by high performance liquid chromatography. J. Agric. Food Chem. (33), 678-680.<br />
Saito, T., Arai K. <strong>and</strong> Matsuyoshi M., (1959): A new method for estimat<strong>in</strong>g the freshness of<br />
fish. Bull. Jap. Soc. Sci. Fish. (24), 749-50.<br />
Santos E. <strong>and</strong> Regeste<strong>in</strong> J., (1990): Effect of vacuum packag<strong>in</strong>g, glaz<strong>in</strong>g, <strong>and</strong> erythorbic acids<br />
of frozen white hake <strong>and</strong> mackerel. J. Food Sci. (55), 64-70.<br />
Santos-Yap, En. E. M., (1995): Fish <strong>and</strong> Seafood. In Jeremiah L. E, (1996), Freez<strong>in</strong>g effect<br />
on food quality. Marcel Deckker, Inc., 270 Madison Avenue, New York, New York 10016.<br />
Sharpe, A.N., Woodrow M.N., <strong>and</strong> Jackson A.K., (1970): Adenos<strong>in</strong>etriphosphate (ATP) levels<br />
<strong>in</strong> foods contam<strong>in</strong>ated with bacteria. J. Appl. Bacteriol. (33), 758-767.<br />
Shewan J. M., (1962): The bacteriological of fish <strong>and</strong> spoil<strong>in</strong>g fish <strong>and</strong> some related chemical<br />
changes. Recent adv. Food Sci. (1), 167-193.<br />
80
Shewan, J. M., (1977): The bacteriology of fresh <strong>and</strong> spoil<strong>in</strong>g fish <strong>and</strong> the biochemical<br />
changes <strong>in</strong>duced by bacterial action. In: Proceed<strong>in</strong>gs of the Conference on H<strong>and</strong>l<strong>in</strong>g,<br />
Process<strong>in</strong>g <strong>and</strong> Market<strong>in</strong>g of Tropical Fish, Tropical Products Institute, London, 51-66.<br />
Sivertsvik, M. Rosnes, J. T. <strong>and</strong> Kleiberg G. H., (2003): Effect of modified atmosphere<br />
packag<strong>in</strong>g <strong>and</strong> superchilled storage on the microbial <strong>and</strong> sensory quality of Atlantic salmon<br />
(Salmo slar) fillets. Journal of Food Science. 68(4), 1467-1472.<br />
Smith, J.S.M., Hardy, R., MacDonald. I., Templeton, J., (1980): The storage of herr<strong>in</strong>g<br />
(clupea harengus) <strong>in</strong> ice, refrigerated sea water <strong>and</strong> at ambient temperature. Chemical <strong>and</strong><br />
sensory assessment. Journal of the Science of Food <strong>and</strong> Agriculture. (31), 375-385.<br />
Sumner J. L., Gorczyca E, Cohen D, <strong>and</strong> Brady P., (1984): Do fish from tropical waters spoil<br />
less rapidly <strong>in</strong> ice than fish from temperate waters? Food Technol. Aust. (36), 328.<br />
Surendran, P.K., Joseph J., Shenoy A.V., Perigreen P.A., Iyer K. M. <strong>and</strong> Gopakumar K.,<br />
(1989): Studies on spoilage of commercially important tropical fishes under iced storage.<br />
Fish. Res. (7), 1-9.<br />
Sve<strong>in</strong>sdottir, K., Hyldig, G., Mart<strong>in</strong>sdottir, E., Jorgensen, B., <strong>and</strong> Kristbergsson, K., (2003):<br />
Quality Index Method (QIM) scheme developed for farmed Atlantic salmon (Salmo salar).<br />
Food Quality <strong>and</strong> Preference. (14), 237–245.<br />
Sve<strong>in</strong>sdottir, K., Mart<strong>in</strong>sdottir, E., Hyldig, G., Jorgensen, B., <strong>and</strong> Kristbergsson, K. (2002):<br />
Application of Quality Index Method (QIM) scheme <strong>in</strong> shelf-life study of farmed Atlantic<br />
salmon (Salmo salar). Journal of Food Science. 67(4), 1570–1579.<br />
Taoukis P. S, Koustsoumsnis K, Nychas, G. J. E., (1999): Modell<strong>in</strong>g of spoilage microflora of<br />
boque (oops boops) as a bases for chilled distribution monitor<strong>in</strong>g with time –temperature<br />
<strong>in</strong>dicators. In Bourgeois, C. M, Roberts T. A. (Eds.), Predictive microbiology applied to<br />
chilled food preservation (Proceed<strong>in</strong>gs of the <strong>in</strong>ternational Symposium, Quimper, France,<br />
June 16-18, 1997). Refrigeration Science <strong>and</strong> Technology Proceed<strong>in</strong>gs series, International<br />
Institute of Refrigeration (IIR), Paris, France, pp 316-325<br />
Tejada, M., Huidobro, A., (2002): Quality of farmed gilhead seabream (Sparus aurata)<br />
dur<strong>in</strong>g ice storage related to the slaughter method <strong>and</strong> gutt<strong>in</strong>g. Eur. Food Res. Technol.<br />
(215), 1-7.<br />
Van Spreekens K. A. J., (1974): The sweatability of modification of long <strong>and</strong> hummer’s<br />
medium for the enumeration of more fastidious bacteria from fresh fishery products. In Gram<br />
et al., (1987): Detection of specific spoilage bacteria from fish stored at low (0 0 C) <strong>and</strong> high<br />
(20 0 C) temperatures. Int. J. of food <strong>Microbiology</strong>, (4), 65-72.<br />
Warm, K., Bøknæs, N., <strong>and</strong> Nielsen, J. (1998): Development of Quality Index Methods for<br />
evaluation of frozen cod (Gadus morhua) <strong>and</strong> cod fillets. Journal of Aquatic Food Product<br />
Technology 7(1):45–59.<br />
81
Zeng, Q. Z., Thorar<strong>in</strong>sdottir K.A., <strong>and</strong> Olafsdottir, G. (2005): Quality changes of shrimp<br />
(P<strong>and</strong>alus borealis) stored under different cool<strong>in</strong>g conditions. Journal of Food Science 70 (7),<br />
S459–S466.<br />
82
APPENDICES<br />
Appendex I: Freshness rat<strong>in</strong>gs us<strong>in</strong>g the quality assessment scheme used to identify the<br />
quality <strong>in</strong>dex demerit score (Larsen et al. 1992).<br />
Quality<br />
parameter<br />
General<br />
appearance<br />
83<br />
Character Score (ice/seawater)<br />
0 1 2 3<br />
Sk<strong>in</strong> Bright, sh<strong>in</strong><strong>in</strong>g Bright Dull<br />
Bloodspot<br />
on gill<br />
cover<br />
None<br />
Stiffness Stiff, <strong>in</strong> rigor<br />
mortis<br />
Small, 10-<br />
30%<br />
Elastic<br />
Big, 30-<br />
50%<br />
Firm<br />
Belly Firm Soft Belly burst<br />
Smell Fresh,<br />
Eyes Clarity Clear<br />
Shape Normal<br />
seaweed/metallic<br />
Gills Colour Characteristic,<br />
Sum of<br />
scores<br />
red<br />
Smell Fresh, seaweed/<br />
metallic, rancid<br />
Neutral<br />
Cloudy<br />
Pla<strong>in</strong><br />
Faded,<br />
discoloured<br />
Neutral<br />
Musty/sour<br />
Sunken<br />
Sweaty/slig<br />
htly<br />
m<strong>in</strong>imum 0 <strong>and</strong> maximum 20<br />
rancid<br />
Very big, 50-<br />
100%<br />
Soft<br />
Stale<br />
meat/rancid<br />
Sour<br />
st<strong>in</strong>k/stale
Appendix II: Iron agar (IA) for total viable counts (psychrotrophic counts) <strong>in</strong>clud<strong>in</strong>g<br />
detection of black colonies (H2S), Gram et al., (1987).<br />
Ingredients/Composition<br />
1. Peptone 20g<br />
2. Lab lemco powder 3g<br />
3. Yeast extract 3g<br />
4. Ferric citrate 0.3g<br />
5. Sodium thiosulphate 0.3g<br />
6. Sodium chloride 5g (10g for P. Phosphoreum)<br />
7. Agar 15g<br />
8. 990ml distilled water<br />
Sterilize at 121 0 C/15m<strong>in</strong>utes <strong>and</strong> add 10ml (4%) filtrate, L-cyste<strong>in</strong>e is added after sterization -<br />
(5.8g cyste<strong>in</strong>e –HCL/100ml water)<br />
Appendix III: Results of iced whole <strong>Nile</strong> perch <strong>and</strong> chilled fillets<br />
A. Results of QIM scores <strong>in</strong> iced whole <strong>Nile</strong> perch<br />
GENERAL<br />
EYES<br />
(E)<br />
APPEARANCE (GA)<br />
GILLS<br />
84<br />
DAYS 4 7 10 13 15 20 22 26 33<br />
GA SKIN 0,14 0,67 0,60 0,95 0,90 1,29 1,54 1,50 1,67<br />
GA BS-GILLS 0,14 0,39 0,00 0,71 0,52 1,30 0,80 1,17 1,13<br />
GA STIFFNESS 0,81 0,83 0,73 1,05 1,14 1,74 1,00 1,33 2,50<br />
GA BELLY 0,52 0,39 0,20 0,52 0,86 1,31 0,61 1,00 1,08<br />
GA SMELL 0,19 0,56 0,93 1,05 0,86 1,74 1,80 1,33 2,13<br />
E CLARITY 0,10 0,44 0,40 0,57 0,57 0,93 0,69 1,00 1,00<br />
E SHAPE 0,00 0,06 0,07 0,24 0,33 1,59 0,99 1,83 1,71<br />
GILL COLOUR 0,05 0,17 0,20 0,52 0,52 0,94 1,00 1,00 1,00<br />
GILLS SMELL 0,19 0,61 0,93 1,19 1,24 2,00 1,93 1,83 2,21<br />
QIM QIM SCORES 2,14 4,11 4,07 6,81 6,95 12,86 10,36 12,00 14,42<br />
B. Results of shelf life on iced whole <strong>Nile</strong> perch<br />
SPOILAGE<br />
MICRO FLORA<br />
DAYS 4 7 10 13 15 17 20 22 26 33<br />
SSO (H2S)<br />
logcfu/g 2,75 6,20 6,25 6,53 6,15 8,38 9,29 9,49 10,54 10,55<br />
TVC logcfu/g 4,12 6,58 6,67 7,40 7,88 8,70 9,52 9,84 11,01 10,91<br />
Ent. logcfu/g 4,40 5,67 5,64 6,22 5,64 6,55 8,22 8,04 8,23 9,51<br />
QIM SCORES 2,14 4,11 4,07 6,81 6,95 - 12,86 10,36 12,00 14,42<br />
TVB mgN/100g 7,48 7,25 6,51 6,93 7,23 7,52 6,93 8,60 11,99 16,80
C. Results of shelf life for Laboratory chilled fillets<br />
SPOILAGE<br />
MICRO FLORA<br />
85<br />
DAYS 2 6 10 12 17 19 21 23<br />
SSO (H2S)<br />
logcfu/g 1,67 5,72 4,93 6,25 8,35 8,74 9,31 9,31<br />
TVC<br />
logcfu/g 4,42 6,38 6,43 7,43 8,54 9,61 9,67 9,67<br />
Enterobacteriaceae<br />
Ent.logcfu/g 4,60 3,31 3,70 3,52 4,50 8,09 8,07 8,07<br />
TVB mg N /100g 6,72 7,67 7,50 7,67 13,90 14,65 17,07 26,92<br />
D. Results of shelf life for Establishments (E1 & E2) chilled fillets<br />
SPOILAGE<br />
MICRO FLORA<br />
ESTABLISHMENT E1 (10 Days <strong>in</strong> ice) ESTABLISHMENT E2 (17 Days <strong>in</strong> ice)<br />
DAYS 2 8 12 15 2 8 12 15<br />
SSO (H2S) logcfu/g 4,30 6,38 6,38 8,24 4,02 7,05 8,64 10,04<br />
TVC logcfu/g 5,39 6,98 6,98 9,38 4,71 7,51 9,12 10,38<br />
Ent.logcfu/g 3,00 3,34 3,34 7,51 2,15 2,30 3,24 4,43<br />
TVB mgN/100g 8,36 6,55 8,65 21,09 5,65 7,56 7,52 10,63<br />
E. Results of shelf life on Establishments (E3 & E4) chiiled fillets<br />
SPOILAGE<br />
MICRO FLORA<br />
ESTABLISHMENT E3 (6 Dyas <strong>in</strong> ice) ESTABLISHMENT E4 (5 Days <strong>in</strong> ice)<br />
DAYS 2 6 10 13 15 17 2 6 10 13 15<br />
SSO (H2S)<br />
logcfu/g 3,00 4,02 6,18 7,91 8,46 8,42 3,42 4,31 7,03 8,69 8,98<br />
TVC logcfu/g 3,20 4,78 7,40 8,52 9,24 9,53 3,58 5,13 7,31 9,05 9,48<br />
Ent.logcfu/g 2,17 2,00 2,00 3,24 - - 2,83 2,50 2,50 3,66 -<br />
TVB mgN/100g 5,86 5,67 6,55 5,63 7,48 10,71 4,96 4,96 7,18 8,02 13,32