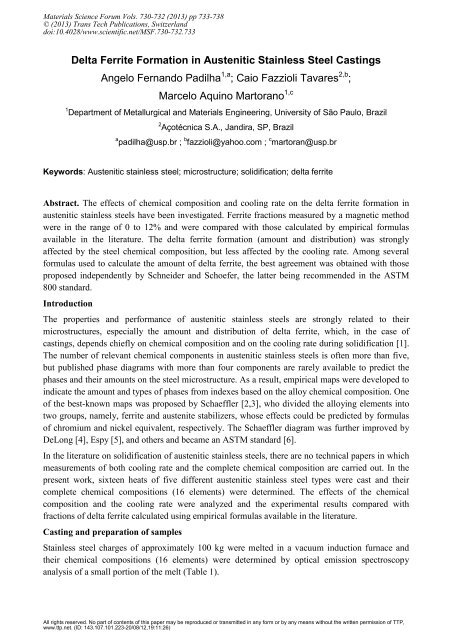
Delta Ferrite Formation in Austenitic Stainless Steel Castings ... - USP
Delta Ferrite Formation in Austenitic Stainless Steel Castings ... - USP
Delta Ferrite Formation in Austenitic Stainless Steel Castings ... - USP

You also want an ePaper? Increase the reach of your titles
YUMPU automatically turns print PDFs into web optimized ePapers that Google loves.
Materials Science Forum Vols. 730-732 (2013) pp 733-738<br />
© (2013) Trans Tech Publications, Switzerland<br />
doi:10.4028/www.scientific.net/MSF.730-732.733<br />
<strong>Delta</strong> <strong>Ferrite</strong> <strong>Formation</strong> <strong>in</strong> <strong>Austenitic</strong> Sta<strong>in</strong>less <strong>Steel</strong> Cast<strong>in</strong>gs<br />
Angelo Fernando Padilha 1,a ; Caio Fazzioli Tavares 2,b ;<br />
Marcelo Aqu<strong>in</strong>o Martorano 1,c<br />
1 Department of Metallurgical and Materials Eng<strong>in</strong>eer<strong>in</strong>g, University of São Paulo, Brazil<br />
2 Açotécnica S.A., Jandira, SP, Brazil<br />
a padilha@usp.br ; b fazzioli@yahoo.com ; c martoran@usp.br<br />
Keywords: <strong>Austenitic</strong> sta<strong>in</strong>less steel; microstructure; solidification; delta ferrite<br />
Abstract. The effects of chemical composition and cool<strong>in</strong>g rate on the delta ferrite formation <strong>in</strong><br />
austenitic sta<strong>in</strong>less steels have been <strong>in</strong>vestigated. <strong>Ferrite</strong> fractions measured by a magnetic method<br />
were <strong>in</strong> the range of 0 to 12% and were compared with those calculated by empirical formulas<br />
available <strong>in</strong> the literature. The delta ferrite formation (amount and distribution) was strongly<br />
affected by the steel chemical composition, but less affected by the cool<strong>in</strong>g rate. Among several<br />
formulas used to calculate the amount of delta ferrite, the best agreement was obta<strong>in</strong>ed with those<br />
proposed <strong>in</strong>dependently by Schneider and Schoefer, the latter be<strong>in</strong>g recommended <strong>in</strong> the ASTM<br />
800 standard.<br />
Introduction<br />
The properties and performance of austenitic sta<strong>in</strong>less steels are strongly related to their<br />
microstructures, especially the amount and distribution of delta ferrite, which, <strong>in</strong> the case of<br />
cast<strong>in</strong>gs, depends chiefly on chemical composition and on the cool<strong>in</strong>g rate dur<strong>in</strong>g solidification [1].<br />
The number of relevant chemical components <strong>in</strong> austenitic sta<strong>in</strong>less steels is often more than five,<br />
but published phase diagrams with more than four components are rarely available to predict the<br />
phases and their amounts on the steel microstructure. As a result, empirical maps were developed to<br />
<strong>in</strong>dicate the amount and types of phases from <strong>in</strong>dexes based on the alloy chemical composition. One<br />
of the best-known maps was proposed by Schaeffler [2,3], who divided the alloy<strong>in</strong>g elements <strong>in</strong>to<br />
two groups, namely, ferrite and austenite stabilizers, whose effects could be predicted by formulas<br />
of chromium and nickel equivalent, respectively. The Schaeffler diagram was further improved by<br />
DeLong [4], Espy [5], and others and became an ASTM standard [6].<br />
In the literature on solidification of austenitic sta<strong>in</strong>less steels, there are no technical papers <strong>in</strong> which<br />
measurements of both cool<strong>in</strong>g rate and the complete chemical composition are carried out. In the<br />
present work, sixteen heats of five different austenitic sta<strong>in</strong>less steel types were cast and their<br />
complete chemical compositions (16 elements) were determ<strong>in</strong>ed. The effects of the chemical<br />
composition and the cool<strong>in</strong>g rate were analyzed and the experimental results compared with<br />
fractions of delta ferrite calculated us<strong>in</strong>g empirical formulas available <strong>in</strong> the literature.<br />
Cast<strong>in</strong>g and preparation of samples<br />
Sta<strong>in</strong>less steel charges of approximately 100 kg were melted <strong>in</strong> a vacuum <strong>in</strong>duction furnace and<br />
their chemical compositions (16 elements) were determ<strong>in</strong>ed by optical emission spectroscopy<br />
analysis of a small portion of the melt (Table 1).<br />
All rights reserved. No part of contents of this paper may be reproduced or transmitted <strong>in</strong> any form or by any means without the written permission of TTP,<br />
www.ttp.net. (ID: 143.107.101.223-20/08/12,19:11:26)
734 Advanced Materials Forum VI<br />
Table 1: Chemical composition (wt. %) of the studied heats.<br />
<strong>Steel</strong> C S Mn Si Cr Ni Mo P Cu Nb N Al Ti W V Co<br />
AISI<br />
302<br />
AISI<br />
304<br />
AISI<br />
316<br />
DIN<br />
1.4581<br />
DIN<br />
XG20<br />
0.22 0.009 1.05 1.05 17.4 11.4 2.34 0.043 0.13 0.69 0.0638 0.0014 0.0069 0.011 0.050 0.077<br />
0.21 0.009 0.891 1.06 17.4 11.0 2.05 0.003 0.11 0.57 0.0617 0.077 0.0073 0.01 0.044 0.096<br />
0.23 0.008 1.01 1.02 18.0 10.9 2.17 0.029 0.13 0.53 0.0576 0.0011 0.0078 0.01 0.049 0.087<br />
0.043 0.004 1.09 0.776 18.4 9.37 0.322 0.039 0.17 0.0069 0.0580 0.0036 0.007 0.037 0.048 0.249<br />
0.038 0.005 0.563 0.399 17.9 10.7 0.110 0.020 0.048 0.0074 0.0270 0.001 0.0035 0.012 0.050 0.037<br />
0.085 0.009 0.677 0.801 18.7 9.25 0.314 0.030 0.12 0.017 0.0729 0.001 0.0034 0.015 0.048 0.083<br />
0.076 0.007 0.931 0.869 18.9 9.19 0.225 0.042 0.12 0.0064 0.0620 0.001 0.0044 0.017 0.047 0.083<br />
0.040 0.006 0.457 1.26 20.5 10.0 0.123 0.029 0.042 0.0072 0.0340 0.076 0.004 0.013 0.050 0.034<br />
0.033 0.007 0.415 1.34 19.5 10.0 0.116 0.027 0.042 0.007 0.0370 0.048 0.0034 0.014 0.049 0.036<br />
0.080 0.006 0.852 0.902 18.2 9.08 0.255 0.023 0.099 0.0062 0.0660 0.0017 0.0043 0.021 0.047 0.083<br />
0.038 0.005 0.998 1.10 17.7 9.62 2.20 0.030 0.14 0.008 0.0476 0.0013 0.0048 0.012 0.048 0.086<br />
0.074 0.008 0.913 1.14 18.7 10.2 2.15 0.031 0.14 0.61 0.0571 0.0034 0.0064 0.013 0.051 0.075<br />
0.070 0.007 0.968 0.940 18.7 11.1 2.23 0.031 0.14 0.72 0.0568 0.001 0.0056 0.012 0.051 0.081<br />
0.065 0.008 0.713 0.985 18.5 10.5 2.19 0.029 0.14 0.49 0.0622 0.001 0.0061 0.013 0.053 0.076<br />
0.036 0.006 1.08 1.15 17.7 10.1 2.18 0.029 0.18 0.011 0.0340 0.0025 0.0078 0.017 0.050 0.091<br />
0.151 0.007 1.10 1.70 27.2 18.9 0.338 0.038 0.099 0.016 0.0523 0.002 0.0071 0.012 0.078 0.072<br />
The sta<strong>in</strong>less steel melt was poured <strong>in</strong>to an <strong>in</strong>vestment cast<strong>in</strong>g (lost wax process) mold. The melt<br />
pour<strong>in</strong>g temperature, which was measured <strong>in</strong> all heats, was <strong>in</strong> the range between 1515 o C and<br />
1633 o C. The mold was made of at least eight layers of a comb<strong>in</strong>ation of colloidal silica slurry and<br />
zircon/alum<strong>in</strong>a silicate stucco. After solidification and cool<strong>in</strong>g to room temperature, the specimens<br />
were extracted from the mold cavity. The specimen shape and dimensions are given <strong>in</strong> Figure 1,<br />
show<strong>in</strong>g different thicknesses <strong>in</strong> each step of a "ladder" to impose an <strong>in</strong>creas<strong>in</strong>g cool<strong>in</strong>g rate from<br />
the largest to the th<strong>in</strong>nest step.<br />
Figure 1: Test specimen geometry (“ladder”)<br />
show<strong>in</strong>g four different thicknesses (10, 20,<br />
30, and 40 mm) and the feeder (cyl<strong>in</strong>der on<br />
the left) used to prevent shr<strong>in</strong>kage defects.<br />
Dimensions are <strong>in</strong> mm.<br />
Heat<br />
1<br />
2<br />
3<br />
4<br />
5<br />
6<br />
7<br />
8<br />
9<br />
10<br />
11<br />
12<br />
13<br />
14<br />
15<br />
16
Type R (Pt-13%Rh, Pt) thermocouples were <strong>in</strong>serted <strong>in</strong>to the mold cavity <strong>in</strong> contact with the steel<br />
to measure the cool<strong>in</strong>g curves at different positions dur<strong>in</strong>g solidification. After comb<strong>in</strong><strong>in</strong>g these<br />
curves with simulation results from the software SolidCast®, the average cool<strong>in</strong>g rates dur<strong>in</strong>g<br />
solidification were estimated to be approximately 0.78, 0.75, 1.4, and 2.7 K/s for each of the four<br />
ladder steps (40, 30, 20, 10 mm), respectively.<br />
Us<strong>in</strong>g the optical emission spectroscopy analysis, the chemical composition of the ladder specimens<br />
was measured at three different locations to verify the existence of any variation <strong>in</strong> the<br />
concentration of elements (macrosegregation) with<strong>in</strong> the specimens. S<strong>in</strong>ce measured variations<br />
were with<strong>in</strong> the experimental error of the analytical technique, no significant macrosegregation was<br />
detected.<br />
The microstructures of the samples were characterized by several complementary techniques of<br />
microstructure analysis. <strong>Delta</strong> ferrite content was determ<strong>in</strong>ed with a Fischer feritscope model<br />
MP30E and the ferrite morphology was studied by optical metalography. The chemical composition<br />
(metallic elements) of the phases (ferrite and austenite) was measured by X-ray microanalysis us<strong>in</strong>g<br />
an energy-dispersive spectrometer (EDS) attached to a scann<strong>in</strong>g electron microscope. The<br />
metallographic preparation for both the optical and scann<strong>in</strong>g electron microscopy consisted of<br />
gr<strong>in</strong>d<strong>in</strong>g, followed by mechanical polish<strong>in</strong>g with diamond paste, and f<strong>in</strong>ally etch<strong>in</strong>g with aqua regia<br />
(100 ml HCl + 3 ml HNO3 + 100 ml methyl alcohol).<br />
Results and discussion<br />
Materials Science Forum Vols. 730-732 735<br />
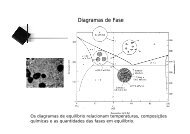
<strong>Ferrite</strong> fractions measured by the magnetic method were <strong>in</strong> the range of 0 to 12% (Table 2). Figure<br />
2(a) shows a typical mapp<strong>in</strong>g of delta ferrite distribution for the specimen of a selected steel heat,<br />
with delta ferrite content (specimen average) of 7.5% (Table 2). Although the <strong>in</strong>fluence of the<br />
cool<strong>in</strong>g rate was weak (Figure 2(b)), a slight decrease <strong>in</strong> delta ferrite fraction with <strong>in</strong>creas<strong>in</strong>g<br />
cool<strong>in</strong>g rate can be observed.<br />
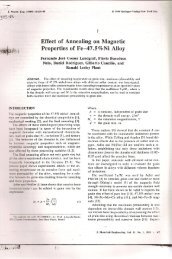
The metallographic analysis showed that the steel sample with approximately 10% ferrite presented<br />
an almost cont<strong>in</strong>uous ferrite network microstructure (Figure 3a), which deteriorates toughness when<br />
this ferrite suffers embrittlement caused by high temperature exposition [7,8]. In the samples with<br />
delta ferrite fractions around 5%, the ferrite network was semi-cont<strong>in</strong>uous (Figure 3b), while for<br />
lower fractions (around 2%) the ferrite was arranged <strong>in</strong> isolated cores (Figure 3c).<br />
El Nayal and Beech [9] and Suutala and Moisio [10] def<strong>in</strong>ed a criterion based on the ratio of<br />
chromium to nickel equivalents (Creq/Nieq) to determ<strong>in</strong>e which of the follow<strong>in</strong>g solidification modes<br />
is observed <strong>in</strong> austenitic sta<strong>in</strong>less steels: mode A (L→L + γ→ γ), mode AF (L→L + γ→L + γ +<br />
δ→γ + δ), or mode FA (L→L + δ→L + δ + γ →γ + δ). In this sequence, L is the liquid phase, γ is<br />
austenite, and δ is ferrite. In agreement with this criterion, heats 1, 2, 3, and 16 solidified <strong>in</strong> mode A<br />
and their microstructures did not have any ferrite. On the other hand, samples from heats 4 to 15,<br />
which showed some delta ferrite <strong>in</strong> the microstructure, solidified <strong>in</strong> mode FA, i.e., with ferrite as the<br />
lead<strong>in</strong>g phase and formation of <strong>in</strong>terdendritic austenite at the expense of ferrite dendrites dur<strong>in</strong>g<br />
solidification. After solidification, dur<strong>in</strong>g cool<strong>in</strong>g to room temperature, further austenite might<br />
form, consum<strong>in</strong>g ferrite.<br />
The microanalyses with EDS were used to calculate the solute partition ratios of Si, Mo, Cr, Fe, and<br />
Ni contents <strong>in</strong> austenite to those <strong>in</strong> delta ferrite. These ratios were obta<strong>in</strong>ed for all steps of the<br />
ladder samples from three experiments, namely, heats 8 (AISI 304), 13 (DIN 1.4581), and 6 (AISI<br />
304), as shown <strong>in</strong> Table 3. In the report published by the Jernkontoret [12], the partition ratios for
736 Advanced Materials Forum VI<br />
chromium and nickel were: Crδ/Crγ = 1.2 and Niδ/Niγ = 0.5 (steel AISI 304), and Crδ/Crγ = 1.3 and<br />
Niδ/Niγ = 0.6 (steel DIN 1.4583). These values are <strong>in</strong> reasonable agreement with those reported <strong>in</strong><br />
Table 3 for the present work samples.<br />
Table 2: <strong>Delta</strong> ferrite content measured with the feritscope <strong>in</strong> the ladder steps of different<br />
thicknesses from samples of different heats. The average value and standard deviation are shown<br />
for each step and an average for all steps of the same ladder sample (same heat) is also given.<br />
Heat<br />
Thickness (mm)<br />
10 20 30 40<br />
Average Standard<br />
Deviation<br />
Average Standard<br />
Deviation<br />
Average Standard<br />
Deviation<br />
Average<br />
Standard<br />
Deviation<br />
Average Standard<br />
1 0 0 0 0 0 0 0 0 0 0<br />
2 0 0 0 0 0 0 0 0 0 0<br />
3 0 0 0 0 0 0 0 0 0 0<br />
Deviation<br />
4 4.2 0.3 4.5 1.0 4.6 1.1 4.6 0.7 4.5 0.9<br />
5 1.8 0.4 1.8 0.5 1.8 0.7 1.5 0.6 1.7 0.6<br />
6 1.5 0.3 1.8 0.5 2.2 0.6 2.4 0.9 2.1 0.7<br />
7 2.8 0.3 3.0 0.8 3.4 0.9 3.1 0.9 3.1 0.9<br />
8 10.6 0.6 11.2 1.2 11.6 1.1 11.3 1.7 11.3 1.3<br />
9 6.5 0.4 7.2 0.6 7.5 0.9 7.8 1.0 7.5 0.9<br />
10 1.8 0.6 1.7 0.8 1.8 0.8 1.7 0.6 1.8 0.7<br />
11 8.1 0.5 8.8 0.7 9.1 1.1 10.1 1.4 9.2 1.3<br />
12 7.1 0.4 8.1 0.5 8.1 0.9 8.3 0.9 8.1 0.9<br />
13 3.6 1.1 4.7 0.8 5.0 0.8 5.3 0.7 4.9 0.9<br />
14 6.2 0.7 7.1 0.9 7.3 1.1 6.5 2.1 6.8 1.5<br />
15 8.1 0.6 8.8 0.6 9.7 1.3 9.6 1.4 9.3 1.3<br />
16 0 0 0 0 0 0 0 0 0 0<br />
(a)<br />
Figure 2: Measurements of delta ferrite fraction: (a) on the central longitud<strong>in</strong>al section of specimen<br />
obta<strong>in</strong>ed from heat 9 (AISI 304); (b) as a function of cool<strong>in</strong>g rate (R) for heats <strong>in</strong> Table 1.<br />
(b)
Figure 3: Morphology of delta ferrite (cool<strong>in</strong>g rate 2.7 K/s): (a) cont<strong>in</strong>uous network (heat 8 AISI<br />
304); (b) semi-cont<strong>in</strong>uous network (heat 13 DIN 1.4581); and (c) isolated cores (heat 6 AISI 304).<br />
Table 3: Solute partition ratios of Si, Mo, Cr, Fe, and Ni concentrations <strong>in</strong> ferrite (δ) to those <strong>in</strong><br />
austenite (γ) of three different steel ladder samples <strong>in</strong> the four steps of different thicknesses.<br />
Heat Thickness (mm) Siδ/Siγ Moδ/Moγ Crδ/Crγ Feδ/Feγ Niδ/Niγ<br />
8<br />
(AISI 304)<br />
13<br />
(DIN 1.4581)<br />
6<br />
(AISI 304)<br />
Materials Science Forum Vols. 730-732 737<br />
(a) (b) (c)<br />
10 0.95 1.07 1.33 1.00 0.38<br />
20 1.04 4.22 1.41 0.98 0.42<br />
30 1.16 0.68 1.42 0.96 0.43<br />
40 1.32 3.00 1.35 0.97 0.48<br />
Average 1.12 2.24 1.38 0.98 0.43<br />
10 0.91 1.15 1.26 0.97 0.59<br />
20 1.18 1.78 1.38 0.97 0.42<br />
30 1.37 2.37 1.36 0.96 0.42<br />
40 1.10 0.81 1.28 0.94 0.77<br />
Average 1.14 1.53 1.32 0.96 0.55<br />
10 1.10 1.88 1.33 0.91 0.30<br />
20 1.09 1.28 1.39 0.96 0.35<br />
30 1.11 0.70 1.28 0.99 0.33<br />
40 1.50 - 1.60 0.87 0.57<br />
Average 1.20 1.29 1.4 0.93 0.39<br />
Figure 4: <strong>Delta</strong> ferrite content as a function of the ratio of chromium to nickel equivalents<br />
calculated from the formulas proposed by (a) Schaeffler [2,3] and (b) Schoefer [6].
738 Advanced Materials Forum VI<br />
The <strong>in</strong>fluence of steel chemical composition on the delta ferrite content was noteworthy. Us<strong>in</strong>g<br />
suggested formulas for nickel and chromium equivalents, the correlation between the ferrite content<br />
and the ratio of chromium to nickel equivalents were exam<strong>in</strong>ed (Figure 4). Among the many tested<br />
formulas for predict<strong>in</strong>g delta ferrite content, the two that showed better correlation coefficients are<br />
those proposed by Schneider and Schoefer; the latter be<strong>in</strong>g recommended by the ASTM A800<br />
Standard [6]. In Figure 4, examples of strong and weak correlations are given us<strong>in</strong>g the formulas<br />
proposed by Schaeffler [2,3] and Schoefer [6].<br />
Conclusions<br />
The follow<strong>in</strong>g conclusions can be drawn: (a) the amount and distribution of delta ferrite was<br />
strongly affected by the steel chemical composition, but less affected by the cool<strong>in</strong>g rate; (b) among<br />
several formulas used to predict the delta ferrite content, the best agreement was obta<strong>in</strong>ed with<br />
those proposed <strong>in</strong>dependently by Schneider and Schoefer; the latter is recommended <strong>in</strong> the ASTM<br />
800 standard; (c) In the heats 4 to 15, which probably solidified follow<strong>in</strong>g the sequence L → L + δ<br />
→ L + δ + γ → γ + δ, the solute partition ratios of Si, Mo, Cr, Fe, and Ni contents <strong>in</strong> ferrite to those<br />
<strong>in</strong> austenite are <strong>in</strong> agreement with values published <strong>in</strong> the literature for similar steel compositions.<br />
References<br />
[1] A. F. Padilha and P. R. Rios, Decomposition of austenite <strong>in</strong> austenitic sta<strong>in</strong>less steels, ISIJ<br />
International 42 (2002) 325 - 337.<br />
[2] A. L. Schaeffler, Selection of austenitic electrodes for weld<strong>in</strong>g dissimilar metals, Weld<strong>in</strong>g<br />
Journal Res. Suppl. 26 (1947) 603s - 620s.<br />
[3] A. L. Schaeffler, Constitution diagram for sta<strong>in</strong>less steel weld metal, Metal Progress 56 (1949)<br />
680 - 680B.<br />
[4] W. T. DeLong, <strong>Ferrite</strong> <strong>in</strong> austenitic sta<strong>in</strong>less steel weld metal, Weld<strong>in</strong>g Journal Res. Suppl. 53<br />
(1974) 273s – 286s.<br />
[5] R. H. Espy, Weldability of nitrogen-strengthened sta<strong>in</strong>less steels, Weld<strong>in</strong>g Journal Res. Suppl.<br />
61 (1982) 149s - 156s.<br />
[6] ASTM 800/A 800M-01, Standard practice for steel cast<strong>in</strong>g, austenitic alloy, estimat<strong>in</strong>g ferrite<br />
content thereof, American Society for Test<strong>in</strong>g and Material.<br />
[7] T. Yamada, S. Okano and H. Kuwano, Mechanical property and microstructural change by<br />
thermal ag<strong>in</strong>g of SCS14A cast duplex sta<strong>in</strong>less steel, J. Nucl. Mater. 350 (2006) 47 - 55.<br />
[8] A. F. Padilha, D. M. Escriba, E. Materna-Morris, M. Rieth and M. Klimenkov, Precipitation <strong>in</strong><br />
AISI 316L(N) dur<strong>in</strong>g creep tests at 550 and 600 ºC up to 10 years, J. Nucl. Mater. 362 (2007)<br />
132 - 138.<br />
[9] G. El Nayal and J. Beech, Relationship between composition, impurity content, cool<strong>in</strong>g rate, and<br />
solidification <strong>in</strong> austenitic sta<strong>in</strong>less-steels, Mater. Sci. Tech. 2 (1986) 603 - 610.<br />
[10] N. Suutala and T. Moisio, Use of chromium and nickel equivalents <strong>in</strong> consider<strong>in</strong>g<br />
solidification phenomena <strong>in</strong> austenitic sta<strong>in</strong>less steels, In: Solidification Technology <strong>in</strong> the<br />
Foundry and Cast House, The Metals Society, Coventry (1980) 310 - 314.<br />
[11] A guide to the solidification of steels, Jernkontoret, Stockholm (1977) 91-101.