FEATURE EXTRACTION OF MAMMOGRAMS - Bioinfo Publications
FEATURE EXTRACTION OF MAMMOGRAMS - Bioinfo Publications
FEATURE EXTRACTION OF MAMMOGRAMS - Bioinfo Publications

You also want an ePaper? Increase the reach of your titles
YUMPU automatically turns print PDFs into web optimized ePapers that Google loves.
International Journal of <strong>Bioinfo</strong>rmatics Research<br />
ISSN: 0975–3087 & E-ISSN: 0975–9115 , Volume 4, Issue 1, 2012, pp.-241-244<br />
Available online at http://www.bioinfo.in/contents.php?id=21<br />
<strong>FEATURE</strong> <strong>EXTRACTION</strong> <strong>OF</strong> <strong>MAMMOGRAMS</strong><br />
PRADEEP N. 1* , GIRISHA H. 2 , SREEPATHI B. 2 AND KARIBASAPPA K. 3<br />
1Department of Computer Science and Engineering, B.I.E.T., Davangere, Karnataka, India.<br />
2Department of Computer Science and Engineering, RYMEC, Bellary, Karnataka, India.<br />
3Department of Computer Science and Engineering, DSCE, Bangalore, Karnataka, India.<br />
*Corresponding Author: Email- nmnpradeep@yahoo.com<br />
Received: January 20, 2012; Accepted: February 20, 2012<br />
Abstract- Cancer is uncontrolled growth of cells. Breast Cancer is the uncontrolled growth of cells in the breast region. Breast cancer is the<br />
second leading cause of cancer deaths in women today. Early detection of the cancer can reduce mortality rate. Early detection of Breast<br />
Cancer can be achieved using Digital Mammography, typically through detection of characteristic masses and/or microcalcifications. A Mammogram<br />
is an x-ray of the breast tissue which is designed to identify abnormalities. Studies have shown that radiologists can miss the detection<br />
of a significant proportion of abnormalities in addition to having high rates of false positives. Therefore, it would be valuable to develop a<br />
computer aided method for mass/tumor classification based on extracted features from the Region Of Interest (ROI) in mammograms. ROI<br />
has to be segmented from the digital mammogram using the Segmentation techniques. Pattern recognition in image processing requires the<br />
extraction of features from regions of the image, and the processing of these features with a pattern recognition algorithm. We consider the<br />
feature extraction part of this processing, with a focus on the problem of tumor detection in digital mammography.<br />
Features are nothing but observable patterns in the image which gives some information about the image. For every Pattern Classification<br />
problem, the most important stage is Feature Extraction. The accuracy of the classification depends on the Feature Extraction stage. The<br />
different features that can be extracted for a digital mammogram are: Texture Features, Statistical Features, Structural Features.<br />
In this paper, we are able to calculate Texture, Statistical and Structural Features. We have used MATLAB for extracting the tumors from<br />
input mammogram and for calculating various features.<br />
Key words- Breast Cancer, Digital Mammography, Region of Interest, Segmentation, Features, Texture, Statistical, Structural<br />
Citation: Pradeep N., et al (2012) Feature Extraction of Mammograms. International Journal of <strong>Bioinfo</strong>rmatics Research, ISSN: 0975–3087<br />
& E-ISSN: 0975–9115 , Volume 4, Issue 1, 2012, pp-241-244.<br />
Copyright: Copyright©2012 Pradeep N., et al. This is an open-access article distributed under the terms of the Creative Commons Attribution<br />
License, which permits unrestricted use, distribution, and reproduction in any medium, provided the original author and source are credited.<br />
Introduction<br />
Breast cancer remains a leading cause of cancer deaths among<br />
women in many parts of the world. Early detection of breast cancer<br />
through periodic screening has noticeably improved the outcome of<br />
the disease [1]. Cancer is an abnormal, continual multiplying of<br />
cells. The cells divide uncontrollably and may grow into adjacent<br />
tissue or spread to distant parts of the body. The mass of cancer<br />
cells will eventually become large enough to produce lumps, masses,<br />
or tumors that can be detected. Breast Tumor is a tumor present<br />
in Breast. Tumor is uncontrolled growth of cells which can be<br />
either benign or malignant. Benign is not cancerous. Benign tumors<br />
may grow larger but do not spread to other parts of the body.<br />
Malignant is cancerous. Malignant tumors can invade and destroy<br />
International Journal of <strong>Bioinfo</strong>rmatics Research<br />
ISSN: 0975–3087 & E-ISSN: 0975–9115 , Volume 4, Issue 1, 2012<br />
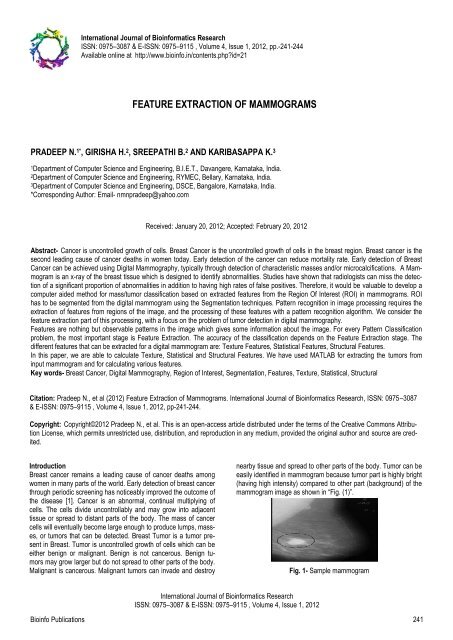
nearby tissue and spread to other parts of the body. Tumor can be<br />
easily identified in mammogram because tumor part is highly bright<br />
(having high intensity) compared to other part (background) of the<br />
mammogram image as shown in “Fig. (1)”.<br />
Fig. 1- Sample mammogram<br />
<strong>Bioinfo</strong> <strong>Publications</strong> 241
In the figure, we can observe that the marked oval shape area<br />
have higher intensity compared to the surrounding area. This<br />
marked oval shape is the required ROI. The most important and<br />
challenging task is to segment only the tumor from the digital mammogram.<br />
Features have to be determined for the segmented tumor.<br />
Computer Aided (CA) detection systems have been developed to<br />
aid radiologists in detecting mammographic lesions, charactering<br />
promising performance [2-5].<br />
There are large numbers of diagnostic methods currently available,<br />
among which mammography is the most reliable method, for detecting<br />
early breast cancer [6-7].<br />
Methodology<br />
Fig. 2- Methodology<br />
Image Preprocessing<br />
The preprocessing phase of digital mammograms refers to the<br />
enhancement of mammograms intensity and contrast manipulation,<br />
noise reduction, background removal, edges sharpening, filtering,<br />
etc.<br />
Segmentation<br />
In analyzing mammogram image, it is important to distinguish the<br />
suspicious region from its surroundings. The methods used to separate<br />
the Region of Interest from the background are usually referred<br />
as the segmentation process. Segmentation can be carried<br />
out using any of the standard techniques like Local Thresholding, K<br />
–Means Clustering, Otsu Segmentation Technique. In this paper,<br />
we have used Local Thresholding Technique [8] for segmentation.<br />
The segmentation block diagram is shown in the “Fig. (3)”.<br />
Fig. 3- Segmentation block diagram<br />
Feature Extraction of Mammograms<br />
International Journal of <strong>Bioinfo</strong>rmatics Research<br />
ISSN: 0975–3087 & E-ISSN: 0975–9115 , Volume 4, Issue 1, 2012<br />
Local Thresholding<br />
The technique has been proven to provide an easy and convenient<br />
way to perform the segmentation on digital mammogram. The segmentation<br />
is determined by a single value known as the intensity<br />
threshold value. Then, each pixel in the image is compared with the<br />
threshold value. Pixel intensity values higher than the threshold will<br />
result in a white spot in the output image<br />
Feature Extraction<br />
Feature is used to denote a piece of information which is relevant<br />
for solving the computational task related to a certain application.<br />
More specifically, features can refer to:<br />
The result of a general neighborhood operation (feature extractor<br />
or feature detector) applied to the image,<br />
Specific structures in the image itself, ranging from simple<br />
structures such as points or edges to more complex structures<br />
such as objects.<br />
Many features have been extracted for the abnormalities of mammograms.<br />
The extraction methods of texture feature play very important<br />
role in detecting abnormalities of mammograms because of<br />
the nature of mammograms. Texture features have been proven to<br />
be useful in differentiating masses and normal breast tissues. Texture<br />
features are able to isolate normal and abnormal lesion with<br />
masses and microcalcification. Feature extraction block diagram is<br />
shown in “Fig. (4)”.<br />
Fig.4- Feature Extraction Block diagram<br />
1<br />
In the work, we have extracted Texture features, Statistical features<br />
and Structural Features for the segmented tumor from the given<br />
input mammogram image. The features that we have extracted are:<br />
1. Mean<br />
The mean, m of the pixel values in the defined window, estimates<br />
the value in the image in which central clustering occurs. The mean<br />
can be calculated using the formula:<br />
Where p(i,j) is the pixel value at point (i,j) of an image of size MxN.<br />
2. Standard Deviation<br />
The Standard Deviation, σ is the estimate of the mean square deviation<br />
of grey pixel value p (i, j) from its mean valuem. Standard<br />
<strong>Bioinfo</strong> <strong>Publications</strong> 242
deviation describes the dispersion within a local region. It is determined<br />
using the formula:<br />
3. Smoothness<br />
Relative smoothness, R is a measure of grey level contrast that<br />
can be used to establish descriptors of relative smoothness. The<br />
smoothness is determined using the formula:<br />
Where, σ is the Standard Deviation of the image.<br />
4. Entropy<br />
Entropy is a statistical measure of randomness that can be used to<br />
characterize the texture of the input image. Entropy, h can also be<br />
used to describe the distribution variation in a region. Overall Entropy<br />
of the image can be calculated as:<br />
Where, Pr is the probability of the k-th grey level, which can be<br />
calculated as Zk /m*n, Zk is the total number of pixels with the kth<br />
grey level and L is the total number of grey levels.<br />
5. Skewness<br />
Skewness, S characterizes the degree of asymmetry of a pixel<br />
distribution in the specified window around its mean. Skewness is a<br />
pure number that characterizes only the shape of the distribution.<br />
The formula for finding Skewness is given in the below equation:<br />
Where, p(i, j) is the pixel value at point (i,j), m and σ are the mean<br />
and standard deviation respectively.<br />
6. Kurtosis<br />
Kurtosis, K measures the Peakness or flatness of a distribution<br />
relative to a normal distribution. The conventional definition of kurtosis<br />
is:<br />
Where, p(i,j) is the pixel value at point (i,j), m and σ are the Mean<br />
and Standard Deviation respectively. The -3 term makes the value<br />
zero for a normal distribution.<br />
7. Root Mean Square (RMS)<br />
The RMS (Root Mean Square) computes the RMS value of each<br />
row or column of the input, along vectors of a specified dimension<br />
of the input, or of the entire input. The RMS value of the j th column<br />
of an M-by-N input matrix u is given by below equation:<br />
Pradeep N., Girisha H., Sreepathi B. and Karibasappa K.<br />
International Journal of <strong>Bioinfo</strong>rmatics Research<br />
ISSN: 0975–3087 & E-ISSN: 0975–9115 , Volume 4, Issue 1, 2012<br />
8. Inverse Difference Moment (IDM)<br />
It is a measure of image texture. IDM ranges from 0.0 for an image<br />
that is highly textured to 1.0 for an image that is untextured. The<br />
formula for finding the IDM is given in below equation:<br />
9. Energy<br />
Energy returns the sum of squared elements in the Grey Level Co-<br />
Occurrence Matrix (GLCM). Energy is also known as uniformity.<br />
The range of energy is [0 1]. Energy is 1 for a constant image. The<br />
formula for finding energy is given in below equation:<br />
10. Contrast<br />
Contrast returns a measure of the intensity contrast between a<br />
pixel and its neighbour over the whole image. The range of Contrast<br />
is [0 (size (GLCM, 1)-1) ^2]. Contrast is 0 for a constant image.<br />
Contrast is calculated by using the equation given below:<br />
11. Correlation<br />
Correlation returns a measure of how correlated a pixel is to its<br />
neighbor over the whole image. The range of correlation is [-1 1].<br />
Correlation is 1 or -1 for a perfectly positively or negatively correlated<br />
image. Correlation is NaN (Not a Number) for a constant image.<br />
The below equation shows the calculation of Correlation.<br />
Where , , , and are the means and standard<br />
deviations of Pi and Pj, the partial probability density functions.<br />
12. Homogeneity<br />
Homogeneity returns a value that measures the closeness of the<br />
distribution of elements in the GLCM to the GLCM diagonal. The<br />
range of Homogeneity is [0 1]. Homogeneity is 1 for a diagonal<br />
GLCM. The Homogeneity is evaluated using the equation:<br />
13. Variance<br />
Variance is the square root of standard deviation. The formula for<br />
finding Variance is:<br />
Where SD is the Standard Deviation.<br />
After extracting the features of segmented mass/tumor, then the<br />
dataset has to be constructed in the proper format, so that it can be<br />
given to any of the standard classifier tools.<br />
<strong>Bioinfo</strong> <strong>Publications</strong> 243
Experimental Output<br />
In Fig. 5, we can observe the values of the features extracted.<br />
Similarly the features have to be extracted for more number of<br />
images. The first image is the Mammogram input image and the<br />
second image is the tumor extracted by using the segmentation<br />
technique.<br />
Future Enhancements<br />
After calculating all the features for the set of pre diagnosed mammogram<br />
images, the feature dataset has to be constructed in the<br />
appropriate format, so that the classifier can understand. Some of<br />
the classifiers that can be used are LIBSVM, SVMLight, SVMtorch,<br />
ANN or any other classifiers. This phase is “Training Phase”. Then<br />
in Testing Phase, for unknown (not diagnosed) mammogram images,<br />
features are determined and also feature dataset has to be<br />
constructed. The newly constructed feature dataset is given for the<br />
classifier which has been used in the training phase.<br />
The classifier efficiency has to be determined, Receiver Operating<br />
Characteristics (ROC) plots has to be plotted. The classifier results<br />
of the unknown images/samples will be given for the radiologists<br />
for cross verification.<br />
Feature Extraction of Mammograms<br />
Fig. 5- Output Snapshot.<br />
International Journal of <strong>Bioinfo</strong>rmatics Research<br />
ISSN: 0975–3087 & E-ISSN: 0975–9115 , Volume 4, Issue 1, 2012<br />
References<br />
[1] Tabar L. and Dean P.B. (2003) Gynaecol Obstet, 82, 319-326.<br />
[2] Giger M.L., Karssemeijer N. and Armato S.G. (2001) IEEE<br />
Trans. on Med. Imaging, 20, 1205-1208.<br />
[3] Giger M.L. ( 2000) Comput. Science Engineering, 2, 39-45.<br />
[4] Doi K., MacMahon H., Katsuragawa S., Nishikawa R.M. and<br />
Jiang Y. (1999) Eur. J. Radiol., 31, 97-109.<br />
[5] Vyborny C.J., Giger M.L. and Nishikawa R.M. (2000) Radiologic<br />
Clinics of North America, 38, 725-740.<br />
[6] Guido M. te Brake and Nico Karssemeijer (1999) IEEE Transactions<br />
on Medical Imaging, 18(7), 628-638<br />
[7] Harvey J.E., Fajardo L.L., and Inis G.A. (1993) AJR, 161, 1167<br />
-1172.<br />
[8] Karssemeijer N.(1998) Phys. Med. Biol., 43, 365-378.<br />
<strong>Bioinfo</strong> <strong>Publications</strong> 244