

Ohio Deferred Compensation Investment Performance Report –– As ...
Ohio Deferred Compensation Investment Performance Report –– As ...
Ohio Deferred Compensation Investment Performance Report –– As ...

You also want an ePaper? Increase the reach of your titles
YUMPU automatically turns print PDFs into web optimized ePapers that Google loves.
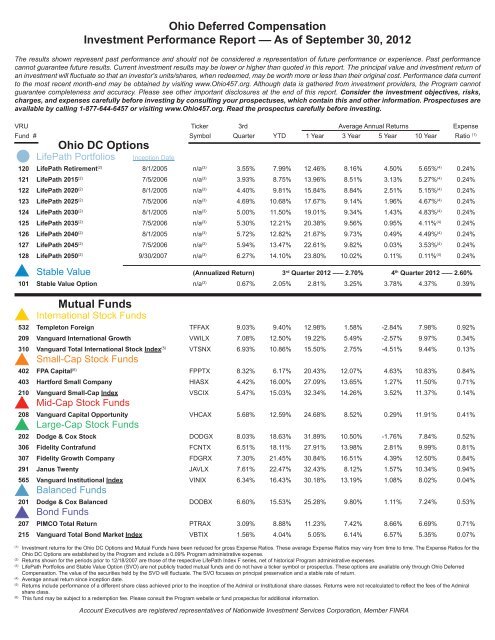
<strong>Ohio</strong> <strong>Deferred</strong> <strong>Compensation</strong><br />
<strong>Investment</strong> <strong>Performance</strong> <strong>Report</strong> <strong>––</strong> <strong>As</strong> of September 30, 2012<br />
The results shown represent past performance and should not be considered a representation of future performance or experience. Past performance<br />
cannot guarantee future results. Current investment results may be lower or higher than quoted in this report. The principal value and investment return of<br />
an investment will fluctuate so that an investor's units/shares, when redeemed, may be worth more or less than their original cost. <strong>Performance</strong> data current<br />
to the most recent month-end may be obtained by visiting www.<strong>Ohio</strong>457.org. Although data is gathered from investment providers, the Program cannot<br />
guarantee completeness and accuracy. Please see other important disclosures at the end of this report. Consider the investment objectives, risks,<br />
charges, and expenses carefully before investing by consulting your prospectuses, which contain this and other information. Prospectuses are<br />
available by calling 1-877-644-6457 or visiting www.<strong>Ohio</strong>457.org. Read the prospectus carefully before investing.<br />
VRU Ticker 3rd Average Annual Returns Expense<br />
Fund # Symbol Quarter YTD 1 Year 3 Year 5 Year 10 Year Ratio (1)<br />
<strong>Ohio</strong> DC Options<br />
LifePath Portfolios Inception Date<br />
120 LifePath Retirement (2) 8/1/2005 n/a (3) 3.55% 7.99% 12.46% 8.16% 4.50% 5.65% (4) 0.24%<br />
121 LifePath 2015 (2) 7/5/2006 n/a (3) 3.93% 8.75% 13.96% 8.51% 3.13% 5.27% (4) 0.24%<br />
122 LifePath 2020 (2) 8/1/2005 n/a (3) 4.40% 9.81% 15.84% 8.84% 2.51% 5.15% (4) 0.24%<br />
123 LifePath 2025 (2) 7/5/2006 n/a (3) 4.69% 10.68% 17.67% 9.14% 1.96% 4.67% (4) 0.24%<br />
124 LifePath 2030 (2) 8/1/2005 n/a (3) 5.00% 11.50% 19.01% 9.34% 1.43% 4.83% (4) 0.24%<br />
125 LifePath 2035 (2) 7/5/2006 n/a (3) 5.30% 12.21% 20.38% 9.56% 0.95% 4.11% (4) 0.24%<br />
126 LifePath 2040 (2) 8/1/2005 n/a (3) 5.72% 12.82% 21.67% 9.73% 0.49% 4.49% (4) 0.24%<br />
127 LifePath 2045 (2) 7/5/2006 n/a (3) 5.94% 13.47% 22.61% 9.82% 0.03% 3.53% (4) 0.24%<br />
128 LifePath 2050 (2) 9/30/2007 n/a (3) 6.27% 14.10% 23.80% 10.02% 0.11% 0.11% (4) 0.24%<br />
Stable Value (Annualized Return) 3 rd Quarter 2012 <strong>––</strong>– 2.70% 4 th Quarter 2012 <strong>––</strong>– 2.60%<br />
101 Stable Value Option n/a (3) 0.67% 2.05% 2.81% 3.25% 3.78% 4.37% 0.39%<br />
Mutual Funds<br />
International Stock Funds<br />
532 Templeton Foreign TFFAX 9.03% 9.40% 12.98% 1.58% -2.84% 7.98% 0.92%<br />
209 Vanguard International Growth VWILX 7.08% 12.50% 19.22% 5.49% -2.57% 9.97% 0.34%<br />
310 Vanguard Total International Stock Index (5) VTSNX 6.93% 10.86% 15.50% 2.75% -4.51% 9.44% 0.13%<br />
Small-Cap Stock Funds<br />
402 FPA Capital (6) FPPTX 8.32% 6.17% 20.43% 12.07% 4.63% 10.83% 0.84%<br />
403 Hartford Small Company HIASX 4.42% 16.00% 27.09% 13.65% 1.27% 11.50% 0.71%<br />
210 Vanguard Small-Cap Index<br />
Mid-Cap Stock Funds<br />
VSCIX 5.47% 15.03% 32.34% 14.26% 3.52% 11.37% 0.14%<br />
208 Vanguard Capital Opportunity<br />
Large-Cap Stock Funds<br />
VHCAX 5.68% 12.59% 24.68% 8.52% 0.29% 11.91% 0.41%<br />
202 Dodge & Cox Stock DODGX 8.03% 18.63% 31.89% 10.50% -1.76% 7.84% 0.52%<br />
306 Fidelity Contrafund FCNTX 6.51% 18.11% 27.91% 13.98% 2.81% 9.99% 0.81%<br />
307 Fidelity Growth Company FDGRX 7.30% 21.45% 30.84% 16.51% 4.39% 12.50% 0.84%<br />
291 Janus Twenty JAVLX 7.61% 22.47% 32.43% 8.12% 1.57% 10.34% 0.94%<br />
565 Vanguard Institutional Index<br />
Balanced Funds<br />
VINIX 6.34% 16.43% 30.18% 13.19% 1.08% 8.02% 0.04%<br />
201 Dodge & Cox Balanced<br />
Bond Funds<br />
DODBX 6.60% 15.53% 25.28% 9.80% 1.11% 7.24% 0.53%<br />
207 PIMCO Total Return PTRAX 3.09% 8.88% 11.23% 7.42% 8.66% 6.69% 0.71%<br />
215 Vanguard Total Bond Market Index VBTIX 1.56% 4.04% 5.05% 6.14% 6.57% 5.35% 0.07%<br />
(1) <strong>Investment</strong> returns for the <strong>Ohio</strong> DC Options and Mutual Funds have been reduced for gross Expense Ratios. These average Expense Ratios may vary from time to time. The Expense Ratios for the<br />
<strong>Ohio</strong> DC Options are established by the Program and include a 0.09% Program administrative expense.<br />
(2) Returns shown for the periods prior to 12/18/2007 are those of the respective LifePath Index F series, net of historical Program administrative expenses.<br />
(3) LifePath Portfolios and Stable Value Option (SVO) are not publicly traded mutual funds and do not have a ticker symbol or prospectus. These options are available only through <strong>Ohio</strong> <strong>Deferred</strong><br />
<strong>Compensation</strong>. The value of the securities held by the SVO will fluctuate. The SVO focuses on principal preservation and a stable rate of return.<br />
(4) Average annual return since inception date.<br />
(5) Returns include performance of a different share class achieved prior to the inception of the Admiral or Institutional share classes. Returns were not recalculated to reflect the fees of the Admiral<br />
share class.<br />
(6) This fund may be subject to a redemption fee. Please consult the Program website or fund prospectus for additional information.<br />
Account Executives are registered representatives of Nationwide <strong>Investment</strong> Services Corporation, Member FINRA
<strong>Investment</strong> <strong>Performance</strong> <strong>Report</strong> Notes<br />
<strong>As</strong>set Class Descriptions — <strong>As</strong>set classes identify funds that tend to have similar investment objectives and strategies, and<br />
generally react in a similar manner to market fluctuations as other funds in the same class. Spreading your investment selections<br />
across several asset classes, a technique known as diversification, can help increase your total return based on the level of risk<br />
you are willing to accept. The use of diversification and asset allocation as part of an overall investment strategy does not assure<br />
a profit or protect against loss in a declining market.<br />
LifePath Portfolios — Each LifePath portfolio is a pre-mixed option investing in multiple asset classes in the US<br />
and abroad with an asset allocation of stocks, bonds and cash based on a target year (when you expect to begin<br />
using your money). The portfolio then automatically adjusts its asset allocation as the target year approaches, by<br />
investing more and more conservatively, reducing its investments in stocks, and increasing its investments in bonds<br />
and cash. The LifePath Portfolios are designed to provide diversification and asset allocation across several types<br />
of investments and asset classes, primarily by investing in underlying funds. These portfolios experience risks<br />
and expenses ratios, including applicable fees and expenses, of the underlying funds. There is no guarantee that<br />
LifePath Portfolios will provide enough income for retirement.<br />
Stable Value — These options are short to intermediate term, high quality securities. Investors who seek safety of<br />
principal as well as a competitive rate of return compared to money market funds, may invest in these options. The<br />
Stable Value Option annualized returns are net of investment management, custody, principal protection, and plan<br />
administration fees. A fund profile can be obtained for the Stable Value Option by calling 1-877-644-6457 or visiting<br />
www.<strong>Ohio</strong>457.org.<br />
International Stock Funds — International funds, also known as foreign funds, contain stocks from companies<br />
located outside of the United States. Most international stock funds seek long-term growth of capital. These funds<br />
typically have higher risk due to political factors, currency fluctuations, differences in accounting standards and<br />
foreign regulations, as well as higher return potential. Risk and return is typically high.<br />
Small-Cap Stock Funds — Small-cap funds contain stocks from companies with less than $2 billion in capitalization<br />
including many start up companies. Small companies can grow much faster than big companies, but small<br />
company stocks tend to be more volatile than the stocks of larger companies. Over the long term, an investor in<br />
small-cap stocks must be willing to accept a higher level of risk resulting from potentially higher market volatility.<br />
Mid-Cap Stock Funds — Mid-cap funds contain stocks from companies with market values between $2 billion and<br />
$10 billion and often include companies who are well established and growing. Risk and return is typically moderate<br />
to high.<br />
Large-Cap Stock Funds — A large-cap fund invests mostly in stocks of larger companies. Typically, large-cap<br />
stocks are companies with market values more than $10 billion and include blue-chip and Fortune 500 companies.<br />
They are typically more mature, diversified companies with many products and services. The goal of this type of<br />
fund is usually steady growth of capital. Risk and return is typically moderate to high.<br />
Balanced Funds — Balanced funds are funds that seek both income and capital appreciation by investing in a<br />
generally fixed combination of stocks and bonds. These funds generally hold a minimum of 25% of their assets in<br />
fixed-income securities at all times. Risk and return is typically moderate to low.<br />
Bond Funds — Bonds are loans or debt instruments issued by governments or corporations that need to raise<br />
money. When investors buy a bond, they are actually loaning money to the government or company, and therefore<br />
have the same interest rate, inflation and credit risks that are associated with the underlying bonds owned by<br />
the fund. Bonds are issued for a set period, during which interest payments are typically made to the bondholder.<br />
Bonds are generally a more conservative form of investment than stocks, and usually provide a more steady flow of<br />
income. Typically, bonds have a lower long-term total return than stocks.<br />
<strong>Investment</strong> <strong>Performance</strong><br />
<strong>Investment</strong> returns on the <strong>Investment</strong> <strong>Performance</strong> <strong>Report</strong> do not reflect the deduction of the historical<br />
administrative fee. The Board may suspend the administrative fee at their discretion. All reported mutual fund<br />
returns assume reinvestment of capital gains and dividends and reflect the fund's expense ratio. The <strong>Ohio</strong> DC<br />
Options are not mutual funds or registered investment companies.<br />
Administrative Fee<br />
An administrative fee of $2.00 per quarter was charged 1/1/2000 to 9/30/2006. The quarterly $2.00 administrative<br />
fee has been suspended since 10/1/2006 to present.<br />
NRX-0221OH.0912.22
