Annexes to the EIOPA Report on QIS5 - Eiopa - Europa
Annexes to the EIOPA Report on QIS5 - Eiopa - Europa
Annexes to the EIOPA Report on QIS5 - Eiopa - Europa

You also want an ePaper? Increase the reach of your titles
YUMPU automatically turns print PDFs into web optimized ePapers that Google loves.
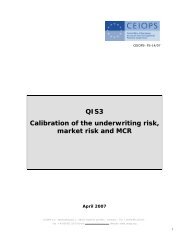
xSCR3: Structure of <str<strong>on</strong>g>the</str<strong>on</strong>g> life underwriting risk for composite firms<br />
160%<br />
140%<br />
120%<br />
100%<br />
80%<br />
60%<br />
40%<br />
20%<br />
Graph xSCR3: Life Underwriting Risk Compositi<strong>on</strong> - Composite Firms<br />
0%<br />
18%<br />
19%<br />
4%<br />
55%<br />
26%<br />
0%<br />
Page 18 of 29<br />
16%<br />
38%<br />
100%<br />
Mortality L<strong>on</strong>gevity Disability Lapse Expenses Revisi<strong>on</strong> CatastropheDiversificati<strong>on</strong> Net Life<br />
Underwriting<br />
Risk<br />
xSCR4: Compositi<strong>on</strong> of <str<strong>on</strong>g>the</str<strong>on</strong>g> life underwriting risk (% of net life underwriting risk)<br />
Life Firms<br />
Percentiles Weighted Standard<br />
10th 25th 50th 75th 90th Average deviati<strong>on</strong><br />
Mortality 5.06% 7.25% 12.39% 20.78% 29.13% 9.38% 13.94%<br />
L<strong>on</strong>gevity 0.67% 2.63% 9.42% 20.72% 33.33% 49.84% 20.56%<br />
Disability 1.35% 3.29% 5.67% 9.29% 14.59% 11.34% 7.98%<br />
Lapse 31.22% 45.72% 60.84% 75.38% 83.22% 51.52% 26.92%<br />
Expense 9.22% 13.70% 21.69% 36.63% 48.98% 22.39% 17.67%<br />
Revisi<strong>on</strong> 6.58% 6.58% 6.88% 7.29% 7.54% 2.90% 11.27%<br />
Cat 3.17% 5.62% 12.98% 23.98% 46.21% 9.40% 21.96%<br />
Diversificati<strong>on</strong> -48.11% -44.43% -35.14% -23.65% -16.99% -34.81% 13.65%<br />
Composites<br />
Percentiles Weighted Standard<br />
10th 25th 50th 75th 90th Average deviati<strong>on</strong><br />
Mortality 6.64% 10.27% 16.13% 21.10% 31.73% 18.89% 16.00%<br />
L<strong>on</strong>gevity 2.20% 3.51% 5.27% 11.56% 14.85% 24.34% 14.31%<br />
Disability 1.91% 2.98% 8.00% 12.83% 14.76% 9.71% 12.67%<br />
Lapse 20.10% 28.34% 56.00% 66.19% 74.23% 57.70% 23.77%<br />
Expense 14.77% 19.40% 30.81% 42.33% 48.02% 27.48% 16.27%<br />
Revisi<strong>on</strong> 0.73% 1.21% 3.90% 10.35% 23.53% 3.56% 9.36%<br />
Cat 4.54% 6.07% 12.14% 19.94% 33.05% 16.52% 13.18%<br />
Diversificati<strong>on</strong> -46.04% -41.98% -35.71% -30.43% -25.56% -37.94% 12.22%<br />
xSCR5: Compositi<strong>on</strong> of <str<strong>on</strong>g>the</str<strong>on</strong>g> health underwriting risk (% of net health underwriting<br />
risk)<br />
Percentiles Weighted Standard<br />
10th 25th 50th 75th 90th Average deviati<strong>on</strong><br />
Health SLT 22.45% 30.49% 70.60% 90.88% 96.55% 62.51% 35.21%<br />
Health N<strong>on</strong> SLT 50.30% 80.47% 97.33% 100.00% 100.00% 68.39% 23.64%<br />
Health Cat 4.55% 7.68% 12.48% 39.76% 68.56% 12.52% 27.72%<br />
Diversificati<strong>on</strong> -24.19% -18.61% -11.61% -6.23% -3.51% -9.16% 8.33%<br />
© <str<strong>on</strong>g>EIOPA</str<strong>on</strong>g> 2011