Diapositiva 1
Diapositiva 1
Diapositiva 1

Create successful ePaper yourself
Turn your PDF publications into a flip-book with our unique Google optimized e-Paper software.
PAML<br />
Phylogenetic Analysis by Maximum Likelihood<br />
Yang Z. Computational Molecular Evolution<br />
Yang Z. 2007<br />
PAML 4: Phylogenetic Analysis by Maximum Likelihood.<br />
Mol. Biol. Evol. 24, 1586-1591.<br />
Yang Z. and Bielawski J.P. 2000<br />
Statistical methods for detecting molecular adaptation.<br />
TREE 15, 496-503.<br />
http://abacus.gene.ucl.ac.uk/<br />
http://abacus.gene.ucl.ac.uk/ziheng/ziheng.html<br />
http://abacus.gene.ucl.ac.uk/software/paml.html<br />
Ziheng Yang
Adaptive Evolution<br />
• Most variation within or between species random fixation selectively neutral mutations.<br />
• Selectively deleterious purifying selection not tolerated.<br />
• Occasionally, mutations selective advantage positive selection (adaptive evolution) fixed in the<br />
population at a much higher rate.<br />
Why?<br />
• Can indicate which amino acid sites/domains are functionally important in a molecule<br />
• Interest in detecting whether most mutations are deleterious, advantageous or neutral<br />
• Identification of selected loci provide insight into the events that have shaped a species’ evolution & can<br />
indicate which genes have been particularly important in the evolution of a species.<br />
• By screening for selective signatures associated with immunity or disease susceptibility, we may be<br />
able to identify those genes that have been of critical importance to the development of disease<br />
resistance.
Amino Acid Sites Subject to Positive Selection in<br />
Mammalian a-Defensins<br />
Red: sites predicted to be under positive selection.<br />
Blue: sites that are 100% conserved across all OTUs.<br />
Lynn et al., MBE 2004.
• Widely used method to detect adaptive evolution accelerated rate of d N /d s<br />
– d N = nonsynonymous (protein changing) substitutions rates<br />
– d S = synonymous substitutions rates<br />
d N<br />
ω = dS<br />
ω < 1 → Nonsynonymous mutations are slightly deleterious<br />
ω = 1 → Amino acid changes selectively neutral<br />
ω > 1 → Amino acid changes selectively advantageous<br />
Statistical Methods to Detect Positive Selection<br />
Test whether dN is significantly higher than dS .<br />
Approximate methods<br />
→ Normal approximation applied to dN-dS .<br />
ML method<br />
→ Likelihood-ratio test.<br />
3a: test Z<br />
3b: confronto modelli con un likelihood ratio test<br />
(modello zero:=1)
Metodi di Maximum Likelihood<br />
• In PAML sfrutta le MCMC come metodo di esplorazione dello spazio dei<br />
parametri<br />
• Spazio dei parametri è infinito perché sono IGNOTI ed EQUIPROBABILI<br />
• La funzione di Likelihood verifica qual è il valore del parametro che massimizza<br />
la verosimiglianza con i dati.<br />
X→ dati<br />
θ→ parametro da stimare<br />
La probabilità di osservare i dati X può essere vista come<br />
una funzione del parametro ignoto θ dati i dati<br />
L(θ ;X) = f (θ |X)<br />
Il valore di θ che massimizza la likelihood è definito come<br />
Maximum Likelihood Estimate (MLE)
PAML → CODEML<br />
Models to detect positive selection acting on:<br />
• Particular branches/lineages of a phylogeny (branch models).<br />
• Particular codon (amino acid) sites (site-specific models).<br />
Test for adaptive evolution in the VHL (Von Hippel-Lindau ) gene<br />
• Dataset:<br />
• Objective:<br />
16 sequencies from different species<br />
Test for sites evolving under positive<br />
selection.<br />
Identify sites by using empirical Bayes
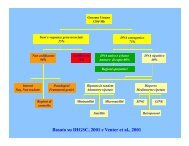
Site-specific models Allow ω vary among sites.<br />
H 0: uniform selective pressure among sites (M0)<br />
H 1: variable selective pressure among sites (M3)<br />
p p<br />
ω ω<br />
Likelihood ratio test (LRT)<br />
2Δl = 2 (l 1-l 0) χ 2 distribution<br />
SERVE PER VERIFICARE<br />
SE ω VARIA FRA I SITI.<br />
NON E’ CONSIDERATO UN<br />
TEST PER VERIFICARE LA<br />
PRESENZA/ASSENZA DI<br />
SELEZIONE
H 0: variable selective pressure but NO positive selection (M1a)<br />
H 1: variable selective pressure with positive selection (M2a)<br />
Likelihood ratio test (LRT)<br />
2Δl = 2 (l 1-l 0) χ 2 distribution<br />
SE:<br />
• IL MODELLO M2a SI<br />
ADATTA MEGLIO AI DATI<br />
• IL VALORE DI ω STIMATO<br />
E’ >1 PER LA CLASSE DI<br />
SITI p 2<br />
UNA PROPORZIONE<br />
DI SITI PARI A p2 E’<br />
SOTTOPOSTA A<br />
SELEZIONE<br />
POSITIVA
H 0: Beta distributed variable selective pressure (M7)<br />
H 1: Beta plus positive selection(M8)<br />
Likelihood ratio test (LRT)<br />
2Δl = 2 (l 1-l 0) χ 2 distribution<br />
SE:<br />
• IL MODELLO M8 SI ADATTA<br />
MEGLIO AI DATI<br />
• IL VALORE DI ω S STIMATO E’<br />
>1 PER LA CLASSE DI SITI<br />
p1<br />
UNA PROPORZIONE<br />
DI SITI PARI A p1 E’<br />
SOTTOPOSTA A<br />
SELEZIONE POSITIVA<br />
Quando i test suggeriscono la presenza di selezione positiva si utilizzano dei metodi Bayesiani<br />
(BEB) per calcolare la probabilità a posteriori che ciascun codone provenga dalla classe di<br />
siti sotto selezione positiva.
Branch-site models<br />
Allow ω vary among branches. Likelihood ratio test (LRT)<br />
• LRT based on χ 2 can be powerful<br />
2Δl = 2 (l 1-l 2) χ 2 distribution<br />
Alternative model (estimated ω 2>1)<br />
Null model (fixed ω 2=1)<br />
• Power is affected by (i) sequence divergence, (ii) number of lineages, and (iii) strength of positive selection<br />
• The most efficient way to increase power is to add lineages<br />
Anisimova, Bielawski, and Yang, 2001, Mol. Bio. Evol. 18:1585-1592.
Requirements for PAML Analysis<br />
• A coding DNA sequence alignment in PAML format.<br />
• A treefile in newick-like format.<br />
• codeml.ctl parameter file.<br />
• PAML installed on your machine!<br />
Searching DNA sequences<br />
Download of coding sequences from different species by querying databases such as:<br />
• UniProt (http://www.uniprot.org/)<br />
• NCBI Entrez Gene (http://www.ncbi.nlm.nih.gov/sites/entrez?db=gene)<br />
• Genome browser Ensembl (http://www.ensembl.org/).
1. Tradurre in proteine<br />
2. Allineare<br />
3. Esportare un file *.meg, e un file *.fas
Coding DNA sequence alignment in PAML format<br />
Number of sequences<br />
Length of alignment<br />
N.B.→ Remove TGA at the end of sequences
Treefile<br />
• Tree must be trifurcated NOT rooted.<br />
• The tree is likely to represent the true relationship among the species<br />
• NCBITaxonomy (http://www.ncbi.nlm.nih.gov/guide/taxonomy/ ).<br />
• Tree exported in *.phy.<br />
• Converted from rooted to unrooted as suggest the author with Retree tools of Phylip.<br />
MEGA4 - http://www.megasoftware.net/<br />
Phylip - http://evolution.genetics.washington.edu/phylip.html<br />
Abbreviazioni:<br />
PCA: Procavia capensis<br />
PVA: Pteropus vampyrus<br />
MLU: Myotis lucifugus<br />
BTA: Bos taurus<br />
SSC: Sus scrofa<br />
TTR: Tursiops truncatus<br />
FCA: Felis catus<br />
CFA: Canis familiaris<br />
STO: Spermophilus tridecemlineatus<br />
RNO: Rattus norvegicus<br />
MUS: Mus musculus<br />
OPR: Ochotona princeps<br />
PAB: Pongo abelii<br />
HOM: Homo sapiens<br />
GGO: Gorilla gorilla<br />
CJA: Callithrix jacchus
CODEML.ctl parameter file<br />
• Ziheng Yang: Computational Molecular Evolution<br />
• PAML User Guide<br />
k → transition/transversion rate ratio<br />
π → codon frequency<br />
• Yang Z, Nielsen R. Estimating synonymous and nonsynonymous substitution rates under realistic evolutionary<br />
models. Mol Biol Evol 2000; 17: 32-43<br />
• Yang Z. PAML 4: phylogenetic Analysis by Maximum Likelihood. Mol Biol Evol 2007; 24: 1586-1591<br />
• F EQUAL: each codon has the same frequency<br />
• F1X 4: codon frequency are expected from the<br />
frequencies of four nucleotides.<br />
• F3 X 4: codon frequencies are expected from 3<br />
sets of nucleotide frequencies for the three<br />
codon positions.<br />
• F61: all codon frequnecies as parameters
1. Create a directory to run analysis.<br />
2. Copy the codeml.ctl file, the “file.fas” and treefile “file.nwk” into this directory.<br />
3. To open command prompt in windows XP start Run type “cmd”<br />
4. Open folder: “cd” and folder path<br />
5. To run CODEML: “Codeml.exe”<br />
Running process…
Output Files<br />
Several different output files produced:<br />
• rst<br />
• Rst1<br />
• Rub<br />
• Lnf<br />
• 2NG.ds<br />
• 2NG.dn<br />
• 2NG.t<br />
• mlc → Main output file
Modello N°<br />
Parametri<br />
liberi<br />
k lnL Parametri stimati<br />
M0 1 2,86312 -2617,14 ω= 0,12877<br />
M1 2 2,99216 -2547,89 p0= 0,85808 ω0=0,04165<br />
(p1=0,14192) (ω1=1)<br />
M2 4 3,02129 -2547,47 p0=0,85768 ω0=0,04237<br />
p1=0,13527 (ω1=1)<br />
(p2=0,00705) ω2=2,70033<br />
M3 5 2,91362 -2538,98 p0=0,78851 ω0=0,02312<br />
p1=0,19543 ω1=0,47991<br />
(p2= 0,01606) ω2=2,20475<br />
M7 2 2,89921 -2543,01 p=0,14942 q=0,87349<br />
M8 4 2,9211 -2539,62 p=0,18576 q=1,38392<br />
p0=0,98448 (p1=0,01552) ω=2,21316<br />
Modelli testati 2∆ℓ df P-Value<br />
M0 vs M3 156,3233 4 8,98 * 10 -33<br />
M1 vs M2 0 2 0,6545<br />
M7 vs M8 6,782778 2 0,0336