

Gibbs Free Energy and Size-Temperature Phase Diagram of ...
Gibbs Free Energy and Size-Temperature Phase Diagram of ...
Gibbs Free Energy and Size-Temperature Phase Diagram of ...

You also want an ePaper? Increase the reach of your titles
YUMPU automatically turns print PDFs into web optimized ePapers that Google loves.
<strong>Gibbs</strong> <strong>Free</strong> <strong>Energy</strong> <strong>and</strong> <strong>Size</strong> <strong>Temperature</strong> <strong>Phase</strong> <strong>Diagram</strong><br />
<strong>of</strong> Hafnium Nanoparticles<br />
Shiyun Xiong, † Weihong Qi,* ,†,‡ Baiyun Huang, § Mingpu Wang, †,‡ <strong>and</strong> Lanying Wei †<br />
† School <strong>of</strong> Materials Science <strong>and</strong> Engineering, Central South University, Changsha, 410083, P.R. China<br />
‡ Key Laboratory <strong>of</strong> Non-ferrous Materials Science <strong>and</strong> Engineering, Ministry <strong>of</strong> Education, Changsha, 410083, P.R. China<br />
§ State Key Laboratory <strong>of</strong> Powder Metallurgy, Central South University, Changsha 410083, P.R. China<br />
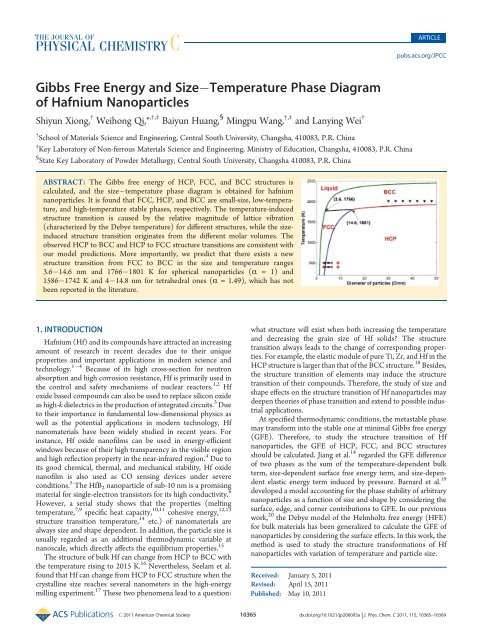
ABSTRACT: The <strong>Gibbs</strong> free energy <strong>of</strong> HCP, FCC, <strong>and</strong> BCC structures is<br />
calculated, <strong>and</strong> the size temperature phase diagram is obtained for hafnium<br />
nanoparticles. It is found that FCC, HCP, <strong>and</strong> BCC are small-size, low-temperature,<br />
<strong>and</strong> high-temperature stable phases, respectively. The temperature-induced<br />
structure transition is caused by the relative magnitude <strong>of</strong> lattice vibration<br />
(characterized by the Debye temperature) for different structures, while the sizeinduced<br />
structure transition originates from the different molar volumes. The<br />
observed HCP to BCC <strong>and</strong> HCP to FCC structure transitions are consistent with<br />
our model predictions. More importantly, we predict that there exists a new<br />
structure transition from FCC to BCC in the size <strong>and</strong> temperature ranges<br />
3.6 14.6 nm <strong>and</strong> 1766 1801 K for spherical nanoparticles (R = 1) <strong>and</strong><br />
1586 1742 K <strong>and</strong> 4 14.8 nm for tetrahedral ones (R = 1.49), which has not<br />
been reported in the literature.<br />
1. INTRODUCTION<br />
Hafnium (Hf) <strong>and</strong> its compounds have attracted an increasing<br />
amount <strong>of</strong> research in recent decades due to their unique<br />
properties <strong>and</strong> important applications in modern science <strong>and</strong><br />
technology. 1 4 Because <strong>of</strong> its high cross-section for neutron<br />
absorption <strong>and</strong> high corrosion resistance, Hf is primarily used in<br />
the control <strong>and</strong> safety mechanisms <strong>of</strong> nuclear reactors. 1,2 Hf<br />
oxide based compounds can also be used to replace silicon oxide<br />
as high-k dielectrics in the production <strong>of</strong> integrated circuits. 3 Due<br />
to their importance in fundamental low-dimensional physics as<br />
well as the potential applications in modern technology, Hf<br />
nanomaterials have been widely studied in recent years. For<br />
instance, Hf oxide nan<strong>of</strong>ilms can be used in energy-efficient<br />
windows because <strong>of</strong> their high transparency in the visible region<br />
<strong>and</strong> high reflection property in the near-infrared region. 4 Due to<br />
its good chemical, thermal, <strong>and</strong> mechanical stability, Hf oxide<br />
nan<strong>of</strong>ilm is also used as CO sensing devices under severe<br />
conditions. 5 The HfB2 nanoparticle <strong>of</strong> sub-10 nm is a promising<br />
material for single-electron transistors for its high conductivity. 6<br />
However, a serial study shows that the properties (melting<br />
temperature, 7,9 specific heat capacity, 10,11 cohesive energy, 12,13<br />
structure transition temperature, 14 etc.) <strong>of</strong> nanomaterials are<br />
always size <strong>and</strong> shape dependent. In addition, the particle size is<br />
usually regarded as an additional thermodynamic variable at<br />
nanoscale, which directly affects the equilibrium properties. 15<br />
The structure <strong>of</strong> bulk Hf can change from HCP to BCC with<br />
the temperature rising to 2015 K. 16 Nevertheless, Seelam et al.<br />
found that Hf can change from HCP to FCC structure when the<br />
crystalline size reaches several nanometers in the high-energy<br />
milling experiment. 17 These two phenomena lead to a question:<br />
Received: January 5, 2011<br />
Revised: April 15, 2011<br />
Published: May 10, 2011<br />
ARTICLE<br />
pubs.acs.org/JPCC<br />
what structure will exist when both increasing the temperature<br />
<strong>and</strong> decreasing the grain size <strong>of</strong> Hf solids? The structure<br />
transition always leads to the change <strong>of</strong> corresponding properties.<br />
For example, the elastic module <strong>of</strong> pure Ti, Zr, <strong>and</strong> Hf in the<br />
HCP structure is larger than that <strong>of</strong> the BCC structure. 18 Besides,<br />
the structure transition <strong>of</strong> elements may induce the structure<br />
transition <strong>of</strong> their compounds. Therefore, the study <strong>of</strong> size <strong>and</strong><br />
shape effects on the structure transition <strong>of</strong> Hf nanoparticles may<br />
deepen theories <strong>of</strong> phase transition <strong>and</strong> extend to possible industrial<br />
applications.<br />
At specified thermodynamic conditions, the metastable phase<br />
may transform into the stable one at minimal <strong>Gibbs</strong> free energy<br />
(GFE). Therefore, to study the structure transition <strong>of</strong> Hf<br />
nanoparticles, the GFE <strong>of</strong> HCP, FCC, <strong>and</strong> BCC structures<br />
should be calculated. Jiang et al. 14 regarded the GFE difference<br />
<strong>of</strong> two phases as the sum <strong>of</strong> the temperature-dependent bulk<br />
term, size-dependent surface free energy term, <strong>and</strong> size-dependent<br />
elastic energy term induced by pressure. Barnard et al. 19<br />
developed a model accounting for the phase stability <strong>of</strong> arbitrary<br />
nanoparticles as a function <strong>of</strong> size <strong>and</strong> shape by considering the<br />
surface, edge, <strong>and</strong> corner contributions to GFE. In our previous<br />
work, 20 the Debye model <strong>of</strong> the Helmholtz free energy (HFE)<br />
for bulk materials has been generalized to calculate the GFE <strong>of</strong><br />
nanoparticles by considering the surface effects. In this work, the<br />
method is used to study the structure transformations <strong>of</strong> Hf<br />
nanoparticles with variation <strong>of</strong> temperature <strong>and</strong> particle size.<br />
r 2011 American Chemical Society 10365 dx.doi.org/10.1021/jp200093a | J. Phys. Chem. C 2011, 115, 10365–10369
The Journal <strong>of</strong> Physical Chemistry C ARTICLE<br />
2. MODEL<br />
For bulk materials, the Helmholtz free energy Fb in the Debye<br />
model is defined as 21<br />
Fb ¼ Eb þ 3RT lnð1 e Θ=T Þ RTBðΘ=TÞ ð1Þ<br />
in which Eb, R, <strong>and</strong> Θ are the bulk cohesive energy, gas constant,<br />
<strong>and</strong> Debye temperature, respectively. B(Θ/T)=3(T/Θ) 3R 0 Θ/T -<br />
((x 3 )/(e x<br />
1))dx is the Debye function. To calculate the HFE <strong>of</strong><br />
nanoparticles, one has to consider the surface effect <strong>of</strong> nanoparticles<br />
for their large surface to volume ratio affects their thermodynamic<br />
properties greatly. The relationship <strong>of</strong> vibrational<br />
amplitude (x) <strong>and</strong> frequency (ω) between surface atoms (denoted<br />
with subscript s) <strong>and</strong> bulk atoms (denoted with subscript b) for<br />
metal elements is expressed as 8 xs/xb =1.43,ωs/ωb = 0.404.<br />
Regarding the lattice vibration as a spring oscillator, the energy <strong>of</strong><br />
one atom is directly proportional to the square <strong>of</strong> its amplitude.<br />
Then the vibrational lattice energy <strong>of</strong> a surface atom can be written<br />
s<br />
as ED(V,T) =(xs/xb) 2 ED(V,T) =6kBTB(Θ/T). In terms <strong>of</strong> the<br />
view <strong>of</strong> statistic mechanics, when the vibrational frequency <strong>of</strong> an<br />
atom changes from ωb to ωs, the vibrational entropy changes<br />
ΔSD =3kBln(ωb/ωs)=2.71kb. Combining this with the relation<br />
n/N =4Rd/D (n represents the number <strong>of</strong> surface atoms, N the<br />
number <strong>of</strong> total atoms, <strong>and</strong> R the shape factor; 13 d <strong>and</strong> D are the<br />
diameter <strong>of</strong> the atoms <strong>and</strong> nanoparticles, respectively), the mole<br />
HFE <strong>of</strong> nanoparticles Fp can be rewritten as (see details in ref 20)<br />
Fp ¼ Ep þ 3RT ln 1 e Θ=T<br />
RTBðΘ=TÞ<br />
þ 4Rd<br />
RTð3BðΘ=TÞ 2:71Þ ð2Þ<br />
D<br />
where Ep = Eb(1 3Rd/D) represents the size- <strong>and</strong> shapedependent<br />
cohesive energy <strong>of</strong> the nanoparticles. 13 The Debye<br />
temperature <strong>of</strong> nanoparticles (related with corresponding bulk<br />
value Θb) can be expressed as 20 Θ = Θb(1 3Rd/D). Compared<br />
with the expression <strong>of</strong> bulk HFE, there is an additional size- <strong>and</strong><br />
shape-dependent term for nanoparticles, which is caused by the<br />
different vibrational states <strong>of</strong> surface atoms. 20 With the obtained<br />
HFE, the GFE <strong>of</strong> nanoparticles can be easily obtained as follows<br />
G ¼ F þ PVm<br />
ð3Þ<br />
where P <strong>and</strong> Vm represent the pressure <strong>and</strong> molar volume,<br />
respectively. For bulk material, if there is no additional pressure,<br />
P equals one atmospheric pressure which can be ignored. However,<br />
for nanomaterial, the pressure varies with particle size in<br />
terms <strong>of</strong> the Laplace Young equation P= 4f/D, where the<br />
minus symbol means the pressure is from core to shell. 17 The<br />
surface stress <strong>of</strong> the solid has adopted the value at the isoentropic<br />
temperature Tk with ∂gm(T)/∂T = 0 in the expression 20,22 f =<br />
[((7)/(2(Tmb/T þ 6)))(D0dSvibHm/(kRVm)) 1/2 ] 1/2 ,whereSm,<br />
Hm, <strong>and</strong>kare the bulk values <strong>of</strong> the melting entropy, melting<br />
enthalpy <strong>and</strong> compressibility, respectively, D0 =3d for nanoparticles.<br />
gm(T) = 7Hm(Tbm T)T/[Tbm(Tbm þ 6T)] is the<br />
temperature-dependent solid liquid GFE difference. According<br />
to the above discussion, the surface stress can be obtained as<br />
f = 0.63(d 2 SmHm/(kRVm)) 1/2 . Considering the melting behavior<br />
at high temperature, there is a liquid phase besides the three<br />
structures, <strong>and</strong> the liquidus temperature is determined by 13<br />
Tpm ¼ Tbmð1 3Rd=DÞ ð4Þ<br />
Figure 1. <strong>Temperature</strong>-dependent <strong>Gibbs</strong> free energy <strong>of</strong> bulk Hf with<br />
HCP, BCC, <strong>and</strong> FCC structures. The bulk cohesive energy Eb hcp = 947<br />
kJ/mol, Eb fcc = 940 kJ/mol, <strong>and</strong> Eb bcc = 930 kJ/mol are taken from ref<br />
23 with calculation <strong>of</strong> first principles, which was performed at 0 K using<br />
the projector augmented-wave method within the generalized gradient<br />
approximation; the bulk Debye temperature Θb hcp = 221 K, Θb fcc = 194 K,<br />
Θb bcc = 154 K are taken from ref 24; they are calculated by first-principles<br />
pseudopotential plane-wave code based on density functional theory<br />
<strong>and</strong> the conjugate gradients algorithm.<br />
where T bm is the melting temperature <strong>of</strong> the corresponding bulk<br />
materials. Combining with eqs 2 <strong>and</strong> 3, the GFE <strong>of</strong> nanoparticles<br />
can be calculated.<br />
3. RESULTS AND DISCUSSION<br />
In order to test the efficacy <strong>of</strong> the model, the GFE <strong>of</strong> bulk Hf<br />
with HCP, BCC, <strong>and</strong> FCC structures are calculated <strong>and</strong> the HCP<br />
to BCC transformation temperature is predicted. Figure 1 plots<br />
the <strong>Gibbs</strong> free energy as a function <strong>of</strong> temperature for bulk Hf<br />
with HCP, BCC, <strong>and</strong> FCC structures in terms <strong>of</strong> eq 1. The GFE<br />
<strong>of</strong> the three structures decreases with the increase <strong>of</strong> temperature.<br />
Among the three structures, the relative magnitude <strong>of</strong> the<br />
entropy S (absolute value <strong>of</strong> the slope for GFE changes with<br />
temperature) satisfies S bcc > S fcc > S hcp. According to eq 1, there<br />
are two variable parameters for different structures, i.e., the<br />
cohesive energy <strong>and</strong> Debye temperature, where the cohesive<br />
energy determines the GFE intercept at 0 K <strong>and</strong> has no effect on<br />
the entropy. Thus, the entropy is only determined by the Debye<br />
temperature <strong>of</strong> different structures. This can be also examined<br />
from the expression <strong>of</strong> entropy 20 (there is only vibrational entropy<br />
for elementary metals), S =4kB[B(Θ/T) (3/4) ln(1<br />
e Θ/T )], where Θ is the only parameter in calculation <strong>of</strong><br />
the entropy. Therefore, the structure transition (temperature<br />
induced) is determined by lattice vibration (characterized by<br />
Debye temperature). As shown in Figure 1, the most stable<br />
structure is HCP below 1955 K <strong>and</strong> changes to BCC when the<br />
temperature is higher than 1955 K, which is very close to the<br />
experimental transition results 2015 K. 16 Therefore, the present<br />
model is reliable in describing the structure transition <strong>of</strong> Hf.<br />
Figure 2 shows the GFE difference (ΔG) <strong>of</strong> Hf nanoparticles<br />
between two structures varying with particle size <strong>and</strong> temperature.<br />
The GFE difference, between BCC <strong>and</strong> HCP (BCC-HCP)<br />
or between FCC <strong>and</strong> HCP (FCC-HCP), decreases with the<br />
10366 dx.doi.org/10.1021/jp200093a |J. Phys. Chem. C 2011, 115, 10365–10369
The Journal <strong>of</strong> Physical Chemistry C ARTICLE<br />
Figure 2. GFE difference between (a) HCP <strong>and</strong> BCC, (b) HCP <strong>and</strong><br />
FCC, <strong>and</strong> (c) BCC <strong>and</strong> FCC as a function <strong>of</strong> temperature <strong>and</strong> particle<br />
size (spherical shape). The planes represent ΔG = 0, <strong>and</strong> the curves in<br />
the X Y plane denote the contour lines <strong>of</strong> ΔG. Vm hcp =13.4 10 6 m 3 , 17<br />
Vm fcc = 14.3 10 6 m 3 , 17 <strong>and</strong> Vm bcc = 13.5 10 6 m 325 are experimental<br />
values. As with the Debye temperature, all values for the atomic diameter<br />
<strong>and</strong> Yang’s module are from ref 24 with the first-principle calculation<br />
d hcp = 3.49 Å, d fcc = 3.56 Å, d bcc = 3.51 Å; B hcp = 1.22 Mbar, B fcc = 1.123<br />
Mbar, B bcc = 1.176 Mbar (the compressibility <strong>of</strong> materials k is calculated<br />
from Yang’s module with the relation k =1/B); S m = 10.175 J/<br />
(mol 3 K), 26 Hm = 25.5 kJ/mol. 26<br />
increase <strong>of</strong> temperature for a specified size <strong>and</strong> decreases with<br />
the decrease <strong>of</strong> particle size at fixed temperature. The change<br />
<strong>of</strong> ΔG with D in small sizes is more distinct than that in large<br />
sizes. However, for the GFE difference between FCC <strong>and</strong> BCC<br />
Figure 3. Variation <strong>of</strong> the <strong>Gibbs</strong> free energy <strong>of</strong> spherical Hf nanoparticles<br />
(8 <strong>and</strong> 40 nm) with temperature for HCP, FCC, <strong>and</strong> BCC<br />
structures. GFE curves for particles <strong>of</strong> 8 nm refer to the left-bottom<br />
coordinates, while particles <strong>of</strong> 40 nm correspond to the right-top<br />
coordinates.<br />
(FCC BCC), ΔG nearly remains unchanged with the variation<br />
<strong>of</strong> particle size with the absence <strong>of</strong> a change in temperature. This<br />
can be observed more clearly from the contour lines, where all<br />
contour lines for FCC BCC are nearly parallel with the size<br />
axis, indicating that the variation <strong>of</strong> GFE with particle size for<br />
both FCC <strong>and</strong> BCC structures is the same. The planes in the<br />
figures denote that the GFE difference is zero, <strong>and</strong> the intersection<br />
lines indicate the critical size <strong>of</strong> structure transformation as a<br />
function <strong>of</strong> temperature.<br />
Figure 3 represents the GFE as a function <strong>of</strong> temperature for<br />
HCP, FCC, <strong>and</strong> BCC structures with specified sizes. Similar to<br />
bulk, the GFE decreases with the increase <strong>of</strong> temperature <strong>and</strong> the<br />
entropy for the three structures satisfies Sbcc > Sfcc > Shcp. The<br />
temperature-dependent structure transition in nanometers is<br />
determined by lattice vibration (characterized by the Debye<br />
temperature), which is the same as the bulk materials. When<br />
T < 1903 K, the most stable phase is the HCP structure for particles<br />
<strong>of</strong> 40 nm, which can be concluded from the relative magnitude<br />
GFE <strong>of</strong> the three structures. When T = 1903 K, the relationship<br />
<strong>of</strong> GFE among the three structures satisfies Gbcc= Ghcp
The Journal <strong>of</strong> Physical Chemistry C ARTICLE<br />
Figure 4. <strong>Size</strong>-dependent <strong>Gibbs</strong> free energy <strong>of</strong> HCP, FCC, <strong>and</strong> BCC<br />
structures at 1000 <strong>and</strong> 2300 K (spherical nanoparticles). GFE curves at<br />
2300 K refer to the left-bottom coordinates, while they correspond to<br />
the right-top coordinates for GFE curves at 1000 K.<br />
high-temperature stable phase, FCC is the small-size stable<br />
phase, <strong>and</strong> HCP is the low-temperature stable phase.<br />
The variation <strong>of</strong> the GFE with particle size at 1000 <strong>and</strong> 2300 K<br />
for HCP, FCC, <strong>and</strong> BCC structures is shown in Figure 4. Note<br />
that GFE curves at 2300 K refer to the left-bottom coordinates,<br />
while GFE curves at 1000 K correspond to the right-top<br />
coordinates. The GFE <strong>of</strong> the BCC structure holds the largest<br />
in all size ranges at 1000 K, showing that the BCC structure is the<br />
most unstable phase at this temperature. According to GFE<br />
curves at 1000 K, the stable phase is the FCC structure when D <<br />
5.1 nm <strong>and</strong> it turns to the HCP structure when D > 5.1 nm; thus,<br />
D = 5.1 nm is the critical size for the possible HCP to FCC<br />
structure transition. Contrary to the case at 1000 K, the GFE <strong>of</strong><br />
the BCC structure is the lowest at 2300 K in all size ranges,<br />
indicating that it is the most stable structure at 2300 K <strong>and</strong> the<br />
structure transition will not take place among the three structures.<br />
From section 2, we know that the effect <strong>of</strong> the Debye<br />
temperature on the GFE is fixed at a specified temperature, so the<br />
structure transition is induced by the size-dependent internal<br />
pressure term 4fVm/D. The calculated values <strong>of</strong> the surface<br />
tension for the three structures are nearly the same, <strong>and</strong> the only<br />
difference in 4fVm/D is their different molar volumes (the<br />
molar volume <strong>of</strong> HCP, FCC, <strong>and</strong> BCC is different). Therefore, at<br />
a specified temperature, the structure transformation is only<br />
induced by the different molar volumes <strong>of</strong> the three structures.<br />
From Figures 1, 3, <strong>and</strong> 4 it is found that the crossing points<br />
for structure transitions are very shallow (the GFE difference<br />
between the two structures is small around the crossing points),<br />
indicating that the kinetics may dominate the structure transitions.<br />
In general, the energy fluctuation <strong>of</strong> the system is very large<br />
around the critical point, 27 which may enlarge the temperature<br />
range <strong>of</strong> the structure transition. For example, the HCP to BCC<br />
structure transition <strong>of</strong> particles (40 nm) in Figure 3 should take<br />
place at 1903 K; however, because <strong>of</strong> the small GFE difference<br />
between HCP <strong>and</strong> BCC around 1903 K, the energy <strong>of</strong> fluctuation<br />
may be larger than the energy barrier <strong>of</strong> the HCP to BCC<br />
structure transition. Therefore, this transition may take place<br />
before 1903 K. On the contrary, the transition may also take place<br />
after 1903 K due to energy fluctuation. As a result, the HCP <strong>and</strong><br />
Figure 5. <strong>Phase</strong> diagram <strong>of</strong> Hf nanoparticles (R = 1 <strong>and</strong> 1.49) with the<br />
variation <strong>of</strong> particle size <strong>and</strong> temperature. The solid triangles denote the<br />
HCP to BCC transition temperature at the bulk state, 16 <strong>and</strong> the values<br />
denoted by solid squares are the experimental critical size <strong>of</strong> the HCP to<br />
FCC transition. 17 The symbols <strong>of</strong> solid <strong>and</strong> open circles are experimental<br />
values for FCC <strong>and</strong> HCP structures, respectively. 28 (Note that<br />
the experiments are finished at room temperature; however, the local<br />
temperature will increase (no more than) 200 °C during the high-energy<br />
milling process. 29,30 The experimental values are assumed that there are<br />
100 <strong>and</strong> 200 °C increases for the local temperatures, respectively.)<br />
BCC structure may coexist in a certain temperature range around<br />
the structure transition temperature, <strong>and</strong> the transition temperature<br />
predicted by the present model can be regarded as the most<br />
possible phase transition temperature.<br />
The present model is for the phase transitions <strong>of</strong> nanoparticles;<br />
however, we have not found available experimental data to<br />
test our predictions. Fortunately, the HCP to FCC transition <strong>of</strong><br />
Hf nanocrystalline has been reported at room temperature, 17 <strong>and</strong><br />
the transition is believed to be caused by interface effects. The<br />
interface effects on nanocrystallines originate from the variation<br />
<strong>of</strong> bonds at interface, while the surface effects on nanoparticles is<br />
also from the variation <strong>of</strong> bonds at the surface (characterized by<br />
the present model). As a comparison, we insert the experimental<br />
values <strong>of</strong> HCP to FCC transition <strong>of</strong> Hf nanocrystalline into<br />
Figure 5. However, the critical size <strong>of</strong> the HCP to FCC transformation<br />
for nanocrystallines is smaller than that <strong>of</strong> nanoparticles<br />
at the same temperature. This is because the number <strong>of</strong> dangling<br />
bonds for nanocrystalline is less than that <strong>of</strong> free nanoparticles <strong>of</strong><br />
the same size. Although the abnormal structure transition from<br />
HCP to FCC for Hf nanocrystalline was reported, 17 the real<br />
nature <strong>of</strong> this transformation is questionable. 28 It is believed that<br />
the new FCC phase is stabilized by interstitial impurities introduced<br />
during milling. To validate the idea, two different milling<br />
conditions were introduced in ref 28: one is in regular conditions<br />
<strong>and</strong> the other in the ultra-high-purity environment. It is found<br />
that there existed a HCP to FCC phase transformation under<br />
regular conditions, while no such transformations were noted<br />
during milling under ultra-high-purity conditions. However, the<br />
crystallite size reached a minimum <strong>of</strong> 9 nm during ultra-highpurity<br />
milling, whereas it is 3 nm when milled under regular<br />
conditions. Thus, it cannot be concluded that the transformation<br />
from HCP to FCC is not a true allotropic transformation because<br />
the crystallite size in ultra-high-purity milling may not reach the<br />
critical size for the transformation.<br />
10368 dx.doi.org/10.1021/jp200093a |J. Phys. Chem. C 2011, 115, 10365–10369
The Journal <strong>of</strong> Physical Chemistry C ARTICLE<br />
Figure 5 shows the size temperature phase diagram <strong>of</strong> Hf<br />
nanoparticles with different shapes (R = 1 for spherical shapes,<br />
<strong>and</strong> R = 1.49 for tetrahedral ones) in terms <strong>of</strong> the GFE minimum.<br />
As a comparison, available experimental results are also inserted.<br />
Including the liquid phase (the liquidus lines are estimated by<br />
eq 4), there are four single-phase regions <strong>and</strong> two triple points for<br />
specified shapes. For spherical shape, the two triple points are<br />
3.6 nm, 1766 K for liquid, BCC, <strong>and</strong> FCC structures <strong>and</strong> 14.6 nm,<br />
1801 K for HCP, BCC, <strong>and</strong> FCC structures. In addition, for the<br />
tetrahedral shape, the two triple points become 4 nm, 1586 K <strong>and</strong><br />
14.8 nm, 1742 K, respectively. Apparently, the three structures<br />
can transfer into each other with the variation <strong>of</strong> temperature <strong>and</strong><br />
particle size. For instance, spherical particles (R = 1) with a<br />
diameter <strong>of</strong> 10 nm will change from HCP to FCC first when the<br />
temperature increases to ∼1500 K <strong>and</strong> then change to the BCC<br />
structure at ∼1750 K before melting. With the increase <strong>of</strong> shape<br />
factor, the structure transition temperature will decrease at a<br />
specified particle size. In addition, the critical sizes will increase<br />
at specified temperatures. However, the shape effects on the<br />
temperature <strong>and</strong> size <strong>of</strong> the structure transition are not distinct.<br />
From Figure 5 it is found that besides the HCP to BCC <strong>and</strong> HCP<br />
to FCC transitions, there exists an unreported structure transformation<br />
from FCC to BCC in the temperature <strong>and</strong> size regions<br />
1766 1801 K, 3.6 14.6 nm for R = 1 <strong>and</strong> 1586 1742 K,<br />
4 14.8 nm for R = 1.49. Since the transition has not been reported<br />
yet, further experiments should be performed to test the present<br />
prediction. The transition temperature from HCP to BCC (or<br />
FCC to BCC) decreases slightly with the decrease <strong>of</strong> particle size.<br />
Nevertheless, the transition temperature <strong>of</strong> HCP to FCC decreases<br />
quickly with a little decrease <strong>of</strong> particle size. Clearly, FCC is the<br />
small-size stable structure, while BCC <strong>and</strong> HCP are high-temperature<br />
<strong>and</strong> low-temperature stable structures, respectively. Since<br />
HCP may change to BCC or FCC when increasing temperature<br />
before melting, it will keep solid state in all size ranges.<br />
’ CONCLUSIONS<br />
On the basis <strong>of</strong> the generalized Debye model, the <strong>Gibbs</strong> free<br />
energies <strong>of</strong> HCP, FCC, <strong>and</strong> BCC structures <strong>of</strong> Hf nanoparticles<br />
are calculated <strong>and</strong> the size-temperature phase diagram is obtained<br />
with energy minimization principle. It is found that FCC, HCP, <strong>and</strong><br />
BCC are small-size, low-temperature, <strong>and</strong> high-temperature stable<br />
phases, respectively. The three structures can transform to each<br />
other at certain temperatures <strong>and</strong> sizes. The temperature-induced<br />
structure transition is caused by the relative magnitude <strong>of</strong> the lattice<br />
vibration (characterized by the Debye temperature), while the sizeinduced<br />
structure transition originates from the different molar<br />
volumes. Besides HCP to BCC <strong>and</strong> HCP to FCC structure<br />
transitions, we predict a new structure transition from FCC to<br />
BCC in the size <strong>and</strong> temperature ranges <strong>of</strong> 3.6 14.6 nm,<br />
1766 1801 K for R = 1 <strong>and</strong> 1586 1742 K, 4 14.8 nm for R =<br />
1.49, which will be tested by further experiments.<br />
’ AUTHOR INFORMATION<br />
Corresponding Author<br />
*Phone: þ86-152-7491-1370. E-mail: qiwh216@mail.csu.edu.cn.<br />
’ ACKNOWLEDGMENT<br />
This work was supported by the Program for New Century<br />
Excellent Talents in University (No. NCET-08-0574), Yuyin<br />
Program for Young Talents <strong>of</strong> Central South University, China<br />
Postdoctoral Science Foundation (No. 200801344), Hunan<br />
Provincial Natural Science Foundation <strong>of</strong> China (No. 09JJ3106),<br />
<strong>and</strong> Aid program for Science <strong>and</strong> Technology Innovative Research<br />
Team in Higher Educational Institutions <strong>of</strong> Hunan Province.<br />
’ REFERENCES<br />
(1) Cramer, S. D.; Covino, B. S. ASM h<strong>and</strong>book, 10 th ed.; ASM<br />
International: Metals Park, OH, 2005.<br />
(2) Levy, O.; Hart, G. L. W.; Curtarolo, S. Acta Mater. 2010,<br />
58, 2887.<br />
(3) Wilk, G. D.; Wallace, R. M.; Anthony, J. M. J. Appl. Phys. 2001,<br />
89, 5243.<br />
(4) Al-Kuhaili, M. F. Opt. Mater. 2004, 27, 383.<br />
(5) Durrani, S. M. A. Sensors Actuators, B: Chem. 2007, 120, 700.<br />
(6) Ye, W.; Martin, P. A. P.; Kumar, N.; Daly, S. R.; Rockett, A. A.;<br />
Abelson, J. R.; Girolami, G. S.; Lyding, J. W. ACS Nano 2010, 4, 6818.<br />
(7) Buffat, Ph.; Borel, J. P. Phys. Rev. A 1976, 13, 2287.<br />
(8) Sun, C. Q. Prog. Solid State Chem. 2007, 35, 1.<br />
(9) Liang, L. H.; Liu, D.; Jiang, Q. Nanotechnology 2003, 14, 438.<br />
(10) Rupp, J.; Birringer, R. Phys. Rev. B 1987, 36, 7888.<br />
(11) Ouyang, G.; Zhu, W. G.; Yang, G. W.; Zhu, Z. M. J. Phys. Chem.<br />
C 2010, 114, 4929.<br />
(12) Jiang, Q.; Li, J. C.; Chi, B. Q. Chem. Phys. Lett. 2002, 336, 551.<br />
(13) Qi, W. H.; Wang, M. P. Mater. Chem. Phys. 2004, 88, 280.<br />
(14) Jiang, Q.; Li, S. J. Comput. Theor. Nanosci. 2008, 5, 1.<br />
(15) Hill, T. L. Thermodynamics <strong>of</strong> Small Systems; WA Benjamin:<br />
New York, 1963.<br />
(16) Trampenau, J.; Heiming, A.; Petry, W.; Alba, M.; Herzig, C.;<br />
Miekeley, W.; Schober, H. R. Phys. Rev. B 1991, 43, 10963.<br />
(17) Seelam, U. M. R.; Suryanarayana, C. J. Appl. Phys. 2009,<br />
105, 063524.<br />
(18) Fisher, E. S.; Renken, C. J. Phys. Rev. A 1964, 135, 482.<br />
(19) Barnard, A. S.; Zapol, P. J. Chem. Phys. 2004, 121, 4276.<br />
(20) Xiong, S. Y.; Qi, W. H.; Huang, B. Y.; Wang, M. P.; Li, Y. J.<br />
Mater. Chem. Phys. 2010, 120, 446.<br />
(21) L<strong>and</strong>au, L. A.; Lifshitz, E. M. Statistical physics; Pergamon Press:<br />
Oxford, 1958.<br />
(22) Jiang, Q.; Liang, L. H.; Zhao, D. S. J. Phys. Chem. B 2001,<br />
105, 6275.<br />
(23) Wang, Y.; Curtarolo, S.; Jiang, C.; Arroyave, R.; Wang, T.;<br />
Ceder, G.; Chen, L. Q.; Liu, Z. K. CALPHAD 2004, 28, 79.<br />
(24) Chen, Q.; Sundman, B. Acta Mater. 2001, 49, 947.<br />
(25) Ostanin, S. A.; Trubitsin, V. Yu. Comput. Mater. Sci. 2000,<br />
17, 174.<br />
(26) Schumm, R. H.; Wagman, D. D.; Bailey, S.; Evans, W. H.;<br />
Parker, V. B. National Bureau <strong>of</strong> St<strong>and</strong>ards (USA) Technical Notes 270-1<br />
to 270-8; U. S. Government Printing Office, Washington, D. C. 1973;<br />
www.webelements.com.<br />
(27) Qi, W. H.; Lee, S. T. J. Phys. Chem. C 2010, 114, 9580.<br />
(28) Seelam, U. M. R.; Gagik, B.; Challapalli, S. J. Mater. Res. 2009,<br />
24, 3454.<br />
(29) Suryanarayana, C. Prog. Mater. Sci. 2001, 46, 1.<br />
(30) Koch, C. C. Int. J. Mechanochem. Mech. Alloying 1994, 1, 56.<br />
10369 dx.doi.org/10.1021/jp200093a |J. Phys. Chem. C 2011, 115, 10365–10369