a study on salt intrusion in arno river
a study on salt intrusion in arno river
a study on salt intrusion in arno river

Create successful ePaper yourself
Turn your PDF publications into a flip-book with our unique Google optimized e-Paper software.
TECNOLOGÍA DE LA INTRUSIÓN DE AGUA DE MAR EN ACUÍFEROS COSTEROS: PAÍSES MEDITERRÁNEOS<br />
©IGME. Madrid 2003. ISBN. 84-7840-470-8<br />
A STUDY ON SALT INTRUSION IN ARNO RIVER BED AND SURROUNDING PLAIN IN<br />
TUSCANY COASTAL AREA, CENTRAL ITALY.<br />
ABSTRACT<br />
The Arno <strong>river</strong>, with a 242 km overall extent, represents<br />
<strong>on</strong>e of the chief watercourses of Central Italy. On<br />
the basis of previous researches, which po<strong>in</strong>ted out a<br />
sea-water <strong>in</strong>trusi<strong>on</strong> around the mouth, a detailed sampl<strong>in</strong>g<br />
activity and geochemical analysis of the last 40<br />
Km of <strong>river</strong>course and surround<strong>in</strong>g watertable have<br />
been carried out between June and November 2000.<br />
Analytical results have been <strong>in</strong>terpretated with geochemical<br />
and hydrogeological pr<strong>in</strong>ciples; they have po<strong>in</strong>ted<br />
out a str<strong>on</strong>g and widespread water sal<strong>in</strong>isati<strong>on</strong> of <strong>river</strong><br />
course, whose last 20 km turn out to be polluted <strong>in</strong><br />
decreas<strong>in</strong>g way from estuary backwards; this phenomen<strong>on</strong><br />
is supported by Arno-bed peculiar l<strong>on</strong>gitud<strong>in</strong>al secti<strong>on</strong>,<br />
which lies under sea level for all last 27 km of<br />
watercourse. Sea <strong>in</strong>trusi<strong>on</strong> seems to spread weakly over<br />
the surround<strong>in</strong>g fluvial pla<strong>in</strong>, where <strong>on</strong>ly few and isolated<br />
wells show c<strong>on</strong>tam<strong>in</strong>ati<strong>on</strong>, particularly near the cost<br />
and al<strong>on</strong>g <strong>river</strong>sides.<br />
Key Words: Salt water <strong>in</strong>trusi<strong>on</strong>, Arno River, sampl<strong>in</strong>g<br />
activity, Tuscany Coastal Area geochemical.<br />
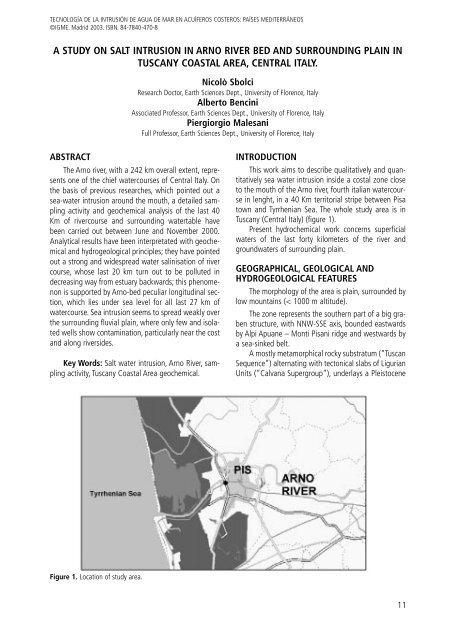
Figure 1. Locati<strong>on</strong> of <str<strong>on</strong>g>study</str<strong>on</strong>g> area.<br />
Nicolò Sbolci<br />
Research Doctor, Earth Sciences Dept., University of Florence, Italy<br />
Alberto Benc<strong>in</strong>i<br />
Associated Professor, Earth Sciences Dept., University of Florence, Italy<br />
Piergiorgio Malesani<br />
Full Professor, Earth Sciences Dept., University of Florence, Italy<br />
INTRODUCTION<br />
This work aims to describe qualitatively and quantitatively<br />
sea water <strong>in</strong>trusi<strong>on</strong> <strong>in</strong>side a costal z<strong>on</strong>e close<br />
to the mouth of the Arno <strong>river</strong>, fourth italian watercourse<br />
<strong>in</strong> lenght, <strong>in</strong> a 40 Km territorial stripe between Pisa<br />
town and Tyrrhenian Sea. The whole <str<strong>on</strong>g>study</str<strong>on</strong>g> area is <strong>in</strong><br />
Tuscany (Central Italy) (figure 1).<br />
Present hydrochemical work c<strong>on</strong>cerns superficial<br />
waters of the last forty kilometers of the <strong>river</strong> and<br />
groundwaters of surround<strong>in</strong>g pla<strong>in</strong>.<br />
GEOGRAPHICAL, GEOLOGICAL AND<br />
HYDROGEOLOGICAL FEATURES<br />
The morphology of the area is pla<strong>in</strong>, surrounded by<br />
low mounta<strong>in</strong>s (< 1000 m altitude).<br />
The z<strong>on</strong>e represents the southern part of a big graben<br />
structure, with NNW-SSE axis, bounded eastwards<br />
by Alpi Apuane – M<strong>on</strong>ti Pisani ridge and westwards by<br />
a sea-s<strong>in</strong>ked belt.<br />
A mostly metamorphical rocky substratum (“Tuscan<br />
Sequence”) alternat<strong>in</strong>g with tect<strong>on</strong>ical slabs of Ligurian<br />
Units (“Calvana Supergroup”), underlays a Pleistocene<br />
11
A STUDY ON SALT INTRUSION IN ARNO RIVER BED AND SURROUNDING PLAIN IN TUSCANY COASTAL AREA, CENTRAL ITALY<br />
sequence, for the most part coarse gra<strong>in</strong>ed fluvial sediments<br />
(gravels and sands), and olocenical formati<strong>on</strong>s of<br />
fluvial and lacustr<strong>in</strong>e clays, silt and sands with gravel<br />
levels.<br />
The whole area presents a c<strong>on</strong>t<strong>in</strong>uous shallow<br />
water-table (3-4 m tick), outcropp<strong>in</strong>g the ground surface<br />
<strong>in</strong> some periods of the year. As the Arno <strong>river</strong> flows<br />
under sea level <strong>in</strong> most of its pla<strong>in</strong>, the watercourse<br />
generally dra<strong>in</strong>s this acquifer.<br />
ANALYTICAL DATA<br />
Sampl<strong>in</strong>g methods<br />
Sampl<strong>in</strong>g activity has been carried out five times<br />
between June and November 2000, three times <strong>in</strong> <strong>river</strong><br />
waters and twice <strong>in</strong> pla<strong>in</strong> groundwaters by draw<strong>in</strong>gs <strong>in</strong><br />
shallow and deep wells.<br />
The first and the sec<strong>on</strong>d of the Arno sampl<strong>in</strong>gs, performed<br />
<strong>in</strong> dry m<strong>on</strong>ths (June and September), occurred<br />
<strong>in</strong> spare-flow c<strong>on</strong>diti<strong>on</strong>s, 10,6 m3 /s and 13 m3 /s respectively,<br />
whereas <strong>river</strong> flow was 30,4 m3 /s dur<strong>in</strong>g<br />
October sampl<strong>in</strong>g, executed after very ra<strong>in</strong>y days. Each<br />
time samples have been picked up <strong>in</strong> 12 draw<strong>in</strong>g po<strong>in</strong>ts<br />
(table 1), both <strong>on</strong> surface and at bottom of <strong>river</strong> bed <strong>in</strong><br />
order to create vertical hydrochemical secti<strong>on</strong>s. Bottom<br />
samples are marked by “b”.<br />
On the other hand, sampl<strong>in</strong>gs <strong>in</strong> pla<strong>in</strong> wells corresp<strong>on</strong>d<br />
to low (June) and high (November) water level of<br />
phreatic surface. Sampl<strong>in</strong>g po<strong>in</strong>ts have been chosen by<br />
spott<strong>in</strong>g six perpendicular-to-<strong>river</strong> alignments of wells<br />
(table 2). As far as possible, both surface and bottom<br />
water <strong>in</strong> wells have been drawn.<br />
Table 1. Sampl<strong>in</strong>g po<strong>in</strong>ts al<strong>on</strong>g Arno <strong>river</strong><br />
Table 2. Alignments of wells <strong>in</strong> Arno pla<strong>in</strong><br />
12<br />
Laboratory analysis<br />
Each of the 135 samples have been analysed by<br />
gaug<strong>in</strong>g temperature, pH, c<strong>on</strong>ductivity and measur<strong>in</strong>g<br />
major chemical comp<strong>on</strong>ents, nitrite, nitrate and amm<strong>on</strong>ium<br />
i<strong>on</strong>; COD has been estimated <strong>in</strong> order to have a<br />
merely partial and rough assessment of polluti<strong>on</strong> charge,<br />
while Br- i<strong>on</strong> c<strong>on</strong>centrati<strong>on</strong> has been measured for<br />
the specific purpose of this work (tables 3,4).<br />
DISCUSSION<br />
Arno <strong>river</strong><br />
Geochemical features<br />
A first classificati<strong>on</strong> of water quality is obta<strong>in</strong>ed by<br />
square diagram (Langelier and Ludwig, 1942). The<br />
three sampl<strong>in</strong>gs show similar patterns; we can observe<br />
that (figure 2): 1) samples distributi<strong>on</strong> <strong>on</strong> plots are c<strong>on</strong>sistent<br />
with previous results c<strong>on</strong>cern<strong>in</strong>g the Arno <strong>river</strong> <strong>in</strong><br />
its entire extent (figure 2 B): po<strong>in</strong>ts are well aligned<br />
al<strong>on</strong>g mix<strong>in</strong>g l<strong>in</strong>e between meteorical and sea water,<br />
ly<strong>in</strong>g <strong>in</strong> its “mar<strong>in</strong>e” half-l<strong>in</strong>e as samples were drawn <strong>in</strong><br />
last part of the watercourse; 2) no important geochemical<br />
changes occur with regard to different sampl<strong>in</strong>g<br />
Figure 2. Square diagrams for Arno samples (A=October<br />
samples, B=Arno samples accord<strong>in</strong>g to Benc<strong>in</strong>i and Malesani,<br />
1993)
Table 3. Analytical results for groundwater samples (November)<br />
Table 4. Analytical results for Arno samples <strong>in</strong> October<br />
periods; 3) nearly all waters are classified as “alkal<strong>in</strong>echloride<br />
waters”.<br />
Separate plott<strong>in</strong>g of surface and bottom waters<br />
Nicolò Sbolci, Alberto Benc<strong>in</strong>i & Piergiorgio Malesani<br />
(figure 3) shows a regular distributi<strong>on</strong> of surface samples,<br />
while bottom waters gather at both mar<strong>in</strong>e halfl<strong>in</strong>e<br />
tails, po<strong>in</strong>t<strong>in</strong>g out a disc<strong>on</strong>t<strong>in</strong>uous mix<strong>in</strong>g between<br />
13
A STUDY ON SALT INTRUSION IN ARNO RIVER BED AND SURROUNDING PLAIN IN TUSCANY COASTAL AREA, CENTRAL ITALY<br />
Figure 3. Square diagrams for <strong>river</strong> surface (A) and bottom<br />
(B) samples<br />
14<br />
fresh and <strong>salt</strong>y water; <strong>in</strong> particular, all samples picked<br />
up <strong>in</strong> the last 15 km of <strong>river</strong> bed (A7-A12) are plotted<br />
<strong>in</strong> sea water positi<strong>on</strong> <strong>on</strong> the square diagram.<br />
Moreover, geochemical parameters and electrical<br />
c<strong>on</strong>ductivity have been related to distances, separat<strong>in</strong>g<br />
surface and bottom samples (figure 4); comm<strong>on</strong> features<br />
are: 1) c<strong>on</strong>centrati<strong>on</strong>s <strong>in</strong>crease go<strong>in</strong>g towards <strong>river</strong><br />
mouth; 2) flow changes d<strong>on</strong>’t modify chart trend; 3)<br />
pr<strong>in</strong>cipal differences occur compar<strong>in</strong>g surface and bottom<br />
samples: the former <strong>in</strong> fact <strong>in</strong>crease regularly, the<br />
latter <strong>in</strong>stead po<strong>in</strong>t out an evident c<strong>on</strong>centrati<strong>on</strong> drop<br />
at 15 Km from mouth (A7b sample); the drop is sharp<br />
<strong>in</strong> all graphs but for calcium and bicarb<strong>on</strong>ate.<br />
Sea-water <strong>in</strong>trusi<strong>on</strong><br />
The <str<strong>on</strong>g>study</str<strong>on</strong>g> of chemical parameters <strong>in</strong>dicat<strong>in</strong>g mar<strong>in</strong>e<br />
<strong>in</strong>trusi<strong>on</strong> must be based <strong>on</strong> a comparisi<strong>on</strong> with the<br />
chemical compositi<strong>on</strong> of a typical sea water sample.<br />
With this <strong>in</strong>tent, two samples of sea water have been<br />
drawn al<strong>on</strong>g the coast near Mar<strong>in</strong>a di Pisa, <strong>in</strong> June and<br />
November (table 5).<br />
The requisites for a chemical parameter to be a<br />
good <strong>in</strong>trusi<strong>on</strong> marker are: 1) chemical and physical<br />
stability <strong>in</strong> natural c<strong>on</strong>diti<strong>on</strong>s; 2) steady c<strong>on</strong>centrati<strong>on</strong><br />
<strong>in</strong> sea water; 3) low superficial c<strong>on</strong>centrati<strong>on</strong>, anyway<br />
far different from sea <strong>on</strong>e; 4) lack of important antropical<br />
c<strong>on</strong>tributi<strong>on</strong>.<br />
Therefore most of major comp<strong>on</strong>ents d<strong>on</strong>’t have<br />
the right requisites, even Cl- and Na+ i<strong>on</strong>s, whose c<strong>on</strong>centrati<strong>on</strong>s<br />
are very high and almost steady <strong>in</strong> sea<br />
water but which are often liable to antropical polluti<strong>on</strong>.<br />
Figure 4. Correlati<strong>on</strong> Cl- vs distances and Ca2+ vs distances for <strong>river</strong> surface and bottom samples (circle=June, triangle=Sept,<br />
empty circle=Oct)
Table 5. Sea water compositi<strong>on</strong><br />
Bromide i<strong>on</strong><br />
Bromide i<strong>on</strong> seems to have the right features to be<br />
a good <strong>in</strong>trusi<strong>on</strong> marker: its c<strong>on</strong>centrati<strong>on</strong> is about 70<br />
ppm <strong>in</strong> sea water, decreas<strong>in</strong>g to 10-500 µg/l <strong>in</strong> meteorical<br />
waters. Bromide c<strong>on</strong>tent <strong>in</strong> Arno samples, compared<br />
with sea value, can give a first approximate assessment<br />
of sal<strong>in</strong>isati<strong>on</strong> degree of <strong>river</strong> water.<br />
Figure 5 shows bromide progressive <strong>in</strong>crease <strong>in</strong><br />
directi<strong>on</strong> of <strong>river</strong> mouth. The trend is similar to most of<br />
other chemical parameters; bromide as well as other<br />
i<strong>on</strong>s shows a sharp drop at A7b bottom sample, while<br />
l<strong>in</strong>e trend is regular <strong>on</strong> surface. Besides, ratio between<br />
bromide c<strong>on</strong>tent <strong>in</strong> samples and <strong>in</strong> sea gives an assessment<br />
of sea-water rate <strong>in</strong> every sampl<strong>in</strong>g po<strong>in</strong>t (table<br />
6). From rates <strong>in</strong> previous chart a graphical reck<strong>on</strong><strong>in</strong>g of<br />
areal propagati<strong>on</strong> of sal<strong>in</strong>e <strong>in</strong>trusi<strong>on</strong> can be obta<strong>in</strong>ed,<br />
by plott<strong>in</strong>g rates <strong>in</strong> bottom samples and distances from<br />
mouth (figure 6). Assum<strong>in</strong>g that no <strong>in</strong>trusi<strong>on</strong> occurs<br />
with a rate lower than 5 ‰ (value that may be due to<br />
superficial bromide c<strong>on</strong>tent or to antropical polluti<strong>on</strong> <strong>in</strong><br />
Arno pla<strong>in</strong>), the scatter of po<strong>in</strong>ts suggests an upstream<br />
propagati<strong>on</strong> of <strong>salt</strong>y water <strong>in</strong>side <strong>river</strong> bed for about 30<br />
km from mouth.<br />
Diluti<strong>on</strong> factor of major comp<strong>on</strong>ents<br />
Figure 7 shows c<strong>on</strong>centrati<strong>on</strong> ratio between bromide<br />
and cloride i<strong>on</strong>s: its regular trend means that no cloride<br />
c<strong>on</strong>tributi<strong>on</strong> alien to sea-<strong>river</strong> mix<strong>in</strong>g system is<br />
present <strong>in</strong> Arno samples.<br />
Therefore cloride diluti<strong>on</strong> factor has been calculated<br />
as a further <strong>salt</strong> <strong>in</strong>trusi<strong>on</strong> marker: it is a simple<br />
assessment of sea-water diluti<strong>on</strong> whose values are normalized<br />
mak<strong>in</strong>g reference to a typical fresh water,<br />
whose diluti<strong>on</strong> factor is zero.<br />
Table 6. Percentual of sea water <strong>in</strong> Arno <strong>river</strong> samples<br />
Nicolò Sbolci, Alberto Benc<strong>in</strong>i & Piergiorgio Malesani<br />
Figure 5. Bromide distributi<strong>on</strong> <strong>in</strong> Arno <strong>river</strong> bed<br />
Figure 6. Depth of <strong>salt</strong>y c<strong>on</strong>e propagati<strong>on</strong> <strong>in</strong> Arno <strong>river</strong> pla<strong>in</strong><br />
15
A STUDY ON SALT INTRUSION IN ARNO RIVER BED AND SURROUNDING PLAIN IN TUSCANY COASTAL AREA, CENTRAL ITALY<br />
Figure 7. Distributi<strong>on</strong> of Cl/Br ratio <strong>in</strong> October samples (full<br />
circle=surface, empty circle=bottom)<br />
Cloride diluti<strong>on</strong> factor for <strong>river</strong> bottom samples <strong>in</strong><br />
October is plotted with distances <strong>in</strong> figure 8. It provides<br />
a f<strong>in</strong>al graphic representati<strong>on</strong> of the rate of sea water<br />
<strong>in</strong>trusi<strong>on</strong> al<strong>on</strong>g the Arno bed. The propagati<strong>on</strong> of the<br />
<strong>salt</strong>y c<strong>on</strong>e is also c<strong>on</strong>firmed by diluti<strong>on</strong> factors of c<strong>on</strong>ductibility<br />
and other major comp<strong>on</strong>ents, whose trends<br />
are similar to cloride <strong>on</strong>e.<br />
Morphological <str<strong>on</strong>g>study</str<strong>on</strong>g> of Arno <strong>river</strong> bed<br />
In order to <strong>in</strong>vestigate more deeply the mechanism<br />
of <strong>salt</strong>y c<strong>on</strong>e propagati<strong>on</strong>, sampl<strong>in</strong>g po<strong>in</strong>ts have been<br />
studied together with <strong>river</strong> bed morphology as surveyed<br />
by D’Urso and Gigli (1999): Arno <strong>river</strong> bottom is entirely<br />
under sea level from mouth to Capr<strong>on</strong>a weir, 27 kilometers<br />
<strong>in</strong>wards. Go<strong>in</strong>g upstream, the <strong>river</strong> bed altitude<br />
keeps around 0 m a.s.l. and start<strong>in</strong>g from S.Giovanni<br />
alla Vena (about 36 km from mouth) it def<strong>in</strong>itely rises<br />
over sea level. This morphological feature is quite unusual<br />
<strong>in</strong> Italian <strong>river</strong>s and may give an explanati<strong>on</strong> of the<br />
str<strong>on</strong>g depth of sal<strong>in</strong>e <strong>in</strong>trusi<strong>on</strong> <strong>in</strong> the Tuscany cost,<br />
s<strong>in</strong>ce <strong>salt</strong>y water can easily propagate al<strong>on</strong>g surfaces<br />
placed under sea level (Ghezzi, 1994).<br />
Groundwaters<br />
Geochemical features<br />
Geochemical analysis of groundwater samples has<br />
shown wells enriched <strong>in</strong> nitrite, nitrate and amm<strong>on</strong>ium<br />
i<strong>on</strong>s; as nitrate high c<strong>on</strong>centrati<strong>on</strong>s str<strong>on</strong>gly change the<br />
hydrochemical balance of a water analysis, <strong>in</strong> additi<strong>on</strong><br />
to traditi<strong>on</strong>al square diagram two other graphs are proposed<br />
with the <strong>in</strong>sert of nitrate parameter am<strong>on</strong>g major<br />
ani<strong>on</strong>s, isolat<strong>in</strong>g HCO -<br />
3 first and then Cl- (figure 9).<br />
Po<strong>in</strong>ts distributi<strong>on</strong> <strong>in</strong> c<strong>on</strong>venti<strong>on</strong>al square diagrams<br />
show no differences between June and November:<br />
most samples bel<strong>on</strong>g to “alkal<strong>in</strong>e-earth bicarb<strong>on</strong>ate”<br />
water group, while few po<strong>in</strong>ts ly<strong>in</strong>g <strong>in</strong> the sec<strong>on</strong>d quadrant<br />
represent “alkal<strong>in</strong>e-bicarb<strong>on</strong>ate” waters, quite<br />
rare <strong>in</strong> natural c<strong>on</strong>diti<strong>on</strong>s (figure 9 A). Cati<strong>on</strong>ic triangular<br />
diagram (figure 10) expla<strong>in</strong>s this peculiarity by<br />
sodium enrichment respect to calcium.<br />
16<br />
Figure 8. Bromide diluti<strong>on</strong> factor vs distances <strong>in</strong> October<br />
samples<br />
Figure 9. Square diagrams for groundwater samples <strong>in</strong><br />
November<br />
Figure 10. Cati<strong>on</strong>ic triangular diagram for groundwater samples<br />
<strong>in</strong> November
In general, groundwater samples show str<strong>on</strong>g data<br />
scatter<strong>in</strong>g <strong>in</strong>stead of the clear trend of the Arno waters.<br />
Further <strong>in</strong>formati<strong>on</strong> is obta<strong>in</strong>ed isolat<strong>in</strong>g cloride i<strong>on</strong> <strong>in</strong> a<br />
square diagram (figure 9 B): samples with Cl - c<strong>on</strong>centrati<strong>on</strong><br />
bigger than 50% of total ani<strong>on</strong>s lay <strong>in</strong> third quadrant<br />
and po<strong>in</strong>t out wells which may be c<strong>on</strong>tam<strong>in</strong>ated<br />
by sea water.<br />
Sea-water <strong>in</strong>trusi<strong>on</strong><br />
Groundwater c<strong>on</strong>tam<strong>in</strong>ati<strong>on</strong> by <strong>salt</strong> sea water has<br />
been <strong>in</strong>vestigated with the same methods used for the<br />
Arno <strong>river</strong>.<br />
Bromide i<strong>on</strong><br />
S<strong>in</strong>ce the <strong>in</strong>trusi<strong>on</strong> process <strong>in</strong> acquifers moves by<br />
areal – and no l<strong>in</strong>ear – propagati<strong>on</strong>, no correlati<strong>on</strong>s<br />
between major i<strong>on</strong>s and distance are useful for our purpose:<br />
thus we have firstly searched wells with bromide<br />
c<strong>on</strong>tent and Cl- /Br- value similiar - or just lean<strong>in</strong>g - to<br />
sea water; <strong>on</strong>ly three samples show a Cl- /Br- ratio and<br />
a bromide c<strong>on</strong>centrati<strong>on</strong> comparable to sea value:<br />
P17b, deriv<strong>in</strong>g from a well bottom water close to <strong>river</strong><br />
bed, P20 and P22, both distant less then 1000 m from<br />
the coast.<br />
The correlati<strong>on</strong> of this two parameters with distances<br />
from the coast po<strong>in</strong>ts out no remarkable trend for<br />
groundwater samples.<br />
Interpretati<strong>on</strong> of peculiar hydrochemical facies<br />
As stated through square diagrams of groundwater<br />
samples, few po<strong>in</strong>ts lay <strong>in</strong> “alkal<strong>in</strong>e-bicarb<strong>on</strong>ate” water<br />
quadrant. This facies is usually due to deep waters or to<br />
dissoluti<strong>on</strong> of sodium-enriched rocks. Chemical compositi<strong>on</strong><br />
of sampled waters has been compared with thermal<br />
spr<strong>in</strong>gs present <strong>in</strong> the <str<strong>on</strong>g>study</str<strong>on</strong>g> z<strong>on</strong>e (Benc<strong>in</strong>i et al.,<br />
1977), f<strong>in</strong>d<strong>in</strong>g no relati<strong>on</strong>ship. Besides, rocks and sediments<br />
cropp<strong>in</strong>g out all over the area and even <strong>in</strong> all<br />
idrogeological bas<strong>in</strong> of Arno <strong>river</strong> can’t expla<strong>in</strong> such an<br />
enrichment <strong>in</strong> sodium <strong>in</strong> comparisi<strong>on</strong> with other major<br />
i<strong>on</strong>s, s<strong>in</strong>ce CaCO3 is everywhere the most comm<strong>on</strong><br />
m<strong>in</strong>eral and dissoluti<strong>on</strong> of plagioclases or other sodium<br />
m<strong>in</strong>erals is very unlikely <strong>in</strong> the chemical envir<strong>on</strong>ments of<br />
Central Italy.<br />
In order to expla<strong>in</strong> this peculiar chemism, chemicalphysical<br />
process of i<strong>on</strong>ic exchange may be c<strong>on</strong>sidered,<br />
by which dissolved calcium replaces sodium when<br />
water flows through electr<strong>on</strong>egatively-charged particles,<br />
like clayey m<strong>in</strong>erals, enrich<strong>in</strong>g waters <strong>in</strong> Na + i<strong>on</strong> to<br />
the detriment of Ca2+ (Appelo and Postma, 1993;<br />
McLean et al., 2001). I<strong>on</strong>ic exchange has been studied<br />
firstly by Durov (1948), whose square diagram – modified<br />
later by Lloyd and Heathcote (1985) – allows a<br />
more detailed geochimical classificati<strong>on</strong> through its<br />
n<strong>in</strong>e divisi<strong>on</strong>s.<br />
Nicolò Sbolci, Alberto Benc<strong>in</strong>i & Piergiorgio Malesani<br />
Groundwater samples have been plotted <strong>in</strong> Durov<br />
modified graph (figure 11): sal<strong>in</strong>e polluti<strong>on</strong> is c<strong>on</strong>firmed<br />
<strong>in</strong> some pla<strong>in</strong> wells, without any regular mix<strong>in</strong>g process<br />
between fresh and sea water.<br />
Many po<strong>in</strong>ts are placed al<strong>on</strong>g the l<strong>in</strong>e describ<strong>in</strong>g<br />
direct i<strong>on</strong>ic exchange (from quadrant “1” to “3”) : they<br />
represent waters drawn both from shallow and deep<br />
wells, spotted at various distances from the sea, and<br />
most of them show sodium not fully predom<strong>in</strong>ant <strong>on</strong><br />
calcium (quadrant “2”). In particular, the wells of the<br />
“Pisa est” alignment, whose samples (P9-P12) are all<br />
<strong>in</strong>cluded <strong>in</strong> direct i<strong>on</strong>ic exchange porti<strong>on</strong> of the diagram,<br />
are drilled <strong>in</strong> an area with abundant clayey<br />
covers. No differences are evident between June and<br />
November. This outcomes c<strong>on</strong>firm the possible presence<br />
of i<strong>on</strong>ic exchange process <strong>in</strong> shallow acquifers of Arno<br />
<strong>river</strong> pla<strong>in</strong>.<br />
Figure 11. Durov diagram for groundwater samples <strong>in</strong><br />
November<br />
CONCLUSIONS<br />
Hydrochemical sampl<strong>in</strong>gs carried out dur<strong>in</strong>g 2000<br />
<strong>in</strong> the Arno <strong>river</strong> bed and <strong>in</strong> surround<strong>in</strong>g groundwaters<br />
have po<strong>in</strong>ted out a str<strong>on</strong>g and widespread sal<strong>in</strong>isati<strong>on</strong><br />
of watercourse, due to upstream propagati<strong>on</strong> of a sal<strong>in</strong>e<br />
c<strong>on</strong>e ris<strong>in</strong>g from Tyrrhenian Sea. The <strong>in</strong>trusi<strong>on</strong> is evident<br />
<strong>in</strong> the last 15-20 km of <strong>river</strong> course, where it<br />
shows a vertical stratificati<strong>on</strong> because of <strong>salt</strong>y water<br />
higher density. Intrusi<strong>on</strong> is supported by the Arno bed<br />
level, which lies under sea level for about 27 km from<br />
mouth.<br />
Surround<strong>in</strong>g pla<strong>in</strong> is <strong>on</strong>ly weakly affected by sal<strong>in</strong>isati<strong>on</strong>:<br />
sal<strong>in</strong>e water seems to pollute a th<strong>in</strong> stripe al<strong>on</strong>g<br />
the <strong>river</strong> and the part of the pla<strong>in</strong> immediately beh<strong>in</strong>d<br />
the cost, as recently checked out by Fr<strong>on</strong>d<strong>in</strong>i et al.<br />
17
A STUDY ON SALT INTRUSION IN ARNO RIVER BED AND SURROUNDING PLAIN IN TUSCANY COASTAL AREA, CENTRAL ITALY<br />
(2001). On the c<strong>on</strong>trary groundwater unusual chemism,<br />
brought about by some alkal<strong>in</strong>e-bicarb<strong>on</strong>ate samples,<br />
may be due to the process of i<strong>on</strong>ic exchange occurr<strong>in</strong>g<br />
<strong>in</strong> clayey fluvial sediments of the pla<strong>in</strong>.<br />
In order to extend and improve the <str<strong>on</strong>g>study</str<strong>on</strong>g> of sal<strong>in</strong>isati<strong>on</strong><br />
of the Arno pla<strong>in</strong> it is our <strong>in</strong>tenti<strong>on</strong> to analyse<br />
isotopic values of sampled waters, which may provide<br />
further <strong>in</strong>formati<strong>on</strong> about <strong>salt</strong> propagati<strong>on</strong> mechanism<br />
<strong>in</strong> coastal acquifers (Adorni-Braccesi et al., 1998).<br />
Bibliographic references<br />
Adorni-Braccesi, A.; Bellucci, L.; Benc<strong>in</strong>i, A; Cortecci, G.; D<strong>in</strong>elli,<br />
E.; Gimenez Forcada, E.; La Ruffa, G.; Panichi, C and<br />
Podda, F. 1998. The Arno River catchment bas<strong>in</strong>, Tuscany,<br />
Italy: Chemical and isotopic compositi<strong>on</strong> of water.<br />
Rotterdam. Water-Rock Interacti<strong>on</strong>, Arehart & Hulst<strong>on</strong>. 47-<br />
50 pp.<br />
Appelo, C.A.J. and Postma, D. 1993. Geochemistry, groundwater<br />
and polluti<strong>on</strong>. Rotterdam. A.A. Balkema.<br />
Benc<strong>in</strong>i, A.; Duchi, V. and Mart<strong>in</strong>i, M. 1977. Geochemistry of<br />
thermal spr<strong>in</strong>gs of Tuscany (Italy). Chemical Geology.<br />
N°19. 229-252 pp.<br />
Benc<strong>in</strong>i, A. and Malesani, P. 1993. Fiume Arno: acque, sedimenti<br />
e biosfera. Florence. Accademia toscana di scienze e<br />
lettere “La Colombaria”, Olschki. “Studi” N°133.<br />
18<br />
D’Urso, I. and Gigli, G. 1999. Profilo del f<strong>on</strong>do alveo del Fiume<br />
Arno dalla foce a Calc<strong>in</strong>aia. Firenze. Autorità di Bac<strong>in</strong>o del<br />
Fiume Arno.<br />
Durov, S.A. 1948. Natural waters and graphic representati<strong>on</strong><br />
of their compositi<strong>on</strong>. Dkl. Akad. Nauk SSSR. N°59. 87-90<br />
pp.<br />
Fr<strong>on</strong>d<strong>in</strong>i, F.; Giaqu<strong>in</strong>to, S. and Zanzari, A. 2001. Salt water<br />
<strong>in</strong>trusi<strong>on</strong> <strong>in</strong> the Pisa coastal pla<strong>in</strong> (Central Italy). Lisse.<br />
Water-Rock Interacti<strong>on</strong>, Cidu. 513-516 pp.<br />
Ghezzi, G. 1994. La sal<strong>in</strong>izzazi<strong>on</strong>e delle acque di falda nelle<br />
aree litoranee della Toscana ed evoluzi<strong>on</strong>e del c<strong>on</strong>o sal<strong>in</strong>o<br />
nella pianura del F. Cornia e nella falda superficiale <strong>in</strong> fregio<br />
al F. Serchio. La gesti<strong>on</strong>e dell’acqua nell’agricoltura<br />
toscana. Atti c<strong>on</strong>vegno ARSIA.<br />
Langelier, W. and Ludwig, H. 1942. Graphical methods for <strong>in</strong>dicat<strong>in</strong>g<br />
the m<strong>in</strong>eral character of natural waters. J. Amer.<br />
Water Works Ass. N°34. 335-352 pp.<br />
Lloyd, J.W. and Heathcote, J.A. 1985. Natural <strong>in</strong>organic hydrochemistry<br />
<strong>in</strong> relati<strong>on</strong> to groundwater. An <strong>in</strong>troducti<strong>on</strong>.<br />
Oxford. Clarend<strong>on</strong> Press.<br />
McLean,W.; Jankowski, J. and Lavitt, N. 2001.The orig<strong>in</strong> of Na-<br />
HCO 3 type groundwater <strong>in</strong> an eastern secti<strong>on</strong> of the Lower<br />
Namoi River catchment, New South Wales, Australia. Lisse.<br />
Water-Rock Interacti<strong>on</strong>, Cidu. 565-568 pp.