dp11_pap
dp11_pap
dp11_pap
Create successful ePaper yourself
Turn your PDF publications into a flip-book with our unique Google optimized e-Paper software.
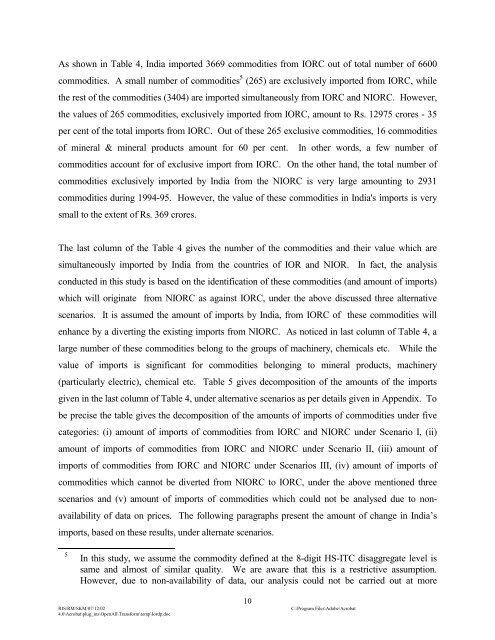
As shown in Table 4, India imported 3669 commodities from IORC out of total number of 6600<br />
commodities. A small number of commodities 5 (265) are exclusively imported from IORC, while<br />
the rest of the commodities (3404) are imported simultaneously from IORC and NIORC. However,<br />
the values of 265 commodities, exclusively imported from IORC, amount to Rs. 12975 crores - 35<br />
per cent of the total imports from IORC. Out of these 265 exclusive commodities, 16 commodities<br />
of mineral & mineral products amount for 60 per cent. In other words, a few number of<br />
commodities account for of exclusive import from IORC. On the other hand, the total number of<br />
commodities exclusively imported by India from the NIORC is very large amounting to 2931<br />
commodities during 1994-95. However, the value of these commodities in India's imports is very<br />
small to the extent of Rs. 369 crores.<br />
The last column of the Table 4 gives the number of the commodities and their value which are<br />
simultaneously imported by India from the countries of IOR and NIOR. In fact, the analysis<br />
conducted in this study is based on the identification of these commodities (and amount of imports)<br />
which will originate from NIORC as against IORC, under the above discussed three alternative<br />
scenarios. It is assumed the amount of imports by India, from IORC of these commodities will<br />
enhance by a diverting the existing imports from NIORC. As noticed in last column of Table 4, a<br />
large number of these commodities belong to the groups of machinery, chemicals etc. While the<br />
value of imports is significant for commodities belonging to mineral products, machinery<br />
(particularly electric), chemical etc. Table 5 gives decomposition of the amounts of the imports<br />
given in the last column of Table 4, under alternative scenarios as per details given in Appendix. To<br />
be precise the table gives the decomposition of the amounts of imports of commodities under five<br />
categories: (i) amount of imports of commodities from IORC and NIORC under Scenario I, (ii)<br />
amount of imports of commodities from IORC and NIORC under Scenario II, (iii) amount of<br />
imports of commodities from IORC and NIORC under Scenarios III, (iv) amount of imports of<br />
commodities which cannot be diverted from NIORC to IORC, under the above mentioned three<br />
scenarios and (v) amount of imports of commodities which could not be analysed due to nonavailability<br />
of data on prices. The following paragraphs present the amount of change in India’s<br />
imports, based on these results, under alternate scenarios.<br />
5<br />
In this study, we assume the commodity defined at the 8-digit HS-ITC disaggregate level is<br />
same and almost of similar quality. We are aware that this is a restrictive assumption.<br />
However, due to non-availability of data, our analysis could not be carried out at more<br />
10<br />
RIS/RM/SKM/07/12/02 C:\Program Files\Adobe\Acrobat<br />
4.0\Acrobat\plug_ins\OpenAll\Transform\temp\Iordp.doc


