Sit-to-Stand Movement Pattern A Kinematic Study - Physical Therapy
Sit-to-Stand Movement Pattern A Kinematic Study - Physical Therapy
Sit-to-Stand Movement Pattern A Kinematic Study - Physical Therapy

Create successful ePaper yourself
Turn your PDF publications into a flip-book with our unique Google optimized e-Paper software.
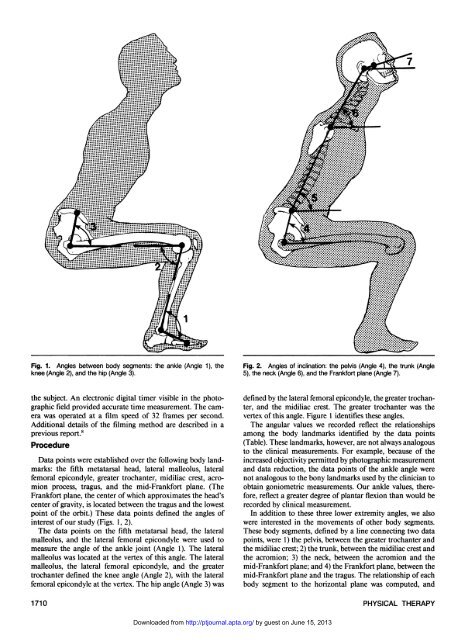
Fig. 1. Angles between body segments: the ankle (Angle 1), the<br />
knee (Angle 2), and the hip (Angle 3).<br />
the subject. An electronic digital timer visible in the pho<strong>to</strong>graphic<br />
field provided accurate time measurement. The camera<br />
was operated at a film speed of 32 Frames per second.<br />
Additional details of the filming method are described in a<br />
previous report. 8<br />
Procedure<br />
Data points were established over the following body landmarks:<br />
the fifth metatarsal head, lateral malleolus, lateral<br />
femoral epicondyle, greater trochanter, midiliac crest, acromion<br />
process, tragus, and the mid-Frankfort plane. (The<br />
Frankfort plane, the center of which approximates the head's<br />
center of gravity, is located between the tragus and the lowest<br />
point of the orbit.) These data points defined the angles of<br />
interest of our study (Figs. 1,2).<br />
The data points on the fifth metatarsal head, the lateral<br />
malleolus, and the lateral femoral epicondyle were used <strong>to</strong><br />
measure the angle of the ankle joint (Angle 1). The lateral<br />
malleolus was located at the vertex of this angle. The lateral<br />
malleolus, the lateral femoral epicondyle, and the greater<br />
trochanter defined the knee angle (Angle 2), with the lateral<br />
femoral epicondyle at the vertex. The hip angle (Angle 3) was<br />
Fig. 2. Angles of inclination: the pelvis (Angle 4), the trunk (Angle<br />
5), the neck (Angle 6), and the Frankfort plane (Angle 7).<br />
defined by the lateral femoral epicondyle, the greater trochanter,<br />
and the midiliac crest. The greater trochanter was the<br />
vertex of this angle. Figure 1 identifies these angles.<br />
The angular values we recorded reflect the relationships<br />
among the body landmarks identified by the data points<br />
(Table). These landmarks, however, are not always analogous<br />
<strong>to</strong> the clinical measurements. For example, because of the<br />
increased objectivity permitted by pho<strong>to</strong>graphic measurement<br />
and data reduction, the data points of the ankle angle were<br />
not analogous <strong>to</strong> the bony landmarks used by the clinician <strong>to</strong><br />
obtain goniometric measurements. Our ankle values, therefore,<br />
reflect a greater degree of plantar flexion than would be<br />
recorded by clinical measurement.<br />
In addition <strong>to</strong> these three lower extremity angles, we also<br />
were interested in the movements of other body segments.<br />
These body segments, defined by a line connecting two data<br />
points, were 1) the pelvis, between the greater trochanter and<br />
the midiliac crest; 2) the trunk, between the midiliac crest and<br />
the acromion; 3) the neck, between the acromion and the<br />
mid-Frankfort plane; and 4) the Frankfort plane, between the<br />
mid-Frankfort plane and the tragus. The relationship of each<br />
body segment <strong>to</strong> the horizontal plane was computed, and<br />
1710 PHYSICAL THERAPY<br />
Downloaded from<br />
http://ptjournal.apta.org/ by guest on June 15, 2013