

Selenology Today # 7 July 2007 - Home
Selenology Today # 7 July 2007 - Home
Selenology Today # 7 July 2007 - Home

Create successful ePaper yourself
Turn your PDF publications into a flip-book with our unique Google optimized e-Paper software.
GEOLOGIC LUNAR RESEARCH SELENOLOGY TODAY # 7<br />
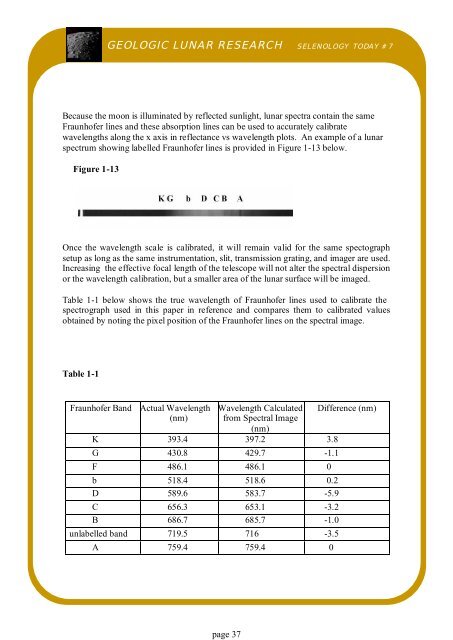
Because the moon is illuminated by reflected sunlight, lunar spectra contain the same<br />
Fraunhofer lines and these absorption lines can be used to accurately calibrate<br />
wavelengths along the x axis in reflectance vs wavelength plots. An example of a lunar<br />
spectrum showing labelled Fraunhofer lines is provided in Figure 1-13 below.<br />
Figure 1-13<br />
Once the wavelength scale is calibrated, it will remain valid for the same spectograph<br />
setup as long as the same instrumentation, slit, transmission grating, and imager are used.<br />
Increasing the effective focal length of the telescope will not alter the spectral dispersion<br />
or the wavelength calibration, but a smaller area of the lunar surface will be imaged.<br />
Table 1-1 below shows the true wavelength of Fraunhofer lines used to calibrate the<br />
spectrograph used in this paper in reference and compares them to calibrated values<br />
obtained by noting the pixel position of the Fraunhofer lines on the spectral image.<br />
Table 1-1<br />
Fraunhofer Band Actual Wavelength<br />
(nm)<br />
Wavelength Calculated<br />
from Spectral Image<br />
(nm)<br />
K 393.4 397.2 3.8<br />
G 430.8 429.7 -1.1<br />
F 486.1 486.1 0<br />
b 518.4 518.6 0.2<br />
D 589.6 583.7 -5.9<br />
C 656.3 653.1 -3.2<br />
B 686.7 685.7 -1.0<br />
unlabelled band 719.5 716 -3.5<br />
A 759.4 759.4 0<br />
page 37<br />
Difference (nm)