Download Full Report (PDF, 1.36MB) - Queen's University Belfast
Download Full Report (PDF, 1.36MB) - Queen's University Belfast
Download Full Report (PDF, 1.36MB) - Queen's University Belfast

Create successful ePaper yourself
Turn your PDF publications into a flip-book with our unique Google optimized e-Paper software.
3.2 Randomised controlled trial and a rolling cohort design<br />
The current study utilised a 3-year rolling cohort design. In other words, the effectiveness of the intervention was not<br />
assessed until all cohorts had completed the intervention and the results reported here are pooled from all three successive<br />
cohorts. In Mate-Tricks, children completed the pre-test at the beginning of the programme in September and the posttest<br />
at the end of the programme in June. A rolling cohort design ensures that the impact of the intervention (such<br />
as Mate-Tricks) is looked at in a longitudinal way (i.e. over the three cohorts) and provides a sufficient sample size for<br />
statistical comparisons and effect size calculations.<br />
In Mate-Tricks, it was proposed that 210 children would be referred to the programme each year for 3 years, giving a<br />
maximum proposed total sample of 630 children. With the rolling cohort design, particular care was taken over potential<br />
contamination effects and therefore the main outcome results – comparison of pre- and post-test scores between the<br />
control and intervention groups – were not analysed until the final cohort had completed the programme. Releasing<br />
interim results may have had undesirable and unintentional effects on the delivery of the programme and/or undermined<br />
the validity of the evaluation. Also, any interim outcomes would only be tentative or perhaps even misleading. Given that<br />
all three cohorts of children have now completed the programme, this report therefore presents descriptive, contextual<br />
and comparative data in relation to the measured outcomes. In other words, the main focus of this report is to compare<br />
the pre- and post-test scores for all three cohorts according to the outcomes measured.<br />
3.3 Sample<br />
A sample size power calculation was calculated based on: identifying an effect size with a Cohen’s d in the range of<br />
0.2-0.4; a statistical power level of 0.8; having a minimum of two predictors in the model; and identifying a probability<br />
level of 0.05. The desired sample size was calculated to be in the range of n=241-478. The initial child sample for the<br />
study was N=592, which exceeded the sample size required. After attrition, the sample still remained within the required<br />
range (N=347).<br />
3.3.1 Children<br />
The child evaluation assessed 74% (N=435) of the 592 children referred to the Mate-Tricks programme at pre-test, across the<br />
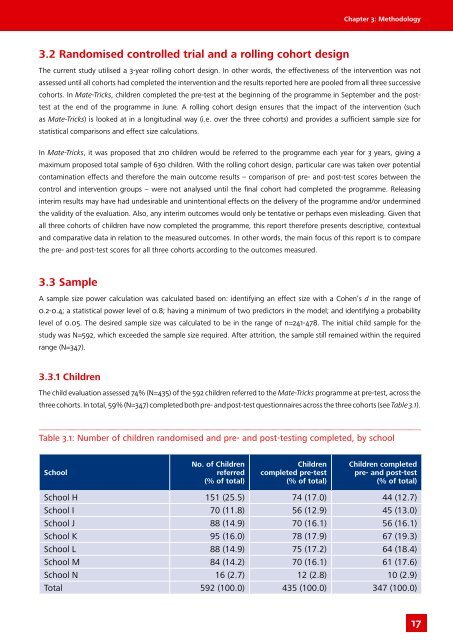
three cohorts. In total, 59% (N=347) completed both pre- and post-test questionnaires across the three cohorts (see Table 3.1).<br />
Table 3.1: Number of children randomised and pre- and post-testing completed, by school<br />
School<br />
No. of Children<br />
referred<br />
(% of total)<br />
Children<br />
completed pre-test<br />
(% of total)<br />
Chapter 3: Methodology<br />
Children completed<br />
pre- and post-test<br />
(% of total)<br />
School H 151 (25.5) 74 (17.0) 44 (12.7)<br />
School I 70 (11.8) 56 (12.9) 45 (13.0)<br />
School J 88 (14.9) 70 (16.1) 56 (16.1)<br />
School K 95 (16.0) 78 (17.9) 67 (19.3)<br />
School L 88 (14.9) 75 (17.2) 64 (18.4)<br />
School M 84 (14.2) 70 (16.1) 61 (17.6)<br />
School N 16 (2.7) 12 (2.8) 10 (2.9)<br />
Total 592 (100.0) 435 (100.0) 347 (100.0)<br />
17