

Fall 2000 Gems & Gemology - Gemfrance
Fall 2000 Gems & Gemology - Gemfrance
Fall 2000 Gems & Gemology - Gemfrance

Create successful ePaper yourself
Turn your PDF publications into a flip-book with our unique Google optimized e-Paper software.
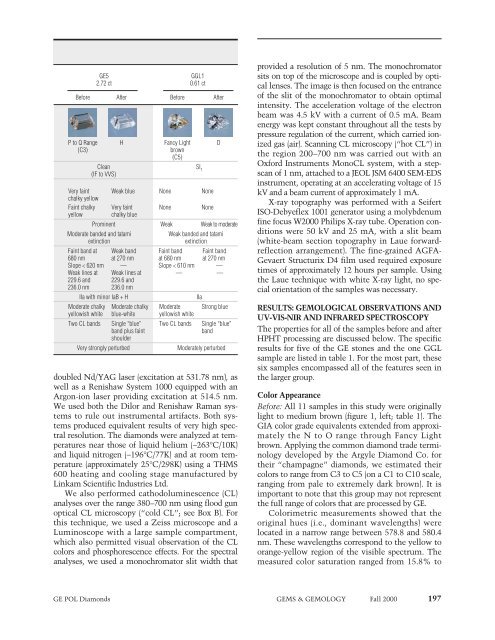
GE5 GGL1<br />
2.72 ct 0.61 ct<br />
Before After Before After<br />
P to Q Range H Fancy Light D<br />
(C3) brown<br />
(C5)<br />
Clean<br />
(IF to VVS)<br />
SI1 Very faint<br />
chalky yellow<br />
Weak blue None None<br />
Faint chalky Very faint None None<br />
yellow chalky blue<br />
Prominent Weak Weak to moderate<br />
Moderate banded and tatami Weak banded and tatami<br />
extinction extinction<br />
Faint band at Weak band Faint band Faint band<br />
680 nm at 270 nm at 680 nm at 270 nm<br />
Slope < 620 nm — Slope < 610 nm —<br />
Weak lines at Weak lines at — —<br />
229.6 and 229.6 and<br />
236.0 nm 236.0 nm<br />
IIa with minor IaB + H IIa<br />
Moderate chalky Moderate chalky Moderate Strong blue<br />
yellowish white blue-white yellowish white<br />
Two CL bands Single “blue” Two CL bands Single “blue”<br />
band plus faint<br />
shoulder<br />
band<br />
Very strongly perturbed Moderately perturbed<br />
doubled Nd/YAG laser (excitation at 531.78 nm), as<br />
well as a Renishaw System 1000 equipped with an<br />
Argon-ion laser providing excitation at 514.5 nm.<br />
We used both the Dilor and Renishaw Raman systems<br />
to rule out instrumental artifacts. Both systems<br />
produced equivalent results of very high spectral<br />
resolution. The diamonds were analyzed at temperatures<br />
near those of liquid helium (−263°C/10K)<br />
and liquid nitrogen (−196°C/77K) and at room temperature<br />
(approximately 25°C/298K) using a THMS<br />
600 heating and cooling stage manufactured by<br />
Linkam Scientific Industries Ltd.<br />
We also performed cathodoluminescence (CL)<br />
analyses over the range 380–700 nm using flood gun<br />
optical CL microscopy (“cold CL”; see Box B). For<br />
this technique, we used a Zeiss microscope and a<br />
Luminoscope with a large sample compartment,<br />
which also permitted visual observation of the CL<br />
colors and phosphorescence effects. For the spectral<br />
analyses, we used a monochromator slit width that<br />
provided a resolution of 5 nm. The monochromator<br />
sits on top of the microscope and is coupled by optical<br />
lenses. The image is then focused on the entrance<br />
of the slit of the monochromator to obtain optimal<br />
intensity. The acceleration voltage of the electron<br />
beam was 4.5 kV with a current of 0.5 mA. Beam<br />
energy was kept constant throughout all the tests by<br />
pressure regulation of the current, which carried ionized<br />
gas (air). Scanning CL microscopy (“hot CL”) in<br />
the region 200–700 nm was carried out with an<br />
Oxford Instruments MonoCL system, with a stepscan<br />
of 1 nm, attached to a JEOL JSM 6400 SEM-EDS<br />
instrument, operating at an accelerating voltage of 15<br />
kV and a beam current of approximately 1 mA.<br />
X-ray topography was performed with a Seifert<br />
ISO-Debyeflex 1001 generator using a molybdenum<br />
fine focus W<strong>2000</strong> Philips X-ray tube. Operation conditions<br />
were 50 kV and 25 mA, with a slit beam<br />
(white-beam section topography in Laue forwardreflection<br />
arrangement). The fine-grained AGFA-<br />
Gevaert Structurix D4 film used required exposure<br />
times of approximately 12 hours per sample. Using<br />
the Laue technique with white X-ray light, no special<br />
orientation of the samples was necessary.<br />
RESULTS: GEMOLOGICAL OBSERVATIONS AND<br />
UV-VIS-NIR AND INFRARED SPECTROSCOPY<br />
The properties for all of the samples before and after<br />
HPHT processing are discussed below. The specific<br />
results for five of the GE stones and the one GGL<br />
sample are listed in table 1. For the most part, these<br />
six samples encompassed all of the features seen in<br />
the larger group.<br />
Color Appearance<br />
Before: All 11 samples in this study were originally<br />
light to medium brown (figure 1, left; table 1). The<br />
GIA color grade equivalents extended from approximately<br />
the N to O range through Fancy Light<br />
brown. Applying the common diamond trade terminology<br />
developed by the Argyle Diamond Co. for<br />
their “champagne” diamonds, we estimated their<br />
colors to range from C3 to C5 (on a C1 to C10 scale,<br />
ranging from pale to extremely dark brown). It is<br />
important to note that this group may not represent<br />
the full range of colors that are processed by GE.<br />
Colorimetric measurements showed that the<br />
original hues (i.e., dominant wavelengths) were<br />
located in a narrow range between 578.8 and 580.4<br />
nm. These wavelengths correspond to the yellow to<br />
orange-yellow region of the visible spectrum. The<br />
measured color saturation ranged from 15.8% to<br />
GE POL Diamonds GEMS & GEMOLOGY <strong>Fall</strong> <strong>2000</strong> 197