

Fall 2000 Gems & Gemology - Gemfrance
Fall 2000 Gems & Gemology - Gemfrance
Fall 2000 Gems & Gemology - Gemfrance

Create successful ePaper yourself
Turn your PDF publications into a flip-book with our unique Google optimized e-Paper software.
25.4% (on a 0 to 100% scale). The tones varied<br />
between 2.7 and 4.1 (on a 0 to 10 scale). The ratios<br />
of tone and saturation extended from 0.14 to 0.21<br />
(for objective color evaluation, GGL uses a T/S ratio<br />
to standardize the description of brown and gray in<br />
colored diamonds), corresponding to low or moderate<br />
saturations and light to medium tones. The data<br />
obtained for this color study are influenced by<br />
geometry and surface conditions and therefore may<br />
show some variation from one sample to the next.<br />
After: All samples were dramatically enhanced by<br />
HPHT processing (figure 1, right). Most were in the<br />
colorless range of D to F. One sample retained a<br />
slight brownish color and was graded as H on the<br />
GIA color-grading scale.<br />
We measured a substantial decrease in saturation<br />
and tone, as well as a slight shift in hue, in the<br />
processed diamonds. The modified colors varied<br />
from 570.6 to 576.4 nm in hue, from 0.8% to 5.2%<br />
in saturation, and from 0.5 to 3.0 in tone. These<br />
data correspond to an average shift of −5.4 nm in<br />
hue, −18% in saturation, and −1.5 in tone from the<br />
original, light brown colors. With these data, we can<br />
Figure 2. Before processing (left), this<br />
fracture in the 0.61 ct GGL sample<br />
was bright and reflective. After<br />
HPHT processing (right), the area of<br />
the original fracture had acquired a<br />
coarse (frosted) texture and we<br />
noticed the addition of a bright<br />
transparent extension, or “fringe.”<br />
No graphitization was observed.<br />
Photomicrographs by Christopher P.<br />
Smith; magnified 55×.<br />
better understand why GE POL diamonds appear<br />
yellow, rather than brown, at colors lower than H<br />
on the GIA grading scale (refer to diamonds<br />
described in Moses et al., 1999; Fisher and Spits,<br />
<strong>2000</strong>). For the human eye, this is a very sensitive<br />
region of the visible spectrum; even a shift of only a<br />
few nanometers and a decrease in tone can make<br />
the previously brown diamonds appear yellow.<br />
Clarity and Inclusions<br />
Before: Few of the samples contained observable<br />
mineral inclusions or fractures. LKI informed us<br />
that in their experience, brown type IIa diamond<br />
rough is commonly very clean (P. Kaplan, pers.<br />
comm., <strong>2000</strong>). Two of the POCL samples did contain<br />
small fractures. The GGL sample had a tiny<br />
crystal with a small, brightly reflective stress halo,<br />
as well as two small fractures (see, e.g., figure 2, left)<br />
and a natural. Although we did not clarity grade the<br />
GE POL diamonds, because only the GGL sample<br />
was fully faceted, we determined that the clarity<br />
grades would be VVS or better.<br />
After: Re-examination of these diamond inclusions<br />
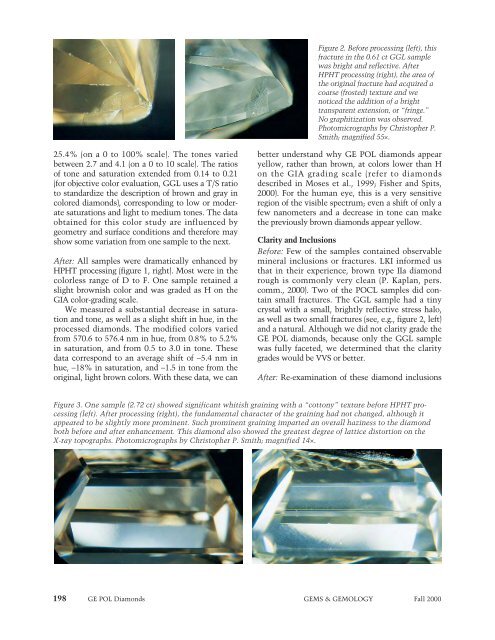
Figure 3. One sample (2.72 ct) showed significant whitish graining with a “cottony” texture before HPHT processing<br />
(left). After processing (right), the fundamental character of the graining had not changed, although it<br />
appeared to be slightly more prominent. Such prominent graining imparted an overall haziness to the diamond<br />
both before and after enhancement. This diamond also showed the greatest degree of lattice distortion on the<br />
X-ray topographs. Photomicrographs by Christopher P. Smith; magnified 14×.<br />
198 GE POL Diamonds GEMS & GEMOLOGY <strong>Fall</strong> <strong>2000</strong>