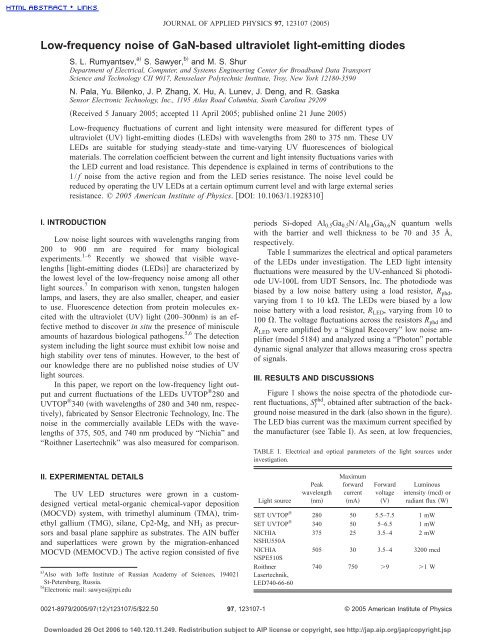
J. Appl. Phys. 97, 123107 (2005)
J. Appl. Phys. 97, 123107 (2005)
J. Appl. Phys. 97, 123107 (2005)
You also want an ePaper? Increase the reach of your titles
YUMPU automatically turns print PDFs into web optimized ePapers that Google loves.
Low-frequency noise of GaN-based ultraviolet light-emitting diodes<br />
S. L. Rumyantsev, a S. Sawyer, b and M. S. Shur<br />
Department of Electrical, Computer, and Systems Engineering Center for Broadband Data Transport<br />
Science and Technology CII 9017, Rensselaer Polytechnic Institute, Troy, New York 12180-3590<br />
N. Pala, Yu. Bilenko, J. P. Zhang, X. Hu, A. Lunev, J. Deng, and R. Gaska<br />
Sensor Electronic Technology, Inc., 1195 Atlas Road Columbia, South Carolina 29209<br />
Received 5 January <strong>2005</strong>; accepted 11 April <strong>2005</strong>; published online 21 June <strong>2005</strong><br />
Low-frequency fluctuations of current and light intensity were measured for different types of<br />
ultraviolet UV light-emitting diodes LEDs with wavelengths from 280 to 375 nm. These UV<br />
LEDs are suitable for studying steady-state and time-varying UV fluorescences of biological<br />
materials. The correlation coefficient between the current and light intensity fluctuations varies with<br />
the LED current and load resistance. This dependence is explained in terms of contributions to the<br />
1/f noise from the active region and from the LED series resistance. The noise level could be<br />
reduced by operating the UV LEDs at a certain optimum current level and with large external series<br />
resistance. © <strong>2005</strong> American Institute of <strong>Phys</strong>ics. DOI: 10.1063/1.1928310<br />
I. INTRODUCTION<br />
Low noise light sources with wavelengths ranging from<br />
200 to 900 nm are required for many biological<br />
experiments. 1–6 Recently we showed that visible wavelengths<br />
light-emitting diodes LEDs are characterized by<br />
the lowest level of the low-frequency noise among all other<br />
light sources. 7 In comparison with xenon, tungsten halogen<br />
lamps, and lasers, they are also smaller, cheaper, and easier<br />
to use. Fluorescence detection from protein molecules excited<br />
with the ultraviolet UV light 200–300nm is an effective<br />
method to discover in situ the presence of miniscule<br />
amounts of hazardous biological pathogens. 5,6 The detection<br />
system including the light source must exhibit low noise and<br />
high stability over tens of minutes. However, to the best of<br />
our knowledge there are no published noise studies of UV<br />
light sources.<br />
In this paper, we report on the low-frequency light output<br />
and current fluctuations of the LEDs UVTOP ® 280 and<br />
UVTOP ® 340 with wavelengths of 280 and 340 nm, respectively,<br />
fabricated by Sensor Electronic Technology, Inc. The<br />
noise in the commercially available LEDs with the wavelengths<br />
of 375, 505, and 740 nm produced by “Nichia” and<br />
“Roithner Lasertechnik” was also measured for comparison.<br />
II. EXPERIMENTAL DETAILS<br />
The UV LED structures were grown in a customdesigned<br />
vertical metal-organic chemical-vapor deposition<br />
MOCVD system, with trimethyl aluminum TMA, trimethyl<br />
gallium TMG, silane, Cp2-Mg, and NH 3 as precursors<br />
and basal plane sapphire as substrates. The AIN buffer<br />
and superlattices were grown by the migration-enhanced<br />
MOCVD MEMOCVD. The active region consisted of five<br />
a<br />
Also with Ioffe Institute of Russian Academy of Sciences, 194021<br />
St-Petersburg, Russia.<br />
b<br />
Electronic mail: sawyes@rpi.edu<br />
JOURNAL OF APPLIED PHYSICS <strong>97</strong>, <strong>123107</strong> <strong>2005</strong><br />
periods Si-doped Al 0.5Ga 0.5N/Al 0.4Ga 0.6N quantum wells<br />
with the barrier and well thickness to be 70 and 35 Å,<br />
respectively.<br />
Table I summarizes the electrical and optical parameters<br />
of the LEDs under investigation. The LED light intensity<br />
fluctuations were measured by the UV-enhanced Si photodiode<br />
UV-100L from UDT Sensors, Inc. The photodiode was<br />
biased by a low noise battery using a load resistor, R phd,<br />
varying from 1 to 10 k. The LEDs were biased by a low<br />
noise battery with a load resistor, R LED, varying from 10 to<br />
100 . The voltage fluctuations across the resistors R phd and<br />
R LED were amplified by a “Signal Recovery” low noise amplifier<br />
model 5184 and analyzed using a “Photon” portable<br />
dynamic signal analyzer that allows measuring cross spectra<br />
of signals.<br />
III. RESULTS AND DISCUSSIONS<br />
Figure 1 shows the noise spectra of the photodiode cur-<br />
phd<br />
rent fluctuations, SI , obtained after subtraction of the background<br />
noise measured in the dark also shown in the figure.<br />
The LED bias current was the maximum current specified by<br />
the manufacturer see Table I. As seen, at low frequencies,<br />
TABLE I. Electrical and optical parameters of the light sources under<br />
investigation.<br />
Light source<br />
SET UVTOP ®<br />
SET UVTOP ®<br />
NICHIA<br />
NSHU550A<br />
NICHIA<br />
NSPE510S<br />
Roithner<br />
Lasertechnik,<br />
LED740-66-60<br />
Peak<br />
wavelength<br />
nm<br />
Maximum<br />
forward<br />
current<br />
mA<br />
Forward<br />
voltage<br />
V<br />
Luminous<br />
intensity mcd or<br />
radiant flux W<br />
280 50 5.5–7.5 1 mW<br />
340 50 5–6.5 1 mW<br />
375 25 3.5–4 2 mW<br />
505 30 3.5–4 3200 mcd<br />
740 750 9 1 W<br />
0021-8<strong>97</strong>9/<strong>2005</strong>/<strong>97</strong>12/<strong>123107</strong>/5/$22.50 <strong>97</strong>, <strong>123107</strong>-1<br />
© <strong>2005</strong> American Institute of <strong>Phys</strong>ics<br />
Downloaded 26 Oct 2006 to 140.120.11.249. Redistribution subject to AIP license or copyright, see http://jap.aip.org/jap/copyright.jsp
<strong>123107</strong>-2 Rumyantsev et al. J. <strong>Appl</strong>. <strong>Phys</strong>. <strong>97</strong>, <strong>123107</strong> <strong>2005</strong><br />
FIG. 1. Noise spectra of light intensity fluctuations for different LEDs. The<br />
background noise measured in darkness “dark noise”, the levels of the shot<br />
noise S I=2qI phd and thermal noise S T=4k BT/R phd are also shown I phd<br />
=250 A,R phd=1 k.<br />
the 1/ f noise with =1–2 was dominant for all these LEDs.<br />
At higher frequencies where 1/ f noise was small, the shot<br />
noise was dominant when it was higher than the background<br />
noise limited by the thermal noise of load resistor Rphd. Since the photodetector responsivity and the LED powers are<br />
different for different wavelengths, the photodetector current<br />
varied from one LED to another. However, in each case, the<br />
1/f-like noise was always proportional to the square of the<br />
photodiode current S I<br />
phd 2<br />
Iphd<br />
varied by varying the amount<br />
of light reaching the photodiode. Therefore, the noise spectra<br />
shown for these LEDs in Fig. 1 were normalized to the<br />
equivalent photodiode current of Iphd=250 A for all LED<br />
phd 2<br />
assuming SI Iphd.<br />
Figure 2 shows S I<br />
phd 2<br />
/Iphd<br />
at frequency of f =10 Hz as<br />
function of the LED current for all LEDs under study. For<br />
the LED740-66-60, the corner frequency fc at which 1/ f<br />
noise and shot noise have the same amplitude was close to<br />
2<br />
10 Hz, and the spectral noise density SI/I phd of the 1/ f noise<br />
was obtained after subtraction of the shot noise. As seen, the<br />
relative spectral noise density of the light intensity fluctuations<br />
decreases with the increase of the LED current. The<br />
short-wavelength SET UVTOP ® LEDs demonstrate the noise<br />
level of the same order of magnitude or smaller as<br />
the longer-wavelength LEDs NICHIA NSHU550A and<br />
NICHIA NSPE510S.<br />
In Ref. 3, we introduced the LED noise quality factor:<br />
phd 2<br />
FIG. 2. Dependence of relative noise spectra SI /Iphd on LED current, ILED,<br />
for different LEDs. Frequency of analysis f =10 Hz.<br />
FIG. 3. Quality factor as function of the LED current, I LED, for different<br />
LEDs.<br />
= SI 2 fn<br />
Iphd <br />
q ILED, 1<br />
where f is the frequency, n is the number of chips connected<br />
in series, is the radiation lifetime, q is the electronic charge,<br />
and ILED is the LED current. The lower the value of , the<br />
better is the LED noise quality. This parameter is similar to<br />
the Hooge parameter 8 used as a figure of merit for the 1/ f<br />
noise for semiconductor materials and devices. For LEDs,<br />
the product n/qI LED represents the total number of charge<br />
carriers, Nlight, involved in the light emission process. Parameter<br />
Nlight plays the same role as the total number of carriers,<br />
N, in the expression for the Hooge parameter:<br />
= SI 2 fN. 2<br />
I<br />
Figure 3 shows the dependence of on the LED current,<br />
I LED symbols are the same as in Fig. 2. For a crude estimate,<br />
we assumed /q10 10 A −1 for all devices. As seen,<br />
our 340- and 280-nm LEDs demonstrate the quality factor <br />
of the same order of magnitude as 375- and 505-nm LEDs<br />
produced by Nichia.<br />
To gain understanding of the noise mechanisms, we investigated<br />
the correlation coefficient between the optical and<br />
current noise<br />
=<br />
S phdLED<br />
S S phd LED<br />
as a function of the LED current for SET UVTOP ® 340 nm<br />
for two values of the load resistor, RLED. Here Sphd and SLED are the LED and photodiode current noise spectra and<br />
SphdLED is the cross spectrum of the LED and photodiode<br />
current fluctuations. Note that Sphd and SLED are not short<br />
circuit but actual current fluctuations.<br />
In order to calculate the vs ILED dependence, we consider<br />
the simplified LED equivalent circuit consisted of the<br />
diode barrier resistance, r, the internal LED series resistance<br />
Rc which is the sum of the base and contact resistances, and<br />
the external resistance RLED. Since at high LED current resistance<br />
Rc dominates the total diode resistance, we can assume<br />
that the fluctuations Rc of this resistance is the main<br />
source of the LED current fluctuations. For simplicity, in our<br />
Downloaded 26 Oct 2006 to 140.120.11.249. Redistribution subject to AIP license or copyright, see http://jap.aip.org/jap/copyright.jsp<br />
3
<strong>123107</strong>-3 Rumyantsev et al. J. <strong>Appl</strong>. <strong>Phys</strong>. <strong>97</strong>, <strong>123107</strong> <strong>2005</strong><br />
phd 2 LED 2<br />
FIG. 4. Dependence of relative noise spectra SI /Iphd,<br />
SI /ILED,<br />
and<br />
S/ 2 on LED current. Inset shows the dependence of the photodiode current<br />
Iphd on LED current ILED. model developed below, we assume that these current fluctuations<br />
are dominant even when barrier resistance r is comparable<br />
with R c at relatively low currents. We also assume<br />
that there are additional fluctuations of the light intensity ,<br />
which are not related to the fluctuations of the resistance R c<br />
and related, for example, to the fluctuations of the radiative<br />
recombination process, fluctuations of the substrate transparency,<br />
or fluctuations of the electron-hole pair concentration,<br />
n, in the light-emitting region. At high LED currents, the<br />
resistance of the light-emitting region is small compared to<br />
the base and series resistance, and, therefore, fluctuations n<br />
are not expected to contribute much to the total LED resistance.<br />
The dependence of the photodiode current on the LED<br />
current was always linear for all LEDs studied and within the<br />
studied current ranges. The inset in Fig. 4 shows an example<br />
of this dependence for SET UVTOP ® 340 nm <br />
=I phd/I LED410 −4 . Hence, LED and photodetector current<br />
fluctuations are given by<br />
R c<br />
ILED = ILED , 4<br />
RLED + Rc + r<br />
Rc Iphd = ILED RLED + Rc + r + I <br />
LED . 5<br />
<br />
If R c and are uncorrelated, the correlation coefficient is<br />
given by<br />
=<br />
S Rc /R LED + R c + r 2<br />
S 2<br />
Rc RLED + Rc + r4 + S 2 S Rc<br />
R LED + R c + r 2<br />
, 6<br />
where S Rc is the spectral noise density of the resistance R c<br />
fluctuations given by<br />
SRc = S LED<br />
I<br />
2 Rc + r<br />
ILED 2 , 7<br />
LED 2<br />
where SI /ILED is the relative spectral noise density of the<br />
short circuit LED current fluctuations.<br />
FIG. 5. Dependence of the correlation coefficient filled symbols and<br />
differential resistance R c+r open symbols on the LED current I LED. The<br />
dashed lines show approximations for the resistances used in calculations.<br />
The solid lines are calculation for the correlation coefficient using Eq. 6.<br />
2<br />
Figure 4 shows SI/I phd at 10 Hz as a function of the LED<br />
current, short circuit fluctuations of the LED current,<br />
LED 2<br />
SI /ILED,<br />
and S/ 2 .<br />
Spectral noise density S/ 2 was evaluated as<br />
phd<br />
− S LED<br />
I<br />
R c + r 2<br />
S 2 = SI 2 2<br />
2 . 8<br />
Iphd ILED RLED + Rc + r<br />
The open squares in Fig. 4 show S/ 2 obtained using Eq.<br />
8 for the measurements with RLED=100 . As seen, the<br />
spectral noise density decreases with the increase of the LED<br />
current as (S/ 2 −2<br />
)I LED.<br />
The filled symbols in Fig. 5 show the experimental dependence<br />
of the correlation coefficient on the LED current.<br />
As seen, correlation coefficient changes from 0.3 to 0.9<br />
for RLED=10 when LED current increases from 5 to 50<br />
mA. For RLED=100 , the correlation coefficient is smaller.<br />
The solid lines in Fig. 5 show the results of the calculation<br />
using Eq. 6 with the parameters extracted from the<br />
experimental data. The dashed line in Fig. 5 shows the approximation<br />
for the dependence of the resistance r+R c used<br />
in calculations open symbols show experimental values of<br />
the resistance r+R c. As seen, the agreement with the measured<br />
dependences is quite good.<br />
As mentioned above, the light intensity noise in UV<br />
LEDs was not studied before. Several publications 9–12 discussed<br />
several sources of noise in semiconductor laser diodes<br />
with the wavelengths above 800 nm, including fluctuations<br />
of the absorption coefficient, fluctuations of the injected carrier<br />
concentration, and fluctuations of the mirrors reflectivity.<br />
It is obvious that only the first two of these mechanisms<br />
might be important for LEDs. Since (S/ 2 −2<br />
)I LED see Fig.<br />
5, fluctuations nonlinearly depend on current ILED i.e.,<br />
on the light intensity. The light output power is relatively<br />
small in LEDs. Therefore, we can assume that the absorption<br />
coefficient does not depend on the LED current. This means<br />
that the most probable source of the noise S is the fluctuations<br />
of injected carrier concentration, which depends on the<br />
LED current.<br />
For many applications the “signal-to-noise” ratio in certain<br />
frequency bandwidth f = f2− f1 is an important param-<br />
Downloaded 26 Oct 2006 to 140.120.11.249. Redistribution subject to AIP license or copyright, see http://jap.aip.org/jap/copyright.jsp
<strong>123107</strong>-4 Rumyantsev et al. J. <strong>Appl</strong>. <strong>Phys</strong>. <strong>97</strong>, <strong>123107</strong> <strong>2005</strong><br />
eter. Here signal is the power P opt=I LED 2 R phd dissipated<br />
by the resistor R phd. Noise is the power, P noise, of the thermal,<br />
shot, and 1/ f noise dissipated by the same resistor. Therefore,<br />
the signal-to-noise ratios for different noise sources are<br />
Popt =<br />
Pnoisethermal ILED2Rphd 4kTf<br />
Popt =<br />
Pnoiseshot Popt =<br />
Pnoise1/f I LED 2<br />
2qI LED + I darkf<br />
ILEDn <br />
lnf 2/f 1 q ,<br />
where the 1/ f noise power is taking as Pnoise f<br />
= 22 f1 ILEDRphd/ fnq/ and Idark is the dark current of photodetector.<br />
The coefficient in the Eq. 8 is a function of<br />
the LED wall-plug efficiency, photodetector responsivity,<br />
amount of light collected by photodetector, and number of<br />
chips connected in series n. Therefore, in order to<br />
achieve high signal-to-noise ratio one needs photodetectors<br />
with the maximum responsivity for the given wavelength<br />
and efficient LEDs. Using several LEDs or a single LED of<br />
a larger area also improves the signal-to-noise ratio. Note<br />
that for the 1/ f noise the signal-to noise ratio does not depend<br />
on . As shown above, there are at least two main<br />
sources of the 1/ f noise in LEDs. The noise related to the<br />
internal series resistance can be partially suppressed by using<br />
a large external series resistance. The noise originating from<br />
the light-emitting region could be decreased by optimizing<br />
the design of the light generating layer.<br />
Figure 6 shows the dependencies of signal-to-noise ratios<br />
for three different LEDs for the frequency bandwidth<br />
from 1 Hz to 1 kHz the actual dependence of quality factor<br />
on the LED current is taken into account. As seen, the<br />
signal-to-noise ratio can be limited by either shot, thermal, or<br />
1/f noise of LED, depending on the frequency band and<br />
operating regime.<br />
IV. CONCLUSIONS<br />
At low frequencies f 10 2 –10 4 Hz, the noise spectra<br />
of UV LEDs depend on frequency as 1/ f with =1–2. This<br />
1/f-like noise dependence on current is different for different<br />
LED types. UV LEDs exhibit a quality factor of the same<br />
order of magnitude as visible wavelength LEDs, even though<br />
the absolute level of noise is higher. Our results show that<br />
280- and 340-nm UVTOP LEDs are suitable for studying<br />
steady-state and time-varying UV fluorescence of biological<br />
materials.<br />
Correlation coefficient between fluctuations of LED current<br />
and light intensity depends on the LED current and LED<br />
load resistor: the higher the LED current and the smaller the<br />
load resistance, the higher the correlation coefficient. This<br />
result is explained by the contribution to the 1/ f noise of two<br />
uncorrelated processes: fluctuations of the internal series resistance<br />
and fluctuations of light caused, most probably, by<br />
concentration fluctuations in the light-emitting region. The<br />
light intensity fluctuations can be partially suppressed by a<br />
large external series resistance. Signal-to-noise ratio is lim-<br />
9<br />
FIG. 6. Signal-to-noise ratios for three different LEDs as function of the<br />
LED current for the frequency bandwidth f from1Hzto1kHz.<br />
ited by either thermal, shot, or 1/ f noise and is a function of<br />
the of the LED wall-plug efficiency, photodetector responsivity,<br />
amount of light collected by photodetector, LED current,<br />
total amount of LEDs used LED area, and amplitude of the<br />
1/f noise of the LED.<br />
ACKNOWLEDGMENTS<br />
The work at RPI was partially supported by the National<br />
Science Foundation Project Monitor Dr. Rao. The work at<br />
Ioffe <strong>Phys</strong>ico-Technical Institute was supported by Russian<br />
Foundation for Basic Research.<br />
1<br />
L. B. Cohen and B. M. Salzberg, Rev. <strong>Phys</strong>iol. Biochem. Pharmacol. 83,<br />
33 1<strong>97</strong>8.<br />
2<br />
B. M. Salzberg, A. Grinvald, L. B. Cohen, H. V. Davila, and W. N. Ross,<br />
J. Neurophysiol. 40, 1281 1<strong>97</strong>7.<br />
3<br />
J. Barker and J. McKelvy, Current Methods in Cellular Neurobiology<br />
Downloaded 26 Oct 2006 to 140.120.11.249. Redistribution subject to AIP license or copyright, see http://jap.aip.org/jap/copyright.jsp
<strong>123107</strong>-5 Rumyantsev et al. J. <strong>Appl</strong>. <strong>Phys</strong>. <strong>97</strong>, <strong>123107</strong> <strong>2005</strong><br />
Wiley, New York, 1983.<br />
4<br />
P. De Weer and B. M. Salzberg, Optial Methods in Cell <strong>Phys</strong>iology Wiley,<br />
New York, 1986.<br />
5<br />
Y.-L. Pan, S. Holler, R. K. Chang, S. C. Hill, R. G. Pinnik, S. Niles, and<br />
J. R. Bottiger, Opt. Lett. 24, 1161999.<br />
6<br />
A. P. Snyder, Field Anal. Chem. Technol. 3, 219 1999.<br />
7<br />
S. L. Rumyantsev, M. S. Shur, Yu. Bilenko, P. V. Kosterin, and B. M.<br />
Salzberg, J. <strong>Appl</strong>. <strong>Phys</strong>. 96, 9662004.<br />
8<br />
F. N. Hooge, T. G. M. Kleinpenning, and L. K. J. Vandamme, Rep. Prog.<br />
<strong>Phys</strong>. 44, 479 1981.<br />
9<br />
R. J. Fronen, IEEE J. Quantum Electron. 25, 16531989.<br />
10<br />
A. Dandrige and H. F. Taylor, IEEE J. Quantum Electron. 18, 1738<br />
1982.<br />
11<br />
P. Signoret, G. Belleville, and B. Orsal, Fluct. Noise Lett. 1, L12001.<br />
12<br />
L. K. J. Vandamme, P. J. L. Herve, and R. Alabedra, Proceedings of the<br />
14th International Conference on Noise in <strong>Phys</strong>ical Systems and 1/f Fluctuations,<br />
14–18 July, 19<strong>97</strong>, Leuven, Belgium World Scientific, Singapore,<br />
19<strong>97</strong>, p. 495.<br />
Downloaded 26 Oct 2006 to 140.120.11.249. Redistribution subject to AIP license or copyright, see http://jap.aip.org/jap/copyright.jsp


