Workshop on Climate Sensitivity - Index of
Workshop on Climate Sensitivity - Index of
Workshop on Climate Sensitivity - Index of

You also want an ePaper? Increase the reach of your titles
YUMPU automatically turns print PDFs into web optimized ePapers that Google loves.
IPCC <str<strong>on</strong>g>Workshop</str<strong>on</strong>g> <strong>on</strong> <strong>Climate</strong> <strong>Sensitivity</strong><br />
Paris, France, July 26–29, 2004<br />
Pre-C<strong>on</strong>ference Volume<br />
A Comparis<strong>on</strong> <strong>of</strong> <strong>Climate</strong> <strong>Sensitivity</strong> Am<strong>on</strong>g the Japanese Models<br />
Akio Kitoh 1 , Akira Noda 1 , Seiji Yukimoto 1 , Seita Emori 2 , Toru Nozawa 2 , Tomoo Ogura 2 , Masahide<br />
Kimoto 3 , Ayako Abe-Ouchi 3 , and Akimasa Sumi 3<br />
1 Meteorological Research Institute, Tsukuba, Japan<br />
2 Nati<strong>on</strong>al Institute for Envir<strong>on</strong>mental Studies, Tsukuba, Japan<br />
3 Center for <strong>Climate</strong> System Research, University <strong>of</strong> Tokyo, Tokyo, Japan<br />
1. Introducti<strong>on</strong><br />
Two Japanese models (MRI and CCSR/NIES models)<br />
showed the smallest and the largest climate sensitivity<br />
at the time <strong>of</strong> the IPCC TAR in 2001. Here we report<br />
recent changes in their models’ climate sensitivity.<br />
2. MRI model<br />
The MRI-CGCM2 (Yukimoto et al. 2001; Yukimoto and<br />
Noda 2002) has several versi<strong>on</strong>s depending <strong>on</strong> cloudradiati<strong>on</strong><br />
tuning. In its radiati<strong>on</strong> scheme, CO , H O, 2 2<br />
O , CH and N O are treated as the greenhouse effect<br />
3 4 2<br />
gases directly, and the direct effect <strong>of</strong> sulfate aerosol is<br />
explicitly treated, but the indirect effect is not included.<br />
For the AR4 scenario experiments, atmospheric<br />
c<strong>on</strong>centrati<strong>on</strong> <strong>of</strong> sulfate aerosols has been calculated<br />
for all SRES emissi<strong>on</strong> scenarios <strong>of</strong> sulfur dioxide by<br />
a chemical transport model MASINGER developed at<br />
MRI (Tanaka et al. 2003). The global mean surface air<br />
temperature rises about 2.4K, 2.7K and 2.0K at the end<br />
<strong>of</strong> the 21st century compared to the 1961-1990 value in<br />
A1B, A2 and B2 scenarios, respectively (Uchiyama et<br />
al. 2004).<br />
IPCC <str<strong>on</strong>g>Workshop</str<strong>on</strong>g> <strong>on</strong> <strong>Climate</strong> <strong>Sensitivity</strong> – 51<br />
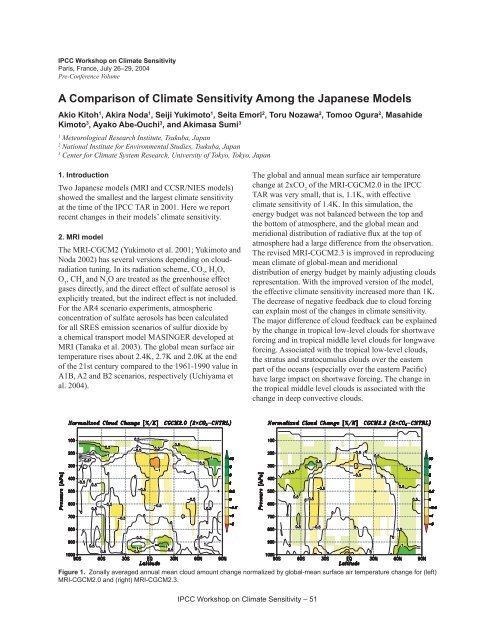
The global and annual mean surface air temperature<br />
change at 2xCO 2 <strong>of</strong> the MRI-CGCM2.0 in the IPCC<br />
TAR was very small, that is, 1.1K, with effective<br />
climate sensitivity <strong>of</strong> 1.4K. In this simulati<strong>on</strong>, the<br />
energy budget was not balanced between the top and<br />
the bottom <strong>of</strong> atmosphere, and the global mean and<br />
meridi<strong>on</strong>al distributi<strong>on</strong> <strong>of</strong> radiative flux at the top <strong>of</strong><br />
atmosphere had a large difference from the observati<strong>on</strong>.<br />
The revised MRI-CGCM2.3 is improved in reproducing<br />
mean climate <strong>of</strong> global-mean and meridi<strong>on</strong>al<br />
distributi<strong>on</strong> <strong>of</strong> energy budget by mainly adjusting clouds<br />
representati<strong>on</strong>. With the improved versi<strong>on</strong> <strong>of</strong> the model,<br />
the effective climate sensitivity increased more than 1K.<br />
The decrease <strong>of</strong> negative feedback due to cloud forcing<br />
can explain most <strong>of</strong> the changes in climate sensitivity.<br />
The major difference <strong>of</strong> cloud feedback can be explained<br />
by the change in tropical low-level clouds for shortwave<br />
forcing and in tropical middle level clouds for l<strong>on</strong>gwave<br />
forcing. Associated with the tropical low-level clouds,<br />
the stratus and stratocumulus clouds over the eastern<br />
part <strong>of</strong> the oceans (especially over the eastern Pacific)<br />
have large impact <strong>on</strong> shortwave forcing. The change in<br />
the tropical middle level clouds is associated with the<br />
change in deep c<strong>on</strong>vective clouds.<br />
Figure 1. Z<strong>on</strong>ally averaged annual mean cloud amount change normalized by global-mean surface air temperature change for (left)<br />
MRI-CGCM2.0 and (right) MRI-CGCM2.3.