2004: Electrical conductivity study of porous carbons derived from ...
2004: Electrical conductivity study of porous carbons derived from ...
2004: Electrical conductivity study of porous carbons derived from ...

You also want an ePaper? Increase the reach of your titles
YUMPU automatically turns print PDFs into web optimized ePapers that Google loves.
<strong>Electrical</strong> <strong>conductivity</strong> <strong>study</strong> <strong>of</strong> <strong>porous</strong> <strong>carbons</strong> <strong>derived</strong> <strong>from</strong> rice husk<br />
L. John Kennedy 1 , J. Judith Vijaya 2 , G. Sekaran 1*<br />
1. Department <strong>of</strong> Environmental Technology<br />
Central Leather Research Institute, Adyar, Chennai, Tamil Nadu, India.<br />
2. Department <strong>of</strong> Chemistry, Loyola Institute <strong>of</strong> Frontier Energy, Loyola College,<br />
Nungambakkam, Chennai,Tamil Nadu, India.<br />
Abstract<br />
The objective <strong>of</strong> this investigation was to evaluate the electrical <strong>conductivity</strong> <strong>of</strong><br />
activated carbon <strong>derived</strong> <strong>from</strong> rice husk (RHAC) by two-stage process. DC <strong>conductivity</strong><br />
measurements by two-probe method were determined for RHAC samples prepared at<br />
700, 800 and 900 0 C. The samples were compressed at a pressure <strong>of</strong> 75.9 kPa to 578.2kPa<br />
in a hollow glass cylinder using two metal plunges connected to a Keithley ammeter. The<br />
<strong>conductivity</strong> at room temperature was found to increase <strong>from</strong> 3.177x10 -4 δ /cm to<br />
1.99177x10 -3 δ /cm for an increase in compression pressure. Dense packing <strong>of</strong> the<br />
material, collapse <strong>of</strong> pores and decrease in air gap between the carbon particles could be<br />
the factors for increase in <strong>conductivity</strong> with compression pressures. The temperature<br />
dependent <strong>conductivity</strong> <strong>of</strong> RHAC samples was determined by compressing the sample<br />
along with metal plungers and is followed by heating in a tubular heating furnace. A Ktype<br />
thermocouple whose hot junction located in the close proximity <strong>of</strong> the specimen was<br />
used to monitor the temperature accurately. The specimen inside the furnace was heated<br />
by a microprocessor-controlled programmer up to 250 o C. The temperature dependent<br />
<strong>conductivity</strong> <strong>study</strong> conducted for the samples activated at 700, 800 and 900 0 C had<br />
revealed that energy gap value <strong>of</strong> the samples were 0.1023ev, 0.0745ev and 0.052ev<br />
respectively, determined <strong>from</strong> the linear plot <strong>of</strong> ln I versus 1/T (K -1 ). The meso <strong>porous</strong><br />
RHAC samples were characterized using electron spin resonance, FT-IR spectroscopy<br />
and X-ray diffraction for quantitative evaluation <strong>of</strong> free electrons, functional groups and<br />
crystallites to support the mechanism <strong>of</strong> electrical conduction in meso<strong>porous</strong> nonsinterable<br />
carbon samples.
1. Introduction<br />
Porous carbon materials have attracted in these recent years much <strong>of</strong> interest as<br />
they are potential candidates for large number <strong>of</strong> applications especially in catalytic<br />
supports, battery electrodes, capacitors, gas storage and biomedical engineering [1-3]. As<br />
<strong>porous</strong> <strong>carbons</strong> are mostly amorphous in nature, a little presence <strong>of</strong> sp 2 carbon structures<br />
enhances the possibility <strong>of</strong> using these carbon materials for wider applications involving<br />
electrical <strong>conductivity</strong> [4,5]. The <strong>porous</strong> carbon materials contain sp 3 carbon fractions<br />
and a considerable sp 2 carbon fractions depending upon the preparation conditions and<br />
the raw material used. The sp 2 carbon sites in the carbon materials predominantly control<br />
the electronic and transport properties [6]. The properties <strong>of</strong> carbon materials with poor<br />
crystallinity have not been explored in detail yet, despite these <strong>carbons</strong> available to<br />
application in much higher quantities than graphite. Even though the chemical<br />
applications <strong>of</strong> these materials have been investigated in recant years, the exploitation <strong>of</strong><br />
materials for physical and nonchemical application for little perhaps nil. This material has<br />
very interesting micro structures consist <strong>of</strong> the following [7] i) large density <strong>of</strong> the pores<br />
and defects, ii) dangling bonds particularly in the regions between the graphitic<br />
crystallites, iii) a large fractions <strong>of</strong> the <strong>carbons</strong> as surface atoms and iv) disordered<br />
crystallites. Because <strong>of</strong> these complexities it requires variety <strong>of</strong> experimental techniques<br />
to characterize both the surface and bulk properties. Hence we have included in one <strong>of</strong><br />
the techniques to investigate the micro structure for which the electrical properties <strong>of</strong> rice<br />
husk based <strong>porous</strong> carbon has been considered in our investigations. Rice husk based<br />
<strong>porous</strong> carbon composite material was prepared contains carbon and SiO2 as components<br />
<strong>of</strong> the material. SiO2 being a known insulator, the conduction property <strong>of</strong> RHAC is<br />
assumed to be due to carbon component <strong>of</strong> the material. Hence our <strong>study</strong> was focused on<br />
the evaluation <strong>of</strong> conduction mechanism <strong>of</strong> carbon component <strong>of</strong> the composite material.<br />
2. Experimental<br />
The <strong>porous</strong> carbon composites were prepared in the laboratory by two-stage process<br />
using rice husk as the precursor material by chemical activation method [8]. The samples
treated at three different temperatures 700, 800 and 900°C and were labeled C700, C800<br />
and C900 respectively.<br />
2.1 <strong>Electrical</strong> <strong>conductivity</strong> studies<br />
The dc electrical <strong>conductivity</strong> σ was measured at room temperature by the two-probe<br />
method. 1g <strong>porous</strong> carbon dried at 100°C over night was compressed in a hollow Pyrex<br />
glass cylinder with an inner diameter <strong>of</strong> 10 mm between two metal plungers at<br />
compression pressures ranging <strong>from</strong> 75.9 kPa to 578.2 kPa. The top and the bottom <strong>of</strong> the<br />
plungers are copper made and connected to a Keithley 2000 digital multimeter to<br />
measure the electrical <strong>conductivity</strong> <strong>of</strong> the samples.<br />
2.2 Temperature dependence <strong>conductivity</strong><br />
In order to <strong>study</strong> the temperature dependent <strong>conductivity</strong> the whole set up i.e. the sample<br />
<strong>of</strong> a known weight compressed along with the two metal plungers kept inside a tubular<br />
heating furnace. A K type thermocouple whose hot junction located in the close<br />
proximity <strong>of</strong> the specimen was used to monitor the temperature accurately. The specimen<br />
inside the furnace was heated by a microprocessor-controlled programmer up to 250°C.<br />
2.3 X-ray diffraction studies<br />
X-ray diffraction experiments were performed with a Phillips X-pert diffractometer for<br />
2θ values <strong>from</strong> 10 to 80° using CuKα radiation at a wavelength <strong>of</strong> λ = 1.540 A°. The<br />
other experimental conditions included 1/2° divergence slits, a 5-sec residence time at<br />
each step and intensity measurements in counts.<br />
2.4 FT-IR studies.<br />
A Perkin Elmer infrared spectrometer was used for the investigation <strong>of</strong> the surface<br />
function groups <strong>of</strong> the <strong>porous</strong> carbon. The carbon samples were mixed with KBr <strong>of</strong><br />
spectroscopic grade and made into pellets at a pressure <strong>of</strong> about 1 MPa. The pellets were<br />
about 10 mm in diameter and 1 mm in thickness. The samples were scanned in the<br />
spectral range <strong>of</strong> 4000 – 400 cm -1 .
2.5 ESR measurements.<br />
In the ESR measurements, Bruker IFS spectrometer was used to obtain the ESR<br />
spectrum. A small amount <strong>of</strong> carbon was loaded in the quarts tube. Vacuum was applied<br />
to remove the air <strong>from</strong> the carbon surface. An X-band microwave with a power <strong>of</strong> 1 mW<br />
and frequency <strong>of</strong> 9.771 GHz was applied to the specimen and recorded at room<br />
temperature.<br />
3. Results and Discussion<br />
3.1 <strong>Electrical</strong> Conductivity studies<br />
The conduction was ohmic in nature and the electrical <strong>conductivity</strong> was given by [9]<br />
L<br />
σ =<br />
R.<br />
A<br />
where R is the resistance (Ω), A is the area <strong>of</strong> the sample (cm 2 ) and L is the sample<br />
height (cm). The ohmic conduction at room temperature <strong>of</strong> carbon samples C700, C800<br />
and C900 at compression pressure at 75.9 kPa were 8.02 x 10 -5 , 1.5 x 10 -4 and 3.28 x 10 -4<br />
δ/cm respectively. The <strong>conductivity</strong> contributed by the silica component can be assumed<br />
to be negligible as it is a good insulator and electrical <strong>conductivity</strong> by the sample is fully<br />
assumed to be due to carbon matrix. The electrical <strong>conductivity</strong> <strong>of</strong> the sample is assumed<br />
to be controlled by compression pressure as shown in Table1. We indeed obtained a six<br />
fold increase for rise in compression pressure <strong>from</strong> 75.9 to 578.2 kPa is σ approximately<br />
3.288 x10 -4 and 2.025 x10 -3 δ /cm respectively for the sample C900 suggesting that sp 2<br />
carbon structures must be separated to allow any conduction path between these regions<br />
[10]. Upon compression the individual particles in the composite material will be<br />
breaking, refolding into more dense packing and closer contacts between different<br />
particles will be created thereby increasing the electrical <strong>conductivity</strong> [11]. It is evident<br />
form the Table 1 that the electrical <strong>conductivity</strong> at 75.9kPa is low indicating the applied<br />
pressure is not sufficient to squeeze the pores or the air gap between the carbon particles.<br />
Hence inter particle electronic conduction becomes difficult. But the electrical<br />
<strong>conductivity</strong> increased by six fold at 578.2 kPa. It is due to the easy movement <strong>of</strong><br />
electrons <strong>from</strong> one particle to another facilitated by the elimination <strong>of</strong> the air gap or<br />
porosity <strong>of</strong> the carbon by applying high pressure <strong>of</strong> compression.
These materials also seem to influence the high temperature activation energy <strong>of</strong><br />
the <strong>conductivity</strong> measured in the temperature range <strong>of</strong> 30-250 0 C. The energy gap is<br />
reproducible for the samples in the temperature range 30-250 0 C were obtained using the<br />
expression [12] I = Ioe -Eg/kT where I is the current, Eg the energy gap, k the Boltzmann<br />
constant and T the temperature. Since ln I= ln Io - Eg/kT, the plot <strong>of</strong> lnI vs 1/T gives linear<br />
curve. The energy gap value was calculated <strong>from</strong> the slope (-Eg/k). The carbon samples<br />
C700, C800, C900 exhibited increase in <strong>conductivity</strong> with increase in temperature, a<br />
characteristic feature <strong>of</strong> semiconductor. The observed Eg values for the composite<br />
samples C700, C800 and C900 were 0.123, 0.0745 and 0.0552 eV respectively. The plot<br />
<strong>of</strong> ln I vs the inverse <strong>of</strong> temperature indicates that the high temperature conduction<br />
process is thermally activated [10] with an associated activation energy. The plot <strong>of</strong> ln I<br />
vs 1/T shown in Fig.1 has two linear portions with small activation energy values thus<br />
exhibiting extrinsic semiconductor behavior. According to Robert and Schmidlen [13] the<br />
activation energy for electrical conduction in extrinsic semiconductors relates to the<br />
promotion <strong>of</strong> charge carriers <strong>from</strong> the dominant levels to the corresponding transport<br />
bands. Hence it is understood that the promotion <strong>of</strong> majority carriers takes place between<br />
the intermediate trap levels created due to impurities and interstitials as a result the<br />
composites have a lower energy gap values. The band gap width must be functions <strong>of</strong><br />
carbonized temperature as shown in Fig. 2. It is also noted that these values <strong>of</strong> Eg are<br />
quite different <strong>from</strong> those deduced <strong>from</strong> the optical gap Eo <strong>of</strong> approximately 1.5 eV for<br />
all the three carbon samples which is related to π - π * transitions <strong>of</strong> the centers <strong>of</strong><br />
gaussian π - π * bands. The variation <strong>of</strong> dc <strong>conductivity</strong> vs. inverse <strong>of</strong> the temperatures in<br />
the intermediate temperature range, 80 – 150 0 C, lnI has a T 1/4 dependence clearly as<br />
shown in Fig.3 indicating that the conduction process is rather controlled by a variable<br />
range hopping process <strong>of</strong> the charge carriers within the band edges in agreement with<br />
Mott model for disordered or amorphous <strong>carbons</strong> [14]. The <strong>conductivity</strong> <strong>of</strong> amorphous<br />
semiconductors is influenced by the presence <strong>of</strong> dangling bonds (unsaturated bonds)<br />
which give rise to mid gap states in the band gap <strong>of</strong> the amorphous semiconductors [15].<br />
The low values <strong>of</strong> Eg compared to Eo suggest that the electronic transport process<br />
is due to the transition between the localized defect band (π-π * ) states around the Fermi<br />
level. In our case the defect bands are assumed to have Gaussian distribution [10]. The
elatively low Eg value observed for C900 suggests a larger overlapping <strong>of</strong> the Gaussian<br />
π - π * bands near the Fermi level as a result <strong>of</strong> higher density <strong>of</strong> defects in the case <strong>of</strong><br />
these carbon materials. This defect density must also influence the optical gap Eo which<br />
is related to transition between the centers <strong>of</strong> Gaussian π - π * band states. The higher<br />
values <strong>of</strong> Eo (1.5eV) compared to those <strong>of</strong> Eσ (0.0522 – 0.1023 eV) indicate that in the<br />
latter case the defects concerned by this process are rather located within the π band<br />
edges around the Fermi level [16]. The energy gap decreases upon increase in heat<br />
treatment <strong>of</strong> the carbon materials suggest a higher overlapping <strong>of</strong> the localized π band<br />
states in the vicinity <strong>of</strong> EF as the proportion <strong>of</strong> the sp 2 carbon sites increase with<br />
temperature [17].<br />
Table 1.<br />
Room temperature conductivities and resistivities <strong>of</strong> for C900 at various pressures.<br />
S. No Compression Room temp Room temp<br />
pressure kPa <strong>conductivity</strong> resistivity<br />
(δ/cm) (Ω cm)<br />
1 75.9 3.288 x 10 -4<br />
3.041 x 10 3<br />
2 230.9 8.127 x 10 -4 1.230 x 10 3<br />
3 437.83 1.458 x 10 -3 6.86 x 10 2<br />
4 578.2 2.025 x 10 -3 4.937 x 10 2<br />
3.2 X-ray diffraction studies<br />
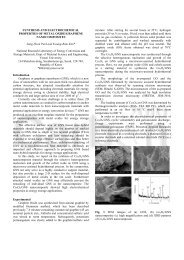
The X-ray diffraction <strong>of</strong> the carbon sample C900 shown in Fig. 4 contains a mixture <strong>of</strong><br />
amorphous and crystalline phases <strong>of</strong> silica. The peak corresponds to 2θ = 21° and 2θ =<br />
24° are identified as crystobalite and tridymite [18]. In addition a sharp peak was<br />
observed at 2θ = 26° and a very small one was at 2θ = 44° indicating the slight formation<br />
<strong>of</strong> the (002) and (100/101) planes respectively <strong>of</strong> the graphitic structure. The temperature<br />
employed for activation <strong>of</strong> the precursor material can be sited as the reason for the<br />
formation <strong>of</strong> the small graphitic structures and for the crystallization <strong>of</strong> silica. The X-ray<br />
diffraction studies were not helpful in detecting the mechanism <strong>of</strong> electronic conduction.<br />
This is probably because these characterization techniques reflect the overall structure <strong>of</strong>
the specimens and are not sensitive to a partial structural change such as rearrangement,<br />
due to charge carrier transport.<br />
3.3 FT-IR studies<br />
The infrared spectroscopic data in Fig. 5 provides information on the chemical structure<br />
<strong>of</strong> activated carbon samples. All the carbon samples show a wide band at about 3250 –<br />
3425 cm -1 due to O-H stretching mode <strong>of</strong> hexagonal groups and adsorbed water. The<br />
position and asymmetry <strong>of</strong> this band at lower wave numbers indicate the presence <strong>of</strong><br />
strong hydrogen bonds [19]. The samples C700, C800 and C900 show absorption bands<br />
due to aliphatic C-H at 2920 cm -1 . A very small peak near 1700 cm -1 is assigned to C=O<br />
stretching vibrations <strong>of</strong> ketones, aldehydes, lactones or carboxyl groups. The weak<br />
intensity <strong>of</strong> this peak for all the <strong>carbons</strong> indicates <strong>porous</strong> <strong>carbons</strong> contain a small amount<br />
<strong>of</strong> carboxyl group. The broad peak shouldered a about 1115 cm -1 and sharp peaks at 805<br />
and 475 cm -1 in the carbon samples indicate the presence <strong>of</strong> silica [20].<br />
3.4 ESR spectra<br />
Fig.6 shows the ESR spectra <strong>of</strong> the carbon C900. The ESR signal is due to the<br />
appearance <strong>of</strong> unpaired electrons during its formation [21]. The g-factor calculated is<br />
about 2.0083. Activated <strong>carbons</strong> are an ideal material for ESR measurements because <strong>of</strong><br />
a high density <strong>of</strong> localized spins is expected due to their specific structure where a high<br />
ratio <strong>of</strong> surface atoms with localized spin exist. The spectra is broad indicating a fast<br />
interaction <strong>of</strong> existing spins. It is also noted that the broadening <strong>of</strong> the ESR spectrum<br />
occurs due to a fast energy transfer <strong>from</strong> a localized spin to another spin or to the lattice<br />
[22]. In other words, charge carriers can move fast. These kind <strong>of</strong> <strong>carbons</strong> have large<br />
ratio <strong>of</strong> surface atoms with dangling bonds where the localized spin exists. The energy<br />
level <strong>of</strong> these localized electrons should be similar to that <strong>of</strong> the electrons in a free atom<br />
and thus the energy levels resulting <strong>from</strong> those localized electrons appear between the<br />
bonding levels and antibonding levels (π - π * ). Hence the high density <strong>of</strong> these extra<br />
levels play a important role in the transport properties because the energy gap between<br />
the electronic states is very small due to the high density <strong>of</strong> states (DOS), the excitation
<strong>of</strong> the localized carriers becomes so easy that a quite high <strong>conductivity</strong> is observed at<br />
normal and high temperatures.<br />
4. Conclusion<br />
The electron transport properties <strong>of</strong> the <strong>carbons</strong> prepared are investigated in detail with<br />
their microstructure. The electrical <strong>conductivity</strong>, ESR and FTIR techniques were carried<br />
out to fully characterize the carbon materials. The analysis <strong>of</strong> the variation <strong>of</strong> conduction<br />
as a function <strong>of</strong> temperature showed two different conduction process operating<br />
respectively at moderate temperatures T < 150°C and high temperatures 150 < T <<br />
250°C. The first process due to a variable range hopping mechanism in the π localized<br />
states around EF following Motts law and the second one is thermally activated<br />
associated with energy gap <strong>of</strong> 0.0522 – 0.1023 eV for the three <strong>carbons</strong>. The ESR signal<br />
<strong>of</strong> the <strong>carbons</strong> C900 is due to the defects associated with broken bonds located on carbon<br />
sites. The presence <strong>of</strong> the graphitic structure has been confirmed <strong>from</strong> the X-ray<br />
diffraction pattern the sample. The surface function groups <strong>of</strong> the different <strong>carbons</strong> were<br />
discussed.<br />
Acknowledgement<br />
The work was supported by the Council <strong>of</strong> scientific and industrial research (CSIR) <strong>of</strong><br />
India by providing financial assistance through senior research fellowship, provided to<br />
the first author.
References<br />
[1] Hamdy Farag, White hurst DD, Isao Mochida. Synthesis <strong>of</strong> active<br />
hydrosulfurization carbon supported Co-Mo catalysts. Relationship between<br />
preparation methods and activity/selectivity. Ind Eng Chem Res 1998; 37: 3533-9.<br />
[2] Quinn DF, Ragan S. Carbon suitable for medium pressure (6.9MPa) methane<br />
storage. Adsorp Sci Tech 2000; 18 (6): 515-27.<br />
[3] Elzbieta Frackowiak, Francois Beguin. Carbon materials for the electrochemical<br />
storage <strong>of</strong> energy in capacitors. Carbon 2001; 39: 937-50.<br />
[4] Robertson J. Hard amorphous (diamond- like <strong>carbons</strong>). Prog Solid State Chem<br />
1991; 21: 199 – 333.<br />
[5] Fusco G, Tagliaferro A, Milne WI, Robertson J. Diamond Relat Mater 1997; 6:<br />
783- 786.<br />
[6] Chhowala M, Robertson J, Chen CW et al. Influence <strong>of</strong> ion energy and substrate<br />
temperature on the optical and electronic properties <strong>of</strong> tetrahedral amorphous<br />
carbon. J Appl Phys 1997; 81: 139-145.<br />
[7] Manivannan A, Chirila M, Giles MC, Seetra MS. Microstructure, dangling bonds<br />
and impurities in activated <strong>carbons</strong>. Carbon 1999; 37: 1741-7.<br />
[8] Kennedy LJ, Vijaya JJ, Sekaran G. Effect <strong>of</strong> two stage process on the preparation<br />
and characterization <strong>of</strong> <strong>porous</strong> carbon composite <strong>from</strong> rice husk by phosphoric<br />
acid activation. Indus Eng Chem Res <strong>2004</strong>; 43: 1832 - 1838.<br />
[9] Dana Pantea, Hans Darmstadt, Serge Kaliaguine, Lyelia Summchen, Christian<br />
Roy. <strong>Electrical</strong> <strong>conductivity</strong> <strong>of</strong> thermal blacks. Influence <strong>of</strong> surface chemistry.<br />
Carbon 2001; 39: 1147-58.<br />
[10] Racine B, Benlahsen M, Zellama K, Bouzerrar R, Kleider JP, Von Bardeleben JP<br />
et al. Electronic properties <strong>of</strong> hydrogenated amorphous carbon film deposited<br />
using ECR-RF plasma method. Diamond Relat Mater 2001; 10: 200-6.<br />
[11] Mrozowski S. studies <strong>of</strong> carbon powders under compression I. Third Biennial<br />
Carbon Conference 1958; 495-508.<br />
[12] William Smith F. <strong>Electrical</strong> properties <strong>of</strong> Materials. Foundations <strong>of</strong> Materials<br />
Science and Engineering. 2 nd ed. Mc Graw-Hill Publication. 713-72.<br />
[13] Roberts GG, Schmidlin FW. Study <strong>of</strong> localized levels in semi-insulators by
combined measurements <strong>of</strong> thermally activated ohmic and space – charge limited<br />
conduction. Phys Rev 1969; 180: 785-94.<br />
[14] Daud WM, Badri M, Mansor H. Possible conduction mechanism in coconut –<br />
shell activated carbon. J Appl Phys 1990; 67(4): 1915-7.<br />
[15] Jen Cordelair, Peter Greil. <strong>Electrical</strong> <strong>conductivity</strong> measurements as a microprobe<br />
for structure transitions in polysiloxane <strong>derived</strong> Si-O-C ceramics. J Euro Ceram<br />
Soc 2000; 20: 1947-57.<br />
[16] Palinginis KC, Lubianiker Y, Cohen JD, Illie A, Kleinsorge B, Milne WI. Defect<br />
densities in tetrahedrally bonded amorphous carbon deduced by junctions<br />
capacitance techniques. Appl Phys Lett 1999; 74(3): 371-3.<br />
[17] Palinginis KC, Cohen JD, Illie A, Conway NMJ, Milne WI. Defect band<br />
distributions in hydrogenated tetrahedral amorphous carbon / crystalline silicon. J<br />
Non Cryst Solids 2000; 1077: 266-9.<br />
[18] Yalcin N, Sevnic V. Studies on silica obtained <strong>from</strong> rice husk. Ceram Int 2001;<br />
27: 219-24.<br />
[19] Solum MS, Pugmine RJ, Jagyoten M, Derbyshire F, Evolution <strong>of</strong> carbon<br />
structure in chemically activated wood. Carbon 1995; 33: 1247-54.<br />
[20] Liou TH, Preparation and characterization <strong>of</strong> nanostructured silica <strong>from</strong> rice<br />
husk. Mater Sci Eng (in press)<br />
[21] Stephen Trassl, Gunter Motz, Ernst Rossler, Gunter Ziegler. Characterizations <strong>of</strong><br />
the free carbon phase in precursor <strong>derived</strong> SiCN ceramics. J Non Cryst Solids<br />
2001; 293-5: 261-7.<br />
[22] Kazuyoshi Kuriyama. Electronic properties <strong>of</strong> activated carbon fibers. The<br />
Sumitomo Search 1993; 52: 149-54.
Figure 5.
Fig. 6. Electron spin resonance spectra <strong>of</strong> C900 carbon sample.