NATIONAL INSTITUTE ON DRUG ABUSE EPIDEMIOLOGIC ...
NATIONAL INSTITUTE ON DRUG ABUSE EPIDEMIOLOGIC ...
NATIONAL INSTITUTE ON DRUG ABUSE EPIDEMIOLOGIC ...

You also want an ePaper? Increase the reach of your titles
YUMPU automatically turns print PDFs into web optimized ePapers that Google loves.
<strong>NATI<strong>ON</strong>AL</strong> <strong>INSTITUTE</strong> <strong>ON</strong> <strong>DRUG</strong> <strong>ABUSE</strong><br />
<strong>EPIDEMIOLOGIC</strong> TRENDS<br />
IN <strong>DRUG</strong> <strong>ABUSE</strong><br />
Volume II<br />
Proceedings of the Community Epidemiology Work Group<br />
January 2005<br />
U.S. DEPARTMENT OF HEALTH AND HUMAN SERVICES<br />
<strong>NATI<strong>ON</strong>AL</strong> <strong>INSTITUTE</strong>S OF HEALTH<br />
Division of Epidemiology, Services and Prevention Research<br />
National Institute on Drug Abuse<br />
6001 Executive Boulevard<br />
Bethesda, Maryland 20892
The National Institute on Drug Abuse (NIDA) acknowledges<br />
the contributions made by the members<br />
of: the Community Epidemiology Work Group<br />
(CEWG) who have voluntarily invested their time and<br />
resources in preparing the reports presented at the<br />
meetings; representatives from agencies that contribute<br />
data and technical knowledge; and other researchers<br />
who participate in the meetings. This publication was<br />
prepared by MasiMax Resources, Inc., under contract<br />
number N01-DA-1-5514 from NIDA.<br />
This publication, Epidemiologic Trends in Drug Abuse,<br />
Volume II, contains papers presented and data reported<br />
National Institute on Drug Abuse<br />
NIH Publication No. 05-5282<br />
Printed October 2005<br />
ii<br />
<strong>EPIDEMIOLOGIC</strong> TRENDS IN <strong>DRUG</strong> <strong>ABUSE</strong><br />
at the January 2005 CEWG meeting by CEWG representatives<br />
from 20 areas. A paper was also submitted<br />
by Mexico. In addition, Volume II contains papers by<br />
experts on a panel on methamphetamine abuse.<br />
All material in this volume is in the public domain<br />
and may be reproduced or copied without permission<br />
from the Institute or the authors. Citation of the<br />
source is appreciated. The U.S. Government does not<br />
endorse or favor any specific commercial product.<br />
Trade or proprietary names appearing in this publication<br />
are used only because they are considered essential<br />
in the context of the studies reported herein.<br />
For more information about the Community Epidemiology Work Group and other research-based<br />
publications and information on drug abuse and addiction, visit NIDA’s<br />
Web site at: http://www.drugabuse.gov<br />
Both Volumes I and II (available in limited supply) can be obtained by contacting the<br />
National Clearinghouse for Alcohol and Drug Information<br />
by mail: P.O. Box 2345, Rockville, MD 20852-2345<br />
by phone: (301) 468-2600<br />
(800) 729-6686<br />
by fax: (301) 468-6433<br />
Proceedings of the Community Epidemiology Work Group, Vol. II, January 2005
Foreword<br />
This publication includes papers presented at the 57th<br />
semiannual meeting of the Community Epidemiology<br />
Work Group (CEWG) held in Long Beach, California,<br />
on January 26–28, 2005, under the sponsorship of the<br />
National Institutes of Health, National Institute on<br />
Drug Abuse (NIDA). The CEWG is composed of researchers<br />
from 21 sentinel areas in the Nation who<br />
meet semiannually to present data on drug abuse patterns<br />
and trends in their areas. CEWG members have<br />
extensive knowledge and experience in community<br />
research and their local communities. Members are<br />
also informed and have extensive knowledge about the<br />
drug literature, drugs of abuse, drug-abusing populations,<br />
the social and health consequences of drug<br />
abuse, drug trafficking patterns, and emerging drug<br />
problems within and across communities.<br />
As part of the CEWG’s monitoring role, members<br />
continue their research between meetings, using the<br />
Internet, conference calls, and mailings to alert one<br />
another to new issues and to follow up on issues and<br />
emerging drug patterns identified at meetings. Issues<br />
identified are often added to the agenda of the subsequent<br />
CEWG meeting.<br />
At the January 2005 meeting, CEWG members presented<br />
recent findings on the abuse of stimulants and<br />
<strong>EPIDEMIOLOGIC</strong> TRENDS IN <strong>DRUG</strong> <strong>ABUSE</strong>—Foreword<br />
other drugs. Four other researchers presented data<br />
from NIDA-supported studies in a panel on methamphetamine<br />
abuse.<br />
Three technical experts participated in a panel focused<br />
on Exploring the Internet as a Potential Tool<br />
for Monitoring Drug Abuse Trends.<br />
Also at the meeting, a Canadian researcher reported<br />
recent survey data from Canada’s drug abuse surveillance<br />
system. In addition, an official from the Mexican<br />
Ministry of Health provided an update on drug<br />
abuse patterns and trends in Mexico, based on data<br />
produced by Mexico’s drug abuse surveillance system.<br />
Information reported at each CEWG meeting is disseminated<br />
to drug abuse prevention and treatment<br />
agencies, public health officials, researchers, and policymakers.<br />
The information is intended to alert authorities<br />
at the local, State, regional, and national levels and<br />
the general public to current drug abuse patterns and<br />
trends and emerging drug problems so that appropriate<br />
and timely action can be taken. Researchers also use<br />
this information to develop research hypotheses that<br />
might explain social, behavioral, and biological issues<br />
related to drug abuse.<br />
Moira P. O’Brien<br />
Division of Epidemiology, Services and Prevention Research<br />
National Institute on Drug Abuse<br />
National Institutes of Health<br />
Department of Health and Human Services<br />
Proceedings of the Community Epidemiology Work Group, Vol. II, January 2005 iii
Contents<br />
<strong>EPIDEMIOLOGIC</strong> TRENDS IN <strong>DRUG</strong> <strong>ABUSE</strong>—Contents<br />
Foreword............................................................................................................................................................ iii<br />
Introduction....................................................................................................................................................... 1<br />
CEWG Roles and Functions ............................................................................................................................ 2<br />
EPIDEMIOLOGY OF <strong>DRUG</strong> <strong>ABUSE</strong>: CEWG AREA PAPERS<br />
Atlanta: Drug Trends in Metropolitan Atlanta<br />
Brian J. Dew, Ph.D., Kathy S. Newton, M.S., Kirk Elifson, Ph.D.,and Claire Sterk, Ph.D................. 7<br />
Baltimore: Drug Use in the Baltimore Metropolitan Area: Epidemiology<br />
and Trends, 2000–2004 (First Half)<br />
Leigh A. Henderson, Ph.D., and Doren H. Walker, M.S...................................................................... 19<br />
Boston: Patterns and Trends in Drug Abuse: Greater Boston<br />
Daniel P. Dooley .................................................................................................................................. 37<br />
Chicago: Patterns and Trends of Drug Abuse in Chicago<br />
Dita Broz, M.P.H., Matthew Magee, Wayne Wiebel, Ph.D.,<br />
and Lawrence Ouellet, Ph.D. ............................................................................................................... 51<br />
Denver: Patterns and Trends in Drug Abuse: Denver and Colorado<br />
Nancy E. Brace, R.N., M.A................................................................................................................... 64<br />
Honolulu: Illicit Drug Use in Honolulu and the State of Hawaii<br />
D. William Wood, M.P.H., Ph.D. ......................................................................................................... 83<br />
Los Angeles: A Semiannual Update of Drug Abuse Patterns and Trends<br />
in Los Angeles County, California<br />
Beth Finnerty, M.P.H. .......................................................................................................................... 96<br />
Miami: Drug Abuse in South Florida: January–June 2004<br />
James N. Hall and Madeline Camejo, Pharm.D. ................................................................................ 121<br />
Minneapolis/St. Paul: Drug Abuse Trends in Minneapolis/St. Paul<br />
Carol Falkowski .................................................................................................................................. 136<br />
Newark: Drug Abuse in the Newark Primary Metropolitan Statistical Area<br />
Allison S. Gertel-Rosenberg, M.S.. ...................................................................................................... 145<br />
New Orleans: Drug Abuse Indicators in New Orleans<br />
Gail Thornton-Collins .......................................................................................................................... 155<br />
New York City: Drug Use Trends in New York City<br />
Rozanne Marel, Ph.D., John Galea, M.A., and Robinson B. Smith, M.A. ........................................... 163<br />
Philadelphia: Drug Use in Philadelphia, Pennsylvania<br />
Samuel J. Cutler and Marvin F. Levine, M.S.W................................................................................... 182<br />
Phoenix: Drug Abuse Trends in Phoenix and Arizona<br />
Ilene L. Dode, Ph.D.............................................................................................................................. 194<br />
St. Louis: Patterns and Trends in Drug Abuse in St. Louis<br />
Heidi Israel, Ph.D., R.N., L.C.S.W., and Jim Topolski, Ph.D. ............................................................. 211<br />
Proceedings of the Community Epidemiology Work Group, Vol. II, January 2005 v
<strong>EPIDEMIOLOGIC</strong> TRENDS IN <strong>DRUG</strong> <strong>ABUSE</strong>—Contents<br />
San Diego: Drug Abuse Patterns and Trends in San Diego County, California<br />
Michael Ann Haight, M.A. .................................................................................................................. 220<br />
San Francisco: Patterns and Trends of Drug Use in the San Francisco Bay Area<br />
John A. Newmeyer, Ph.D...................................................................................................................... 227<br />
Seattle: Recent Drug Abuse Trends in the Seattle-King County Area<br />
Caleb Banta-Green, T. Ron Jackson, Susan Kingston, Michael Hanrahan, Steve Freng,<br />
David H. Albert, Ann Forbes, and Kris Nyrop .................................................................................... 235<br />
Texas: Substance Abuse Trends in Texas, January 2005<br />
Jane Carlisle Maxwell, Ph.D. .............................................................................................................. 260<br />
Washington, D.C.: Patterns and Trends of Drug Abuse in Washington, DC<br />
Erin Artigiani, M.A., Margaret Hsu, M.P.H., and Eric Wish, Ph.D....................................................<br />
INTER<strong>NATI<strong>ON</strong>AL</strong> REPORT<br />
Update of the Epidemiological Surveillance System of Addictions (SISVEA) in Mexico:<br />
January–June 2004<br />
Roberto Tapia-Conyer, Patricia Cravioto, Pablo Kuri, Mario Cortés, and Fernando Galván.......... 305<br />
PANEL <strong>ON</strong> METHAMPHETAMINE <strong>ABUSE</strong>: NIDA-SUPPORTED RESEARCH STUDIES<br />
Natural History of Methamphetamine Abuse and Long-Term Consequences<br />
Mary-Lynn Brecht, Ph.D...................................................................................................................... 319<br />
Prenatal Exposure to Methamphetamine and Child Development<br />
Barry Lester, Ph.D., Linda LaGasse, Ph.D., Lynne M. Smith, M.D.,<br />
Chris Derauf, M.D., Penny Grant, M.D., Rizwan Shah, M.D., Amelia Arria, Ph.D.,<br />
Marilyn Huestis, Ph.D.,and Jing Liu, Ph.D. 1 ....................................................................................... 320<br />
Evidence-Based Approaches for Addressing Methamphetamine Use Among Gay Urban Males<br />
Cathy J. Reback, Ph.D. ........................................................................................................................ 322<br />
Predicting Relapse in Methamphetamine-Dependent Individuals<br />
Martin P. Paulus, M.D. ....................................................................................................................... 324<br />
APPENDIX A<br />
New Drug Abuse Warning Network (DAWN) Emergency Department Data<br />
and DAWN Live!: Major Features ................................................................................................................ 329<br />
PARTICIPANTS<br />
Participant List ................................................................................................................................................. 333<br />
vi<br />
289<br />
Proceedings of the Community Epidemiology Work Group, Vol. II, January 2005
Introduction<br />
Moira P. O’Brien, NIDA<br />
This publication includes papers based on information<br />
and findings on drug abuse that were presented<br />
at the January 2005 Community Epidemiology Work<br />
Group meeting in Long Beach, California.<br />
The papers of the CEWG representatives provide the<br />
most recent indicator data on a range of abused drugs<br />
from 20 geographically dispersed areas in the Nation,<br />
with special attention devoted to the major theme of<br />
the January meeting––stimulant abuse.<br />
Over several years, CEWG monitoring efforts led to<br />
concern about two central nervous system (CNS)<br />
stimulants––cocaine and methamphetamine. There<br />
were continued reports of increases in methamphetamine<br />
abuse in some areas and high levels of<br />
cocaine abuse in many CEWG areas. From indicator<br />
trends, it was clear that methamphetamine abuse had<br />
been prominent in the West and Southwest for many<br />
years; from the more recent trends, there appeared to<br />
be a gradual spread of methamphetamine abuse into<br />
the Midwest and areas further east and south in the<br />
United States. Cocaine persisted as a major abused<br />
drug, maintaining a prominent position in the drug<br />
abuse indicators, including treatment admissions<br />
data. Indicators of methylphenidate (Ritalin) appeared<br />
infrequently over time. Methylenedioxymethamphetamine<br />
(or ecstasy), which may be classified<br />
as a hallucinogen, also acts as a CNS stimulant. Indicator<br />
data, however, suggest the use of this drug has<br />
been declining in most CEWG areas.<br />
Given the concern regarding the higher abuse levels<br />
of cocaine and methamphetamine compared to other<br />
stimulant drugs, CEWG representatives devoted<br />
much of their preparation for meeting presentations<br />
and papers to data on these two stimulant drugs. In<br />
addition, colleagues from Mexico provided a comparative<br />
perspective on the problems of cocaine and<br />
methamphetamine abuse in Mexico. The contributions<br />
of the CEWG members and Mexican researchers<br />
on cocaine and methamphetamine abuse are reflected<br />
in their papers in this publication.<br />
Also in this publication are papers summarizing findings<br />
from a special panel on methamphetamine abuse.<br />
<strong>EPIDEMIOLOGIC</strong> TRENDS IN <strong>DRUG</strong> <strong>ABUSE</strong>—Introduction<br />
These papers focus on the natural history of methamphetamine<br />
abuse, long-term consequences, effects of<br />
prenatal exposure, and issues associated with the<br />
treatment of methamphetamine abuse. This panel continued<br />
a precedent begun in June 2003, in which a particular<br />
emerging/current drug abuse trend is examined<br />
in greater depth than is possible through CEWG area<br />
reports. The approach draws on NIDA-supported research<br />
and complements CEWG findings.<br />
Of note to readers is the fact that 15 CEWG members<br />
reported emergency room data for the first time from<br />
the redesigned Drug Abuse Warning Network<br />
(DAWN). Since the inception of the CEWG, DAWN<br />
has been an important source of data. The major<br />
changes were instituted in DAWN at the beginning of<br />
2003 and altered virtually every feature of DAWN<br />
except its name. As a result of the redesign, new<br />
DAWN data cannot be compared with DAWN ED<br />
data from 2002 and before. Interim national estimates<br />
of drug-related emergency department visits from the<br />
new DAWN for 2003 have been published<br />
(). There are, however,<br />
no metropolitan area estimates available for 2003 or<br />
2004. For the papers presented in this publication,<br />
CEWG representatives accessed preliminary raw data<br />
from the online real-time query system called DAWN<br />
Live!, which is limited to authorized users.<br />
Accessing DAWN Live! data, CEWG members reported<br />
raw and unweighted reports of individual<br />
cases from participating hospitals, not populationbased<br />
estimates as have been presented in previous<br />
CEWG reports. CEWG area representatives have<br />
been granted access to DAWN Live! and have been<br />
trained in its use. A session during the January 2005<br />
meeting was devoted to a discussion of the potential<br />
for meaningfully incorporating data from this realtime,<br />
raw data into the CEWG. A brief description of<br />
the new DAWN ED system and DAWN Live! is included<br />
in Appendix A.<br />
In the next section, the roles and functions of the<br />
CEWG are described briefly. Papers of the CEWG<br />
representatives, the Mexican researchers, and the<br />
methamphetamine panel members follow.<br />
Proceedings of the Community Epidemiology Work Group, Vol. II, January 2005 1
2<br />
<strong>EPIDEMIOLOGIC</strong> TRENDS IN <strong>DRUG</strong> <strong>ABUSE</strong>—CEWG Roles and Functions<br />
CEWG Roles, Functions, and Attributes<br />
Role of the CEWG<br />
At semiannual meetings and through ongoing communication<br />
via e-mail, conference calls, and mailings of<br />
relevant data, the CEWG serves as a unique epidemiologic<br />
surveillance network to inform drug abuse prevention<br />
and treatment agencies, public health officials,<br />
policymakers, researchers, and the general public about<br />
current and emerging drug abuse patterns. The informa-<br />
San Francisco<br />
Los Angeles<br />
San Diego<br />
Honolulu<br />
Seattle<br />
Phoenix<br />
The Functions of the CEWG Meetings<br />
Denver<br />
The interactive semiannual meetings are a major and<br />
distinguishing feature of the CEWG. The meetings<br />
provide a foundation for continuity in the monitoring<br />
and surveillance of current and emerging drug problems<br />
and related health consequences. Through the<br />
interactive sessions, the CEWG accomplishes the following:<br />
• Dissemination of the most up-to-date information<br />
on drug abuse patterns and trends in each CEWG<br />
area<br />
• Identification of changing drug abuse patterns and<br />
trends within and across CEWG areas<br />
• Planning for followup on identified problems and<br />
emerging drug abuse patterns<br />
Minneapolis/<br />
St. Paul<br />
Texas<br />
tion is disseminated quickly to alert authorities at the<br />
local, State, regional, and national levels to current and<br />
emerging drug problems so that appropriate action can<br />
be taken. Researchers use the information to develop<br />
research hypotheses that might explain social, behavioral,<br />
and biological issues related to drug abuse.<br />
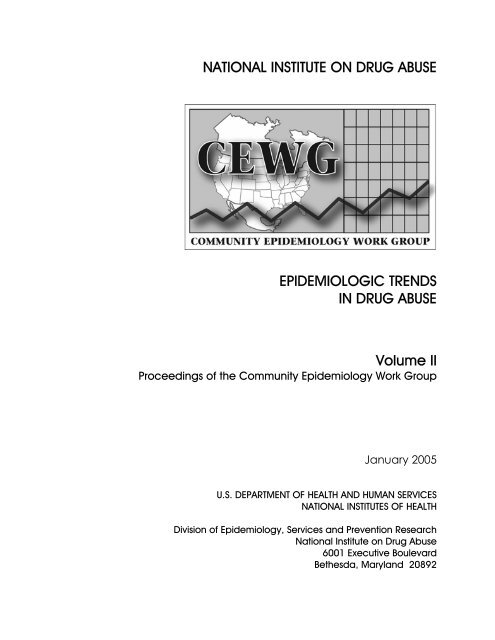
The 21 areas currently represented by the CEWG are<br />
depicted in the map below.<br />
St. Louis<br />
Detroit<br />
Philadelphia<br />
Chicago<br />
New Orleans<br />
Atlanta<br />
Miami<br />
Boston<br />
New York<br />
Newark<br />
Baltimore<br />
Washington, DC<br />
Presentations by each CEWG member include a compilation<br />
of quantitative drug abuse indicator data.<br />
Members go beyond publicly accessible data and provide<br />
a unique local perspective gained from both public<br />
records and qualitative research. This information is<br />
typically obtained from local substance abuse treatment<br />
providers and administrators, personnel of other<br />
health-related agencies, law enforcement officials, and<br />
drug abusers. Time at each meeting is devoted to presentations<br />
by invited speakers.<br />
Identification of changing drug abuse patterns is<br />
part of the interactive discussions at each CEWG<br />
meeting. Through this process, members alert one<br />
another to the emergence of a potentially new drug<br />
of abuse that may spread from one area to another.<br />
In this role, the CEWG has pioneered in identifying<br />
the emergence of drug epidemics and patterns of<br />
abuse, such as those involving abuse of methaqualone<br />
(1979), crack (1983), methamphetamine (1983), and<br />
Proceedings of the Community Epidemiology Work Group, Vol. II, January 2005
“blunts” (1993). MDMA abuse indicators were first<br />
reported by CEWG members in December 1985.<br />
Planning for followup on issues and problems identified<br />
at a meeting is initiated during discussion sessions,<br />
with post-meeting planning continuing through<br />
e-mails and conference calls. Post-meeting communications<br />
assist in formulating agenda items for a subsequent<br />
meeting, and they also raise new issues for<br />
exploration at the following meeting.<br />
Attributes of the CEWG<br />
CEWG members bring the following attributes to the<br />
network:<br />
• Extensive experience in community research,<br />
which over many years has fostered information<br />
sharing between members and local agencies<br />
• Knowledge about their local communities, drugs,<br />
and drug-abusing populations; the social and<br />
<strong>EPIDEMIOLOGIC</strong> TRENDS IN <strong>DRUG</strong> <strong>ABUSE</strong>—CEWG Roles and Functions<br />
health consequences of drug abuse; drug trafficking<br />
and other law enforcement patterns; and<br />
emerging drugs within and across communities<br />
• Ongoing collaborative relationships with one another<br />
and other researchers and experts in the<br />
field, which allows for both learning about new issues<br />
and sharing information<br />
• The capability to access relevant drug-related data<br />
from the literature, media, and Federal, State,<br />
community, and neighborhood sources<br />
• An understanding of the strengths and limitations<br />
of each data source<br />
• The skills required to systematically analyze and<br />
synthesize multiple sources of information, and<br />
interpret findings within the community context<br />
Major indicators and primary quantitative data sources<br />
used by CEWG members are cited in their reports.<br />
Proceedings of the Community Epidemiology Work Group, Vol. II, January 2005 3
Epidemiology<br />
of<br />
Drug<br />
Abuse:<br />
CEWG<br />
Area<br />
Papers
<strong>EPIDEMIOLOGIC</strong> TRENDS IN <strong>DRUG</strong> <strong>ABUSE</strong>—Atlanta<br />
Drug Trends in Metropolitan Atlanta<br />
Brian J. Dew, Ph.D., Kathy S. Newton, M.S., Kirk Elifson, Ph.D., 1 and Claire Sterk, Ph.D. 2<br />
ABSTRACT<br />
Drug abuse indicators showed that cocaine/crack<br />
remained a primary drug of abuse in Atlanta during<br />
2004, with the drug dominant in (unweighted) ED<br />
reports, treatment admissions, and seized items analyzed<br />
by NFLIS. Marijuana use was widespread as<br />
well, with the drug accounting for 22 percent of public<br />
treatment admissions. This proportion, however,<br />
was lower than in previous years. Methamphetamine<br />
abuse appeared to be increasing, with treatment admissions<br />
continuing to rise faster than for any other<br />
classification of drug. Admissions for methamphetamine<br />
remained low, at 8 percent, however, compared<br />
to admissions for other drugs. Heroin indicators continued<br />
to reflect low levels of use of this drug in the<br />
metropolitan Atlanta area.<br />
INTRODUCTI<strong>ON</strong><br />
Area Description<br />
The metropolitan Atlanta area is located in the<br />
northwest corner of Georgia and includes 20 of the<br />
State’s 159 counties. The metropolitan area comprises<br />
more than 6,100 square miles, or 10.5 percent<br />
of Georgia’s total size. Currently, Georgia is the 10th<br />
most populous State in the Nation. From April 2000<br />
to July 2002, the State’s population grew 4.6 percent,<br />
ranking fourth among all States.<br />
With an estimated 4.4 million residents, the metropolitan<br />
Atlanta area includes nearly 52 percent of the<br />
State’s total population of nearly 8.4 million residents<br />
(U.S. Bureau of the Census, 2003). The Atlanta metropolitan<br />
area ranks ninth among the Nation’s major<br />
population centers. The city of Atlanta, with a population<br />
of approximately 369,000, represents 8.2 percent<br />
of the overall metropolitan population (American<br />
Community Survey, 2003). The city is divided<br />
into two counties, Fulton County and DeKalb<br />
County, which include 18.8 and 15.9 percent of the<br />
metropolitan population, respectively.<br />
There are demographic differences between the city<br />
of Atlanta and the larger metropolitan area, which<br />
more closely reflects the State as a whole. African-<br />
Americans are the largest ethnic group within the city<br />
(60 percent), followed by Whites (37 percent), Hispanics<br />
(6 percent), and Asians (2 percent). When<br />
examining the overall metropolitan Atlanta area,<br />
those numbers reverse. Whites account for the majority<br />
(62.5 percent), followed by African-Americans<br />
(29 percent), Hispanics (7.9 percent), and Asians (3.7<br />
percent). Per capita family income in 2003 for the<br />
city of Atlanta was higher at $32,635 than in the metropolitan<br />
area, at $26,145. The poverty rate inside the<br />
city is 24 percent, compared with only 9.6 percent in<br />
the metropolitan area. The housing vacancy rate outside<br />
the city (8.9 percent) is much lower than in the<br />
city (17.5 percent).<br />
In fiscal year (FY) 2004, the Georgia Bureau of Investigation<br />
(GBI)’s statewide drug enforcement efforts<br />
were led by 3 regional drug offices and 13 multijurisdictional<br />
task force programs. As a result of<br />
these combined efforts, 2,979 drug offenders were<br />
arrested. As of December 2004, there were 23 existing<br />
drug courts in Georgia (of these, 13 were for<br />
adult felony drug offenses, 3 were for adult misdemeanor<br />
drug offenses, and 7 were for juvenile drug<br />
offenses). One adult felony drug court was located in<br />
Atlanta. In 2004, 34 percent of those on probation in<br />
Georgia, 19 percent of prisoners, and 37 percent of<br />
parolees had been convicted of a drug-related offense.<br />
Additional factors that influence substance use in the<br />
State are as follows:<br />
• Georgia is both a final destination point for drug<br />
shipments and a smuggling corridor for drugs<br />
transported along the east coast. Extensive interstate<br />
highway, rail, and bus transportation networks,<br />
as well as international, regional, and private<br />
air and marine ports of entry, serve the State.<br />
• The State is strategically located on the I-95 corridor<br />
between New York City and Miami, the<br />
key wholesale-level drug distribution centers on<br />
the east coast and major drug importation hubs.<br />
In addition, Interstate Highway 20 runs directly<br />
into Georgia from drug entry points along the<br />
southwest border and gulf coast.<br />
1Brian 1Brian J. Dew, Kathy S. Newton, and Kirk Elifson are affiliated with Georgia State University in Atlanta, Georgia.<br />
2 Claire Sterk is affiliated affiliated with with Emory University University in in Atlanta, Atlanta, Georgia. Georgia.<br />
Proceedings of the Community Epidemiology Work Group, Vol. II, January 2005 7
• The city of Atlanta has become an important<br />
strategic point for drug trafficking organizations<br />
as it is the largest city in the South. It is considered<br />
a convenient nexus for all east/west and<br />
north/south travel. The city’s major international<br />
airport also serves as a distribution venue for illicit<br />
substances.<br />
• The entire State, Atlanta in particular, has experienced<br />
phenomenal growth over the last several<br />
years, with a corresponding increase in drug crime<br />
and violence. With Georgia bordering North<br />
Carolina, South Carolina, Tennessee, Alabama,<br />
and Florida, Atlanta is the base for several major<br />
dealers who maintain trafficking cells in these<br />
States, especially Mexican-based traffickers who<br />
hide within legitimate Hispanic enclaves.<br />
Data Sources<br />
Principal data sources for this report include the following:<br />
• Emergency department (ED) data for January<br />
through October 2004 were accessed through the<br />
Drug Abuse Warning Network (DAWN) Live! restricted-access<br />
online query system, which is administered<br />
by the Office of Applied Studies<br />
(OAS), Substance Abuse and Mental Health Services<br />
Administration (SAMHSA). Thirty of the<br />
33 eligible hospitals in the Atlanta metropolitan<br />
area are in the DAWN sample. There are 3 more<br />
EDs than hospitals in the sample, bringing the total<br />
number of EDs to 33. The data reported in this<br />
paper were not complete. During the 10-month<br />
period, between 18 and 19 EDs reported data to<br />
DAWN each month. The data in this paper were<br />
updated by OAS on January 17, 2005; they are<br />
unweighted and are not estimates for the Atlanta<br />
area. Since all DAWN cases are reviewed for<br />
quality control, and may be corrected or deleted,<br />
the data reported here are subject to change. The<br />
information derived from DAWN Live! represent<br />
drug reports in drug-related visits; reports exceed<br />
the number of ED visits because a patient may report<br />
use of multiple drugs (up to six drugs and alcohol<br />
may be represented in DAWN). These data<br />
cannot be compared with DAWN data from 2002<br />
and before, nor can these preliminary data be used<br />
for comparison with future data. Only weighted<br />
ED data released by SAMHSA can be used for<br />
trend analysis. A full description of the DAWN<br />
system can be found at the DAWN Web site<br />
.<br />
• Drug abuse treatment program data are from<br />
the Georgia Department of Human Resources for<br />
8<br />
<strong>EPIDEMIOLOGIC</strong> TRENDS IN <strong>DRUG</strong> <strong>ABUSE</strong>—Atlanta<br />
primary drugs of abuse among clients admitted<br />
to Atlanta’s public drug treatment programs between<br />
January and June 2004. Data for nonmetropolitan<br />
Atlanta counties of Georgia were<br />
also reported.<br />
• Drug price, purity, and trafficking data are<br />
from the Drug Enforcement Administration<br />
(DEA), the National Drug Intelligence Center<br />
(NDIC), and the Office of National Drug Control<br />
Policy (<strong>ON</strong>DCP). Information for 2004 on the<br />
price, purity, and source of several drugs was<br />
provided by the DEA’s Domestic Monitoring<br />
Program (DMP). Additional information came<br />
from Narcotics Digest Weekly published by the<br />
NDIC. Other data are from the Atlanta High Intensity<br />
Drug Trafficking Area (HIDTA) Task<br />
Force, a coordination unit for drug-related Federal,<br />
State, and local law enforcement agencies.<br />
• Forensic drug analysis data are from the National<br />
Forensic Laboratory Information System<br />
(NFLIS) and represent evidence in suspected<br />
drug cases throughout metropolitan Atlanta that<br />
were tested by the GBI Forensic Laboratory from<br />
October 2003 through September 2004.<br />
• Ethnographic information was collected from<br />
local drug use researchers and is used for several<br />
purposes: (1) to corroborate the epidemiologic<br />
drug indicators, (2) to signal potential drug<br />
trends, and (3) to place the epidemiologic data in<br />
a social context.<br />
• Acquired immunodeficiency syndrome (AIDS)<br />
data are from the Department of Human Resources<br />
and represent AIDS cases in Georgia and<br />
a 20-county Atlanta metropolitan from January<br />
1981 through August 2004. Additional information<br />
was provided by the Centers for Disease Control<br />
and Prevention (CDC).<br />
<strong>DRUG</strong> <strong>ABUSE</strong> PATTERNS AND TRENDS<br />
Cocaine/Crack<br />
With 4,582 unweighted ED reports accessed from<br />
DAWN Live! for January through October 2004, cocaine<br />
was the most frequent illicit drug reported in<br />
the metropolitan Atlanta area (exhibit 1). Cocaine ED<br />
reports were higher among men than women (exhibit<br />
2), with a ratio of 2.4:1. The cocaine ED reports involved<br />
765 White patients, 2,804 African-Americans,<br />
55 Hispanics, and 958 patients of unknown race/ethnicity.<br />
Cocaine ED reports representing patients between<br />
the ages of 35 and 54 totaled 3,041 (67 percent<br />
Proceedings of the Community Epidemiology Work Group, Vol. II, January 2005
of all ED reports). Exhibit 3 shows the unweighted<br />
number of DAWN cocaine reports in 2004 by month.<br />
From January through June 2004, cocaine continued<br />
to be the primary drug of choice for individuals seeking<br />
assistance at publicly funded treatment centers in<br />
metropolitan Atlanta. However, the number of primary<br />
admissions in metropolitan Atlanta for cocaine<br />
(n=1,756) in this period reflects a leveling off of a 2year<br />
trend that represented a lower percentage of cocaine-related<br />
admissions. From 2000 to 2002, approximately<br />
one-half of all treatment admissions in<br />
metropolitan Atlanta were cocaine related. In 2003,<br />
this percentage decreased to 40 percent, and in the<br />
first 6 months of 2004, cocaine-related admissions<br />
remained at 40 percent of all admissions. The ratio of<br />
men to women in treatment for cocaine was 1.37:1, a<br />
proportion that was considerably lower than the<br />
1.65:1 found in 2003. Approximately three-fourths of<br />
cocaine admissions in metropolitan Atlanta were African-Americans.<br />
The other fourth were mainly<br />
Whites, with Hispanics representing nearly 1 percent.<br />
This distribution across racial/ethnic groups in 2004<br />
was nearly identical to the demographics of admissions<br />
for cocaine in metropolitan Atlanta from the<br />
previous year. Whites accounted for a larger proportion<br />
of statewide cocaine treatment admissions outside<br />
metropolitan Atlanta. Whites represented 45<br />
percent of the treatment population outside the Atlanta<br />
area, and African-Americans represented 55<br />
percent. Non-metropolitan Atlanta cocaine admissions,<br />
however, increased by 26.4 percent in the first<br />
6 months of 2004. In this same period, those older<br />
than 35 accounted for the largest number of nonmetropolitan<br />
cocaine admissions (n=3,677). In Atlanta,<br />
there was a 31-percent increase in admissions<br />
among those age 18–25 and an 18-percent increase in<br />
admissions among those age 26–34 from January to<br />
June 2004. In the first half of 2004, fewer Atlanta<br />
cocaine admissions used the drug orally, and there<br />
was an 11-percent increase in injection as a preferred<br />
route of cocaine administration. Smoking continued<br />
to be the most preferred route; it was reported by<br />
nearly 76 percent of those admitted for cocaine<br />
treatment.<br />
According to the DEA and Atlanta HIDTA, cocaine<br />
remains readily available in Atlanta. Atlanta is a<br />
growing distribution hub for surrounding States and<br />
Europe. Atlanta also serves as part of a smuggling<br />
corridor along the east coast. Powder cocaine and<br />
crack dominate the Georgia drug scene. The primary<br />
sources for cocaine are Texas and California. HIDTA<br />
intelligence analysts implicate Mexico-based drug<br />
trafficking organizations, whose members blend<br />
within enclaves of Hispanic workers. According to<br />
<strong>EPIDEMIOLOGIC</strong> TRENDS IN <strong>DRUG</strong> <strong>ABUSE</strong>—Atlanta<br />
HIDTA and NDIC, prices remain relatively stable in<br />
Atlanta. Powdered cocaine typically sells for $75–<br />
$100 per gram. Crack rocks sell for as little as $3. In<br />
2003, members of the Atlanta HIDTA Task Force<br />
seized 186.69 kilograms of powdered cocaine and<br />
7.56 kilograms of crack cocaine. Both quantities were<br />
similar to what was seized in 2002.<br />
The Georgia Threat Assessment (DEA 2003) reports<br />
that other than marijuana, crack is the most widely<br />
available drug in the city. Officials estimate that 75<br />
percent of all drug-related arrests involve crack cocaine.<br />
However, crack has become more difficult for<br />
undercover officers to purchase, and it seems to have<br />
decreased somewhat in popularity. Powder cocaine<br />
availability at the retail level in Georgia is limited,<br />
except in large cities such as Atlanta. NFLIS reported<br />
that cocaine accounted for approximately 40 percent<br />
of confiscated substances in suspected drug cases that<br />
were tested in forensic laboratories between October<br />
2003 and September 2004 (exhibit 4).<br />
Heroin<br />
The indicators of heroin use in Atlanta are mixed.<br />
However, ethnographic data obtained through corroboration<br />
with local street outreach workers suggests<br />
that heroin use is increasing.<br />
The preliminary unweighted data accessed through<br />
DAWN Live! show that the number of ED reports of<br />
heroin from January through October 2004 (n=413)<br />
was less than the number of reports for cocaine, marijuana,<br />
methamphetamine, and benzodiazepines (exhibit<br />
1). A sizeable majority of the heroin ED reports<br />
involved males (exhibit 2), with a 3.6:1 male-tofemale<br />
ratio. Heroin ED reports involving African-<br />
Americans exceeded those for Whites (1.6:4). The<br />
ED heroin reports involving Hispanics hovered<br />
around 1 percent (n=5). More than one-half of all the<br />
heroin reports represented patients between 35 and 54<br />
years of age (n=230). Twelve percent of reports involved<br />
patients age 18–24. The reasons for contact<br />
with the emergency departments tended to be seeking<br />
detoxification or mental status concerns. Data on visit<br />
characteristics show that 21 percent of Atlanta heroin-involved<br />
ED patients were referred to detox/treatment<br />
(compared with 13 percent nationally),<br />
and 19 percent were admitted to psychiatric or other<br />
inpatient units (similar to the national percentage).<br />
Although injection was by far the most frequent route<br />
of heroin administration, approximately 10 percent of<br />
heroin-involved patients with a documented route of<br />
administration reported inhaling, sniffing, or snorting<br />
their heroin. As shown in exhibit 3, heroin ED reports<br />
peaked in July 2004 at 57.<br />
Proceedings of the Community Epidemiology Work Group, Vol. II, January 2005 9
In the first 6 months of 2004, treatment admissions<br />
for individuals who reported heroin as their primary<br />
drug of choice accounted for 2.5 percent of all treatment<br />
admissions in the State of Georgia; these admissions<br />
were mostly concentrated in metropolitan<br />
regions. Nearly 6 percent of metropolitan Atlanta<br />
admissions were for heroin, as compared to 1.4 percent<br />
in non-metropolitan areas. Admission rates for<br />
men were double those of women in metropolitan<br />
regions, with a non-metropolitan male-to-female ratio<br />
of 1.9:1. Whites outnumbered African-Americans<br />
(126 to 118) in metropolitan Atlanta treatment admissions,<br />
continuing an 18-month trend that began in<br />
January 2003. Outside of metropolitan Atlanta,<br />
Whites accounted for an overwhelmingly high percentage<br />
(87 percent) of heroin-related treatment admissions,<br />
followed by African-Americans (9 percent)<br />
and Hispanics (1.6 percent). A significant majority of<br />
heroin treatment admissions in both metropolitan (79<br />
percent) and non-metropolitan (75 percent) Atlanta<br />
were age 35 and older, as in previous reporting periods.<br />
While treatment admissions for heroin are relatively<br />
low for those younger than 35, it is important<br />
to note that 9 percent of heroin treatment admissions<br />
are for individuals younger than 17, almost double<br />
the proportion of treatment admissions for those age<br />
18–25.<br />
Treatment data suggest that oral and inhalation routes<br />
of administration may be on the rise in both metropolitan<br />
and non-metropolitan regions and that injection<br />
use of heroin may be declining. Approximately<br />
34 percent of all individuals admitted for heroin<br />
treatment report smoking, oral, or inhalation as their<br />
primary method of administration. Nevertheless, anecdotal<br />
reports from nonprofit street outreach workers<br />
suggest that rates of heroin injection, particularly<br />
in metropolitan Atlanta, may be on the rise and are<br />
likely underreported. Most heroin users admitted to<br />
treatment did not report having a secondary drug of<br />
choice, although metropolitan users were overall<br />
more likely than non-metropolitan users to report a<br />
secondary drug of choice. Among heroin users in<br />
metropolitan Atlanta, 32 percent reported cocaine as<br />
a secondary drug of choice, compared with 9 percent<br />
for non-metropolitan users. The Georgia Department<br />
of Public Health estimates the rate of heroin addicts<br />
in Atlanta to be 159 per 100,000 population<br />
(n=approximately 7,000).<br />
The NDIC’s Georgia Threat Assessment (April 2003)<br />
reports that heroin is readily available in metropolitan<br />
Atlanta and that the city is a high-traffic area for heroin<br />
distribution. The majority of heroin available in<br />
Atlanta is South American, and wholesale quantities<br />
of heroin are generally 75–85 percent pure. The DEA<br />
reported that local purity ranges from 52 to 65 per-<br />
10<br />
<strong>EPIDEMIOLOGIC</strong> TRENDS IN <strong>DRUG</strong> <strong>ABUSE</strong>—Atlanta<br />
cent. According to the <strong>ON</strong>DCP, in the first half of<br />
2003 heroin sold for $10–$20 per bag, $462 per<br />
gram, $6,160 per ounce, and $112,000 per kilogram<br />
in Atlanta. Law enforcement groups, including<br />
HIDTA and the DEA, report local heroin is supplied<br />
via sources in Chicago, New York, and the southwest<br />
border, and that there has been increased Hispanic<br />
involvement in trafficking. Reports from outlying<br />
metropolitan Atlanta counties suggest an increase in<br />
heroin traffic in their jurisdictions. Approximately 1<br />
percent (n=187) of NFLIS-tested seized drug items<br />
tested positive for heroin in the October 2003–<br />
September 2004 period (exhibit 4).<br />
Law enforcement groups, including HIDTA and the<br />
DEA, report that Mexican criminal groups are primarily<br />
responsible for the trafficking of South<br />
American heroin in Georgia. These groups use commercial<br />
and private vehicles to bring the drugs into<br />
the State. Heroin also enters the State through Colombian<br />
and Nigerian groups that transport the drug<br />
via airline couriers. Additionally, NDIC and the DEA<br />
mention that Dominican criminal groups drive heroin<br />
into Georgia from New York and Philadelphia. Some<br />
of that heroin is sold in Atlanta and some is shipped<br />
elsewhere.<br />
Other Opiates/Narcotics<br />
Most indicators suggest that narcotic pain relievers<br />
are growing in popularity in metropolitan Atlanta.<br />
There were 241 ED oxycodone/combinations reports<br />
and 317 hydrocodone/combinations reports from<br />
January through October 2004 in the unweighted data<br />
accessed from DAWN Live! (exhibit 5). A greater<br />
percentage of these ED reports involved women (57<br />
percent) and Whites (47 percent) than other groups.<br />
African-Americans represented 25 percent of all opiate/opioid<br />
ED reports.<br />
Treatment data for other opiates or narcotics were<br />
only available for secondary and tertiary drug abuse<br />
categories. Continuing a stable trend, other opiates<br />
accounted for about 2–3 percent of secondary drugs<br />
abused statewide and about 1.5 percent of tertiary<br />
drugs abused from January through June 2004. The<br />
use of opiates as a secondary abuse category was<br />
cited more often in non-metropolitan areas (2.5 percent)<br />
than in metropolitan Atlanta (0.8 percent).<br />
According to NFLIS data, oxycodone and hydrocodone<br />
each accounted for about 1–2 percent of lab<br />
identifications of drugs seized by law enforcement<br />
from October 2003 through September 2004 (exhibit<br />
4). OxyContin, the most widely recognized oxycodone<br />
product, is a growing drug threat in Georgia,<br />
according to the DEA. Twenty-milligram tablets sold<br />
Proceedings of the Community Epidemiology Work Group, Vol. II, January 2005
on the illegal market for $20 in 2003. Hydrocodone<br />
(Vicodin) and hydromorphone (Dilaudid) are also<br />
abused in Atlanta. These drugs are obtained by “doctor-shopping”<br />
or by purchasing from dealers. Some<br />
dealers steal prescription pads or rob pharmacies.<br />
Several such incidents were reported in Georgia in<br />
2004.<br />
Marijuana<br />
Ethnographic sources consistently confirm that marijuana<br />
is the most commonly abused drug in Atlanta.<br />
Most epidemiological indicators show an upward<br />
trend in marijuana use, particularly among individuals<br />
younger than 17.<br />
The unweighted data accessed from DAWN Live!<br />
show 1,565 marijuana ED reports from January<br />
through October 2004 (exhibit 1). There were more<br />
than twice as many marijuana reports for men as for<br />
women (exhibit 2). Marijuana ED reports involving<br />
African-Americans were almost level to those involving<br />
Whites (1.3:1). Fifty-three percent of all ED reports<br />
for marijuana were distributed evenly among<br />
individuals younger than 35, with 35–44-year-olds<br />
representing the largest percentage by age group (28<br />
percent of all ED reports). Eight percent of the marijuana<br />
ED reports represented patients age 12–17, and<br />
there were no reports among patients younger than 12.<br />
Nearly 22 percent of public treatment admissions in<br />
January through June 2004 in metropolitan Atlanta<br />
were for those who considered marijuana to be their<br />
primary drug of choice, reflecting a smaller percentage<br />
than in previous years. Male admissions were just<br />
slightly less than double those of females in metropolitan<br />
Atlanta, with the gap narrowing in nonmetropolitan<br />
regions (1.6:1). The proportion of African-Americans<br />
who identified marijuana as their<br />
primary drug of choice increased both in metropolitan<br />
(55.8 percent vs. 46 percent in 2003) and nonmetropolitan<br />
Atlanta (23 percent vs. 39 percent in<br />
2003) in the first 6 months of 2004. All other ethnicities<br />
accounted for less than 4 percent of those admitted<br />
who stated marijuana was their primary drug of<br />
choice. Similar to 2003, the vast majority of users (80<br />
percent) in 2004 were at least 35 years old. In metropolitan<br />
Atlanta, treatment admissions of individuals<br />
17 and younger (n=53) were less frequent than those<br />
among users age 18–25 (73). However, this trend was<br />
reversed in non-metropolitan public treatment facilities,<br />
where individuals 17 and younger (n=221) were<br />
more likely to enter treatment than individuals age<br />
18–25 (190). Alcohol was the most popular secondary<br />
drug of choice for marijuana users, followed by<br />
cocaine and methamphetamine for both metropolitan<br />
and non-metropolitan Atlanta admissions.<br />
<strong>EPIDEMIOLOGIC</strong> TRENDS IN <strong>DRUG</strong> <strong>ABUSE</strong>—Atlanta<br />
Marijuana, which is readily available in Atlanta and<br />
the rest of Georgia, retails for about $10–$20 per gram<br />
and $100–$350 per ounce, according to the DEA. Atlanta<br />
serves as a regional distribution center for marijuana.<br />
Most of the marijuana in Georgia comes from<br />
Mexico, although locally grown marijuana is also on<br />
the market. Colombian and Jamaican marijuana are<br />
purportedly present but are less available. Mexican<br />
drug cartels are the primary transporters and wholesale<br />
distributors of Mexican-grown marijuana. Local gangs<br />
(African-American and Hispanic) and local independent<br />
dealers (African-American and White) are the primary<br />
resale distributors.<br />
Marijuana seizures increased 150 percent between<br />
2002 and 2003, with HIDTA Task Force officers<br />
confiscating 1,741.17 kilograms of bulk marijuana<br />
and 210 cannabis plants. The NFLIS report for FY<br />
2004 indicates that 23 percent of all drug-related<br />
items confiscated test positive for marijuana (exhibit<br />
4). According to The Georgia Governor's Task Force<br />
on Drug Suppression, 58 percent of Georgia’s 159<br />
counties have been reported as significant locations<br />
for marijuana cultivation.<br />
Ethnographic data continue to consistently support<br />
treatment and law enforcement data that indicate the<br />
widespread availability and use of marijuana in Atlanta.<br />
Hydroponic cultivation of marijuana has become<br />
more popular due in part to the DEA’s eradication<br />
program.<br />
Stimulants<br />
Methamphetamine is the most abused stimulant in<br />
Atlanta, and its use is increasing. Law enforcement<br />
efforts to stop the spread of this drug have involved<br />
seizures and closures of clandestine labs. Methamphetamine<br />
is an increasing threat in the suburban<br />
areas because of the drug’s price and ease of availability,<br />
and it is replacing some traditional drugs as a<br />
less expensive, more potent alternative. Moreover,<br />
frequent media reports; recent strengthening of<br />
criminal penalties for the manufacture, transfer, and<br />
possession of methamphetamine; and the statewide<br />
illegalization of transporting materials used in its<br />
production have fueled the growing concerns over the<br />
dangers the drug poses. Methamphetamine is not<br />
only a party drug, but it is also used for weight loss or<br />
as a way to keep up with demanding work schedules.<br />
There were 448 unweighted ED reports of methamphetamine<br />
in the Atlanta metropolitan area from<br />
January through October 2004 (exhibit 1). During<br />
this same period, the ratio of men to women in the<br />
methamphetamine ED reports was nearly 2:1. Whites<br />
accounted for 68 percent of methamphetamine ED<br />
Proceedings of the Community Epidemiology Work Group, Vol. II, January 2005 11
eports (exhibit 2), while African-Americans accounted<br />
for 5.1 percent. Methamphetamine reports<br />
among patients between the ages of 25 and 54 totaled<br />
267 (60 percent of all methamphetamine ED reports);<br />
ED reports were the highest among individuals between<br />
35 and 44 years old.<br />
There were 279 unweighted ED amphetamine reports<br />
in the Atlanta metropolitan area from January through<br />
October 2004 (exhibit 1). The gap between male and<br />
female ED reports for amphetamines was narrow (exhibit<br />
2), with a male-to-female ratio of 1.2:1. Nearly<br />
three out of four ED reports involved Whites, while<br />
African-Americans represented 7 percent of ED amphetamine<br />
reports.<br />
The proportion of treatment admissions in metropolitan<br />
and non-metropolitan areas for methamphetamine<br />
continues to rise faster than for any other classification<br />
of drug. For the first 6 months of 2004, more<br />
than 8 percent of public treatment admissions reported<br />
methamphetamine as the primary drug of<br />
choice, compared to 5.1 percent in 2003 and 3.1 percent<br />
in 2002. The proportion of admissions for<br />
methamphetamine in non-metropolitan Atlanta was<br />
nearly 14 percent, the highest percentage ever reported.<br />
The number of women in metropolitan Atlanta<br />
who reported to treatment for methamphetamine-related<br />
causes increased significantly in 2004<br />
and represented more than 55 percent of all admissions.<br />
In treatment centers outside of metropolitan<br />
Atlanta, the proportion of women entering treatment<br />
(56 percent) remained nearly identical to 2003. Most<br />
users were White; in fact, Whites accounted for more<br />
than 95 percent of treatment admissions in metropolitan<br />
Atlanta during the first 6 months of 2004. Nevertheless,<br />
the proportions of African-American and<br />
Hispanic users are growing. Regardless of demographic<br />
area, more than 77 percent of statewide<br />
treatment admissions were individuals older than 35.<br />
Metropolitan Atlanta treatment admissions were<br />
more likely than non-metropolitan admissions (24 vs.<br />
13 percent) to choose inhaling as the preferred route<br />
of administration. Non-metropolitan Atlanta treatment<br />
admissions were more likely to smoke (53 vs.<br />
45 percent) or inject (15 vs. 13 percent) than metropolitan<br />
Atlanta treatment admissions.<br />
According to the DEA and HIDTA, methamphetamine<br />
popularity continues to rise, in part because of<br />
its low price and availability. In July 2004, methamphetamine<br />
typically sold for $110 per gram, $1,316<br />
per ounce, and $8,250 per pound.<br />
Law enforcement officials report that methamphetamine<br />
has emerged as the primary drug threat in suburban<br />
communities neighboring Fulton and DeKalb<br />
12<br />
<strong>EPIDEMIOLOGIC</strong> TRENDS IN <strong>DRUG</strong> <strong>ABUSE</strong>—Atlanta<br />
Counties. The Atlanta HIDTA task force found that<br />
more than 68 percent of participating law enforcement<br />
agencies identified methamphetamine as posing<br />
the greatest threat to their areas. Methamphetamine<br />
accounted for more than 27 percent of NFLIS tests of<br />
seized drugs from October 2003 through September<br />
2004, ranking second after cocaine (exhibit 4).<br />
Methamphetamine had accounted for about 23 percent<br />
of NFLIS tests of seized drugs in 2003, ranking<br />
third after cocaine and marijuana. The HIDTA task<br />
force seized more methamphetamine in 2003 than in<br />
previous years. These seizures in 2003 included 11.3<br />
kilograms of methamphetamine and 8.5 kilograms of<br />
crystal methamphetamine or “ice.” HIDTA investigators<br />
also report an increase among African-<br />
Americans using methamphetamine in Atlanta. Ethnographic<br />
data from Atlanta-area drug research studies<br />
among 18–25-year-olds support this trend.<br />
Depressants<br />
The use of depressants, especially benzodiazepines,<br />
is on the rise in Atlanta. The most commonly abused<br />
benzodiazepine is alprazolam (Xanax). Only a few<br />
people admitted for drug treatment chose benzodiazepines<br />
as their secondary or tertiary drug of choice,<br />
but ME mentions for these drugs continued to increase.<br />
The preliminary numbers of unweighted ED reports<br />
involving depressants in metropolitan Atlanta in the<br />
first 10 months of 2004 were as follows: (a) barbiturates<br />
(n=79); (b) benzodiazepines (878); and (c) miscellaneous<br />
other depressants (828). These ED reports<br />
in 2004 averaged nearly 88 per month, compared<br />
with an average of 67 unweighted ED reports for the<br />
last 6 months of 2003.<br />
The treatment data from publicly funded programs<br />
included depressants such as barbiturates and benzodiazepines<br />
only as secondary and tertiary drug<br />
choices for the first 6 months of 2004. In metropolitan<br />
Atlanta, nearly 1 percent of primary heroin and<br />
methamphetamine users chose benzodiazepines as a<br />
secondary drug choice. These percentages are consistent<br />
with the figures from the previous 3 years.<br />
The DEA considers benzodiazepines and other prescription<br />
depressants to be a minor threat in Georgia.<br />
The pills are widely available on the street, but their<br />
abuse does not seem to have reached the levels of<br />
oxycodone and hydrocodone abuse. According to the<br />
NDIC and DEA Georgia Threat Assessment (April<br />
2003), local dealers tend to work independently and<br />
typically sell to “acquaintances and established customers.”<br />
These primarily White dealers and abusers<br />
Proceedings of the Community Epidemiology Work Group, Vol. II, January 2005
steal prescription pads, rob pharmacies, and attempt<br />
to convince doctors to prescribe the desired pills.<br />
Hallucinogens<br />
The epidemiological indicators and law enforcement<br />
data do not indicate much hallucinogen use in Atlanta.<br />
Despite these data, there was an increase in<br />
ethnographic mentions of PCP in the past 12 months.<br />
Unweighted data accessed from DAWN Live! for the<br />
first 10 months of 2004 show 19 total ED reports for<br />
lysergic acid diethylamide (LSD). Most of the 2004<br />
ED reports involved men rather than women, with a<br />
ratio of 6:1. Whites (n=10) represented more ED reports<br />
for LSD than did African-Americans (6). The<br />
majority of these LSD reports represented 18–29year-olds<br />
(n=15). The total number of ED reports for<br />
phencyclidine (PCP) from January through October<br />
2004 was 40. PCP reports were highest among White<br />
males between the ages of 35 and 44 and 12 and 17.<br />
Treatment data for hallucinogens are only available<br />
for secondary and tertiary drug abuse categories, and<br />
these are listed as PCP and “other hallucinogens.”<br />
From January through June 2004, hallucinogens were<br />
listed five times as a secondary or tertiary drug of<br />
choice in metropolitan areas. These numbers were<br />
consistent with those in 2003. “Other hallucinogens”<br />
were listed 16 times as a secondary drug of abuse and<br />
31 times as a tertiary drug in non-metropolitan areas,<br />
also consistent with previous years.<br />
LSD accounted for only 0.04 percent of drugs analyzed<br />
by NFLIS from October 2003 through September<br />
2004. The DEA reports an increase in the availability<br />
of LSD, especially among White traffickers/users<br />
age 18–25. LSD is usually encountered in<br />
school settings and is imported through the U.S.<br />
Postal Service. No PCP items were reported by<br />
NFLIS in FY 2004.<br />
Club Drugs<br />
While so-called club drugs—methylenedioxymethamphetamine<br />
(MDMA or ecstasy), gamma hydroxybutyrate<br />
(GHB), and ketamine—appear relatively infrequently<br />
in epidemiological data, ethnographic and sociologic<br />
research suggests continued frequency in use,<br />
particularly among metropolitan Atlanta’s young adult<br />
population.<br />
There were 64 ED MDMA reports from January<br />
through October 2004 in the preliminary unweighted<br />
data accessed from DAWN Live!. MDMA reports<br />
among males exceeded those among females by almost<br />
double (1.7:1 ratio) (exhibit 2). There was an<br />
<strong>EPIDEMIOLOGIC</strong> TRENDS IN <strong>DRUG</strong> <strong>ABUSE</strong>—Atlanta<br />
approximately even ratio (1:1.2) of reports involving<br />
Whites and African-Americans; there were no Hispanic<br />
reports. Young adults (21–29) represented 49<br />
percent of ED MDMA reports. The reported route of<br />
administration for MDMA was almost exclusively<br />
oral. More than one-half of ED MDMA cases were<br />
referred to other treatment or admitted for detoxification<br />
or psychiatric treatment.<br />
Atlanta serves as a distribution point for MDMA to<br />
other U.S. cities. According to the NDIC, most of the<br />
MDMA available in Georgia is produced in northern<br />
Europe and flown into major U.S. cities, including<br />
Atlanta. The NFLIS reported that in FY 2004,<br />
MDMA accounted for 1.6 percent of substances<br />
tested in suspected drug cases (exhibit 4); methylenedioxyamphetamine<br />
(MDA) accounted for another<br />
0.4 percent. The April 2003 NDIC and DEA Georgia<br />
Threat Assessment indicated that most dealers are<br />
White middle and upper class high school and college<br />
students between the ages of 18 and 25. The<br />
drug retails for $25–$30 per tablet, according to a<br />
July 2003 report by the NDIC, although ethnographic<br />
data indicate that many users buy ecstasy in bulk.<br />
Users report that bulk ecstasy rates are $5–$10 per<br />
pill. An emerging trend among young adults is<br />
“candy flipping,” or combining MDMA and LSD,<br />
according to a local university report.<br />
There were a total of 44 unweighted GHB ED reports<br />
from January through October 2004. GHB reports for<br />
males exceeded those for females (exhibit 2), at a<br />
ratio of 5.6:1. ED GHB reports also predominantly<br />
involved Whites (6.7 to 1 African-American, with<br />
only 1 Hispanic report in this time period). Seventyfive<br />
percent of GHB reports involved patients age<br />
25–44. There were no ED GHB reports for those<br />
younger than 18, and there was only one report for<br />
the 45 and older category. The reported preferred<br />
route of administration of GHB was almost exclusively<br />
oral.<br />
The NDIC reports that the primary distributors and<br />
abusers of GHB are White young adults. The DEA<br />
Atlanta Division reports that in 2001, liquid GHB<br />
sold for $500–$1,000 per gallon and $15–$20 per<br />
dose (one dose is usually the equivalent of a capful<br />
from a small water bottle).<br />
There were two reported ED ketamine reports.<br />
INFECTIOUS DISEASES RELATED TO <strong>DRUG</strong> <strong>ABUSE</strong><br />
At the end of 2003, Georgia ranked eighth in the Nation<br />
for cumulative AIDS cases. At the end of 2001,<br />
the State was ninth. The rate of overall AIDS cases<br />
was significantly higher in 2003 (22 per 100,000<br />
Proceedings of the Community Epidemiology Work Group, Vol. II, January 2005 13
population) than in 2002 (17.2 per 100,000 population).<br />
Approximately 1,907 new AIDS cases were<br />
reported in the State in 2003, for a cumulative total of<br />
14,023 persons living with AIDS. Human immunodeficiency<br />
virus (HIV) surveillance nationwide indicates<br />
a consistent increase in new infections.<br />
In 2003, nearly 73 percent of all new AIDS diagnoses<br />
were male; African-Americans accounted for 74 percent<br />
of these total cases. In Georgia, nearly 73 percent<br />
of the new HIV/AIDS cases were older than 25,<br />
14<br />
<strong>EPIDEMIOLOGIC</strong> TRENDS IN <strong>DRUG</strong> <strong>ABUSE</strong>—Atlanta<br />
with the highest prevalence occurring among 35–44year-olds.<br />
The majority of new AIDS cases in Georgia<br />
continue to come from Atlanta’s Fulton and<br />
DeKalb Counties.<br />
New cases of sexually transmitted diseases identified<br />
in Georgia in 2003 included chlamydia (n=35,686),<br />
gonorrhea (n=17,686), and syphilis (n=585). In 2003,<br />
there were 484 statewide total cases of hepatitis B<br />
and 64 statewide reports of hepatitis C; the majority<br />
of cases originated in the Atlanta metropolitan area.<br />
For inquiries concerning this report, please contact Brian J. Dew, Ph.D., LPC, Assistant Professor, Georgia State University, Department of<br />
Counseling and Psychological Services, P.O. Box 3980, Atlanta, GA 30302-3980, Phone: (404)651-3409, Email: .<br />
Proceedings of the Community Epidemiology Work Group, Vol. II, January 2005
<strong>EPIDEMIOLOGIC</strong> TRENDS IN <strong>DRUG</strong> <strong>ABUSE</strong>—Atlanta<br />
Exhibit 1. Number of DAWN ED Reports in Atlanta, by Drug (Unweighted 1 ): January–October 2004<br />
Cocaine<br />
Alcohol-in-Combination<br />
Marijuana<br />
Stimulants<br />
Heroin<br />
279<br />
448<br />
413<br />
727<br />
1,565<br />
Methamphetamine<br />
Amphetamines<br />
1 The unweighted data are from 18–19 Atlanta EDs reporting to DAWN. All DAWN cases are reviewed for quality control. Based on<br />
this review, cases may be corrected or deleted, and, therefore, are subject to change.<br />
SOURCE: DAWN Live!, OAS, SAMHSA, updated 1/17/2005<br />
Proceedings of the Community Epidemiology Work Group, Vol. II, January 2005 15<br />
3,166<br />
4,582<br />
0 500 1,000 1,500 2,000 2,500 3,000 3,500 4,000 4,500 5,000 5,500
16<br />
<strong>EPIDEMIOLOGIC</strong> TRENDS IN <strong>DRUG</strong> <strong>ABUSE</strong>—Atlanta<br />
Proceedings of the Community Epidemiology Work Group, Vol. II, January 2005
<strong>EPIDEMIOLOGIC</strong> TRENDS IN <strong>DRUG</strong> <strong>ABUSE</strong>—Atlanta<br />
Exhibit 3. Number of DAWN ED Mentions for Selected Drugs by Month (Unweighted 1 ): January–October 2004<br />
550<br />
500<br />
450<br />
400<br />
350<br />
300<br />
250<br />
200<br />
150<br />
100<br />
50<br />
0<br />
Jan Feb Mar Apr May Jun Jul Aug Sep Oct<br />
Cocaine 340 372 503 455 507 469 490 476 484 486<br />
Marijuana 124 142 183 154 184 148 149 163 159 159<br />
Heroin 35 37 41 35 45 40 57 33 44 46<br />
Methamphetamine 39 29 39 38 46 45 65 43 57 47<br />
Amphetamine 16 25 26 26 34 28 23 44 29 28<br />
1 The unweighted data are from 18–19 Atlanta EDs reporting to DAWN. All DAWN cases are reviewed for quality control. Based on<br />
this review, cases may be corrected or deleted, and, therefore, are subject to change.<br />
SOURCE: DAWN Live!, OAS, SAMHSA, updated 1/17/2005<br />
Exhibit 4. Number of Analyzed Items and Percentage of All Items Tested in Atlanta: October 2003–<br />
September 2004<br />
Drug Number Percent<br />
Cocaine 6,585 39.7<br />
Methamphetamine 4,510 27.2<br />
Cannabis 3,761 22.7<br />
Alprazolam 326 2.0<br />
MDMA/MDA 332 2.0<br />
Hydrocodone 269 1.6<br />
Heroin 187 1.1<br />
Oxycodone 144 0.9<br />
Methadone 78 0.5<br />
Diazepam 62 0.4<br />
Other 1 301 1.8<br />
Total 16,555 99.8<br />
1 Includes carisoprodol, amphetamine, clonazepam, morphine, codeine, psilocin, non-controlled non-narcotic drug, methylphenidate,<br />
ketamine, gamma hydroxybutyrate, hydromorphone, 1-(3-trifluoromethylphenyl)-piperazine, lorazepam, and lysergic acid diethylamide.<br />
SOURCE: NFLIS, DEA<br />
Proceedings of the Community Epidemiology Work Group, Vol. II, January 2005 17
<strong>EPIDEMIOLOGIC</strong> TRENDS IN <strong>DRUG</strong> <strong>ABUSE</strong>—Atlanta<br />
Exhibit 5. Number DAWN ED Prescription Drug Misuse Cases in Atlanta, by Selected Drug (Unweighted 1 ):<br />
January–October 2004<br />
Benzodiazepines<br />
1 The unweighted data are from 18–19 Atlanta EDs reporting to DAWN. All DAWN cases are reviewed for quality control. Based on<br />
this review, cases may be corrected or deleted, and, therefore, are subject to change.<br />
SOURCE: DAWN Live!, OAS, SAMHSA, updated 1/17/2005<br />
18<br />
Hydrocodone<br />
Oxycodone<br />
241<br />
317<br />
0 200 400 600 800 1,000<br />
878<br />
Proceedings of the Community Epidemiology Work Group, Vol. II, January 2005
<strong>EPIDEMIOLOGIC</strong> TRENDS IN <strong>DRUG</strong> <strong>ABUSE</strong>—Baltimore Metropolitan Area<br />
Drug Use in the Baltimore Metropolitan Area: Epidemiology<br />
and Trends, 2000–2004 (First Half)<br />
Leigh A. Henderson, Ph.D., and Doren H. Walker, M.S. 1<br />
ABSTRACT<br />
Heroin indicators for the Baltimore metropolitan<br />
area as a whole generally indicated an increase over<br />
2001 levels. Heroin use in the Baltimore metropolitan<br />
area is complex. There are several groups of heroin<br />
users differing by urbanicity, route of administration,<br />
age, and race. Baltimore has a core of older African-<br />
American heroin users, both injectors and intranasal<br />
users. White users entering treatment for heroin were<br />
younger and were predominantly injectors. Cocaine<br />
indicators also began to increase in 2001. Cocaine<br />
use was reported by 51 percent of drug-related treatment<br />
admissions in the Baltimore PMSA, with 14<br />
percent reporting primary use and 37 percent reporting<br />
use secondary to use of alcohol or another drug.<br />
Cocaine smoking was the most prevalent route of<br />
administration among both primary and secondary<br />
users, followed by injection and intranasal use. Cocaine<br />
smokers were likely to use heroin intranasally.<br />
Cocaine injection was strongly linked to heroin injection.<br />
Intranasal cocaine users were likely to use heroin<br />
intranasally. Indicators of marijuana use have<br />
tended to increase since 2000. More often than not,<br />
marijuana use in the indicator data sets was associated<br />
with the use of alcohol or other drugs—61 percent<br />
of marijuana treatment admissions reported use<br />
of additional substances. One-third (33 percent) of<br />
drug-related treatment admissions used marijuana,<br />
15 percent as a primary substance and 18 percent as<br />
a secondary substance. Persons entering treatment<br />
for primary marijuana use were young: 43 percent<br />
were younger than 18. A large proportion of marijuana<br />
treatment admissions (62 percent) represented<br />
referrals through the criminal justice system. Indicators<br />
for opiates and narcotics other than heroin have<br />
increased over the past several years. Stimulants<br />
other than cocaine are rarely mentioned as the primary<br />
substance of abuse by treatment admissions.<br />
INTRODUCTI<strong>ON</strong><br />
Area Description<br />
The Baltimore primary metropolitan statistical area<br />
(PMSA) was home to some 2.6 million persons in<br />
2004. It comprises Baltimore City and the suburban<br />
counties of Anne Arundel, Baltimore, Carroll, Harford,<br />
Howard, and Queen Anne’s. Baltimore City is<br />
the largest independent city in the United States. The<br />
city’s population declined from 735,000 in 1990 to<br />
603,000 in 2003. The population of the surrounding<br />
counties has grown from approximately 1.7 million<br />
in 1990 to 2.0 million in 2004.<br />
The city and the suburban counties represent distinctly<br />
different socioeconomic groups. In 2000, median<br />
household income in the city was $30,000, and<br />
23 percent of the population lived in poverty. In the<br />
suburban counties, however, median household income<br />
ranged from $51,000 to $74,000, and the poverty<br />
rate averaged 5 percent. In 2000, the median<br />
value of a single-family home was $69,100 in the city<br />
and averaged $152,000 in the suburban counties. The<br />
2000 population composition of the city differed<br />
markedly from that of the surrounding counties: 32<br />
percent White and 64 percent African-American,<br />
versus 80 percent White and 15 percent African-<br />
American, respectively. Two percent of the population<br />
in the city and 3 percent of the population in the<br />
suburban counties were Asian. Two percent of the<br />
population in both the city and the suburban counties<br />
were Hispanic.<br />
The Baltimore area is a major node on the northsouth<br />
drug trafficking route. It has facilities for entry<br />
of drugs into the country by road, rail, air, and sea.<br />
Baltimore is located on Interstate 95, which continues<br />
north to Philadelphia, New York, and Boston, and<br />
south to Washington, DC, Richmond, and Florida.<br />
Frequent daily train service is available on this route.<br />
The area is served by three major airports (Baltimore-<br />
Washington International Airport in Baltimore<br />
County and Reagan National and Dulles Airports in<br />
the vicinity of Washington, DC, approximately 50<br />
miles from the Baltimore City center). Baltimore is<br />
also a significant active seaport. The area has numerous<br />
colleges and universities and several military<br />
bases.<br />
Data Sources<br />
The authors are affiliated with Synectics for Management Decisions, Inc., Arlington, Virginia.<br />
NOTE: This report has historically used emergency<br />
department (ED) drug mention data and mortality<br />
Proceedings of the Community Epidemiology Work Group, Vol. II, January 2005 19
data from the Drug Abuse Warning Network<br />
(DAWN), Office of Applied Studies (OAS), Substance<br />
Abuse and Mental Health Services Administration<br />
(SAMHSA). Because of a redesign of<br />
DAWN, the most recent estimates available are from<br />
2002. Limited unweighted data on ED reports for<br />
2004 were available for this report, but because of<br />
data collection differences, these cannot be used in<br />
conjunction with the older data to measure trends.<br />
Data sources for this report are detailed below:<br />
• Population and demographic data, including<br />
population estimates for 1990–2003 and income<br />
and poverty estimates for 2000 for Maryland<br />
counties, were derived from U.S. Bureau of the<br />
Census data (electronic access: last accessed June 13, 2004).<br />
• Treatment admissions data were provided by<br />
the Maryland Alcohol and Drug Abuse Administration,<br />
Department of Health and Mental Hygiene,<br />
for 1994 through the first half of 2004. Data<br />
are presented for the PMSA as a whole, as well as<br />
separately for Baltimore City and the suburban<br />
counties. Included are those programs receiving<br />
both public and private funding. All clients are reported,<br />
regardless of individual source of funding.<br />
Significant omissions are the Baltimore City and<br />
Fort Howard Veterans’ Administration Medical<br />
Centers, which do not report to the State data collection<br />
system. Treatment data in this report exclude<br />
admissions for abuse of alcohol alone (about<br />
16 percent of all treatment admissions). Admissions<br />
with primary abuse of alcohol and secondary/tertiary<br />
abuse of drugs (about 12 percent of<br />
all admissions) are included.<br />
• Emergency department (ED) drug mentions<br />
data were provided by DAWN, OAS, SAMHSA,<br />
for the Baltimore PMSA for 1994 through 2002.<br />
The 1994–2002 data provided weighted estimates<br />
and rates per 100,000 population, which are reported<br />
in this paper. In addition, unweighted data<br />
on selected drugs were derived from DAWN<br />
Live!, a restricted-access online query system administered<br />
by OAS. The data for the first half of<br />
2004 are, as noted above, not comparable to<br />
DAWN data for 2002 and prior years, and cannot<br />
be used for comparison with future data. The new<br />
DAWN sample includes all 21 eligible hospitals<br />
in the Baltimore metropolitan area, with 24 EDs<br />
in the sample. (Some hospitals have more than<br />
one ED.) The data accessed from DAWN Live!<br />
(updated by OAS on December 13, 2004) were<br />
incomplete. Over the 6-month period, between 21<br />
20<br />
<strong>EPIDEMIOLOGIC</strong> TRENDS IN <strong>DRUG</strong> <strong>ABUSE</strong>—Baltimore Metropolitan Area<br />
and 23 of the EDs reported to DAWN each<br />
month, with most reporting data that were basically<br />
complete (90 percent or greater). This paper<br />
includes drug reports on drug-related visits involving<br />
stimulants and the so-called “club drugs.”<br />
Drug reports exceed the number of visits since a<br />
patient may report use of multiple drugs (up to six<br />
plus alcohol). The unweighted data from DAWN<br />
Live! Cannot be used as estimates for the Baltimore<br />
area, nor can they be used for comparison<br />
with future data. Only weighted DAWN data released<br />
by SAMHSA can be used for trend analysis.<br />
A full description of the DAWN system can<br />
be found at .<br />
• Mortality data were provided by DAWN, OAS,<br />
SAMHSA, for the Baltimore PMSA for 1997<br />
through 2002.<br />
• Illicit drug prices were provided by the National<br />
Drug Intelligence Center, Narcotics Digest<br />
Weekly 3(52), December 28, 2004, for July–<br />
December 2004.<br />
• Data on drug seizures were provided by the<br />
National Forensic Laboratory Information System<br />
(NFLIS).<br />
<strong>DRUG</strong> <strong>ABUSE</strong> PATTERNS AND TRENDS<br />
Polydrug use in general appears to be the norm in the<br />
Baltimore PMSA. Three-quarters of drug-related<br />
treatment admissions in the first half of 2004 reported<br />
problems with at least one substance other than their<br />
primary substance. In 2002, the average ED episode<br />
involved 1.8 substances, and the average drug-related<br />
death involved 3.1 substances; 89 percent of the<br />
drug-related deaths involved multiple substances.<br />
Cocaine/Crack<br />
Cocaine indicators (treatment admission rates, rates<br />
of ED mentions, and cocaine-involved deaths) all<br />
began to increase in 2001 (exhibit 1). The rate of cocaine-related<br />
ED mentions (257 per 100,000 population<br />
for 2002) represented a significant increase over<br />
the previous year. Deaths associated with cocaine<br />
increased from 248 in 2001 to 299 in 2002. The cocaine<br />
treatment admission rate increased from 164<br />
per 100,000 population age 12 and older in 2001 to<br />
221 per 100,000 in 2003 (exhibit 2). The rate is projected<br />
to decline slightly, to 217 per 100,000 in 2004.<br />
Smoked cocaine (crack) represented 73 percent of the<br />
treatment admissions for primary cocaine use in the<br />
Baltimore PMSA in the first half of 2004 (exhibit 2).<br />
Proceedings of the Community Epidemiology Work Group, Vol. II, January 2005
The population in treatment for cocaine smoking has<br />
aged (exhibit 3). About three-quarters (74 percent)<br />
were age 35 or older in the first half of 2004, an increase<br />
from 59 percent in 2000. The median age at<br />
admission to treatment was 39, compared with 36 in<br />
2000. Almost one-half (45 percent) of those in treatment<br />
for smoking cocaine were women, and more<br />
than two-thirds (69 percent) were African-American.<br />
The majority (63 percent) of the crack smokers had<br />
been in treatment before, and most (70 percent) were<br />
referred through sources other than the criminal justice<br />
system. Daily crack use was reported by 45 percent,<br />
and use of other drugs in addition to crack was<br />
reported by more than two-thirds (69 percent). Alcohol<br />
was the most common secondary drug (used by<br />
45 percent), followed by marijuana (22 percent) and<br />
heroin used intranasally (15 percent). Only 4 percent<br />
of crack smokers reported heroin injection.<br />
Primary use of cocaine represented 14 percent of<br />
treatment admissions in the first half of 2004, well<br />
behind the 51 percent of admissions represented by<br />
primary use of heroin (exhibit 2). Despite the apparent<br />
dominance of heroin in the Baltimore PMSA, testing<br />
of some 40,000 items in fiscal year (FY) 2004 by the<br />
National Forensics Laboratory found that 43 percent<br />
were cocaine and 27 percent were heroin. This apparent<br />
discrepancy may be explained by the use of cocaine<br />
as a secondary substance. Cocaine was reported<br />
as a secondary substance by 37 percent of treatment<br />
admissions in the first half of 2004 (exhibit 2), meaning<br />
that 51 percent of treatment admissions reported<br />
cocaine abuse as a primary or secondary problem.<br />
Exhibit 4 compares the characteristics of treatment<br />
admissions for primary and secondary cocaine use<br />
according to the route of administration of cocaine.<br />
Cocaine smoking was the most prevalent among both<br />
primary and secondary users, followed by injection<br />
and intranasal use. Differences between primary and<br />
secondary users were generally small, although secondary<br />
users were consistently less likely to be entering<br />
treatment for the first time than primary users.<br />
User characteristics were more pronounced between<br />
routes of administration. Cocaine smokers were more<br />
likely to be female (50 percent of cocaine smokers,<br />
compared to 38 percent of injectors and 31 percent of<br />
intranasal users), African-American (70 percent, 55<br />
percent, and 47 percent, respectively), and age 35 and<br />
older (72 percent, 64 percent, and 56 percent, respectively).<br />
Cocaine smokers were less likely to be age 25<br />
and younger (7 percent, compared with 15 percent of<br />
injectors and 22 percent of intranasal users). Cocaine<br />
smokers and injectors were more likely to be treated<br />
in the city (69 percent and 72 percent, respectively,<br />
compared to 48 percent of the intranasal users).<br />
<strong>EPIDEMIOLOGIC</strong> TRENDS IN <strong>DRUG</strong> <strong>ABUSE</strong>—Baltimore Metropolitan Area<br />
Exhibit 5 compares the number of cocaine treatment<br />
admissions (primary, secondary, or tertiary use) in<br />
the first half of 2004 by route of administration, age,<br />
and race. For all three routes of administration, the<br />
younger users tended to be White rather than African-American.<br />
Thirty-eight percent of the cocaine smokers reported<br />
cocaine smoking as their primary problem (exhibit<br />
4). Secondary cocaine smokers generally shared the<br />
characteristics of primary smokers (see above and<br />
exhibit 3). They were somewhat more likely to be<br />
female (54 percent of secondary smokers, compared<br />
to 45 percent of primary smokers), and more likely to<br />
be treated in Baltimore City (71 percent and 67 percent,<br />
respectively). Cocaine smokers were likely to<br />
use heroin intranasally. Fifty-two percent of the secondary<br />
cocaine smokers reported intranasal heroin<br />
use as their primary substance problem, while 15<br />
percent of the primary cocaine smokers reported intranasal<br />
heroin use as a secondary problem. Other<br />
primary problems reported by secondary cocaine<br />
smokers were alcohol (21 percent) and heroin injection<br />
(20 percent).<br />
Cocaine injection was strongly linked to heroin injection<br />
(exhibit 4). Only 7 percent of the cocaine injectors<br />
reported cocaine injection as their primary substance<br />
problem, and 59 percent of these reported secondary<br />
heroin injection. Among the secondary cocaine<br />
injectors, 92 percent reported that their use was<br />
secondary to heroin injection. Secondary cocaine<br />
injectors were less likely to report daily use than primary<br />
cocaine injectors (51 percent and 63 percent,<br />
respectively). Cocaine injectors were likely to be<br />
male (62 percent), African-American (55 percent),<br />
older (64 percent were age 35 and older), and treated<br />
in Baltimore City (72 percent).<br />
Twenty-three percent of the primary intranasal cocaine<br />
users reported intranasal cocaine as their primary substance<br />
problem (exhibit 4). Intranasal cocaine users<br />
were likely to use heroin intranasally. Forty-two percent<br />
of the secondary intranasal cocaine users reported<br />
intranasal heroin use as their primary substance problem,<br />
while 11 percent of the primary intranasal cocaine<br />
users reported intranasal heroin use as a secondary<br />
problem. Other primary problems reported by secondary<br />
intranasal cocaine users were alcohol (27 percent)<br />
and heroin injection (14 percent). Intranasal cocaine<br />
users were likely to be male (69 percent), White (51<br />
percent), older (56 percent were age 35 and older), and<br />
treated in the suburban counties (52 percent). Primary<br />
intranasal cocaine users were more likely than secondary<br />
users to be White (55 percent and 49 percent,<br />
respectively) and younger (8 percent were younger<br />
Proceedings of the Community Epidemiology Work Group, Vol. II, January 2005 21
than age 18, compared to 4 percent of secondary intranasal<br />
cocaine users).<br />
Prices for powdered cocaine for the second half of<br />
2004 were reported as $20,000–$32,000 per kilogram<br />
at the wholesale level, $900–$1,200 per ounce at<br />
midlevel, and $20–$200 per gram at the retail level.<br />
Prices for crack cocaine were reported as $20,000–<br />
$26,000 per kilogram at the wholesale level, $600–<br />
$1,200 per ounce at midlevel, and $40–$200 per<br />
gram at the retail level. For powdered cocaine, the<br />
price range at the wholesale kilogram level was unchanged<br />
from the second half of 2003, while the<br />
lower limit for a retail-level gram was less. For crack<br />
cocaine, the lower limit for a wholesale kilogram was<br />
unchanged from the second half of 2003, while the<br />
lower limit for a retail-level gram was less.<br />
Heroin<br />
Heroin indicators for the Baltimore metropolitan area<br />
as a whole generally indicated an increase over 2001<br />
levels (exhibit 1). The rate of heroin ED mentions<br />
(203 per 100,000 population in 2002) represented a<br />
significant 4-percent increase from 195 per 100,000<br />
in 2001. The heroin treatment admission rate increased<br />
from 652 per 100,000 population age 12 and<br />
older in 2001 to 875 per 100,000 in 2003 (exhibit 2).<br />
However, it was projected to decline slightly to 858<br />
per 100,000 in 2004.<br />
Heroin use in the Baltimore metropolitan area is complex.<br />
There are several groups of heroin users differing<br />
by urbanicity, route of administration, age, and race. In<br />
the first half of 2004, the heroin treatment admission<br />
rate was about seven times higher in Baltimore City<br />
than in the suburban counties (exhibit 2).<br />
In Baltimore City, intranasal use was the preferred<br />
route of administration among treatment admissions<br />
(exhibit 2), and the admission rate for intranasal use<br />
was 29 percent higher than for injection. In the suburban<br />
counties, however, the rate for heroin injection<br />
was 63 percent higher than for inhalation.<br />
Exhibit 6 compares the number of treatment admissions<br />
in the first half of 2004 by route of administration,<br />
age, and race. Baltimore has a core of older African-American<br />
heroin users, both injectors and intranasal<br />
users. White users entering treatment for heroin<br />
were younger and were predominantly injectors.<br />
African-American heroin intranasal users made up 40<br />
percent of the heroin-using treatment admissions in<br />
the Baltimore PMSA in the first half of 2004. Most<br />
(85 percent) were treated in Baltimore City. Among<br />
22<br />
<strong>EPIDEMIOLOGIC</strong> TRENDS IN <strong>DRUG</strong> <strong>ABUSE</strong>—Baltimore Metropolitan Area<br />
heroin intranasal users in the city (exhibit 7), most<br />
admissions were African-American (91 percent) and<br />
were age 35 and older (74 percent). The proportion of<br />
intranasal users age 25 and younger decreased from 5<br />
percent in 2000 to 3 percent in the first half of 2004.<br />
Almost one-half (47 percent) of the intranasal heroin<br />
users in the city were women. The median age at admission<br />
was 39, and the median duration of use before<br />
first entering treatment was 14 years. Almost<br />
three-quarters (73 percent) reported daily heroin use.<br />
One-third (33 percent) entered treatment through the<br />
criminal justice system, and less than one-third (29<br />
percent) were receiving treatment for the first time.<br />
Almost three-quarters (72 percent) reported use of<br />
other drugs—45 percent smoked cocaine, 11 percent<br />
used cocaine intranasally, 26 percent used alcohol, 10<br />
percent used marijuana, and 2 percent used opiates<br />
other than heroin.<br />
White heroin injectors made up 26 percent of the<br />
heroin-using treatment admissions in the Baltimore<br />
PMSA in the first half of 2004. More than one-half<br />
(61 percent) were treated in the suburban counties.<br />
Among heroin injectors in the suburban counties (exhibit<br />
8), most admissions were White (81 percent).<br />
About one-third (34 percent) of suburban injectors<br />
were age 25 and younger. Sixty percent of the suburban<br />
heroin injectors were male. The median age at<br />
admission was 30, and the median duration of use<br />
before first entering treatment was 7 years. Almost<br />
three-quarters (74 percent) reported daily heroin use.<br />
Less than one in five (19 percent) entered treatment<br />
through the criminal justice system, and one-third (33<br />
percent) were receiving treatment for the first time.<br />
Two-thirds (67 percent) reported use of other drugs—<br />
14 percent smoked cocaine, 29 percent injected cocaine,<br />
20 percent used alcohol, 17 percent used marijuana,<br />
and 8 percent used opiates other than heroin.<br />
African-American heroin injectors made up 21 percent<br />
of the heroin-using treatment admissions in the<br />
Baltimore PMSA in the first half of 2004. Most (85<br />
percent) were treated in Baltimore City. Among heroin<br />
injectors in the city (exhibit 8), the majority of<br />
admissions (64 percent) were African-American and<br />
were age 35 and older (70 percent), although the proportion<br />
of intranasal users age 25 and younger increased<br />
slightly from 9 percent in 2000 to 11 percent<br />
in the first half of 2004. Some 44 percent of the city’s<br />
heroin injectors were women. The median age at admission<br />
was 40, and the median duration of use before<br />
first entering treatment was 17 years. Most (77<br />
percent) reported daily heroin use. Less than onequarter<br />
(23 percent) entered treatment through the<br />
criminal justice system, and less than one in five (22<br />
percent) were receiving treatment for the first time.<br />
Proceedings of the Community Epidemiology Work Group, Vol. II, January 2005
Most (80 percent) reported use of other drugs—16<br />
percent smoked cocaine, 50 percent injected cocaine,<br />
25 percent used alcohol, 7 percent used marijuana,<br />
and 2 percent used opiates other than heroin.<br />
White heroin intranasal users made up 8 percent of<br />
the heroin-using treatment admissions in the Baltimore<br />
PMSA in the first half of 2004. Two-thirds (66<br />
percent) were treated in the suburban counties.<br />
Among heroin intranasal users in the suburban counties<br />
(exhibit 7), about one-half (48 percent) were<br />
White. Fifty-six percent were age 35 and older, although<br />
the proportion of intranasal users age 25 and<br />
younger was 18 percent in the first half of 2004.<br />
Some 39 percent of the suburban intranasal users<br />
were women. The median age at admission was 35,<br />
and the median duration of use before first entering<br />
treatment was 9 years. Most (70 percent) reported<br />
daily heroin use. Less than one-quarter (23 percent)<br />
entered treatment through the criminal justice system,<br />
and almost one-half (47 percent) were receiving<br />
treatment for the first time. A majority (57 percent)<br />
reported use of other drugs—19 percent smoked cocaine,<br />
13 percent used cocaine intranasally, 17 percent<br />
used alcohol, 17 percent used marijuana, and 9<br />
percent used opiates other than heroin.<br />
Of the 40,000 items from Baltimore tested by the<br />
National Forensic Laboratory in FY 2004, 27 percent<br />
were heroin.<br />
Prices for heroin for the second half of 2004 were<br />
reported as $70,000–$125,000 per kilogram at the<br />
wholesale level, $2,000–$3,250 per ounce at midlevel,<br />
and $90–$165 per gram or $10–$20 per bag at<br />
the retail level. The lower limits reported for the<br />
wholesale-level kilogram and retail-level gram were<br />
higher than reported for the second half of 2003, but<br />
the retail-level bag price was unchanged.<br />
Other Opiates and Narcotics<br />
For opiates and narcotics other than heroin, indicators<br />
have increased over the past several years (exhibit 1).<br />
Treatment admission rates for opiates other than heroin<br />
more than doubled between 2000 and 2003, from<br />
23 per 100,000 population age 12 and older to 55 per<br />
100,000 in 2003 (exhibit 2). They were projected to<br />
reach 57 per 100,000 in 2004. Narcotic analgesics<br />
and narcotic analgesic combinations were mentioned<br />
with increasing frequency in drug-related ED episodes.<br />
In 2002, they were mentioned at a rate of 165<br />
per 100,000 population, significantly more than the<br />
114 mentions per 100,000 reported in 2001. Narcotic<br />
analgesics and narcotic analgesic combinations made<br />
<strong>EPIDEMIOLOGIC</strong> TRENDS IN <strong>DRUG</strong> <strong>ABUSE</strong>—Baltimore Metropolitan Area<br />
up 16 percent of all drugs mentioned in 2002, and<br />
they were reported in 30 percent of all drug-related<br />
ED episodes.<br />
Opiates other than heroin were reported by 4 percent<br />
of admissions as the primary substance of abuse, and<br />
they were reported by an additional 4 percent as a<br />
secondary or tertiary substance (exhibit 2). Exhibit 9<br />
combines all admissions reporting opiates other than<br />
heroin as primary, secondary, or tertiary substances.<br />
Treatment admissions involving opiates other than<br />
heroin were primarily White (88 percent). Just over<br />
one-half (56 percent) were male. Almost one-half (47<br />
percent) were age 35 or older, although the proportion<br />
age 25 and younger increased from 21 percent in<br />
2000 to 30 percent in the first half of 2004. The median<br />
age at admission was 33, and the mediation duration<br />
of use of opiates other than heroin before first<br />
entering treatment was 4 years. Daily use of opiates<br />
other than heroin was reported by 68 percent. Only a<br />
small proportion (12 percent) entered treatment<br />
through the criminal justice system, and 42 percent<br />
were entering treatment for the first time.<br />
Marijuana<br />
Indicators of marijuana use have tended to increase<br />
since 2000 (exhibit 1). The rates of marijuana ED<br />
mentions increased significantly in 2002 over 2001.<br />
The annual marijuana treatment admission rate increased<br />
from 200 per 100,000 population age 12 and<br />
over in 2000 to 246 per 100,000 in 2003 (exhibit 2). It<br />
is projected to remain at that level in 2004. The proportion<br />
of marijuana treatment admissions in the first<br />
half of 2004 was higher in the suburban counties (19<br />
percent) than in Baltimore City (11 percent), but the<br />
admission rate for the first half of 2003 was higher in<br />
the city (191 per 100,000 population age 12 and over,<br />
compared with 74 per 100,000 in the counties).<br />
Despite increases in indicators for the Baltimore<br />
PMSA, marijuana use by Maryland high school seniors<br />
declined between 1996 and 2002 (CESAR 2004).<br />
According to the 2002 Maryland School Survey, 21<br />
percent of high school seniors reported past-month use<br />
of marijuana in 2002, compared to 27 percent in 1996.<br />
Almost one-half (43 percent) of high school seniors<br />
had tried marijuana at least once, and 20 percent of<br />
those who had tried it had first used it before age 15<br />
(CESAR 2003). Marijuana use before age 15 was associated<br />
with use of cigarettes and/or alcohol before<br />
age 15, and (in 12th grade) high absenteeism, arrests<br />
because of drugs or alcohol, attitudes that marijuana<br />
and/or cigarettes were safe, and reported parental attitudes<br />
that marijuana and/or cigarettes were safe.<br />
Proceedings of the Community Epidemiology Work Group, Vol. II, January 2005 23
More often than not, marijuana use in the indicator<br />
data sets was associated with the use of alcohol or<br />
other drugs. Marijuana was more frequently reported<br />
as a secondary substance than as a primary substance<br />
by treatment admissions in the total PMSA in the first<br />
half of 2003, at 15 and 18 percent, respectively (exhibit<br />
2). Among treatment admissions for primary<br />
marijuana use in the total PMSA, 61 percent reported<br />
using additional substances (exhibit 10). More than<br />
one-half (52 percent) reported alcohol abuse, 8 percent<br />
reported cocaine use, 3 percent reported use of<br />
heroin, and 3 percent reported use of opiates other<br />
than heroin. Some 8 percent of admissions used other<br />
secondary substances, primarily hallucinogens, phencyclidine<br />
(PCP), and stimulants.<br />
Persons entering treatment for marijuana use were<br />
young: 43 percent were younger than age 18, and the<br />
median age at admission to treatment was 19 (exhibit<br />
10). Marijuana admissions were primarily male (83<br />
percent) and increasingly likely to be African-<br />
American (53 percent in the first half of 2004, compared<br />
with 46 percent in 2000). A large proportion of<br />
marijuana treatment admissions (62 percent) represented<br />
referrals through the criminal justice system.<br />
Admissions were likely to be experiencing their first<br />
treatment episode (65 percent), and more than onethird<br />
(35 percent) reported daily marijuana use.<br />
Of the 40,000 items from Baltimore tested by the<br />
National Forensic Laboratory in FY 2004, 29 percent<br />
were cannabis.<br />
Prices for marijuana for the second half of 2004 were<br />
reported as $2,390–$4,000 per pound for hydroponic<br />
marijuana or $1,000–$1,600 per pound for commercial<br />
grade marijuana at the wholesale level. Midlevel<br />
prices were $275 per ounce for hydroponic and $130<br />
per ounce for commercial grade. At the retail level,<br />
prices were $35–$60 per one-quarter ounce or $20–<br />
$40 per bag. The price range for hydroponic marijuana<br />
was slightly more for the wholesale-level kilogram<br />
than in the second half of 2003. The lower limit<br />
for commercial-grade marijuana at the wholesalelevel<br />
kilogram was more than in the second half of<br />
2003, but the upper limit was unchanged. The price<br />
range was unchanged for a retail-level quantity of<br />
one-quarter ounce or a bag.<br />
Stimulants<br />
Stimulants other than cocaine were rarely mentioned<br />
as the primary substance of abuse by treatment admissions<br />
(exhibit 2). Nevertheless, the numbers, although<br />
small, increased from 42 admissions in 2000 to 73 in<br />
2003; there were 41 admissions for the first half of<br />
24<br />
<strong>EPIDEMIOLOGIC</strong> TRENDS IN <strong>DRUG</strong> <strong>ABUSE</strong>—Baltimore Metropolitan Area<br />
2004. The majority (63 percent) of the first-half 2004<br />
admissions were for methamphetamine, and 29 percent<br />
were for amphetamine. Treatment admissions for<br />
stimulants increased from 2.0 per 100,000 in 2000 to<br />
3.4 per 100,000 in 2003. Projections for 2004 suggest<br />
that the rate may reach 5.2 per 100,000 in 2004.<br />
Preliminary unweighted data accessed from DAWN<br />
Live! indicated 49 ED reports of amphetamine and<br />
four reports of methamphetamine in the first half of<br />
2004.<br />
Other Drugs<br />
Drugs other than alcohol, cocaine, heroin, opiates<br />
(other than heroin), marijuana, and stimulants were<br />
responsible for less than 2 percent of treatment admissions<br />
in the first half of 2004 (exhibit 2). Preliminary<br />
unweighted data for the first half of 2004, accessed<br />
from DAWN Live!, indicated 32 ED reports of methylenedioxymethamphetamine<br />
(MDMA), 21 of PCP,<br />
10 of inhalants, 8 of lysergic acid diethylamide (LSD),<br />
3 of ketamine, and 2 of gamma hydroxybutyrate<br />
(GHB).<br />
Treatment admissions for benzodiazepines and other<br />
tranquilizers declined slightly, from 5.0 per 100,000<br />
population age 12 and older to 3.9 per 100,000 in<br />
2003. Benzodiazepines were mentioned in 11 percent<br />
of drug-related ED episodes in 2002, representing a<br />
small (2 percent) increase from 59 mentions per<br />
100,000 population in 2001 to 60 per 100,000 in 2002.<br />
Treatment admissions for barbiturates and other sedatives<br />
increased slightly, from 2.5 per 100,000 population<br />
age 12 and older in 2001 to 4.2 per 100,000 in<br />
2003. Barbiturate mentions also increased significantly<br />
in drug-related ED episodes, from 13 per 100,000<br />
population in 2001 to 14 per 100,000 in 2002.<br />
Treatment admissions for LSD remained relatively<br />
stable, at about 2.5 per 100,000 population age 12<br />
and over. Treatment admissions for PCP were erratic,<br />
but they were between 2.5 and 5.0 per 100,000 population<br />
age 12 and older from 2001 through 2003. Between<br />
2001 and 2003, treatment admissions for inhalants<br />
declined from 0.9 per 100,000 population age<br />
12 and older to 0.7 per 100,000, while treatment admissions<br />
for over-the-counter drugs rose from 0.3 per<br />
100,000 to 0.5 per 100,000.<br />
INFECTIOUS DISEASES RELATED TO <strong>DRUG</strong> <strong>ABUSE</strong><br />
The annual AIDS case report rate for 2003 for the<br />
Baltimore PMSA (39 cases per 100,000) ranked fifth<br />
behind New York City (59 per 100,000), Miami (46<br />
Proceedings of the Community Epidemiology Work Group, Vol. II, January 2005
per 100,000), San Francisco (45 per 100,000), and<br />
Fort Lauderdale (40 per 100,000) (CDC 2003).<br />
The Baltimore PMSA accounted for 64 percent and<br />
63 percent, respectively, of Maryland’s incident and<br />
prevalent human immunodeficiency virus (HIV)<br />
cases, 59 percent of its incident AIDS cases, and 60<br />
percent of its prevalent AIDS cases (AIDS Administration<br />
2004). Baltimore City by itself accounted for<br />
51 percent of Maryland’s 2003 incident and prevalent<br />
HIV cases, 46 percent of its incident AIDS cases, and<br />
47 percent of its prevalent AIDS cases. The Baltimore<br />
metropolitan area had an AIDS incidence rate<br />
of 33 per 100,000 population for 2003, and an HIV<br />
incidence rate of 49 per 100,000. The AIDS prevalence<br />
rate in the Baltimore metropolitan area in 2003<br />
was 298 per 100,000 population, and the HIV prevalence<br />
rate was 382 per 100,000.<br />
In 2003, Baltimore City’s prevalent HIV/AIDS cases<br />
were about 62 percent male and 81 percent African-<br />
American (AIDS Administration 2004). Forty-four<br />
percent were aged 40–49, and another 24 percent<br />
were aged 30–39. Fifty-six percent of the prevalent<br />
HIV/AIDS cases in Baltimore City in which the risk<br />
category was determined were injection drug users<br />
(IDUs), 15 percent were non-IDU men who had sex<br />
with men, and 26 percent involved heterosexual<br />
transmission. In the suburban counties, prevalent<br />
HIV/AIDS cases were 66 percent male and 55 percent<br />
African-American. Forty-one percent were aged<br />
40–49, and another 29 percent were aged 30–39. For<br />
cases in which the risk category was determined, 36<br />
percent of prevalent HIV/AIDS cases in the suburban<br />
counties were IDUs, 29 percent were non-IDU men<br />
who had sex with men, and 31 percent involved heterosexual<br />
transmission. In Maryland as a whole,<br />
IDUs represented 47 percent of prevalent HIV/AIDS<br />
cases in 2003.<br />
In 1999, Baltimore City ranked highest among the 20<br />
cities most burdened by sexually transmitted diseases<br />
(STDs) for gonorrhea (949 per 100,000 population),<br />
fifth for chlamydia (819 per 100,000 population), and<br />
third for syphilis (38 per 100,000 population) (CDC<br />
2000). By 2003, STD rates for Baltimore City had<br />
decreased for gonorrhea (to 617 per 100,000) and for<br />
syphilis (to 23 per 100,000), but they had increased<br />
for chlamydia (to 1,001 per 100,000) (AIDS Administration<br />
2004).<br />
Voluntary HIV testing is offered to Maryland prison<br />
entrants. Among those tested in 2003, 5 percent were<br />
positive for HIV (AIDS Administration 2004). A 2002<br />
survey of entrants to Baltimore City detention facilities<br />
and Maryland State prison entrants found that newly<br />
<strong>EPIDEMIOLOGIC</strong> TRENDS IN <strong>DRUG</strong> <strong>ABUSE</strong>—Baltimore Metropolitan Area<br />
incarcerated females had much higher HIV rates than<br />
newly incarcerated males (13 percent and 4 percent,<br />
respectively) (AIDS Administration 2004).<br />
The survey of prison entrants also found that 25 percent<br />
had been infected by hepatitis B and 30 percent<br />
had antibodies to hepatitis C (Solomon et al. 2004).<br />
REFERENCES<br />
AIDS Administration. Maryland Department of<br />
Health and Mental Hygiene and Maryland Department<br />
of Public Safety and Correctional Services,<br />
2003. Examination of HIV, Syphilis, Hepatitis<br />
B and Hepatitis C in Maryland Correctional<br />
Facilities. Cited in: AIDS Administration, Maryland<br />
Department of Health and Mental Hygiene.<br />
The Maryland 2004 HIV/AIDS Annual Report,<br />
2004:85.<br />
AIDS Administration. Maryland Department of Health<br />
and Mental Hygiene, 2004. The Maryland 2004<br />
HIV/AIDS Annual Report, 2004: 7, 9, 31–33<br />
(electronic access: last accessed March 5, 2005).<br />
Center for Substance Abuse Research (CESAR),<br />
2004. DEWS–Drug Early Warning System,<br />
2004: 5(8). University of Maryland, College<br />
Park, Md. (electronic access ).<br />
Center for Substance Abuse Research (CESAR),<br />
2003. Warning Signs for Early Marijuana Users<br />
among Maryland’s Public School Students,<br />
DEWS Investigates, 2003. University of Maryland,<br />
College Park, Md. (electronic access<br />
).<br />
Centers for Disease Control and Prevention (CDC),<br />
2000. Tracking the Hidden Epidemics: Trends in<br />
STDs in the United States, 2000. U.S. Department<br />
of Health and Human Services. Cited in:<br />
AIDS Administration, Maryland Department of<br />
Health and Mental Hygiene. The Maryland 2004<br />
HIV/AIDS Annual Report, 2004:82.<br />
Centers for Disease Control and Prevention (CDC),<br />
2003. Cases of HIV Infection and AIDS in the<br />
United States, 2003. HIV/AIDS Surveillance Report<br />
Vol. 15. U.S. Department of Health and<br />
Human Services. Cited in: AIDS Administration,<br />
Maryland Department of Health and Mental Hygiene.<br />
The Maryland 2004 HIV/AIDS Annual<br />
Report, 2004:54-5.<br />
Proceedings of the Community Epidemiology Work Group, Vol. II, January 2005 25
Solomon, L.; Flynn, C.; Muck, K.; et al., 2004.<br />
Prevalence of HIV, syphilis, hepatitis B, and<br />
hepatitis C among entrants to Maryland correctional<br />
facilities. Journal of Urban Health 81(1).<br />
26<br />
<strong>EPIDEMIOLOGIC</strong> TRENDS IN <strong>DRUG</strong> <strong>ABUSE</strong>—Baltimore Metropolitan Area<br />
Cited in: AIDS Administration, Maryland Department<br />
of Health and Mental Hygiene. The<br />
Maryland 2004 HIV/AIDS Annual Report,<br />
2004:81.<br />
For inquiries concerning this report, please contact Leigh A. Henderson, Ph.D., Synectics for Management Decisions, Inc., 1901 N. Moore St.,<br />
Suite 900, Arlington VA 22209, Phone: (703) 807-2328, Fax: (703) 528-6430, or E-mail: leighh@smdi.com.<br />
Proceedings of the Community Epidemiology Work Group, Vol. II, January 2005
<strong>EPIDEMIOLOGIC</strong> TRENDS IN <strong>DRUG</strong> <strong>ABUSE</strong>—Baltimore Metropolitan Area<br />
Exhibit 1. Annual Rates of Drug-Related Treatment Admissions and ED Mentions per 100,000 Population,<br />
and Numbers of Drug-Related Deaths in Baltimore: 1994–2004 1<br />
Per 100,000<br />
Per 100,000<br />
900<br />
600<br />
300<br />
250<br />
200<br />
150<br />
100<br />
50<br />
Heroin<br />
0<br />
1994 1996 1998 2000 2002 2004<br />
ED Treatment Deaths (no.)<br />
Marijuana<br />
0<br />
1994 1996 1998 2000 2002 2004<br />
ED Treatment<br />
Per 100,000<br />
Per 100,000<br />
Cocaine<br />
0<br />
1994 1996 1998 2000 2002 2004<br />
ED Treatment Deaths (no.)<br />
Proceedings of the Community Epidemiology Work Group, Vol. II, January 2005 27<br />
400<br />
300<br />
200<br />
100<br />
250<br />
200<br />
150<br />
100<br />
50<br />
Other Opiates<br />
0<br />
1994 1996 1998 2000 2002 2004<br />
ED Treatment Deaths (no.)<br />
1Treatment admission rates for 2004 are projected based on data for January–June 2004.<br />
SOURCES: DAWN, OAS, SAMHSA, and Alcohol and Drug Abuse Administration, Maryland Department of Health and Mental Hygiene
28<br />
<strong>EPIDEMIOLOGIC</strong> TRENDS IN <strong>DRUG</strong> <strong>ABUSE</strong>—Baltimore Metropolitan Area<br />
Proceedings of the Community Epidemiology Work Group, Vol. II, January 2005
<strong>EPIDEMIOLOGIC</strong> TRENDS IN <strong>DRUG</strong> <strong>ABUSE</strong>—Baltimore Metropolitan Area<br />
Proceedings of the Community Epidemiology Work Group, Vol. II, January 2005 29
30<br />
<strong>EPIDEMIOLOGIC</strong> TRENDS IN <strong>DRUG</strong> <strong>ABUSE</strong>—Baltimore Metropolitan Area<br />
Proceedings of the Community Epidemiology Work Group, Vol. II, January 2005
<strong>EPIDEMIOLOGIC</strong> TRENDS IN <strong>DRUG</strong> <strong>ABUSE</strong>—Baltimore Metropolitan Area<br />
Exhibit 5. Numbers of Primary, Secondary, and Tertiary Cocaine Treatment Admissions in Baltimore, by<br />
Route of Administration, Age, and Race: First Half of 2004<br />
Number<br />
Number<br />
200<br />
150<br />
100<br />
50<br />
0<br />
200<br />
150<br />
100<br />
50<br />
0<br />
Smoking<br />
10 20 30 40 50 60<br />
Age<br />
White African-American<br />
Intranasal<br />
10 20 30 40 50 60<br />
Age<br />
White African-American<br />
Number<br />
Injection<br />
Proceedings of the Community Epidemiology Work Group, Vol. II, January 2005 31<br />
200<br />
150<br />
100<br />
50<br />
0<br />
10 20 30 40 50 60<br />
Age<br />
White African-American<br />
SOURCE: Alcohol and Drug Abuse Administration, Maryland Department of Health and Mental Hygiene
32<br />
<strong>EPIDEMIOLOGIC</strong> TRENDS IN <strong>DRUG</strong> <strong>ABUSE</strong>—Baltimore Metropolitan Area<br />
Exhibit 6. Numbers of Primary Heroin Treatment Admissions in Baltimore, by Route of Administration,<br />
Age, and Race: First Half of 2004<br />
Number<br />
200<br />
150<br />
100<br />
50<br />
0<br />
Injection<br />
10 20 30 40 50 60<br />
Age<br />
White African-American<br />
Number<br />
200<br />
150<br />
100<br />
50<br />
0<br />
Intranasal<br />
10 20 30 40 50 60<br />
Age<br />
White African-American<br />
SOURCE: Alcohol and Drug Abuse Administration, Maryland Department of Health and Mental Hygiene<br />
Proceedings of the Community Epidemiology Work Group, Vol. II, January 2005
<strong>EPIDEMIOLOGIC</strong> TRENDS IN <strong>DRUG</strong> <strong>ABUSE</strong>—Baltimore Metropolitan Area<br />
Proceedings of the Community Epidemiology Work Group, Vol. II, January 2005 33
34<br />
<strong>EPIDEMIOLOGIC</strong> TRENDS IN <strong>DRUG</strong> <strong>ABUSE</strong>—Baltimore Metropolitan Area<br />
Proceedings of the Community Epidemiology Work Group, Vol. II, January 2005
<strong>EPIDEMIOLOGIC</strong> TRENDS IN <strong>DRUG</strong> <strong>ABUSE</strong>—Baltimore Metropolitan Area<br />
Proceedings of the Community Epidemiology Work Group, Vol. II, January 2005 35
36<br />
<strong>EPIDEMIOLOGIC</strong> TRENDS IN <strong>DRUG</strong> <strong>ABUSE</strong>—Baltimore Metropolitan Area<br />
Proceedings of the Community Epidemiology Work Group, Vol. II, January 2005
<strong>EPIDEMIOLOGIC</strong> TRENDS IN <strong>DRUG</strong> <strong>ABUSE</strong>—Greater Boston<br />
Patterns and Trends in Drug Abuse: Greater Boston<br />
Daniel P. Dooley 1<br />
ABSTRACT<br />
Heroin, cocaine, marijuana, and certain narcotic<br />
analgesics are the dominant drugs of abuse in the<br />
greater Boston area. Though indicators show continued<br />
high levels of abuse of these drugs, budget cutbacks<br />
have contributed to an 18-percent reduction in<br />
overall treatment admissions in the past year (FY<br />
2003 to FY 2004) and a 22-percent reduction over the<br />
past 2 years. After years of continued growth, the<br />
most recent heroin indicators show some signs of<br />
stabilization at very high levels. Heroin was indicated<br />
more than any other drug (excluding alcohol) in preliminary<br />
unweighted ED data for the first half of<br />
2004, totaling 1,491 reports. In 2002, heroin/morphine<br />
was indicated in 46 percent of the 419 drug<br />
abuse deaths. Heroin treatment admissions have<br />
steadily increased during the past 8 years, accounting<br />
for close to one-half of all primary drug admissions<br />
in FY 2004. Cocaine was indicated in 29 percent of<br />
the drug abuse deaths (second only to heroin/morphine)<br />
in 2002. Preliminary unweighted firsthalf<br />
2004 ED data show cocaine as the second most<br />
indicated drug (excluding alcohol), at 1,338 reports.<br />
Cocaine treatment percentages remained fairly stable,<br />
with 23 percent of those seeking treatment reporting<br />
current (past-month) cocaine use in FY 2004.<br />
Marijuana treatment percentages were stable, with<br />
10 percent of those seeking treatment reporting current<br />
(past-month) marijuana use in FY 2004. Boston’s<br />
drug abuse indicators continue to show<br />
growing levels of narcotic analgesic abuse fueled<br />
primarily by oxycodone (including derivatives such<br />
as OxyContin) and hydrocodone. Narcotic analgesics<br />
accounted for nearly one in four (24 percent) singledrug<br />
deaths in 2002, up 100 percent from 2000. The<br />
Other Opiate category of primary treatment admissions<br />
reached the same proportion as marijuana by<br />
increasing tenfold from FY 1997 to FY 2004. Samples<br />
of oxycodone seized during drug arrests and<br />
oxycodone Helpline call mentions continued to show<br />
dramatic increases. Though the numbers are small,<br />
indicators suggest a growing level of methamphetamine<br />
abuse in Boston. Methamphetamine primary<br />
treatment admissions increased tenfold from FY<br />
2001 to FY 2004, as did the number of seized amphetamine<br />
(including methamphetamine) samples<br />
from 2000 to 2003. In 2003, 263 HIV and AIDS<br />
1 The author is affiliated with the Boston Public Health Commission, Boston, Massachusetts.<br />
cases were diagnosed in Boston. Primary transmission<br />
risk of these cases included 12 percent who were<br />
IDUs, 5 percent who had sex with IDUs, and 35 percent<br />
with an unknown/undetermined transmission<br />
status.<br />
INTRODUCTI<strong>ON</strong><br />
Area Description<br />
This report presents data from a number of different<br />
sources with varied Boston-area geographical parameters.<br />
A description of the relevant boundary parameters<br />
is included with each data source description. For simplicity,<br />
these are all referred to as “Boston” throughout<br />
the text.<br />
According to the 2000 U.S. census, Massachusetts<br />
ranks 13th in population (6,349,097 people). The<br />
746,914 people in the metropolitan Boston area represent<br />
12 percent of the total Massachusetts population.<br />
The 2000 census data show 589,141 residents of<br />
the city of Boston. The racial composition is 50 percent<br />
White non-Hispanic, 23 percent Black non-<br />
Hispanic, 14 percent Hispanic/Latino, and 8 percent<br />
Asian.<br />
Several characteristics influence drug trends in Boston<br />
and throughout Massachusetts:<br />
• Contiguity with five neighboring States (Rhode<br />
Island, Connecticut, New York, Vermont, and<br />
New Hampshire) linked by a network of State and<br />
interstate highways<br />
• Proximity to Interstate 95, which connects Boston<br />
to all major cities on the east coast, particularly<br />
New York<br />
• A well-developed public transportation system<br />
that provides easy access to communities in eastern<br />
Massachusetts<br />
• A large population of college students in both the<br />
greater Boston area and western Massachusetts<br />
• Several seaport cities with major fishing industries<br />
and harbor areas<br />
Proceedings of the Community Epidemiology Work Group, Vol. II, January 2005 37
• Logan International Airport and several regional<br />
airports within a 1-hour drive of Boston<br />
• Declining State revenues producing social service<br />
cutbacks<br />
• A high number of homeless individuals seeking<br />
shelter<br />
Data Sources<br />
Data sources for this report include the following:<br />
• Emergency department (ED) drug mentions<br />
data were provided by the Drug Abuse Warning<br />
Network (DAWN), Office of Applied Studies<br />
(OAS), Substance Abuse and Mental Health Services<br />
Administration (SAMHSA), for a Boston<br />
metropolitan area consisting of five Massachusetts<br />
counties: Essex, Middlesex, Norfolk, Plymouth,<br />
and Suffolk. DAWN weighted estimates for 2002<br />
are presented in this paper and are the most recent<br />
final estimates. In 2003, OAS instituted a redesigned<br />
ED system. The data from the new system<br />
cannot be compared with those for 2002 and before.<br />
In the Boston metropolitan area, 29 of the 41<br />
eligible hospitals are in the new DAWN sample.<br />
The EDs in the new sample total 34. (Some hospitals<br />
have more than one ED.) For this report, data<br />
were accessed from the DAWN Live! restrictedaccess<br />
online query system for the first half of<br />
2004, updated on December 12–13, 2004. The<br />
2004 data are unweighted. They are not estimates<br />
for the Boston area and cannot be used for comparison<br />
with future data. Only weighted data released<br />
by SAMHSA can be used in trend analysis.<br />
The data reported here are incomplete. Between<br />
18 and 20 EDs reported each month over the 6month<br />
period. Since all DAWN cases are reviewed<br />
for quality control, and cases may be corrected<br />
or deleted based on the review, the data are<br />
subject to change. Data presented in this paper<br />
represent drug reports in drug-related visits in the<br />
first 6 months of 2004. Drug reports exceed the<br />
number of visits, since a patient may report use of<br />
multiple drugs (up to six drugs plus alcohol). A<br />
full description of the DAWN system can be<br />
found at .<br />
• Drug-related death data were provided by<br />
DAWN, OAS, SAMHSA, for 2002 for a Boston<br />
metropolitan area consisting of five Massachusetts<br />
counties: Essex, Middlesex, Norfolk, Plymouth,<br />
and Suffolk.<br />
• State-funded substance abuse treatment admissions<br />
data for a Boston region comprising the<br />
38<br />
<strong>EPIDEMIOLOGIC</strong> TRENDS IN <strong>DRUG</strong> <strong>ABUSE</strong>—Greater Boston<br />
cities of Boston, Brookline, Chelsea, Revere, and<br />
Winthrop (Community Health Network Area<br />
[CHNA] 19), for fiscal year (FY) 1997 through<br />
FY 2004 (July 1, 1996, through June 30, 2004)<br />
were provided by the Massachusetts Department<br />
of Public Health (DPH), Bureau of Substance<br />
Abuse Services.<br />
• Analysis of seized drug samples for a Boston<br />
region comprising the cities of Boston, Brookline,<br />
Chelsea, Revere, and Winthrop (CHNA 19), for<br />
January 1, 1997, through June 30, 2003, was provided<br />
by the DPH Drug Analysis Laboratory.<br />
• Information on drug mentions in Helpline calls<br />
for a Boston region comprising the cities of Boston,<br />
Brookline, Chelsea, Revere, and Winthrop<br />
(CHNA 19) for FY 2000 through FY 2004 were<br />
provided by the Massachusetts Substance Abuse<br />
Information and Education Helpline.<br />
• Drug arrests data for the city of Boston for<br />
1997–2003 were provided by the Boston Police<br />
Department Drug Control Unit and Office of Research<br />
and Evaluation.<br />
• Drug price, purity, and availability data for<br />
New England as of November 2003 were provided<br />
by the Drug Enforcement Administration<br />
(DEA), New England Field Division Intelligence<br />
Group.<br />
• Heroin overdose calls to Boston Emergency<br />
Medical Services (BEMS) were reported for the<br />
city of Boston for 2003. Overdose calls require at<br />
least two of the following: pinpoint pupils, nodding<br />
off, track marks, drug paraphernalia, patient<br />
admission, depressed respiratory effort, witness<br />
report, effective administration of Narcan.<br />
• Youth Risk Behavior Survey data were provided<br />
by the Boston Public School Department<br />
and included self-reported drug use prevalence<br />
among Boston public high school students in<br />
2003.<br />
• Data on Massachusetts pharmacy OxyContin<br />
thefts for 2000 through 2004 were provided by<br />
the Massachusetts Pharmacy Board of Registration.<br />
• Acquired immunodeficiency syndrome (AIDS)<br />
and human immunodeficiency virus (HIV)<br />
data by year between 1993 and 2003, and cumulative<br />
data through January 1, 2005, were provided<br />
by the DPH AIDS Surveillance Program.<br />
Proceedings of the Community Epidemiology Work Group, Vol. II, January 2005
<strong>DRUG</strong> <strong>ABUSE</strong> PATTERNS AND TRENDS<br />
Cocaine/Crack<br />
Cocaine and crack are heavily abused drugs in Boston.<br />
The most recent cocaine/crack indicators are<br />
fairly stable and show continued levels of high use<br />
and abuse. There are signs that the primary using<br />
population is aging.<br />
In 2002, cocaine was indicated in 121 of the 419 drug<br />
abuse deaths in Boston (28.9 percent)—second only<br />
to heroin/morphine. Thirty-three of those were single-drug<br />
deaths.<br />
The cocaine/crack ED mentions rate of 156 per<br />
100,000 population in 2002 was similar to that of the<br />
2 previous years. Exhibit 1 shows 5,611 cocaine ED<br />
mentions in 2002.<br />
The 2002 ED rates by gender show that the cocaine/crack<br />
rate for males was almost 1.8 times the<br />
rate for females (200 vs. 113 per 100,000 population).<br />
The highest rate by an age group (358 per<br />
100,000 population) occurred among those age 26–<br />
34. Within that group, those age 26–29 experienced a<br />
rate of 403 per 100,000 population. A 2-year rate<br />
increase of 76 percent was reported among those age<br />
18–25. Similarly, a 2-year rate increase of 70 percent<br />
occurred among those age 45–54.<br />
In the unweighted data accessed from DAWN Live!<br />
for the first half of 2004, cocaine reports totaled<br />
1,338.<br />
Greater Boston cocaine/crack admissions to Statefunded<br />
treatment programs continue to decline. In FY<br />
2004, there were 1,470 treatment admissions (7 percent<br />
of all admissions) with clients reporting cocaine<br />
or crack as their primary drug and 4,540 mentions<br />
(23 percent of all admissions) of current cocaine or<br />
crack use (exhibit 2). The percent reporting cocaine/crack<br />
as their primary drug decreased 10 percent<br />
from FY 2003, 16 percent from FY 2002, and 62<br />
percent from FY 1997. The percent of mentions of<br />
current (past-month) cocaine/crack use decreased 6<br />
percent from FY 2003 and 33 percent from FY 1997.<br />
Exhibit 3 shows the demographic characteristics of<br />
admissions to Greater Boston treatment programs in<br />
FY 1997–FY 2004. The gender distribution of cocaine/crack<br />
primary drug treatment admissions in FY<br />
2004 (57 percent male and 43 percent female) remained<br />
stable from FY 2003 (exhibit 4a).<br />
The cocaine primary treatment population continues<br />
to age. The mean age of those admitted to co-<br />
<strong>EPIDEMIOLOGIC</strong> TRENDS IN <strong>DRUG</strong> <strong>ABUSE</strong>—Greater Boston<br />
caine/crack treatment in FY 2004 was 38.0 years,<br />
compared to 32.8 in FY 1997. By FY 2004, 42 percent<br />
of cocaine/crack treatment admissions were age<br />
40 and older, compared to 15 percent in FY 1997.<br />
This shift is seen across all age groups, with decreasing<br />
percentages among those younger than 40 and<br />
increasing percentages among those older than 40.<br />
The racial distribution of primary cocaine admissions<br />
remained stable from FY 2003 to FY 2004, with 58<br />
percent Black, 27 percent White, and 12 percent Latino.<br />
There were 1,736 Class B (mainly cocaine and crack)<br />
drug arrests in 2003 (exhibit 5). Class B arrests accounted<br />
for the largest proportion of drug arrests (42<br />
percent) in the city of Boston in 2003, similar to<br />
2002. However, the proportion of Class B arrests<br />
decreased 12 percent from 1997 to 2003.<br />
The proportion of Hispanic Class B arrests (17 percent)<br />
decreased 26 percent from 2001 to 2003. The<br />
proportion of Black Class B arrests (67 percent) increased<br />
10 percent, while the proportion of White<br />
Class B arrests (32 percent) decreased 16 percent<br />
from 1997. The proportion of Class B arrests of those<br />
age 40 and older (26 percent) increased 60 percent<br />
from 1997, while arrests for those age 25–39 (44 percent)<br />
decreased 16 percent. Arrests for those younger<br />
than 20 decreased 24 percent during the same period.<br />
In 2003, 2,739 seized samples of cocaine/crack were<br />
analyzed. The proportion of cocaine/crack samples<br />
among all drug samples analyzed (30 percent) did not<br />
change from 2002, but it has decreased 14 percent<br />
from 1997.<br />
Cocaine/crack was self-identified as a substance of<br />
abuse in 1,017 calls to the Helpline in FY 2004. The<br />
proportion of Helpline calls with mentions of cocaine/crack<br />
(18 percent) decreased 9 percent from FY<br />
2003 to FY 2004.<br />
The DEA reports that street cocaine costs $50–$90<br />
per gram in Boston (exhibit 6). A rock of crack costs<br />
$10–$20. Cocaine purity has been decreasing, but<br />
availability is “steady” throughout Massachusetts,<br />
“especially in inner cities.”<br />
Heroin<br />
Heroin is arguably Boston’s most abused drug. Heroin/morphine<br />
was indicated most often among drug<br />
abuse deaths, preliminary emergency department<br />
data, and treatment admissions. After years of continued<br />
growth, some indicators show heroin abuse<br />
stabilizing at very high levels.<br />
Proceedings of the Community Epidemiology Work Group, Vol. II, January 2005 39
In 2002, heroin/morphine was indicated in 192 drug<br />
abuse deaths—more than any other drug among the<br />
419 total drug abuse deaths (45.8 percent). Sixty of<br />
those mentions were single-drug (heroin/morphine<br />
only) deaths.<br />
In 2002, the heroin ED mentions rate of 111 per<br />
100,000 population was similar to that of the 2 previous<br />
years.<br />
The 2002 ED rates by gender show that the heroin<br />
rate for males was more than two times the rate for<br />
females (152 vs. 72 per 100,000 population). The<br />
highest rate by an age group (311 per 100,000 population)<br />
occurred among those age 26–29. A 2-year<br />
rate increase of 215 percent was seen among those<br />
age 18–19.<br />
In the unweighted data accessed from DAWN Live!<br />
for the first half of 2004, there were 1,491 heroin<br />
reports.<br />
BEMS data reveal 716 heroin overdose calls for<br />
medical services in the city during 2003. Of these, 72<br />
percent were for males and 28 percent were for females.<br />
Narcan was administered to 41 percent of the<br />
patients, and of these, more than 90 percent responded.<br />
In Greater Boston in FY 2004, there were 9,621<br />
treatment admissions (48 percent of all admissions)<br />
with clients reporting heroin as their primary drug,<br />
and 9,109 mentions (46 percent of all admissions) of<br />
current (past-month) heroin use among those admitted<br />
to State-funded treatment programs (exhibit 2).<br />
The percent reporting heroin as their primary drug in<br />
FY 2004 was stable from FY 2003 but reflected increases<br />
of 11 percent from FY 2002 and 68 percent<br />
from FY 1997. Similarly, the percent of mentions of<br />
current (past-month) heroin use in FY 2004 was stable<br />
from FY 2003, but this reflected increases of 7<br />
percent from FY 2002 and 62 percent from FY 1997.<br />
The gender distribution of heroin primary drug treatment<br />
admissions in FY 2004 (73 percent male and 27<br />
percent female) represent a slight shift from FY 2003,<br />
with a 3-percent decrease in the male proportion and<br />
an 8-percent increase in the female proportion (exhibit<br />
4b).<br />
While one heroin treatment cohort is aging, a<br />
younger cohort is emerging. As a result, the mean age<br />
of those admitted to heroin treatment in FY 2004 was<br />
stable at 35.5 years. The percentage of admissions<br />
aged 30–39 (32 percent) decreased 10 percent from<br />
40<br />
<strong>EPIDEMIOLOGIC</strong> TRENDS IN <strong>DRUG</strong> <strong>ABUSE</strong>—Greater Boston<br />
FY 2003 and 28 percent from FY 1997. During the<br />
same time periods, the percentages of admissions<br />
younger than 30 increased 8 percent and 14 percent,<br />
and admissions age 40 and older increased 4 percent<br />
and 34 percent, respectively.<br />
The FY 2004 racial distribution for heroin admissions<br />
(58 percent White, 16 percent Black, and 23 percent<br />
Hispanic) continued to reflect a trend of increasing<br />
White percentages (up 20 percent from FY 1997) and<br />
decreasing Black percentages (down 38 percent from<br />
FY 1997) (exhibit 4b). The percentage of heroin admissions<br />
reporting being homeless (41 percent) increased<br />
42 percent from FY 1997. Seventy-three<br />
percent of those in treatment for heroin as their primary<br />
drug of abuse reported needle use in the past<br />
year.<br />
There were 939 Class A (mainly heroin and other<br />
opiates) drug arrests in 2003 (exhibit 5). The proportion<br />
of Class A drug arrests among all drug arrests in<br />
the city of Boston in 2003 (23 percent) was stable<br />
from 2002 but a decrease of 15 percent from 2001.<br />
The proportion of Class A male arrests in 2003 (87<br />
percent) reflected a 4-percent increase from 2002 and<br />
an 8-percent increase from 1997. The proportion of<br />
Class A arrests among those age 20–24 in 2003 (15<br />
percent) reflected a 63-percent increase from 1997.<br />
In 2003, 1,419 seized samples of heroin (15 percent of<br />
all drug samples) were analyzed. The proportion of<br />
heroin samples among all drug samples analyzed did<br />
not change from 2002 to 2003, but it decreased 19<br />
percent from 2001 to 2003.<br />
Heroin was self-identified as a substance of abuse in<br />
2,230 calls to the Helpline in FY 2004 (representing 40<br />
percent of all calls). The proportion of heroin Helpline<br />
call mentions increased 9 percent from FY 2003 to FY<br />
2004.<br />
The DEA reports that in Boston, street heroin costs<br />
$6–$20 per bag, with an average purity of 40 percent<br />
and is “readily available” throughout the New England<br />
area (exhibit 6).<br />
Narcotic Analgesics<br />
Narcotic analgesics, including oxycodone and other<br />
opiates, are continuing to show alarming increases<br />
among the various indicators.<br />
Narcotic analgesics were mentioned 176 times<br />
among 419 drug abuse deaths in 2002. Forty-two of<br />
those mentions were single-drug deaths, representing<br />
24 percent of all single-drug deaths.<br />
Proceedings of the Community Epidemiology Work Group, Vol. II, January 2005
The 2002 narcotic analgesics/combinations rate of 97<br />
ED mentions per 100,000 population was twice the<br />
national rate of 46 and fourth highest among all 21<br />
DAWN sites.<br />
In 2002, Boston had the highest oxycodone/combinations<br />
ED rate (a subset of the narcotic analgesics/combinations<br />
category) among all 21 DAWN<br />
sites. Boston’s rate of 34 was 3.8 times the national<br />
rate of 9 and an increase of 118 percent from 2000.<br />
Preliminary unweighted data from DAWN Live! show<br />
1,018 reports of opiates/opioids in the first half of<br />
2004. There were 609 oxycodone reports and 53 reports<br />
for hydrocodone.<br />
In FY 2004, there were 781 admissions (4 percent of<br />
all admissions) to treatment who identified other opiates/synthetics<br />
as the primary drug, and there were<br />
1,529 mentions (8 percent of all admissions) of current<br />
other opiate use among those admitted to State-funded<br />
treatment programs (exhibit 2).<br />
The percent reporting other opiates/synthetics as their<br />
primary drug in FY 2004 reflected a 22-percent increase<br />
from FY 2003, a 31-percent increase from FY<br />
2002, and a 1,082-percent increase from FY 1997.<br />
Similarly, the percent of mentions of current (pastmonth)<br />
other opiate/synthetic use in FY 2004 reflected<br />
increases of 17 percent from FY 2003, 22 percent from<br />
FY 2002, and 239 percent from FY 1997.<br />
Drug lab submissions show a 30-percent increase in<br />
the number of oxycodone samples from 2002<br />
(n=212) to 2003 (275) and a 99-percent increase from<br />
2001 (138) to 2003.<br />
In FY 2004, there were 1,025 calls to the Helpline<br />
during which opiates were mentioned (18 percent of<br />
all calls). Oxycodone (including OxyContin) was mentioned<br />
in 691 calls. Helpline calls with oxycodone<br />
mentions in FY 2004 (12 percent of total) reflected<br />
increases of 25 percent from FY 2003, 52 percent from<br />
FY 2002, and 261 percent from FY 2001. Other narcotic<br />
analgesics including methadone, codeine, morphine,<br />
Percocet, Vicodin, and Roxicet were mentioned<br />
among 401 calls (7 percent of total calls).<br />
Unlike the other opiate indicators, statewide Oxy-<br />
Contin thefts continue to decrease in number. There<br />
were 33 statewide OxyContin thefts reported by<br />
pharmacies during 2004, compared with 62 in 2003,<br />
93 in 2002, and the peak of 139 thefts in 2001. This<br />
continued downward trend in the number of thefts<br />
most likely does not reflect a real drop in OxyContin<br />
demand, but changes in pharmacy supply procedures.<br />
<strong>EPIDEMIOLOGIC</strong> TRENDS IN <strong>DRUG</strong> <strong>ABUSE</strong>—Greater Boston<br />
The most recent DEA data reports OxyContin’s price<br />
at $1 per milligram on the street (exhibit 6).<br />
Marijuana<br />
The most recent marijuana indicators for greater Boston<br />
are relatively stable at high levels.<br />
In Massachusetts, marijuana is not routinely tested<br />
and reported among drug abuse death surveillance.<br />
The 2002 marijuana ED rate of 119 per 100,000<br />
population was similar to that of the 2 previous years.<br />
The 2002 marijuana ED rate for males was almost<br />
two times the rate for females (156 vs. 83 per<br />
100,000 population). The highest rate by an age<br />
group (321 per 100,000 population) occurred among<br />
those age 18–25. Within that group, those age 18–19<br />
experienced a rate of 630 per 100,000 population.<br />
The unweighted data from DAWN Live! indicate<br />
there were 783 reports for marijuana in the first half<br />
of 2004.<br />
In FY 2004, there were 857 treatment admissions (4<br />
percent of all admissions) with clients reporting marijuana<br />
as their primary drug and 2,056 mentions (10<br />
percent of all admissions) of current (past-month)<br />
marijuana use among those admitted to State-funded<br />
treatment programs (exhibit 2).<br />
The proportion reporting marijuana as their primary<br />
drug in FY 2004 was similar to the proportions in FY<br />
2003, FY 2002, and FY 1997. The percent of mentions<br />
of current marijuana use decreased 10 percent<br />
from FY 2003 to FY 2004 and 34 percent from FY<br />
1997 to FY 2004.<br />
Though the number of female admissions for marijuana<br />
did not change from FY 2003, the proportion of<br />
female marijuana primary drug treatment admissions<br />
increased 26 percent (from 23 percent to 29 percent)<br />
(exhibit 4c). This resulted from a drop in the number<br />
of male admissions (from 803 to 608).<br />
The mean age of those admitted to marijuana treatment<br />
in FY 2004 was 26.3 years. Sixty-nine percent<br />
of admissions to treatment for primary marijuana use<br />
were younger than 30. Within this group, there has<br />
been a shift since FY 1997 to higher percentages of<br />
those aged 19–29 and lower percentage of those aged<br />
18 and younger. The percentage of admissions of<br />
those aged 19–29 (52 percent) increased 22 percent<br />
from FY 1997 to FY 2004. During the same timeframe,<br />
the percentage of those aged 18 and younger<br />
(17 percent) decreased 48 percent.<br />
Proceedings of the Community Epidemiology Work Group, Vol. II, January 2005 41
The FY 2004 racial distribution for marijuana admissions<br />
(29 percent White, 47 percent Black, and 20<br />
percent Hispanic/Latino) was relatively stable from<br />
FY 2003.<br />
Eleven percent of marijuana primary drug admissions<br />
reported being homeless in FY 2004.<br />
There were 1,366 Class D (mainly marijuana) drug<br />
arrests in 2003 (exhibit 5). The proportion of Class D<br />
arrests among all drug arrests (32.7 percent) in the<br />
city of Boston in 2003 was stable from 2002, but it<br />
reflected a 14-percent increase from 2001.<br />
The proportion of White Class D arrests (32 percent)<br />
in 2003 reflected a 12-percent decrease from 2002, a<br />
15-percent decrease from 2001, and a 25-percent<br />
decrease from 1997. The proportion of Black Class D<br />
arrests (66 percent) increased 7, 9, and 19 percent,<br />
respectively, during the same periods.<br />
There were 3,348 seized samples of marijuana, more<br />
than any other drug analyzed by the drug lab in 2003.<br />
The proportion of marijuana samples analyzed in<br />
2003 (36 percent of all drug samples) was similar to<br />
2002.<br />
Marijuana was self-identified as a substance of abuse<br />
in 253 calls to the Helpline in FY 2004 (representing<br />
5 percent of all calls).<br />
The DEA’s most recent data reports that marijuana is<br />
readily available in Massachusetts and sells for $800–<br />
$1,500 per pound for “commercial grade.” A marijuana<br />
cigarette or joint typically costs $5 (exhibit 6).<br />
Benzodiazepines<br />
As a group, benzodiazepines are showing high levels<br />
of abuse.<br />
Benzodiazepines were mentioned 52 times among the<br />
419 drug abuse deaths in 2002. This number is down<br />
considerably from the 136 mentions among 374 drug<br />
abuse deaths in 2001.<br />
Boston’s 2002 rate of 102 benzodiazepines ED mentions<br />
per 100,000 population was highest among all<br />
21 DAWN sites and nearly 2½ times the national rate<br />
of 42.<br />
In the unweighted DAWN Live! data for the first half<br />
of 2004, there were 755 benzodiazepine reports.<br />
Clonazepam, alprazolam, lorazepam, and diazepam<br />
were the most often indicated benzodiazepines in<br />
preliminary ED data for the first half of 2004.<br />
42<br />
<strong>EPIDEMIOLOGIC</strong> TRENDS IN <strong>DRUG</strong> <strong>ABUSE</strong>—Greater Boston<br />
Treatment, arrest, and drug lab data are currently<br />
unavailable for benzodiazepines.<br />
In FY 2004, there were 175 calls to the Helpline during<br />
which benzodiazepines (including Ativan, Valium,<br />
Xanax, Klonopin, Rohypnol, Halcion, and<br />
others) were self-identified as substances of abuse<br />
(representing 3 percent of all calls). The number and<br />
proportion of Helpline call mentions attributable to<br />
benzodiazepines remained fairly stable from FY 2000<br />
to FY 2004.<br />
Methylenedioxymethamphetamine (MDMA)<br />
MDMA (ecstasy) indicators show relatively low and<br />
stable levels of abuse.<br />
In 2002, there were an estimated 116 MDMA ED<br />
mentions (down slightly from 140 in 2001) (exhibit<br />
1). Of these, 59 percent were among males and 79<br />
percent were among those younger than 26.<br />
The unweighted data from DAWN Live! for the first<br />
half of 2004 show only 40 MDMA reports.<br />
Drug lab submissions show the number of MDMA<br />
samples peaked at 106 in 2000 then dropped to 56<br />
(fewer than 1 percent of the 9,219 total samples) in<br />
2003.<br />
In FY 2004, there were 24 calls to the Helpline during<br />
which MDMA was self-identified as a substance<br />
of abuse (representing less than 1 percent of all mentions).<br />
The number of Helpline MDMA calls decreased<br />
44 percent from FY 2000 to FY 2004.<br />
The most recent DEA data show that one MDMA<br />
tablet costs between $20 and $25 retail (exhibit 6).<br />
Distributed at clubs and on college campuses,<br />
MDMA has remained widely available “in spite of<br />
law enforcement seizures.”<br />
Other Drugs<br />
Amphetamines<br />
The 2002 rate of 15 mentions per 100,000 population<br />
was the highest amphetamines ED mentions rate that<br />
Boston experienced in 8 years of DAWN reporting.<br />
Unweighted DAWN data for the first half of 2004<br />
show 84 amphetamine reports.<br />
The numbers of amphetamine lab samples (methamphetamine<br />
included) increased from 2000 to 2002 (totaling<br />
4, 25, and 42, respectively), but they remained<br />
Proceedings of the Community Epidemiology Work Group, Vol. II, January 2005
stable at 47 in 2003. The number of Helpline calls<br />
with stimulant mentions remained stable from 60 in<br />
FY 2003 to 49 in FY 2004.<br />
Methamphetamine<br />
Though still relatively small in number, methamphetamine<br />
treatment admissions increased from 5 in<br />
FY 2001 to 66 in FY 2003 and 53 in FY 2004.<br />
There were only 13 estimated ED mentions of methamphetamine<br />
in 2002 (exhibit 1). This number is<br />
similar to each of the 2 previous years.<br />
In the unweighted data for the first half of 2004, there<br />
were 14 methamphetamine ED reports.<br />
In FY 2004, there were 14 methamphetamine-related<br />
calls to the Helpline, compared to 2 methamphetamine-related<br />
calls in FY 2000.<br />
The DEA’s most recent data reports that methamphetamine<br />
costs $250 per gram and is available “in<br />
limited (user-level) quantities” in New England (exhibit<br />
6). The purity level is unknown.<br />
Ketamine<br />
There were an estimated 13 ketamine ED mentions in<br />
2002. This number is similar to each of the 2 previous<br />
years (2000–2001). Only two ketamine ED reports<br />
appear in the unweighted DAWN Live! data for<br />
the first half of 2004. In past years, lab samples for<br />
ketamine had shown small but increasing numbers<br />
<strong>EPIDEMIOLOGIC</strong> TRENDS IN <strong>DRUG</strong> <strong>ABUSE</strong>—Greater Boston<br />
(20, 18, and 43 samples for 2000–2002, respectively),<br />
but they dropped off during 2003 (11 samples). The<br />
most recent DEA data show that a vial of ketamine<br />
costs $50 to $70 (exhibit 6).<br />
Barbiturates<br />
There were an estimated 637 barbiturates ED mentions<br />
in 2002. Boston’s ED rate of 18 barbiturates mentions<br />
per 100,000 population was the highest barbiturates<br />
rate among the 8 years of DAWN reporting and 4½<br />
times the national rate of 4.<br />
Lysergic Acid Diethylamide (LSD), Phencyclidine<br />
(PCP), and Gamma Hydroxybutyrate (GHB)<br />
There were few estimated LSD, PCP, or GHB ED<br />
mentions in Boston during 2002 (19, 20, and 27, respectively)<br />
(exhibit 1). The DEA reports that LSD<br />
costs $5 per dose (exhibit 6). Similarly, a capful of<br />
GHB costs $5.<br />
INFECTIOUS DISEASES RELATED TO <strong>DRUG</strong> <strong>ABUSE</strong><br />
In 2003, there were 263 HIV and AIDS cases diagnosed<br />
in Boston. The primary risk factor for these<br />
cases included 12 percent who were injection drug<br />
users (IDUs), 5 percent who had sex with IDUs, and<br />
35 percent with an unknown/undetermined risk factor.<br />
As of January 1, 2005, cumulative AIDS cases<br />
numbered 6,031. By primary risk factor, these include<br />
26 percent who were IDUs, 7 percent who had<br />
sex with IDUs, and 13 percent for whom the risk<br />
behavior was unknown/undetermined.<br />
For inquiries concerning this report, please contact Daniel P. Dooley, Boston Public Health Commission, 1010 Massachusetts Avenue, Boston,<br />
MA 02118, Phone: (617) 534-2360, Fax: (617) 534-2422, E-mail: Ddooley@bphc.org.<br />
Proceedings of the Community Epidemiology Work Group, Vol. II, January 2005 43
44<br />
<strong>EPIDEMIOLOGIC</strong> TRENDS IN <strong>DRUG</strong> <strong>ABUSE</strong>—Greater Boston<br />
Exhibit 1. Estimated Emergency Department Mentions for Selected Drugs as a Percentage of<br />
Total Drug Episodes 1 : 1995–2002<br />
Drug<br />
1995 1996 1997 1998 1999 2000 2001 2002<br />
No. (%) No. (%) No. (%) No. (%) No. (%) No. (%) No. (%) No. (%)<br />
Alcohol-in-comb. 6,297 (39) 5,351 (40) 4,890 (40) 5,130 (38) 4,438 (38) 4,975 (33) 5,818 (35) 5,916 (33)<br />
Cocaine/<br />
Crack<br />
5,267 (33) 4,106 (30) 3,332 (27) 4,526 (33) 3,560 (31) 4,099 (28) 4,933 (29) 5,611 (31)<br />
Marijuana/<br />
Hashish<br />
2,401 (15) 2,127 (16) 1,768 (15) 2,907 (21) 1,960 (17) 2,945 (20) 3,423 (20) 4,273 (24)<br />
Heroin/<br />
Morphine<br />
2,956 (18) 2,729 (20) 2,500 (21) 2,738 (20) 2,861 (25) 3,867 (26) 4,358 (26) 3,999 (22)<br />
Oxycodone/<br />
comb.<br />
276 (2) 241 (2) 231 (2) 247 (2) 294 (3) 598 (4) 948 (6) 1,239 (7)<br />
Hydrocodone/<br />
comb.<br />
85 (
<strong>EPIDEMIOLOGIC</strong> TRENDS IN <strong>DRUG</strong> <strong>ABUSE</strong>—Greater Boston<br />
Exhibit 2. Percentages of Admissions to State-Funded Substance Abuse Treatment Programs by Drug Used<br />
in the Past Month in Greater Boston and the Remainder of Massachusetts 1 : FY 1997–FY 2004 2<br />
Drug Used Past Month<br />
Greater Boston<br />
FY 1997 FY 1998 FY 1999 FY 2000 FY 2001 FY 2002 FY 2003 FY 2004<br />
Alcohol<br />
Heroin and/or Other Opiates<br />
Heroin<br />
Other Opiates/Synthetics<br />
Cocaine and/or Crack<br />
Cocaine (powder)<br />
Crack<br />
Marijuana<br />
Other 3<br />
60 59 59 58 56 53 50 47<br />
29 34 35 37 42 45 48 49<br />
28 33 34 35 39 42 45 46<br />
2<br />
3<br />
3<br />
4<br />
5<br />
6<br />
7<br />
8<br />
34 30 30 28 25 24 24 23<br />
22 21 21 20 18 17 18 16<br />
19 16 15 13 12 11 11 11<br />
16 14 14 13 13 11 11 10<br />
8<br />
9<br />
9 10 10 10 11 12<br />
Total (N)<br />
Remainder of<br />
Massachusetts<br />
(25,470) (23,008) (24,653) (24,478) (25,334) (25,586) (24,440) (20,041)<br />
Alcohol<br />
Heroin and/or Other Opiates<br />
Heroin<br />
Other Opiates/Synthetics<br />
Cocaine and/or Crack<br />
Cocaine (powder)<br />
Crack<br />
Marijuana<br />
Other 3<br />
59 57 56 54 51 50 47 46<br />
26 32 32 35 37 38 39 39<br />
25 30 31 33 34 34 35 34<br />
3<br />
4<br />
5<br />
5<br />
6<br />
8<br />
9 11<br />
22 21 21 20 19 19 20 20<br />
16 16 16 16 15 14 15 15<br />
12 10 10 10<br />
9<br />
8<br />
9<br />
9<br />
17 18 18 17 16 15 15 15<br />
10 10 10 11 11 11 11 14<br />
Total (N) (77,673) (76,891) (87,205) (90,919) (92,638) (95,249) (88,349) (79,170)<br />
1 Excluding prisoners and out-of-State admissions.<br />
2 Fiscal years (FYs) run July 1–June 30, with the year named for the January–June portion of the year.<br />
3 Includes barbiturates, other sedatives, tranquilizers, hallucinogens, amphetamines, “over-the-counter,” and other drugs.<br />
SOURCE: Massachusetts Department of Public Health, Bureau of Substance Abuse Services; prepared by the Boston Public<br />
Health Commission, Research Office<br />
Proceedings of the Community Epidemiology Work Group, Vol. II, January 2005 45
46<br />
<strong>EPIDEMIOLOGIC</strong> TRENDS IN <strong>DRUG</strong> <strong>ABUSE</strong>—Greater Boston<br />
Exhibit 3. Demographic Characteristics of Admissions to Greater Boston State-Funded Substance Abuse<br />
Treatment Programs, 1 by Percent: FY 1997–FY 2004 2<br />
Characteristic FY 1997 FY 1998 FY 1999 FY 2000 FY 2001 FY 2002 FY 2003 FY 2004<br />
Gender<br />
Male<br />
Female<br />
Race<br />
White<br />
Black<br />
Hispanic<br />
Other<br />
Age at Admission<br />
(Average age)<br />
18 and younger<br />
19–29<br />
30–39<br />
40–49<br />
50 and older<br />
Marital Status<br />
Married<br />
Separated/divorced<br />
Never married<br />
Annual Income<br />
None<br />
$1–$1,000<br />
$1,000–$9,999<br />
$10,000 and higher<br />
72<br />
28<br />
47<br />
35<br />
14<br />
3<br />
(35.1)<br />
3<br />
25<br />
43<br />
22<br />
7<br />
10<br />
22<br />
68<br />
56<br />
3<br />
26<br />
15<br />
75<br />
25<br />
49<br />
32<br />
15<br />
4<br />
(35.6)<br />
3<br />
24<br />
42<br />
23<br />
8<br />
10<br />
22<br />
68<br />
56<br />
3<br />
24<br />
16<br />
74<br />
26<br />
48<br />
33<br />
16<br />
4<br />
(36.5)<br />
2<br />
22<br />
41<br />
27<br />
9<br />
10<br />
21<br />
69<br />
54<br />
4<br />
26<br />
16<br />
76<br />
24<br />
49<br />
32<br />
16<br />
4<br />
(36.7)<br />
2<br />
21<br />
40<br />
29<br />
9<br />
10<br />
19<br />
71<br />
59<br />
3<br />
21<br />
17<br />
77<br />
23<br />
48<br />
30<br />
18<br />
4<br />
(36.5)<br />
2<br />
22<br />
38<br />
29<br />
9<br />
10<br />
18<br />
72<br />
61<br />
2<br />
19<br />
18<br />
77<br />
23<br />
49<br />
29<br />
18<br />
4<br />
(36.5)<br />
2<br />
24<br />
37<br />
28<br />
10<br />
10<br />
18<br />
72<br />
69<br />
2<br />
14<br />
16<br />
74<br />
26<br />
50<br />
28<br />
18<br />
4<br />
(36.7)<br />
2<br />
24<br />
34<br />
30<br />
10<br />
10<br />
18<br />
72<br />
68<br />
2<br />
14<br />
16<br />
73<br />
27<br />
54<br />
26<br />
17<br />
3<br />
(36.9)<br />
2<br />
26<br />
31<br />
30<br />
11<br />
Homeless 32 31 31 30 34 37 37 36<br />
Criminal Justice System<br />
Involvement<br />
26 26 28 27 26 27 24 23<br />
Mental Health<br />
No prior treatment<br />
82 80 79 80 81 80 80 78<br />
Prior treatment<br />
(counseling or<br />
hospitalization)<br />
18 20 21 20 19 20 20 22<br />
Needle Use in Past Year 22 25 26 26 27 32 37 38<br />
Total (N) (25,470) (23,008) (24,653) (24,478) (25,334) (25,586) (24,440) (20,041)<br />
1 Excludes prisoners and out-of-State admissions.<br />
2 Fiscal years (FYs) run July 1–June 30, with the year named for the January–June portion of the year.<br />
SOURCE: Massachusetts Department of Public Health, Bureau of Substance Abuse Services; prepared by the Boston Public<br />
Health Commission, Research Office<br />
9<br />
17<br />
74<br />
63<br />
3<br />
18<br />
16<br />
Proceedings of the Community Epidemiology Work Group, Vol. II, January 2005
<strong>EPIDEMIOLOGIC</strong> TRENDS IN <strong>DRUG</strong> <strong>ABUSE</strong>—Greater Boston<br />
Exhibit 4a. Demographic Characteristics of Clients 1 in Greater Boston State-Funded Substance Abuse<br />
Treatment Programs with a Primary Problem with Cocaine/Crack, by Percent: FY 1997–FY 2004 2<br />
Characteristic FY 1997 FY 1998 FY 1999 FY 2000 FY 2001 FY 2002 FY 2003 FY 2004<br />
Gender<br />
Male<br />
Female<br />
Race<br />
White<br />
Black<br />
Latino<br />
Other<br />
Age at Admission<br />
(Average age)<br />
18 and younger<br />
19–29<br />
30–39<br />
40–49<br />
50 and older<br />
Marital Status<br />
Married<br />
Separated/divorced<br />
Never married<br />
Annual Income<br />
$0–$999<br />
$1,000–$9,999<br />
$10,000 and higher<br />
60<br />
40<br />
25<br />
63<br />
10<br />
2<br />
(32.8)<br />
1<br />
31<br />
53<br />
13<br />
2<br />
9<br />
17<br />
75<br />
59<br />
28<br />
13<br />
61<br />
39<br />
24<br />
64<br />
10<br />
3<br />
(33.6)<br />
1<br />
28<br />
53<br />
16<br />
2<br />
10<br />
19<br />
71<br />
57<br />
27<br />
17<br />
59<br />
41<br />
23<br />
63<br />
11<br />
3<br />
(35.2)<br />
1<br />
19<br />
56<br />
21<br />
4<br />
11<br />
19<br />
71<br />
56<br />
29<br />
16<br />
Proceedings of the Community Epidemiology Work Group, Vol. II, January 2005 47<br />
59<br />
41<br />
23<br />
65<br />
10<br />
3<br />
(35.5)<br />
48<br />
<strong>EPIDEMIOLOGIC</strong> TRENDS IN <strong>DRUG</strong> <strong>ABUSE</strong>—Greater Boston<br />
Exhibit 4b. Demographic Characteristics of Clients 1 in Greater Boston State-Funded Substance Abuse<br />
Treatment Programs with a Primary Problem with Heroin or Other Opiates, by Percent:<br />
FY 1997–FY 2004 2<br />
Characteristic FY 1997 FY 1998 FY 1999 FY 2000 FY 2001 FY 2002 FY 2003 FY 2004<br />
Gender<br />
Male<br />
Female<br />
Race<br />
White<br />
Black<br />
Latino<br />
Other<br />
Age at Admission<br />
(Average age)<br />
18 and younger<br />
19–29<br />
30–39<br />
40–49<br />
50 and older<br />
Marital Status<br />
Married<br />
Separated/divorced<br />
Never married<br />
Annual Income<br />
$0–$999<br />
$1,000–$9,999<br />
$10,000 and higher<br />
69<br />
31<br />
49<br />
26<br />
21<br />
4<br />
(34.5)<br />
1<br />
28<br />
45<br />
24<br />
3<br />
11<br />
22<br />
68<br />
67<br />
23<br />
10<br />
72<br />
28<br />
48<br />
24<br />
22<br />
6<br />
(34.6)<br />
1<br />
29<br />
42<br />
24<br />
4<br />
11<br />
21<br />
68<br />
69<br />
21<br />
10<br />
72<br />
28<br />
49<br />
24<br />
22<br />
5<br />
(35.2)<br />
1<br />
27<br />
42<br />
25<br />
6<br />
10<br />
20<br />
70<br />
67<br />
23<br />
10<br />
75<br />
25<br />
51<br />
22<br />
23<br />
5<br />
(35.3)<br />
1<br />
27<br />
40<br />
27<br />
5<br />
11<br />
19<br />
71<br />
72<br />
16<br />
12<br />
76<br />
24<br />
50<br />
21<br />
25<br />
5<br />
(35.1)<br />
1<br />
29<br />
39<br />
26<br />
6<br />
10<br />
17<br />
73<br />
73<br />
15<br />
12<br />
77<br />
23<br />
53<br />
19<br />
25<br />
4<br />
(34.6)<br />
1<br />
32<br />
37<br />
24<br />
6<br />
10<br />
15<br />
75<br />
78<br />
11<br />
11<br />
74<br />
26<br />
56<br />
18<br />
22<br />
5<br />
(35.2)<br />
1<br />
31<br />
35<br />
26<br />
7<br />
9<br />
16<br />
75<br />
78<br />
12<br />
10<br />
Proceedings of the Community Epidemiology Work Group, Vol. II, January 2005<br />
72<br />
28<br />
61<br />
15<br />
21<br />
3<br />
(35.1)<br />
1<br />
33<br />
32<br />
26<br />
8<br />
Homeless 28 25 26 22 29 35 40 39<br />
Criminal Justice System<br />
Involvement<br />
16 18 20 19 19 19 16 16<br />
Mental Health Problem 17 17 18 16 16 16 16 18<br />
Needle Use in Past Year 64 63 63 63 58 62 68 68<br />
Total (N) (7,372) (8,145) (8,932) (9,151) (10,613) (11,850) (12,210) (10,402)<br />
1 Excludes prisoners and out-of-State admissions.<br />
2 Fiscal years (FYs) run July 1–June 30, with the year named for the January–June portion of the year.<br />
SOURCE: Massachusetts Department of Public Health, Bureau of Substance Abuse Services; prepared by the Boston Public<br />
Health Commission, Research Office<br />
7<br />
16<br />
77<br />
74<br />
16<br />
10
<strong>EPIDEMIOLOGIC</strong> TRENDS IN <strong>DRUG</strong> <strong>ABUSE</strong>—Greater Boston<br />
Exhibit 4c. Demographic Characteristics of Clients 1 in Greater Boston State-Funded Substance Abuse<br />
Treatment Programs with a Primary Problem with Marijuana, by Percent: FY 1997–FY 2004 2<br />
Characteristic FY 1997 FY 1998 FY 1999 FY 2000 FY 2001 FY 2002 FY 2003 FY 2004<br />
Gender<br />
Male<br />
Female<br />
Race<br />
White<br />
Black<br />
Latino<br />
Other<br />
Age at Admission<br />
(Average age)<br />
18 and younger<br />
19–29<br />
30–39<br />
40–49<br />
50 and older<br />
Marital Status<br />
Married<br />
Separated/divorced<br />
Never married<br />
Annual Income<br />
$0–$999<br />
$1,000–$9,999<br />
$10,000 and higher<br />
76<br />
24<br />
37<br />
39<br />
20<br />
4<br />
(24.0)<br />
33<br />
43<br />
18<br />
5<br />
1<br />
6<br />
5<br />
89<br />
58<br />
28<br />
15<br />
78<br />
22<br />
32<br />
42<br />
22<br />
4<br />
(24.2)<br />
29<br />
48<br />
18<br />
5<br />
1<br />
6<br />
6<br />
89<br />
50<br />
31<br />
19<br />
76<br />
24<br />
28<br />
44<br />
23<br />
4<br />
(25.1)<br />
24<br />
50<br />
17<br />
6<br />
2<br />
4<br />
6<br />
90<br />
59<br />
27<br />
14<br />
Proceedings of the Community Epidemiology Work Group, Vol. II, January 2005 49<br />
73<br />
27<br />
28<br />
47<br />
21<br />
4<br />
(25.4)<br />
19<br />
56<br />
18<br />
5<br />
2<br />
5<br />
7<br />
88<br />
55<br />
27<br />
18<br />
78<br />
22<br />
29<br />
47<br />
22<br />
3<br />
(24.3)<br />
27<br />
51<br />
16<br />
6<br />
1<br />
5<br />
6<br />
90<br />
57<br />
22<br />
21<br />
77<br />
23<br />
27<br />
48<br />
20<br />
5<br />
(24.8)<br />
24<br />
50<br />
19<br />
6<br />
1<br />
6<br />
7<br />
88<br />
60<br />
21<br />
19<br />
77<br />
23<br />
26<br />
49<br />
22<br />
4<br />
(25.2)<br />
22<br />
52<br />
18<br />
7<br />
2<br />
6<br />
6<br />
89<br />
64<br />
21<br />
16<br />
71<br />
29<br />
29<br />
47<br />
20<br />
3<br />
(26.3)<br />
17<br />
52<br />
21<br />
7<br />
2<br />
Homeless 8 8 9 10 11 12 9 11<br />
Criminal Justice System<br />
Involvement<br />
38 47 53 48 48 50 43 44<br />
Mental Health Problem 25 31 23 27 25 29 31 35<br />
Needle Use in Past Year 1 2 2 2 2 2 2 2<br />
Total (N) (1,119) (928) (1,125) (1,109) (1,100) (1,054) (1,046) (857)<br />
1 Excludes prisoners and out-of-State admissions.<br />
2 Fiscal years (FYs) run July 1–June 30, with the year named for the January–June portion of the year.<br />
SOURCE: Massachusetts Department of Public Health, Bureau of Substance Abuse Services; prepared by the Boston Public<br />
Health Commission, Research Office<br />
6<br />
6<br />
88<br />
53<br />
28<br />
19
50<br />
<strong>EPIDEMIOLOGIC</strong> TRENDS IN <strong>DRUG</strong> <strong>ABUSE</strong>—Greater Boston<br />
Exhibit 5. Boston Police Department Arrests by Substance, 1 by Number and Percent: 1997–2003<br />
Drug Class Number<br />
(%)<br />
A (Mostly Heroin)<br />
1,392<br />
(22.7)<br />
B (Mostly Cocaine)<br />
2,918<br />
(47.5)<br />
D (Mostly Marijuana)<br />
1,617<br />
(26.3)<br />
Other<br />
216<br />
(3.5)<br />
1997 1998 1999 2000 2001 2002 2003<br />
Number<br />
(%)<br />
1,061<br />
(22.5)<br />
2,225<br />
(47.1)<br />
1,211<br />
(25.6)<br />
226<br />
(4.8)<br />
Number<br />
(%)<br />
984<br />
(24.0)<br />
1,847<br />
(45.1)<br />
1,133<br />
(27.7)<br />
133<br />
(3.3)<br />
Number<br />
(%)<br />
1,022<br />
(27.1)<br />
1,532<br />
(40.6)<br />
1,093<br />
(29.0)<br />
123<br />
(3.3)<br />
Number<br />
(%)<br />
905<br />
(26.4)<br />
1,428<br />
(41.7)<br />
982<br />
(28.7)<br />
111<br />
(3.2)<br />
Number<br />
(%)<br />
947<br />
(22.5)<br />
1,762<br />
(41.9)<br />
1,375<br />
(32.7)<br />
125<br />
(3.0)<br />
Number<br />
(%)<br />
939<br />
(22.5)<br />
1,736<br />
(41.6)<br />
1,366<br />
(32.7)<br />
133<br />
(3.2)<br />
Total Drug Arrests 6,143 4,723 4,097 3,770 3,426 4,209 4,174<br />
Total Arrests 27,843 25,481 23,592 22,216 20,470 21,025 20,686<br />
Drug Percentage of<br />
Total Arrests<br />
(23.7) (18.5) (17.4) (17.0) (16.7) (20.0) (20.2)<br />
1 Includes all arrests made by the Boston Police Department (i.e., arrests for possession, distribution, manufacturing, trafficking,<br />
possession of hypodermic needles, conspiracy to violate false substance acts, and forging prescriptions).<br />
SOURCE: Boston Police Department, Office of Planning and Research; prepared by the Boston Public Health Commission, Research<br />
Office<br />
Exhibit 6. Drug Street Price, Purity, and Availability in Boston: November 2003–December 2004<br />
Drug Price<br />
$75–$100 per gram<br />
Purity Availability<br />
Heroin<br />
$60–$100 per bundle<br />
$6–$20 per bag<br />
High Readily<br />
Cocaine (powder) $50–$90 per gram retail Decreasing Steady, available<br />
Crack $10–$20 per rock<br />
Marijuana<br />
$5 per joint<br />
$200–$250 per ounce<br />
Commercial Grade Readily<br />
Methamphetamine $250 per gram Unknown Limited quantities<br />
MDMA (Ecstasy) $20–$25 per tablet High (clubs & colleges)<br />
OxyContin $1 per milligram<br />
LSD $5 per dose<br />
Ketamine $50–$70 per vial<br />
GHB $5 per capful<br />
SOURCES: Price data: Narcotics Digest Weekly, Volume 3, Number 52. National Drug Intelligence Center, Department of Justice,<br />
December 28, 2004; Purity data: New England Field Division, Drug Enforcement Administration (DEA) as of December 2003. Prepared<br />
by the Boston Public Health Commission, Research Office<br />
Proceedings of the Community Epidemiology Work Group, Vol. II, January 2005
<strong>EPIDEMIOLOGIC</strong> TRENDS IN <strong>DRUG</strong> <strong>ABUSE</strong>—Chicago<br />
Patterns and Trends of Drug Abuse in Chicago<br />
Dita Broz, M.P.H., Matthew Magee, Wayne Wiebel, Ph.D., and Lawrence Ouellet, Ph.D. 1<br />
ABSTRACT<br />
Most indicators suggest that heroin and cocaine<br />
continue to pose a serious problem for Chicago and<br />
Illinois. The rate for heroin ED mentions and the<br />
number of heroin-related deaths in 2002 were the<br />
highest among the 21 DAWN metropolitan areas.<br />
Treatment episodes increased between 2000 and<br />
2003, indicating continued high levels of heroin<br />
use. The purity of street-level heroin decreased between<br />
2001 and 2003 from about 24 percent to 16<br />
percent, though ethnographic reports suggest a recent<br />
increase. Many cocaine indicators remain the<br />
highest for all substances except alcohol. Cocainerelated<br />
treatment episodes increased between FYs<br />
2002 and 2003 by 20 percent, and increases in use<br />
among students enrolled in the Chicago public<br />
schools, especially among eighth graders, were observed<br />
in 2002 and 2003. Methamphetamine indicators<br />
continued to show low but increasing levels of<br />
use in some areas of Chicago, especially on the<br />
north side, where young gay men and clubgoers<br />
congregate. Methamphetamine use is significantly<br />
higher in downstate Illinois. MDMA (ecstasy) ED<br />
mentions decreased 60 percent between 2000 and<br />
2002, but increases in use have recently been reported<br />
among young African-Americans. LSD and<br />
PCP indicators suggest a downward trend in use.<br />
The proportion of new AIDS cases attributed to injection<br />
drug use peaked at 33 percent in 1996 and<br />
then steadily decreased to 24 percent as of 2002.<br />
Prospective studies of young heroin users in Chicago<br />
conducted by the authors of this report suggest<br />
a low HIV and HCV seroprevalence, but many engage<br />
in receptive sharing of injecting and snorting<br />
equipment, placing them at high risk for acquiring<br />
these infections.<br />
INTRODUCTI<strong>ON</strong><br />
Area Description<br />
The 2000 U.S. census estimated the population of<br />
Chicago at 2.9 million, Cook County (which includes<br />
Chicago) at 5.4 million, and the metropolitan statistical<br />
area (MSA) at slightly more than 8 million<br />
(ranking third in the Nation). The city population<br />
1 The authors are affiliated with the University of Illinois at Chicago, School of Public Health, Chicago, Illinois.<br />
declined 4 percent between 1970 and 1980 and another<br />
7 percent in the 1980s. Based on 2000 census<br />
data, the city population increased about 4 percent<br />
between 1990 and 2000. The number of Hispanics<br />
living in Chicago increased 38 percent during this<br />
period, while the number of Whites and African-<br />
Americans declined by 14 and 2 percent, respectively.<br />
According to the 2000 census, the Chicago population<br />
is 36 percent African-American, 31 percent<br />
White, 26 percent Hispanic, and 4 percent Asian-<br />
American/Pacific Islander. In 2000, the median age<br />
of Chicagoans was 31.5, with 26 percent of the population<br />
younger than 18 and 10 percent age 65 or<br />
older. The unemployment rate is 6.2 percent, and the<br />
percentage of families below the poverty level with<br />
children younger than 18 years is 11.4 percent.<br />
Data Sources<br />
During this reporting period, the majority of local and<br />
national datasets traditionally used in this report had<br />
not been updated. In addition, the Drug Abuse Warning<br />
Network (DAWN) recently restructured its data<br />
collection methods, and, as a result, estimates produced<br />
as of 2003 are not comparable to previous<br />
years. Given these limitations, this paper attempts to<br />
provide a meaningful summary of previously reported<br />
trends and introduces more recent data primarily<br />
collected from analytical and ethnographic studies<br />
conducted by the authors. Below is a detailed review<br />
of the various data sources:<br />
• Drug-related mortality data were derived from<br />
the DAWN, Office of Applied Studies (OAS),<br />
Substance Abuse and Mental Health Services<br />
Administration (SAMHSA), mortality system for<br />
1998–2002. The DAWN system covered 56 percent<br />
of the MSA jurisdictions and 92 percent of<br />
the MSA population in 2000. Data on pediatric<br />
toxicity were available from the Illinois Department<br />
of Public Health (IDPH) Adverse Pregnancy<br />
Outcome Reporting System (APORS) reports<br />
through 2002. Data on deaths related to accidental<br />
drug poisonings were provided by the Chicago<br />
Department of Public Health (1980–2002).<br />
Proceedings of the Community Epidemiology Work Group, Vol. II, January 2005 51
• Emergency department (ED) drug mentions<br />
data were provided by DAWN, OAS, SAMHSA,<br />
for 1994 through 2002. The 2000 ED data were<br />
unavailable for methamphetamine. Also presented<br />
in this paper are preliminary unweighted<br />
data from the DAWN Live! restricted-access<br />
online query system administered by OAS, beginning<br />
in 2003. The 2003–2004 data represent a<br />
redesign of DAWN, and the data are not comparable<br />
to those from 2002 and before. The redesigned<br />
system has 74 of the 88 eligible hospitals<br />
in the Chicago sample, with 76 EDs in the sample.<br />
(Some hospitals have more than one ED.)<br />
Datasets for the 2 years have similar completeness<br />
ratings, though the 2004 sample size is<br />
more than three times larger than the 2003 sample.<br />
This may be related to several reasons, including<br />
limitations associated with implementing<br />
a new system in 2003. The 2003–2004 data are<br />
incomplete (not all EDs reported each month)<br />
and unweighted; they cannot be used as estimates,<br />
nor can they be used for comparison with<br />
future data. Only weighted data released by<br />
SAMHSA can be used for trend analysis. All<br />
DAWN cases are reviewed for quality control;<br />
based on the review, cases may be corrected or<br />
deleted. Therefore, the data presented in this paper<br />
are subject to change. The 2003–2004 data<br />
were accessed from the DAWN Live! update on<br />
January 17, 2005, and represent drug reports.<br />
Drug reports exceed the number of visits, since a<br />
patient may report use of multiple drugs (up to<br />
six drugs plus alcohol). A full description of the<br />
DAWN system can be found on the DAWN Web<br />
site .<br />
• Treatment data for the State of Illinois for fiscal<br />
years (FYs) 1999–2003 (July 1–June 30)<br />
were provided by the Illinois Division of Alcoholism<br />
and Substance Abuse (DASA). National<br />
and State-specific treatment admissions data for<br />
1992–2002 were provided by the Treatment Episode<br />
Data Set (TEDS) maintained by SAMHSA.<br />
• Arrestee drug testing data were provided by the<br />
Arrestee Drug Abuse Monitoring (ADAM) program,<br />
National Institute of Justice (NIJ), and are<br />
described in the June 2004 Chicago CEWG report.<br />
• Incidence data on drug-related calls were provided<br />
by the Illinois Poison Center (IPC) in Chicago<br />
for Cook County for 2001 through 2003.<br />
The IPC answered more than 93,000 calls in<br />
2003 on household products, herbal products,<br />
medication overdoses, adverse reactions to<br />
medications, alcohol or drug misuse, occupa-<br />
52<br />
<strong>EPIDEMIOLOGIC</strong> TRENDS IN <strong>DRUG</strong> <strong>ABUSE</strong>—Chicago<br />
tional accidents, chemical spills, and other poisonings.<br />
• Price and purity data were provided by the Drug<br />
Enforcement Administration (DEA), Domestic<br />
Monitor Program (DMP), for heroin for 1991–<br />
2003; the data are preliminary and subject to updating.<br />
Price and purity data on drug samples analyzed<br />
through November 2004 were provided by<br />
the Illinois State Police (ISP), Division of Forensic<br />
Science. The Illinois State Police and DEA<br />
analysis of methamphetamine lab seizures in Illinois<br />
between 2001 and 2003 reported to the Illinois<br />
Attorney General were reviewed. The Illinois<br />
Criminal Justice Information Authority (ICJIA)<br />
provided data on methamphetamine-related arrests.<br />
National and Illinois data on drug availability,<br />
demand, production, cultivation, and distribution<br />
were available from the National Drug Threat<br />
Assessment June 2004 and the Illinois Drug<br />
Threat Assessment May 2002 reports, National<br />
Drug Intelligence Center, U.S. Department of Justice.<br />
The Office of National Drug Control Policy<br />
(<strong>ON</strong>DCP) report on Profile of Drug Indicators,<br />
Chicago, Illinois, published in April 2004, as well<br />
as the National Drug Intelligence Center 2003 Illicit<br />
Drug Prices: July 2003–December 2003 report,<br />
were reviewed. Data from the National Forensic<br />
Laboratory Information System (NFLIS)<br />
for FY 2003 and FY 2004 were used to report differences<br />
between different drugs in the relative<br />
amounts submitted for testing in Illinois and Chicago.<br />
Ethnographic data on drug availability,<br />
prices, and purity are from observations and interviews<br />
conducted by the Community Outreach Intervention<br />
Projects (COIP), School of Public<br />
Health, University of Illinois at Chicago (UIC).<br />
• Survey data on student and household populations<br />
were derived from several sources. Student<br />
drug use data were provided by the national<br />
Monitoring the Future (MTF) Study, the Youth<br />
Risk Behavior Surveillance System (YRBSS)<br />
survey, and the Illinois Youth Survey and are<br />
described in the June 2004 Chicago CEWG report.<br />
National data on substance use and abuse<br />
were provided by SAMHSA’s 2002 National<br />
Survey on Drug Use and Health.<br />
• Most recent drug use estimates were derived<br />
from two currently ongoing studies of young<br />
heroin users in metropolitan Chicago conducted<br />
by COIP at UIC School of Public Health. The<br />
Family Process and Risk Reduction Study (Family<br />
Process), funded by the National Institute on<br />
Drug Abuse (NIDA), assesses a human immunodeficiency<br />
virus (HIV) prevention intervention<br />
Proceedings of the Community Epidemiology Work Group, Vol. II, January 2005
that targets young injection drug users (IDUs)<br />
and their parents. Participants are aged 18–25<br />
and have injected in the last 6 months (n=547 as<br />
of December 2004). All data from the Family<br />
Process Study are preliminary. Current noninjecting<br />
heroin users (NIHUs) age 16–30 were<br />
recruited for the NIDA-funded NIHU Study to<br />
evaluate the rate of transition to injecting and<br />
drug and sexual practices associated with HIV,<br />
hepatitis B (HBV), and hepatitis C (HCV) infections<br />
(n=618 as of June 2004).<br />
• Acquired immunodeficiency syndrome (AIDS)<br />
and HIV data were derived from both agency<br />
sources and UIC studies. IDPH and CDPH surveys<br />
provided statistics on AIDS and HIV<br />
through October 2004 and December 2003, respectively.<br />
The CDPH Office of HIV/AIDS Surveillance<br />
provided data through 2003 (2003 data<br />
are preliminary). CDC’s “HIV/AIDS Surveillance<br />
Report,” December 2001, provided additional<br />
data on HIV and AIDS. The agency data<br />
are complemented by UIC’s studies of IDUs<br />
conducted by COIP at UIC’s School of Public<br />
Health. One is the NIDA-funded “AIDS Intervention<br />
Study,” based on a panel of IDUs participating<br />
from 1988 to 1996. The second is the<br />
CDC-funded HIV Incidence Study (CIDUS I and<br />
II). The CIDUS data are from analyses of a<br />
1994–1996 study of 794 IDUs, age 18–50, in<br />
Chicago (Ouellet et al. 2000) and a 1997–1999<br />
study of 700 IDUs, age 18–30, in Chicago and<br />
its suburbs (Thorpe et al. 2000; Bailey et al.<br />
2001). Most sources have not been updated since<br />
the Chicago CEWG December 2002 report.<br />
As noted above, many of the sources traditionally<br />
used for this report have not been updated by their<br />
authors or were unavailable at the time this report<br />
was generated. Because some information has not<br />
changed—and to avoid redundancy—this report occasionally<br />
refers readers to a previous Chicago<br />
CEWG report for more information in a particular<br />
area. For a discussion of the limitations of survey<br />
data, the reader is referred to the December 2000<br />
Chicago CEWG report.<br />
<strong>DRUG</strong> <strong>ABUSE</strong> PATTERNS AND TRENDS<br />
This report of drug abuse patterns and trends is organized<br />
by major pharmacologic categories. Readers<br />
are reminded, however, that multidrug consumption<br />
is the normative pattern among a broad range of substance<br />
abusers in Chicago. Various indicators suggest<br />
that drug combinations play a substantial role in drug<br />
use prevalence. The latest DAWN data show that 18<br />
percent of all reported ED drug mentions in Chicago<br />
<strong>EPIDEMIOLOGIC</strong> TRENDS IN <strong>DRUG</strong> <strong>ABUSE</strong>—Chicago<br />
between July and December 2002 were alcohol-incombination<br />
mentions, similar to previous reporting<br />
periods for Chicago and comparable to proportions in<br />
nationwide reports.<br />
According to DAWN ED data, Chicago was reporting<br />
the highest ED drug mentions among the 21<br />
DAWN sites between 2000 and 2002. Both DAWN<br />
mortality cases and CDPH death certificates suggest<br />
that total drug-related deaths have remained stable at<br />
high numbers between 2000 and 2002. According to<br />
APORS, 718 children in Chicago were exposed to<br />
some drug at birth in 2002, which corresponds to an<br />
annual rate of 150 exposures per 10,000 live births.<br />
Cocaine/Crack<br />
The majority of quantitative and qualitative cocaine<br />
indicators suggest that use remains stable at high levels<br />
and that cocaine continues to be a serious drug<br />
problem for Chicago and Illinois.<br />
In 2002, both the DAWN ME drug-induced or drugrelated<br />
death data and CDPH death certificate data<br />
showed that cocaine remains a factor in more deaths<br />
in the Chicago area than any other illicit drug. However,<br />
multiple-drug use was involved in 65 percent of<br />
these cases.<br />
In 2002, ED mentions for cocaine remained at high<br />
levels, and they represented a 52-percent increase<br />
over 10,702 mentions in 1995. Chicago continued to<br />
have the most cocaine ED mentions among DAWN<br />
sites in 2002 (16,227 mentions) and the highest rate<br />
of mentions (275 per 100,000 population) (exhibit 1).<br />
Preliminary data accessed from DAWN Live! for<br />
2003 and 2004 show that slightly more than one-third<br />
of total ED reports were cocaine related (34 and 36<br />
percent, respectively). In 2004, the majority of the<br />
cocaine reports involved males (66 percent), African-<br />
Americans (57 percent), and those between 30 and 54<br />
years of age.<br />
According to the Illinois Poison Center, approximately<br />
120 cocaine-related calls have been received<br />
annually in Chicago for the past 3 years (2001–2003).<br />
During this period, cocaine generated more calls than<br />
any other “street drug” (approximately 25 percent of<br />
all “street drugs”).<br />
The FY 2003 Illinois drug treatment report indicates<br />
that cocaine abuse remained one of the most frequent<br />
reasons for entering treatment (excluding primary<br />
alcohol-only abuse) (exhibit 2). A total of 33,882<br />
persons were treated for cocaine-related problems in<br />
Illinois during FY 2003, of which nearly one-half<br />
occurred in Chicago. Cocaine was the most com-<br />
Proceedings of the Community Epidemiology Work Group, Vol. II, January 2005 53
monly mentioned secondary drug among persons<br />
treated for primary heroin-related problems. In FY<br />
2003, African-Americans remained the largest proportion<br />
of total persons treated (62 percent) for cocaine<br />
abuse. Males accounted for more services rendered<br />
(58 percent) than females. Smoking continued<br />
to be the most common route of cocaine administration<br />
(85 percent) in FY 2003.<br />
According to the 2003 ADAM report, 51 percent of<br />
adult male arrestees (exhibit 3) and 33 percent of<br />
adult female arrestees tested cocaine positive.<br />
Cocaine use appears common among heroin users in<br />
Chicago. In an ongoing study of non-injecting heroin<br />
users (NIHU Study), 70 percent of participants reported<br />
ever using powder cocaine, and 35 percent<br />
used it in the past 6 months. Crack cocaine use was<br />
reported by 68 percent of the study participants, and<br />
53 percent reported using crack in the past 6 months.<br />
Among injecting drug users (Family Process study),<br />
86 percent reported ever using powder cocaine, and<br />
51 percent used it in the past 12 months. Somewhat<br />
fewer participants had ever used crack cocaine (76<br />
percent), but 58 percent reported using it in the past<br />
12 months.<br />
According to IDPH’s Adverse Pregnancy Outcome<br />
Reporting System, cocaine exposure among children<br />
at birth in Chicago has been decreasing since 1999.<br />
In 2002, 354 children were exposed to cocaine at<br />
birth, which corresponds to a rate of 73.8 per 10,000<br />
live births in Chicago, a 29-percent decrease from<br />
1999. Although steadily decreasing, cocaine continues<br />
to be the most often cited drug exposure among<br />
children in Chicago. The highest proportion of such<br />
births occurred among African-American mothers<br />
(approximately 78 percent) and to mothers between<br />
25 and 34 years of age.<br />
State (ISP) and Federal (NFLIS) labs reported that<br />
cocaine was the drug most often received for testing<br />
after cannabis. Cocaine purity for samples weighing 2–<br />
25 grams tested by the ISP was 81 percent in 2003 and<br />
77 percent in 2004, but analyses were conducted on<br />
only a few samples, and reasonable comparison with<br />
earlier data is not possible.<br />
Cocaine prices have not changed since the June 2003<br />
report. Ounce prices for powder cocaine were reported<br />
by street sources to be between $400 and $800, depending<br />
on the drug’s quality and the buyer’s relationship<br />
to the seller. Gram prices for powder and rock<br />
cocaine ranged from $50 to $150, with most reports<br />
around $75. Ounces of crack cocaine (“rock”) sold for<br />
about the same price as ounces of powder cocaine,<br />
with reports ranging from $900 to $1,600. The NDIC<br />
54<br />
<strong>EPIDEMIOLOGIC</strong> TRENDS IN <strong>DRUG</strong> <strong>ABUSE</strong>—Chicago<br />
reported the wholesale price of a kilogram of cocaine<br />
in Chicago was $18,000–$20,000 for powdered cocaine<br />
and $22,000–$24,000 for crack. The June 2003<br />
report contains more detailed information about drug<br />
prices in Chicago.<br />
According to the 2003 YRBSS study, the proportion of<br />
lifetime cocaine/crack use among Chicago-area 9th<br />
through 12th grade students remained level at about 5<br />
percent between 1995 and 2003. Male students reported<br />
cocaine/crack use nearly twice as often as their<br />
female counterparts during this period. The 2002 Illinois<br />
Youth Survey of Chicago-area 8th through 12th<br />
grade students reported a similar level of use (about 5<br />
percent) between 1998 and 2002. The June 2004 Chicago<br />
CEWG report provides a more complete discussion<br />
of the 2002 Illinois Youth Survey.<br />
Heroin<br />
Heroin abuse indicators in this reporting period reveal<br />
that heroin continues to be a significant problem<br />
in Chicago.<br />
Of the 711 total drug-induced or drug-related deaths<br />
reported by the DAWN ME for Cook County in<br />
2002, 48 percent (339) had a mention of heroin/ morphine.<br />
After reporting 1 death per year in 2000 and<br />
2001 caused by accidental heroin exposure, CDPH<br />
reported 18 deaths in 2002.<br />
The rate of heroin ED mentions in Chicago increased<br />
significantly from 83 per 100,000 population in 1995<br />
to 220 in 2002 (exhibit 1), an increase of 167 percent.<br />
This rate was the highest in the contiguous United<br />
States. Preliminary unweighted DAWN Live! ED<br />
data for 2003 and 2004 indicate that heroin is the<br />
second most frequently reported drug, following only<br />
cocaine. In the DAWN Live! 2004 data, the majority<br />
of heroin ED reports involved males (63 percent),<br />
African-Americans (52 percent), and those between<br />
35 and 54 years old (58 percent).<br />
The number of persons treated for heroin use in<br />
State-supported programs in FY 2003 was 34,615, an<br />
increase of 58 percent from FY 2002 (exhibit 2).<br />
Seventy percent of the total heroin treatment episodes<br />
reported in FY 2003 occurred in Chicago alone, supporting<br />
other indicators of high heroin use in the city.<br />
The proportion of persons treated for heroin use who<br />
reported intranasal “snorting” as their primary route<br />
of administration remained high at 73 percent in FY<br />
2003. Pronounced differences exist between African-<br />
Americans, Hispanics, and Whites treated for heroin<br />
use in 2003 in the primary route of heroin administration.<br />
In FY 2003, injection was the primary means for<br />
administering heroin for 10 percent of African-<br />
Proceedings of the Community Epidemiology Work Group, Vol. II, January 2005
Americans, 29 percent of Hispanics, and 50 percent<br />
of Whites. Sniffing was the primary means for 83<br />
percent of African-Americans, 62 percent of Hispanics,<br />
and 43 percent of Whites.<br />
A recent report (Kane-Willis and Schmitz-Bechteler<br />
2004) examined age and race trends among persons<br />
treated for heroin use in Illinois and found that<br />
Whites were far more likely to be age 18–24 (41 percent)<br />
than were African-Americans (2 percent) and<br />
Hispanics (20 percent).<br />
According to the 2003 ADAM report, 25 percent of<br />
adult male arrestees tested opiate positive (exhibit 3).<br />
The proportion of adult female arrestees testing opiate<br />
positive decreased significantly between 2000 and<br />
2003, from 40 to 22 percent, respectively. The June<br />
2004 Chicago CEWG report provides a more complete<br />
discussion of the ADAM data.<br />
According to the 2003 DMP report, availability of<br />
heroin in Chicago, especially South Asian heroin, continued<br />
(exhibit 4). Heroin from other geographic<br />
source areas, including South America and Mexico,<br />
was also available. The purity of street-level heroin<br />
peaked in 1997 at about 31 percent and has since declined.<br />
In 2003, South American heroin exhibits purchased<br />
by DMP in Chicago averaged 15.8 percent<br />
pure, a 23-percent decrease from 2002. However, the<br />
average price per milligram pure remained low for<br />
South American heroin in 2003 at $0.46. Recent ethnographic<br />
reports suggest a new source of heroin on<br />
the south side of Chicago that is thought to offer a<br />
higher purity level. On the street, this heroin has been<br />
referred to as “tornado” for its strength or “retrodope,”<br />
as it reminds older users of “better” heroin from<br />
years ago.<br />
According to ISP, the amount of heroin analyzed in<br />
Cook County decreased slightly from 21 kilograms in<br />
2003 to 18 kilograms in 2004.<br />
Participants in a study of young non-injecting heroin<br />
users reported high availability of heroin on the<br />
streets of Chicago. Sixty-three percent reported “a<br />
lot” (the highest rating) of heroin on the street in the<br />
past 30 days. Use of brand name heroin was reported<br />
by 29 percent of participants. Most (82 percent) paid<br />
$10 per bag in the 30 days prior to interview. Regarding<br />
heroin quality in the past 30 days, only 11 percent<br />
gave the highest quality rating (“very good”); 31 percent<br />
thought the quality was “good” and 49 percent<br />
perceived the heroin quality as “fair.”<br />
Heroin prices have not changed since the June 2003<br />
report. On the street, heroin is commonly sold in $10<br />
and $20 units (bags), though bags for as little as $5<br />
<strong>EPIDEMIOLOGIC</strong> TRENDS IN <strong>DRUG</strong> <strong>ABUSE</strong>—Chicago<br />
were available. Prices for larger quantities varied<br />
greatly, depending on the type and quality of heroin,<br />
the buyer, and the area of the city where the heroin<br />
was sold. At outdoor drug markets, purchases of multibag<br />
quantities—versus grams and fractions of<br />
ounces—were the most common means of buying<br />
larger amounts of heroin. Data indicated that buyers<br />
on the West Side could obtain 11–13 $10 bags for<br />
$100 (sometimes called a “jab”). Sunday sales of two<br />
bags for the price of one were also reported. More<br />
detailed price information is available in the June<br />
2003 Chicago CEWG report.<br />
Among Illinois high school students, increases in<br />
heroin use have not yet been evidenced in periodic<br />
representative surveys. The Illinois Youth Survey<br />
indicates that heroin use among Chicago-area students<br />
is still relatively rare. In 2003, 3.7 percent of<br />
students reported lifetime use of heroin, compared<br />
with 2.5 percent in 2001 and 3.1 percent in 1999. The<br />
gender gap among students who have tried heroin<br />
appears to be closing. In both 1999 and 2001, male<br />
students were on average five times as likely to have<br />
used heroin in their lifetime as females. In 2003, the<br />
gap between males and females was nearly threefold.<br />
APORS data indicated that opioid toxicity was decreasing<br />
between 2000 and 2002 among infants<br />
tested for controlled substances, from 22.4 per 10,000<br />
live births to 16.1 per 10,000 live births, respectively.<br />
In 2002, and similarly in 2000 and 2001, most infants<br />
who tested positive to heroin exposure at birth were<br />
born to African-American mothers (69 percent) and<br />
to mothers age 25–34.<br />
Other Opiates<br />
Hydromorphone (Dilaudid), the pharmaceutical opiate<br />
once preferred by many Chicago IDUs, continued<br />
to be available, although in limited quantities (typical<br />
sources are said to be cancer patients). There were<br />
only 10 hydromorphone ED mentions in Chicago in<br />
2002. The drug sells for approximately $25 per tablet.<br />
Street sales of methadone are more common, with the<br />
drug typically costing $0.75–$1.00 per milligram.<br />
Codeine ED mentions steadily increased after 1995<br />
and peaked in 2000 (83), but they decreased in 2002<br />
to 51 mentions; these changes were not statistically<br />
significant. After a 51-percent decrease in codeinerelated<br />
deaths reported from sentinel DAWN ME<br />
sites in the 6-county Chicago area between 2000 and<br />
2001, codeine-related deaths remained level in 2003,<br />
with 41 cases reported. Codeine syrup is reported to<br />
sell for about $30 for 4 ounces. Codeine is often used<br />
by heroin users to moderate withdrawal symptoms or<br />
to help kick a drug habit.<br />
Proceedings of the Community Epidemiology Work Group, Vol. II, January 2005 55
Between 2001 and 2003, the Illinois Poison Center<br />
reported a 55-percent increase in calls involving recreational<br />
abuse of Coricidin HBP ® , which contains 30<br />
milligrams of dextromethorphan HBr (DXM) per tablet.<br />
DXM is a synthetically produced substance that is<br />
chemically related to codeine, though it is not an opiate.<br />
The majority of the cases involving DXM (approximately<br />
90 percent) were among those age 13–19.<br />
Acetaminophen-codeine ED mentions decreased significantly<br />
from 159 in 1995 to 76 in 2002, a 52-percent<br />
decrease. On the street, acetaminophen-codeine<br />
pills sell for $1.00−$3.50 each, although the price is<br />
lower if pills are bought in quantities of 10 or more.<br />
Hydrocodone/combination ED mentions increased<br />
between 1995 (152) and 2002 (330), a change of 117<br />
percent. Methadone ED mentions also increased significantly<br />
between 1995 (90) and 2002 (335). According<br />
to the CDPH, methadone was mentioned on<br />
25 death certificates as the cause of death in 2002.<br />
Oxycodone and oxycodone/combinations ED mentions<br />
increased significantly between 2000 and 2002,<br />
but they remained relatively low, with 72 and 80<br />
mentions, respectively. Oxycodone ED mentions also<br />
increased significantly between 2001 and 2002, from<br />
37 to 72 mentions, a change of 95 percent. Reports of<br />
OxyContin use remain uncommon.<br />
The occasional use of other opiates is common<br />
among young non-injecting heroin users in Chicago.<br />
Fifty-eight percent of NIHU Study participants reported<br />
ever trying codeine, Tylenol 3 and 4, Dilaudid,<br />
Demerol, morphine, or methadone without a legal<br />
prescription.<br />
Because of a change in the reporting of other opioids<br />
in FY 2003, treatment data cannot be compared to the<br />
previous years. Treatment services rendered related<br />
to the use of other opioids, tranquilizers, or sedatives<br />
accounted for 2 percent of total treatment episodes<br />
(excluding alcohol). Readers are referred to the June<br />
2004 Chicago CEWG report for more details regarding<br />
other opioids, tranquilizers, or sedatives treatment<br />
data.<br />
Marijuana<br />
Marijuana continues to be the most widely available<br />
and used illicit drug in Chicago and Illinois.<br />
In DAWN mortality data, marijuana was mentioned<br />
in one drug-related death reported in 2002.<br />
The number of marijuana ED mentions decreased<br />
between 2001 (5,186) and 2002 by 12 percent. The<br />
56<br />
<strong>EPIDEMIOLOGIC</strong> TRENDS IN <strong>DRUG</strong> <strong>ABUSE</strong>—Chicago<br />
rate of marijuana ED mentions per 100,000 population<br />
was 89 for both 2000 and 2001 and decreased to<br />
78 per 100,000 in 2002 (exhibit 1), a change of<br />
nearly 12 percent from 2001.<br />
Preliminary unweighted data accessed from DAWN<br />
Live! show that ED reports of marijuana in 2003 and<br />
2004 represented 10 percent and 13 percent of all<br />
drug-related reports, respectively. In 2004, marijuana<br />
involved patients most often were African-Americans<br />
(49 percent), followed by Whites (25 percent); males<br />
(67 percent); and younger than 30 (56 percent).<br />
Marijuana users represented 19 percent of all treatment<br />
episodes in Illinois in FY 2003 and 27 percent<br />
of episodes when those for primary alcohol abuse<br />
were excluded. The number of treatment episodes for<br />
marijuana increased from 20,773 in FY 2000, to<br />
32,077 in FY 2003 (exhibit 2). Marijuana was the<br />
most commonly reported secondary drug among persons<br />
receiving treatment for alcohol. During FY<br />
2003, treatment episodes for marijuana were highest<br />
for males (77 percent) and for Whites (47 percent).<br />
According to 2003 ADAM data, 53 percent of adult<br />
male arrestees tested positive for marijuana (exhibit<br />
3), a level close to proportions in 2002 and 2001. The<br />
proportion of adult female arrestees who tested positive<br />
for marijuana increased from 25 percent in 2000<br />
to 39 percent in 2003.<br />
According to APORS, cannabis toxicity in children at<br />
birth increased sharply from 28 cases in 1999 to 112<br />
in 2001, but decreased in 2002 to 78, which corresponds<br />
to a rate of 16 per 10,000 live births. The majority<br />
of these infants were born to African-American<br />
mothers (74 percent) and to mothers between the<br />
ages of 20 and 24.<br />
Marijuana use was common among the young heroin<br />
users participating in NIHU studies. Sixty-seven percent<br />
of non-injecting heroin users and 72 percent of<br />
young injectors smoked marijuana in the 3–12<br />
months prior to their interview.<br />
According to the 2003 YRBSS data, the proportion of<br />
9th through 12th grade students in Chicago who reported<br />
lifetime and past-30-day marijuana use decreased<br />
slightly between 2001 and 2003. The proportion<br />
of male and female students reporting past use<br />
was nearly equal, but male students more often reported<br />
first use before age 13. The 2002 Illinois<br />
Youth Survey also indicated that lifetime use of marijuana<br />
among 8th through 12th grade students decreased<br />
among all grades and in both male and female<br />
students.<br />
Proceedings of the Community Epidemiology Work Group, Vol. II, January 2005
In general, currently available marijuana is of variable<br />
quality. The abundance and popularity of marijuana<br />
across the city has led to an increased array of<br />
varieties and prices. Marijuana prices, which remained<br />
level since the June 2003 report, ranged from<br />
$650 to $4,000 per pound, depending on the type and<br />
quality. Ounces typically sold for about $80−$250.<br />
On the street, marijuana was most often sold in bags<br />
for $5–$20 or as blunts. The NDIC reported the following<br />
prices for marijuana in Chicago in 2003:<br />
$900–$1,200 per pound, $50–$75 per ounce, and $3–<br />
$5 per gram.<br />
Street-level reports indicate that some marijuana users<br />
believe that hydroponic marijuana grown to contain<br />
other drugs, including heroin, cocaine, and phencyclidine<br />
(PCP), is available.<br />
Both ISP and NFLIS laboratories analyzed more<br />
marijuana samples than any other drug. Forty-seven<br />
percent of drug samples analyzed by the NFLIS for<br />
Chicago were identified as cannabis.<br />
Stimulants<br />
Methamphetamine (“speed”) use in Chicago remains<br />
low, but it may be increasing in some areas of the city.<br />
The number of methamphetamine ED mentions had<br />
been slowly increasing during the 1990s, but such<br />
mentions remained stable between 2001 and 2002,<br />
when they totaled 45 and 42, respectively. Preliminary<br />
unweighted data accessed from DAWN Live!<br />
show 21 methamphetamine reports in 2003 and 45<br />
reports in 2004. The majority of the 2004 reports<br />
involved males (82 percent), Whites (53 percent), and<br />
those age 25–45.<br />
Methamphetamine calls to the Illinois Poison Center<br />
in Chicago are infrequent: 8 calls in 2001, 14 in<br />
2002, and 7 in 2003.<br />
Amphetamine ED mentions increased significantly<br />
between 1995 (144) and 2002 (415). In 2002, the rate<br />
of amphetamine ED mentions per 100,000 population<br />
(7) was higher than for methamphetamine (1), as has<br />
been observed in previous years (exhibit 1).<br />
Stimulants accounted for nearly 4 percent of all State<br />
treatment episodes (excluding primary abuse of alcohol<br />
only) in FYs 2001 and 2002, up from 2 percent in FY<br />
2000. In FY 2003, DASA began reporting methamphetamine<br />
and amphetamine treatment episodes separately.<br />
Methamphetamine treatment episodes (3,582)<br />
outnumbered those for amphetamines (476). Of the<br />
3,582 statewide methamphetamine treatment episodes,<br />
<strong>EPIDEMIOLOGIC</strong> TRENDS IN <strong>DRUG</strong> <strong>ABUSE</strong>—Chicago<br />
only 35 were reported for Chicago, supporting current<br />
reports of low use in Chicago compared to the rest of<br />
the State. Most treatment episodes for methamphetamine<br />
involved Whites (97 percent) and males (58 percent);<br />
a similar trend was observed for amphetamine<br />
patients (87 and 56 percent, respectively).<br />
According to 2002 ADAM data, only 0.3 percent of<br />
male arrestees in Chicago tested positive for methamphetamine,<br />
but 1.0 percent tested positive during the<br />
first quarter of 2003, suggesting an increase in use.<br />
The 2003 YRBSS data indicated that 3.7 percent of<br />
high school students in Chicago used methamphetamine<br />
one or more times during their life. Male students<br />
were nearly six times more likely to have tried<br />
methamphetamine than female students. The YRBSS<br />
began to report methamphetamine use in 1999, when<br />
4.2 percent of students admitted lifetime use. The percentage<br />
of methamphetamine use among students decreased<br />
in 2001 to 2.8 percent, before increasing<br />
slightly in 2003.<br />
Data from the ISP indicated that more methamphetamine<br />
continued to be seized than cocaine or heroin<br />
in nearly 50 percent of Illinois counties in 2004. In<br />
2004, the amount of methamphetamine received by ISP<br />
from Cook County was about 8 kilograms, while the<br />
total methamphetamine received from all Illinois counties<br />
was at about 24 kilograms, similar to the previous<br />
year. According to the NFLIS 2004 report, 0.36 percent<br />
of the items analyzed in Chicago were methamphetamine,<br />
which is a slight increase from 0.21 percent reported<br />
the year before.<br />
According to ICJIA, the number of methamphetaminerelated<br />
arrests in Illinois increased significantly between<br />
1997 (3 arrests) and 2003 (1,112 arrests). While<br />
methamphetamine arrests increased across all regions<br />
during this period, rural task force units experienced the<br />
greatest increase in arrests (from 0 to 514 arrests), followed<br />
by mixed urban/rural units (from 3 to 373 arrests)<br />
and by mostly urban units (from 0 to 225 arrests).<br />
Within Chicago, a low but stable prevalence of<br />
methamphetamine use has been reported in some areas<br />
of the city in the past 5 years, especially on the North<br />
Side, where young gay men, homeless youth, and<br />
White clubgoers congregate. Of note, ethnographic data<br />
suggest that methamphetamine availability has increased<br />
substantially since June 2001 among at least<br />
some networks of gay White men on the North Side,<br />
who may use the drug to enhance sexual experiences.<br />
There were also reports from persons who said they<br />
began using methamphetamine to lose weight but became<br />
addicted to the drug.<br />
Proceedings of the Community Epidemiology Work Group, Vol. II, January 2005 57
In the NIHU Study, 20 percent of participants reported<br />
ever trying amphetamine or methamphetamine, and<br />
only 6 percent reported using it in the 6 months prior to<br />
the interview. Among injectors in the Family Process<br />
study, 19 percent of participants reported amphetamine<br />
use, and 9 percent used it in the previous 12 months.<br />
Methylphenidate (Ritalin) remained readily available<br />
in some South Side neighborhoods, where it could be<br />
purchased for injection, either alone or in combination<br />
with heroin. Pills, often referred to as “beans”<br />
in these areas, are sold for $1.50 to $5.00 each, depending<br />
on the quantity being purchased. The cost of<br />
Ritalin on the West Side of Chicago was reported to<br />
be $10 per pill. Some study participants report that<br />
Ritalin was readily available in their schools and that<br />
students knew which students had been prescribed<br />
Ritalin and often requested the drug from them.<br />
Methamphetamine prices have not changed since June<br />
2003, when it was reported that bags of methamphetamine<br />
sold for $20. Most drug users reported that<br />
the drug remained difficult to obtain. However, police<br />
and street reports suggest that some Mexico-based drug<br />
dealers are attempting to introduce methamphetamine<br />
for local consumption by offering free samples, which<br />
may eventually change the low and stable trend of<br />
methamphetamine use in Chicago. There was one street<br />
report of methamphetamine being sold at a South Side<br />
drug market. According to the NDIC 2003 report,<br />
methamphetamine cost $1,000–$1,300 per ounce and<br />
$80–$100 per gram.<br />
Depressants<br />
Three patterns of depressant-in-combination use have<br />
been common in Chicago and throughout Illinois:<br />
• Depressants are taken with narcotics to potentiate<br />
the effect of opiates. Pharmaceutical depressants<br />
are frequently combined with heroin.<br />
• Depressants are taken with stimulants to moderate<br />
the undesirable side effects of chronic<br />
stimulant abuse. Chronic cocaine and speed<br />
abusers often take depressants along with stimulants,<br />
or when concluding “runs,” to help induce<br />
sleep and to reduce the craving for more stimulants<br />
(especially in the case of cocaine).<br />
• Alcohol, also a central nervous system depressant,<br />
is taken with pharmaceutical depressants<br />
(such as hypnotics or tranquilizers). The practice<br />
of mixing alcohol with other depressants may<br />
indicate illicit pharmaceutical depressant use.<br />
58<br />
<strong>EPIDEMIOLOGIC</strong> TRENDS IN <strong>DRUG</strong> <strong>ABUSE</strong>—Chicago<br />
The number of barbiturate ED mentions totaled 404<br />
in 2002, compared with the peak of 525 mentions in<br />
1997.<br />
Benzodiazepine ED mentions increased significantly<br />
between 1995 (n=1,959) and 2002 (2,776), a 42percent<br />
change. Both ED mentions and ethnographic<br />
reports indicate that alprazolam appears to be the<br />
benzodiazepine most readily available on the street,<br />
closely followed by clonazepam and lorazepam, with<br />
variations in different areas of the city.<br />
Benzodiazepine-related calls to the Illinois Poison<br />
Center in Chicago have repeatedly represented nearly<br />
one-half of all substance misuse calls between 2001<br />
and 2003. On average, approximately 500 calls annually<br />
were reported during this time period.<br />
Treatment data for other opioids, tranquilizers, and<br />
sedatives/hypnotics indicate that depressants are not<br />
the primary drugs of choice for most users. According<br />
to DASA, there were 2,399 treatment episodes in<br />
publicly funded programs in Illinois in FY 2003.<br />
Primary opioid, tranquilizer, and sedative/hypnotics<br />
users represented only about 2 percent of all treatment<br />
episodes, excluding alcohol.<br />
Lifetime use of tranquilizers or barbiturates without a<br />
prescription (Valium, Elavil, Ativan, Xanax) was<br />
reported by 31 percent of young non-injecting heroin<br />
users. Thirteen percent reported using in the past 30<br />
days. Young injectors reported moderate use of barbiturates.<br />
In the Family Process study, 43 percent<br />
reported ever using barbiturates, and 30 percent used<br />
them during the previous 12 months.<br />
The 2002 APORS data indicate that the rate of infants<br />
testing positive for barbiturates has been decreasing<br />
since 2000. In 2002, the rate of children exposed<br />
to barbiturates at birth was 0.4 per 10,000 live<br />
births, compared with 0.8 per 10,000 in 2001 and 1.4<br />
per 10,000 in 2000.<br />
No updated prices for depressants were available. As<br />
stated in past Chicago CEWG reports, alprazolam<br />
typically sells for $2–$3 for 0.5-milligram tablets and<br />
$5–$10 for 1-milligram tablets.<br />
Hallucinogens<br />
Recent declines in lysergic acid diethylamide (LSD)<br />
ED mentions suggest a downward trend in LSD use<br />
in Chicago. Between 1995 and 2002, LSD ED mentions<br />
declined by 92 percent. The rate of LSD ED<br />
mentions per 100,000 population was less than 1 in<br />
2002 for the first time in the prior 7 years<br />
Proceedings of the Community Epidemiology Work Group, Vol. II, January 2005
As observed with LSD, PCP ED data showed declines<br />
in Chicago. After a peak in 2000, when 1,003<br />
ED mentions were reported, PCP ED mentions decreased<br />
to 874 in 2001 and to 459 in 2002. Similarly,<br />
ED rates declined between 2001 and 2002 from 15 to<br />
8 (per 100,000), a 48-percent change.<br />
Recent trends in hallucinogen treatment have varied,<br />
but overall the number of episodes in publicly funded<br />
treatment programs in Illinois has been relatively<br />
high, compared with trends in the 1990s. In FY 2003,<br />
472 treatment episodes were reported (exhibit 2).<br />
According to the 2003 ADAM report, the percentage<br />
of adult male arrestees testing positive for PCP decreased<br />
between 2002 and 2003, from 2.2 percent to<br />
1.3 percent. PCP use appears to be more common<br />
among adult female arrestees; 5.6 percent of female<br />
arrestees tested positive for PCP in 2003.<br />
In the study of young non-injecting heroin users, 37<br />
percent of participants reported ever trying LSD,<br />
mescaline, mushrooms, or other hallucinogens, but<br />
only a few (6 percent) reported use in the 6 months<br />
prior to their interview. Among young injectors, 75<br />
percent of participants reported ever trying hallucinogens,<br />
and 32 percent reported use in the 12 months<br />
prior to their interview. Whites were much more<br />
likely than African-Americans to report recent use of<br />
hallucinogens.<br />
Recent reports from young heroin snorters indicate that<br />
PCP use may be more common in this population. Fifty<br />
percent of study participants reported ever trying PCP,<br />
and 14 percent admitted use within 6 months prior to<br />
their interview.<br />
According to the 2002 Illinois Youth Survey, 5 percent<br />
of students in grades 8 through 12 reported lifetime<br />
use of “any hallucinogen” (including LSD and<br />
PCP). This is a considerable decrease in use from<br />
2000 (7 percent) and 1998 (8.5 percent). Further discussion<br />
of the Illinois Youth Survey is provided in<br />
the December 2003 CEWG report.<br />
The amount of PCP samples received by the ISP laboratory<br />
for analysis decreased significantly between<br />
2002 and 2004, from 4.2 kilograms to 0.59 kilograms.<br />
Ethnographic reports on PCP use are available in the<br />
June 2003 Chicago CEWG report. On the West side,<br />
2–3 PCP “sticks” about the size of toothpicks were<br />
reportedly available for $5–$10, according to the<br />
June 2003 CEWG report. Some “wicky sticks” are<br />
said to also include embalming fluid, and these cost<br />
more. Sherm sticks typically are cigarettes or small<br />
<strong>EPIDEMIOLOGIC</strong> TRENDS IN <strong>DRUG</strong> <strong>ABUSE</strong>—Chicago<br />
cigars dipped in PCP, drained, and dried. The cigarettes—most<br />
often Mores®—are sold for about $20–<br />
$30 each and are mainly available on the far South<br />
Side. PCP was also said to be sold in sugar cubes for<br />
$20 each. Liquid PCP (“water”) was said to sell for<br />
$120 for a vial.<br />
LSD hits typically cost $5–$10. LSD is available in<br />
the city and suburbs.<br />
According to some accounts by White youth, hallucinogenic<br />
mushrooms remain available. Reported<br />
prices were $20–$40 per mushroom.<br />
Club Drugs<br />
In the Chicago area, methylenedioxymethamphetamine<br />
(MDMA or ecstasy) continues to be the most<br />
prominently identified of the club drugs and its use<br />
appears to have increased among African-Americans.<br />
Of all the CEWG sites, Chicago had the most MDMA<br />
ED mentions in 2000 (215), but it ranked 10th in 2002<br />
(87). The preliminary unweighted data extracted from<br />
DAWN Live! show 25 reports in 2003 and 56 reports<br />
in 2004. ED reports in 2004 were more common<br />
among male patients (77 percent) and those younger<br />
than 30 (84 percent). ED reports by race/ethnicity were<br />
fairly evenly distributed between African-Americans<br />
(38 percent) and Whites (29 percent), but race/ethnicity<br />
for 23 percent of reports was unknown.<br />
Illinois DASA began reporting treatment data related<br />
to “club drugs” for the first time in FY 2002, when<br />
50 such episodes were reported. In FY 2003, 79 episodes<br />
were reported, of which 63 percent were<br />
among males and 54 percent were among Whites.<br />
Treatment episodes for Chicago alone totaled 23 during<br />
FY 2003, of which 16 (70 percent) were among<br />
African-Americans.<br />
In 2002, the Illinois Youth Survey for the first time<br />
included separate questions regarding MDMA use.<br />
Lifetime and past-year ecstasy use appears to be low<br />
among 8th through 12th grade students (0.6 percent<br />
and 0.4 percent, respectively).<br />
MDMA samples sent to ISP from Cook County have<br />
been decreasing since 2000, when 6.7 kilograms were<br />
analyzed in the State laboratory. However, a recent<br />
increase in MDMA samples sent to the lab was observed<br />
between 2003 and 2004, from 0.8 kilograms<br />
to 3.1 kilograms. Similarly, the NFLIS reported that<br />
0.16 percent of all items analyzed for Chicago were<br />
MDMA in FY 2003. In FY 2004, MDMA accounted<br />
for 0.29 percent of all items sent to the lab.<br />
Proceedings of the Community Epidemiology Work Group, Vol. II, January 2005 59
Ecstasy remained available in most mainstream<br />
dance clubs and at many house parties. Recent ethnographic<br />
reports also suggest that ecstasy may be purchased<br />
in some “open air” street markets on the west<br />
side of Chicago. It continued to be sold in pill or<br />
capsule form, and the price range remained unchanged<br />
from December 2002: $20–$40 per pill. Individuals<br />
with connections to suppliers or producers<br />
reported prices as low as $12–$15 per pill. These<br />
prices parallel the 2003 NDIC report: wholesale<br />
prices ranged between $10 and $12 per tablet and the<br />
retail price was $25–$35 per dosage unit. Along with<br />
other club drugs, ecstasy may continue to be used<br />
predominantly by White youth, but there have been<br />
increasing reports of ecstasy use from African-<br />
Americans in their twenties and thirties who have<br />
been involved in club scenes. Among participants in<br />
the NIHU Study, 36 percent reported MDMA use.<br />
Street-level reports suggest that a pill may be purchased<br />
in some clubs that contains a combination of<br />
MDMA, cocaine, and heroin. A user may choose a<br />
different mixture of the three drugs depending on the<br />
type of “high” he or she seeks. Names for different<br />
brands of this pill include “Papay,” “Batman,” and<br />
“Spiderman.”<br />
Gamma hydroxybutyrate (GHB), a central nervous<br />
system depressant with hallucinogenic effects, is used<br />
infrequently in Chicago, mainly by young White<br />
males. ED mentions for GHB decreased 43 percent,<br />
from 139 in 2000 to 79 in 2002. According to preliminary<br />
unweighted data accessed from DAWN<br />
Live!, there were only 5 GHB ED reports in 2003 and<br />
38 reports in 2004.<br />
GHB is sold as a liquid (also referred to as “Liquid<br />
G”), in amounts ranging from drops (from a dropper<br />
at raves or parties) to capfuls. Prices for a capful have<br />
been reported at $5–$25. Compared with other club<br />
drugs, overdoses are more frequent with GHB, especially<br />
when used in combination with alcohol. GHB<br />
is not tracked in most quantitative indicators, but its<br />
use is perceived to be low compared with ecstasy.<br />
Ketamine, an animal tranquilizer, is another depressant<br />
with hallucinogenic properties and is often referred<br />
to as “Special K.” Ketamine ED mentions totaled<br />
10 in 2002, compared with 14 in 2001. The rate<br />
of ketamine ED mentions per 100,000 population<br />
(0.1) also remained unchanged. DASA reported only<br />
two patients served for ketamine use in FY 2003 in<br />
publicly funded treatment programs in Illinois. As<br />
reported in the June 2004 Chicago CEWG report,<br />
street reports indicate that ketamine is usually sold in<br />
$5–$30 bags of powder or in liquid form. The drug is<br />
60<br />
<strong>EPIDEMIOLOGIC</strong> TRENDS IN <strong>DRUG</strong> <strong>ABUSE</strong>—Chicago<br />
somewhat available at rave parties or in clubs frequented<br />
by younger adolescents.<br />
INFECTIOUS DISEASES RELATED TO <strong>DRUG</strong> <strong>ABUSE</strong><br />
Through October 2004, 30,865 diagnosed AIDS<br />
cases were reported to the State. More than onequarter<br />
of adult AIDS cases occurred among IDUs,<br />
while an additional 6.5 percent involved male IDUs<br />
who had sex with other men. Within Illinois, 79 percent<br />
of the cumulative AIDS cases reported originate<br />
in the Chicago metropolitan area.<br />
HIV cases may represent more recent trends in risk<br />
behaviors. From January to October 2004, 2,193 HIV<br />
cases and 1,095 AIDS cases were reported to the<br />
State. Of newly reported HIV cases, 82 percent were<br />
in Cook County. Overall, IDUs accounted for 17 percent<br />
of cases in Illinois, while 3.5 percent occurred<br />
among male IDUs who had sex with other men.<br />
The most recent report on HIV/AIDS cases in Chicago<br />
indicated that by the end of 2003, 7,590 HIV<br />
cases and 21,420 AIDS cases were reported. An estimated<br />
17,169 individuals are living with HIV and<br />
AIDS in Chicago. Gender and demographic data on<br />
these AIDS cases are available in the June 2003 Chicago<br />
CEWG report.<br />
In Chicago, between 1990 and 2002, IDUs as a proportion<br />
of AIDS cases peaked at 33 percent in 1996<br />
and then steadily decreased to 24 percent as of 2002.<br />
Only 19 percent of HIV cases reported in 2003 were<br />
attributed to injection drug use. In Illinois, 15 percent<br />
of the 477 diagnosed AIDS cases from January to<br />
September 2004 were attributed to injection drug use.<br />
Although the proportion of cases among men who<br />
have sex with men (MSM) had declined, male-tomale<br />
sex remained the predominant mode of transmission<br />
for males and increased between 2002 and<br />
2004, from 43 percent to 60 percent of diagnosed<br />
cases. Heterosexual transmission of HIV/AIDS has<br />
increased by 1 percent each year since 1998, reaching<br />
18 percent in 2002. Among African-American and<br />
Hispanic women, heterosexual contact remains the<br />
leading mode of HIV transmission, while among<br />
White women, injection drug use was the principal<br />
mode of transmission.<br />
In 2002, the number of deaths from AIDS declined 5<br />
percent in Illinois and 9 percent in Chicago compared<br />
to 2001, a level approximately equal to the number of<br />
deaths in 2000. Given the long latency between HIV<br />
infection and AIDS diagnosis, these figures do not<br />
reflect the full scope of the epidemic. Data from the<br />
authors’ studies provide additional information on the<br />
Proceedings of the Community Epidemiology Work Group, Vol. II, January 2005
extent of HIV infection among IDUs. In studies of<br />
IDUs cited in previous CEWG reports, HIV prevalence<br />
ranged from 18 to 25 percent at baseline, with<br />
reported incidence rates of 1 to 2 percent per personyear.<br />
Recent studies of young IDUs indicate high<br />
levels of HIV risk behaviors but very low levels of<br />
HIV infection, particularly among those who reside<br />
in the suburbs. It should be noted, however, that the<br />
studies are not directly comparable, because each had<br />
unique sampling and recruitment strategies. More<br />
information on HIV and HCV seroprevalence among<br />
participants in a 1997–1999 study of 700 young IDUs<br />
in Chicago is available in the June 2003 Chicago<br />
CEWG report. Analysis of the NIHU Study (n=581)<br />
found an HIV and HCV seroprevalence of 4 and 2<br />
percent, respectively. During the 12-month followup<br />
period, no HIV seroconversions and three HCV seroconversions<br />
were observed.<br />
As reported in the June 2003 report, findings suggest<br />
that HIV prevalence and the rate of new HIV infections<br />
have declined among IDUs in Chicago since<br />
peaking in the late 1980s.<br />
ACKNOWLEDGEMENTS<br />
The authors wish to thank the field staff of the Community<br />
Outreach Intervention Projects, School of Public<br />
Health, University of Illinois at Chicago, for their<br />
contributions to this report. We particularly thank site<br />
supervisors Raquel Rondon, Ed Snulligan, Mary<br />
Bonilla, Otillo Green, and Otis McCoy, and outreach<br />
workers James Crues, Hermenegildo ‘Armando’ Lira,<br />
and Robert Banks for assisting with preparing the report.<br />
The authors also wish to thank staff at the agencies<br />
and organizations that contributed data used in this<br />
report.<br />
REFERENCES<br />
Bailey, S.L.; Huo, D.; Garfein R.S.; and Ouellet, L.J.<br />
2003. Needle exchange as a harm reduction strategy<br />
for young injection drug users. Journal of Acquired<br />
Immune Deficiency Syndromes 34(1):67–<br />
70.<br />
Johnston, L.D.; O’Malley, P.M.; and Bachman, J.G.<br />
2001. Monitoring the Future: National Survey Results<br />
on Drug Use, 1975–2000. Volume I. (NIH<br />
<strong>EPIDEMIOLOGIC</strong> TRENDS IN <strong>DRUG</strong> <strong>ABUSE</strong>—Chicago<br />
Publication No. 01-4924.) Rockville, MD: National<br />
Institute on Drug Abuse.<br />
Kane-Willis, K.; Schmitz-Bechteler S. 2004. A Multiple<br />
Indicator Analysis of Heroin Use in the Chicago<br />
Metropolitan Area: 1995 to 2002. Institute<br />
for Metropolitan Affairs, Roosevelt University.<br />
National Drug Intelligence Center, Department of Justice.<br />
2003. Illicit drug prices: July 2003-December<br />
2003. Narcotics Digest Weekly (Special Issue)<br />
2(50):1-36, December 16.<br />
Ouellet, L.J.; Thorpe, L.E.; Huo, D.; Bailey, S.L.;<br />
Jimenez, A.D.; Johnson, W.A.; Rahimian, A.; and<br />
Monterroso, E. 2000. Prevalence and incidence of<br />
human immunodeficiency virus infection among a<br />
cohort of injecting drug users: Chicago, 1994–<br />
1996. Journal of Acquired Immune Deficiency<br />
Syndromes 25(5):443–450.<br />
Thorpe, L.E.; Ouellet, L.J.; Hershow, R.; Bailey, S.L.;<br />
Williams, I.T.; Williamson, J.; Monterroso, E.;<br />
and Garfein, R. 2002. Risk of hepatitis C virus infection<br />
among young adult injection drug users<br />
who share injection equipment. American Journal<br />
of Epidemiology 155(7):645–653.<br />
Thorpe, L.E.; Bailey, S.L.; Huo, D.; Monterroso,<br />
E.R.; and Ouellet, L.J. 2001. Injection-related<br />
risk behaviors in young urban and suburban injection<br />
drug users in Chicago (1997–1999).<br />
Journal of Acquired Immune Deficiency Syndromes<br />
27(1):71–8.<br />
Thorpe, L.E.; Ouellet, L.J.; Levy, J.R.; Williams,<br />
I.T.; and Monterroso, E. 2000. Hepatitis C virus<br />
infection: prevalence and prevention opportunities<br />
among young injection drug users in Chicago,<br />
1997–1999. Journal of Infectious Diseases<br />
182(6):1588–1594.<br />
Wiebel, W.W.; Jimenez, A.D.; Johnson, W.A.;<br />
Ouellet, L.J.; Jovanovic, B.; Lampinen, T.;<br />
Murray, J.; and O’Brien, M.U. 1996. Risk behavior<br />
and HIV seroincidence among out-of-treatment<br />
injection drug users: a four-year prospective<br />
study. Journal of Acquired Immune Deficiency<br />
Syndromes 12: 282–289.<br />
For inquiries concerning this report, please contact Lawrence Ouellet, Ph.D., Director, Community Outreach Intervention Projects, Epidemiology<br />
and Biostatistics (MC923), School of Public Health, University of Illinois at Chicago, 1603 West Taylor Street, Chicago, Illinois 60612-<br />
4394, Phone: (312) 996-5523, Fax: (312) 996-1450, E-mail: .<br />
Proceedings of the Community Epidemiology Work Group, Vol. II, January 2005 61
62<br />
<strong>EPIDEMIOLOGIC</strong> TRENDS IN <strong>DRUG</strong> <strong>ABUSE</strong>—Chicago<br />
Exhibit 1. Estimated Rates of ED Mentions Per 100,000 Population in Chicago for Selected Drugs:<br />
1995–2002<br />
Year Cocaine Heroin Marijuana Methamphetamine Amphetamines<br />
1995 188 83 51 1 3<br />
1996 220 109 61 0 3<br />
1997 247 148 76 0 4<br />
1998 232 158 85 1 3<br />
1999 225 162 77 0 3<br />
2000 246 206 89 … 1 6<br />
2001 277 203 89 1 7<br />
2002 275 220 78 1 7<br />
1 Dots (…) indicate that an estimate with a relative standard of error greater than 50 percent has been suppressed.<br />
SOURCE: DAWN, OAS, SAMHSA<br />
Exhibit 2. Illinois Patients Served in Publicly Funded Treatment Programs by Primary Drug of Abuse:<br />
FY 2000–FY 2003<br />
FY 2000 FY 2001 FY 2002 FY 2003 1<br />
Primary Drug Dec.<br />
1999<br />
June<br />
2000<br />
Total<br />
Dec.<br />
2000<br />
June<br />
2001<br />
Total<br />
Dec.<br />
2001<br />
June<br />
2002<br />
Total Total<br />
Cocaine 18,531 12,937 31,468 16,967 14,354 31,321 14,581 13,550 28,131 33,882<br />
Heroin 11,733 8,121 19,854 13,745 10,718 24,463 10,747 11,162 21,909 34,615<br />
Cannabinoids 12,484 8,289 20,773 14,253 11,373 25,626 11,811 14,560 26,371 32,077<br />
Hallucinogens 290 227 517 323 221 544 237 242 479 472<br />
Stimulants 2 577 693 1,270 1,969 1,802 3,771 1,517 1,673 3,190 4,508<br />
1 Data by half-year not available in FY 2003.<br />
2 Stimulants include amphetamine and methamphetamine.<br />
SOURCE: Illinois Office of Alcoholism and Substance Abuse<br />
Proceedings of the Community Epidemiology Work Group, Vol. II, January 2005
Percent<br />
60<br />
50<br />
40<br />
30<br />
20<br />
10<br />
0<br />
<strong>EPIDEMIOLOGIC</strong> TRENDS IN <strong>DRUG</strong> <strong>ABUSE</strong>—Chicago<br />
Exhibit 3. Percentages of ADAM Adult Male Arrestees Testing Positive in Chicago for Selected Drugs by<br />
Year: 2000–2003 1<br />
2000 2001 2002 2003<br />
Marijuana<br />
Cocaine<br />
Opiates<br />
1<br />
Data for 2000 are for the first through third quarters; data for 2001 are for the fourth quarter only; and data for 2003 are for the first<br />
three quarters.<br />
SOURCE: ADAM, NIJ<br />
Exhibit 4. Heroin Price and Purity Trends in Chicago, by Geographic Origin: 2000–2003<br />
2000 2001 2002 2003 4<br />
Trend<br />
SEA 1 SWA 2 SA 3 SEA SWA SA SEA SWA SA SWA SA<br />
Purity (%) 16.9 20.2 23.8 20.7 20.8 19.5 20.8 19.8 20.4 18.4 15.8<br />
Price Per Milligram<br />
Pure<br />
$1.16 $0.32 $0.48 $0.45 $0.41 $0.71 $0.71 $0.39 $0.43 $0.52 $0.46<br />
1 Southeast Asia.<br />
2 Southwest Asia.<br />
3 South America.<br />
4 SEA data are not available for 2003.<br />
SOURCE: DMP, DEA<br />
Proceedings of the Community Epidemiology Work Group, Vol. II, January 2005 63
<strong>EPIDEMIOLOGIC</strong> TRENDS IN <strong>DRUG</strong> <strong>ABUSE</strong>—Denver and Colorado<br />
Patterns and Trends in Drug Abuse: Denver and Colorado<br />
Nancy E. Brace, R.N., M.A. 1<br />
ABSTRACT<br />
Alcohol remains Colorado’s most frequently abused<br />
substance, and tobacco is responsible for 4,200<br />
deaths in Colorado annually. Excluding alcohol<br />
and tobacco, the use and trafficking of illegal drugs<br />
continues to be an expanding problem in Colorado,<br />
with much of the transporting, distribution, and<br />
selling of illegal substances supported by organized<br />
crime entities. Cocaine accounted for more than 41<br />
percent of (unweighted) emergency department illicit<br />
drug reports (excluding alcohol) in the first<br />
half of 2004, for the highest rate of drug-related<br />
hospital discharges from 1997 to 2003, and for the<br />
largest number of drug-involved deaths from 1996<br />
through 2002. Cocaine also accounted for the highest<br />
number of drug-related calls to the Rocky<br />
Mountain Poison and Drug Center from 2001 to<br />
2003. In the first half of 2004, methamphetamine<br />
exceeded cocaine in the number of these calls; it<br />
had surpassed cocaine in the number of treatment<br />
admissions in the State in 2003. Drug enforcement<br />
officials and treatment providers have corroborated<br />
this increase in methamphetamine use and trafficking<br />
in Colorado. Since 1997, marijuana has resulted<br />
in the highest number of treatment admissions annually<br />
across the State and in the highest percentage<br />
of users entering treatment within 3 years of<br />
initial use. Methamphetamine takes second place in<br />
the latter category, surpassing both cocaine and<br />
heroin. Most indicators for heroin are decreasing,<br />
but experts in the field report an increase in Oxy-<br />
Contin use, especially among adolescents. Initial<br />
use for most of these illegal substances seems to be<br />
occurring at a younger age.<br />
INTRODUCTI<strong>ON</strong><br />
Area Description<br />
Denver, the capital of Colorado, is located slightly<br />
northeast of the State's geographic center. Covering<br />
only 154.6 square miles, Denver is bordered by several<br />
large suburban counties and one smaller county:<br />
Arapahoe on the southeast, Adams on the northeast,<br />
Jefferson on the west, Broomfield (the smallest<br />
county) on the northwest, and Douglas on the south.<br />
These areas make up the Denver Primary Metropoli-<br />
1 The author is affiliated with the Colorado Department of Human Services, Alcohol and Drug Abuse Division, Denver, Colorado.<br />
64<br />
tan Statistical Area (PMSA). In recent years, Denver<br />
and the surrounding counties have experienced rapid<br />
population growth. According to the 2000 census, the<br />
Denver PMSA population was 2,143,981. By the end<br />
of 2004, this was expected to increase by 7.0 percent<br />
to 2,292,834, followed by an 8.0-percent increase to<br />
2,320,287 in 2005. Colorado is third among the top<br />
five fastest growing States in the country. Statewide,<br />
the population is expected to increase from the 2000<br />
census figure of 4,339,549 to 4,706,754 by the end of<br />
2005 (an 8.5-percent increase). The Denver metropolitan<br />
area accounts for 12 percent of Colorado's<br />
total population. The Denver PMSA accounts for 50<br />
percent of the total State population. The median age<br />
in the Denver area is 33.1. Males represent 50.5 and<br />
females 49.5 percent of the population. Ethnic and<br />
racial characteristics of the area are as follows: 65<br />
percent White, 11 percent Black or African-<br />
American, 1 percent American Indian, 3 percent<br />
Asian, and 0.1 percent Native Hawaiian and Other<br />
Pacific Islander. Hispanics or Latinos of any race<br />
account for 32 percent of the area’s population.<br />
The average household size is 2.27, and the average<br />
family size is 3.14. For the population age 25 and<br />
older, 79 percent are high school graduates or higher,<br />
and 35 percent have bachelor’s degrees or higher.<br />
The median household income is $39,500, and the<br />
median family income is $48,185. Eleven percent of<br />
families and 14 percent of individuals in the area live<br />
below the poverty level.<br />
Several considerations may influence drug use in<br />
Denver and Colorado:<br />
• Two major interstate highways intersect in Denver.<br />
• The area’s major international airport is nearly at<br />
the midpoint of the continental United States.<br />
• There is rapid population growth.<br />
• Remote rural areas are ideal for the undetected<br />
manufacture, cultivation, and transport of illicit<br />
drugs.<br />
Proceedings of the Community Epidemiology Work Group, Vol. II, January 2005
• A young citizenry is drawn to the recreational<br />
lifestyle available in Colorado.<br />
• The large tourism industry draws millions of<br />
people to the State each year.<br />
• Several major universities and small colleges are<br />
in the area.<br />
• The preliminary Colorado unemployment rate<br />
was 5.0 percent as of November 2004, which is<br />
down slightly from 5.8 percent in November<br />
2003. As for the Denver PMSA, the unemployment<br />
rate was 5.0 percent as of November 2004,<br />
a decrease of 1 percent from a year earlier.<br />
Data Sources<br />
Data presented in this report were collected and analyzed<br />
in December 2004 and January 2005. Although<br />
these indicators reflect trends throughout Colorado,<br />
they are dominated by the Denver metropolitan area.<br />
• Drug-related emergency department (ED) reports<br />
for the Denver metropolitan area for the<br />
first half of 2004 were accessed from the DAWN<br />
Live! restricted-access online query system administered<br />
by the Office of Applied Studies (OAS),<br />
Substance Abuse and Mental Health Services<br />
Administration (SAMHSA). All 14 eligible hospitals<br />
in the Denver area are in the DAWN sample,<br />
which includes 14 emergency departments. These<br />
data, which were updated December 13, 2004, are<br />
unweighted and incomplete, with between five<br />
and six EDs reporting each month over the 6month<br />
period. All DAWN cases are reviewed for<br />
quality control. Based on the review, cases may<br />
be corrected or deleted; thus, the data presented in<br />
this paper are subject to change. Data accessed<br />
from DAWN Live! represent drug reports in drugrelated<br />
ED visits; reports may exceed the number<br />
of visits since a patient may report use of multiple<br />
drugs (up to six drugs and alcohol). As noted earlier,<br />
the data are unweighted and, thus, are not estimates<br />
for the Denver area. The data cannot be<br />
compared with DAWN data from 2002 and before,<br />
nor can they be used for comparison with future<br />
data. Only weighted data released by<br />
SAMHSA can be used for trend analysis. A full<br />
description of DAWN can be found at<br />
.<br />
• Drug-related mortality data for the Denver<br />
metropolitan area for 1996 through 2002 were<br />
provided by SAMHSA’s Drug Abuse Warning<br />
Network (DAWN) data. Statewide data were<br />
<strong>EPIDEMIOLOGIC</strong> TRENDS IN <strong>DRUG</strong> <strong>ABUSE</strong>—Denver and Colorado<br />
provided by the Colorado Department of Public<br />
Health and Environment (CDPHE).<br />
• Hospital discharge data statewide for 1997–<br />
2003 were provided by the Colorado Hospital<br />
Association through CDPHE, Health Statistics<br />
Section. Data included are diagnoses (ICD-9-CM<br />
codes) for inpatient clients at discharge from all<br />
acute care hospitals and some rehabilitation and<br />
psychiatric hospitals. These data do not include<br />
ED care.<br />
• Drug/Alcohol Coordinated Data System<br />
(DACODS) reports are completed on clients at<br />
admission and discharge from all Colorado alcohol<br />
and drug treatment agencies licensed by the<br />
Alcohol and Drug Abuse Division (ADAD),<br />
Colorado Department of Human Services. Annual<br />
figures are given for 1997 through the first<br />
half of calendar year 2004 (annualized unless<br />
otherwise noted). DACODS data are collected<br />
and analyzed by ADAD. Some State fiscal year<br />
(FY) data have been taken from ADAD’s annual<br />
report to the legislature, “The Costs and Effectiveness<br />
of Alcohol and Drug Abuse Programs in<br />
the State of Colorado, October 29, 2004.”<br />
• School survey findings are from the Colorado<br />
Youth Survey (CYS) of 6th through 12th graders<br />
in 2003.<br />
• Availability, price, and distribution data were<br />
collected from local Drug Enforcement Administration<br />
(DEA) Denver Field Division (DFD) officials<br />
in their fourth quarter FY 2004 report; the<br />
Office of National Drug Control Policy<br />
(<strong>ON</strong>DCP), Drug Policy Information Clearinghouse,<br />
“Denver, Colorado, Profile of Drug Indicators,<br />
June 2004;” and from the December 28,<br />
2004, issue of Narcotics Digest Weekly, Volume<br />
3, Number 52. Additional information was obtained<br />
from the National Drug Intelligence Center,<br />
Colorado Threat Assessment, May 2003.<br />
• Communicable disease data were obtained from<br />
CDPHE. Data are presented for 1997–2003.<br />
• Rocky Mountain Poison and Drug Center<br />
(RMPDC) data are presented for Colorado. The<br />
data represent the number of calls to the center regarding<br />
“street drugs” from 1996 through 2003.<br />
• Arrestee Drug Abuse Monitoring (ADAM)<br />
program reports on arrestee urinalysis results<br />
are based on quarterly studies conducted under<br />
the auspices of the National Institute of Justice<br />
(NIJ). ADAM data in Colorado were collected<br />
Proceedings of the Community Epidemiology Work Group, Vol. II, January 2005 65
66<br />
and analyzed by the Division of Criminal Justice.<br />
In 2000, NIJ changed its procedures from a convenience<br />
to a probability sample. Thus, no<br />
ADAM data trend analysis is presented. Rather,<br />
2001, 2002, and 2003 use percentages by drug<br />
type are indicated.<br />
• Sentencing data on Federal drug convictions in<br />
the State of Colorado for Federal FY 2002 were<br />
compiled by the United States Sentencing Commission,<br />
Office of Policy Analysis.<br />
• Information about offenders in the Colorado<br />
correctional system for substance abuse-related<br />
crimes was supplied by The Colorado Department<br />
of Corrections, Overview of Substance<br />
Abuse Treatment Services Fiscal Year 2003 and<br />
by The Colorado Department of Corrections Statistical<br />
Report, Fiscal Year 2003.<br />
• Statistics on seized and forensically analyzed<br />
drug items were provided by the Drug Enforcement<br />
Administration, Office of Diversion Control,<br />
National Forensic Laboratory Information<br />
System (NFLIS) Year 2003 Annual Report, from<br />
information reported by the Denver Police Department<br />
Crime Laboratory.<br />
• Alcohol data were taken from the “U.S. Apparent<br />
Consumption of Alcoholic Beverages Based<br />
on State Sales” by the U.S. Department of Health<br />
and Human Services, June 2004, the Rocky<br />
Mountain Insurance Information Association<br />
(RMIIA), the Department of Transportation Fatality<br />
Analysis Reporting System (FARS), and<br />
Colorado State Patrol statistics.<br />
• Tobacco statistics for 2003 were provided by<br />
“Colorado Health Watch 2004,” a publication of<br />
the CDPHE.<br />
• Population statistics were obtained from the<br />
Colorado Demography Office, Census 2000 including<br />
estimates and projections, and factfinder.census.gov.<br />
• Qualitative and ethnographic data for this report<br />
were available mainly from clinicians from<br />
treatment programs across the State, local researchers,<br />
and street outreach workers.<br />
<strong>DRUG</strong> <strong>ABUSE</strong> PATTERNS AND TRENDS<br />
Cocaine/Crack<br />
Cocaine indicators remained mixed, with some increasing<br />
and some decreasing.<br />
<strong>EPIDEMIOLOGIC</strong> TRENDS IN <strong>DRUG</strong> <strong>ABUSE</strong>—Denver and Colorado<br />
Unweighted data accessed from DAWN Live! on<br />
Denver ED reports for cocaine showed 699 such reports<br />
in the first half of 2004, representing 41.4 percent<br />
of all illicit drug reports (exhibit 1).<br />
Statewide hospital discharges showed that cocaine<br />
mentions per 100,000 population rose steadily from<br />
1997 (56 per 100,000) through 2003 (80 per 100,000)<br />
(exhibit 2).<br />
The number of cocaine-related calls to the RMPDC<br />
rose statewide from 2001 (59) through 2003 (68), and<br />
during that time period cocaine was the most frequent<br />
drug of concern (second only to alcohol) (exhibit 3). In<br />
2004, however, the number of calls regarding methamphetamine<br />
(66) exceeded those for cocaine (59).<br />
Cocaine-related mortality data for the Denver PMSA<br />
showed an increase from 68 such deaths in 1996 to<br />
126 in 2001 (exhibit 4). Cocaine-related deaths then<br />
declined slightly in 2002 to 108. Throughout this entire<br />
time period, cocaine-related mortality was higher than<br />
the mortality for any other drug in the area.<br />
Statewide, cocaine deaths climbed from 92 in 1997<br />
(23.6 per million) to 146 in 1999 (36.1 per million).<br />
While they declined to 116 in 2000 (27 per million),<br />
they increased again to 134 in 2001 (30.4 per million)<br />
and to 153 in 2002 (34.1 per million). Data from<br />
2003 show 179 cocaine deaths (39.2 per million), the<br />
highest number and rate in the time period indicated.<br />
Reports from clinicians, researchers, and street outreach<br />
workers around the State corroborate the continuing<br />
cocaine problems reflected in the indicator<br />
data. However, qualitative reports indicate a shift to<br />
methamphetamine among some stimulant users.<br />
Cocaine was the primary drug for 20 percent of all<br />
treatment admissions (excluding alcohol) for the first<br />
6 months of calendar year 2004 (annualized) (exhibit<br />
5). Marijuana and methamphetamine exceeded cocaine<br />
as the primary drug during this time period,<br />
representing 39 and 26 percent of admissions, respectively.<br />
In 2002, cocaine as a primary drug accounted<br />
for 20 percent of all drug admissions, exceeding<br />
methamphetamine (19 percent). In 2003, admissions<br />
with methamphetamine as primary drug (23 percent)<br />
overtook those reporting cocaine (20 percent).<br />
The majority of cocaine clients in treatment had been<br />
using this drug for longer than 3 years. The proportion<br />
of “new” cocaine users entering treatment, defined<br />
as those admitted to treatment within 3 years of<br />
initial cocaine use, remained stable from 1997 (17<br />
percent) through 2004 (18 percent) (exhibit 6). It<br />
Proceedings of the Community Epidemiology Work Group, Vol. II, January 2005
takes an average of 10 years after first use for the<br />
majority of those users with cocaine as their primary<br />
drug to seek treatment (exhibit 7).<br />
The percentages of clients who smoke cocaine declined<br />
steadily from 65 percent in 1997 to 58 percent<br />
in 2001, but they rebounded in 2003 and in 2004,<br />
when smoking represented 63 percent of cocaine admissions<br />
statewide (exhibit 8). The percentages of<br />
clients who inhale cocaine have been steadily increasing<br />
from 19 percent in 1997 to 26 percent in<br />
2001 and 28 percent in 2004.<br />
Demographic data on cocaine admissions, statewide,<br />
for FY 2004 are shown in exhibit 8. Whites accounted<br />
for the largest percentage of cocaine admissions<br />
in 2004 (46 percent) and 2003 (45 percent),<br />
representing a small decline from 2000 (48 percent).<br />
Hispanic cocaine admissions increased dramatically<br />
from 19 percent in 1997 to 29 percent in 2000 and 30<br />
percent in 2004. African-American cocaine admissions<br />
dropped sharply from 33 percent in 1997 to 20<br />
percent in 2001; they then mildly increased in 2003<br />
(24 percent) and then declined in 2004 to 21 percent.<br />
Crack cocaine, however, is fairly well entrenched in<br />
the African-American urban communities. African-<br />
American percentages for all other drugs remain in<br />
single digits, with the exception of marijuana (13<br />
percent).<br />
In 1997, 56 percent of cocaine admissions were<br />
younger than 35; this decreased to 50 percent in 2003<br />
and rebounded to 57 percent in 2004. The majority<br />
(69 percent) of 2004 cocaine admissions were between<br />
the ages of 26 and 45. Nineteen percent of cocaine<br />
admissions in 2004 were younger than 18, and<br />
only 12 percent were older than 45.<br />
Cocaine admissions remain predominately male, with<br />
their proportion growing slightly from 1997 (57 percent<br />
male) to FY 2004 (61 percent). Sixty-nine percent<br />
were admitted to treatment for cocaine dependence,<br />
and 26 percent were admitted for abuse. Thirtyfive<br />
percent of cocaine users indicated they used alcohol<br />
as a secondary drug, and 24 percent used marijuana.<br />
Treatment providers indicated that marijuana<br />
is commonly used with cocaine to decrease the effects<br />
of withdrawal and to increase the effects of the<br />
cocaine.<br />
In Federal FY 2002, 34 percent of those sentenced to<br />
Federal correctional systems in Colorado had drugs<br />
as their primary offense category, compared with 41<br />
percent nationally. Of the 34 percent, powder and<br />
crack cocaine were each involved in 18 percent.<br />
Thirty-one percent were sentenced because of drug<br />
trafficking.<br />
<strong>EPIDEMIOLOGIC</strong> TRENDS IN <strong>DRUG</strong> <strong>ABUSE</strong>—Denver and Colorado<br />
According to the most recent ADAM data for a sample<br />
of Denver arrestees, 35.4 percent of males and<br />
46.5 percent of females had cocaine-positive urine<br />
samples in 2001. These numbers were down slightly<br />
in 2002, with 32.7 percent of males and 43.6 percent<br />
of females testing positive. However, in 2003, 38.3<br />
percent of males and 52.5 percent of females tested<br />
positive for cocaine.<br />
NFLIS data show that cocaine accounted for 49 percent<br />
of all drugs seized by law enforcement and submitted<br />
to a forensic laboratory for analysis in Colorado<br />
in 2003.<br />
According to the National Drug Intelligence Center,<br />
powder cocaine is readily available throughout the<br />
State, and crack cocaine is more available in urban<br />
population centers. In general, Whites prefer powder<br />
cocaine and African-Americans prefer crack. Cocaine<br />
is the drug most often associated with violent crime<br />
in Colorado.<br />
The <strong>ON</strong>DCP reported that the Denver police made<br />
1,234 cocaine arrests per 100,000 city residents between<br />
1996 and 2000. This was more than twice the<br />
national average, and 93 percent of these arrests were<br />
for possession.<br />
The majority of cocaine is Mexican, and it is imported<br />
into Colorado by organized Mexican nationals<br />
or family groups who have connections to gangs on<br />
the west coast. In the last year, two significant drug<br />
organizations began to compete to control the wholesale<br />
supply. They transport cocaine from the Mexican<br />
border or from western States such as California and<br />
Arizona to Denver, using automobiles with hidden<br />
compartments, commercial and cargo airlines, delivery<br />
services, and other mail carriers. Denver serves as<br />
a major distribution center for cocaine for the entire<br />
country, especially the Midwest and east coast States.<br />
Proceeds from cocaine sales are transported to Mexico<br />
or the western States via the same means.<br />
In Colorado, street distribution is controlled by<br />
gangs. There are more than 10,000 gang members in<br />
the Denver area, with an average of 1,500 new members<br />
added each year. According to the Denver DEA<br />
and treatment providers, gangs also control the market<br />
for distribution of cocaine in the southern, northern,<br />
and western slope areas of the State. Gangs are<br />
ubiquitous throughout Colorado, but they are less<br />
dominant in the eastern region, where the population<br />
is much less dense.<br />
In the third quarter of Federal FY 2003 and in the<br />
second quarter of 2004, powder cocaine sold for<br />
$16,000–$19,000 per kilogram and $700–$1,000 per<br />
Proceedings of the Community Epidemiology Work Group, Vol. II, January 2005 67
ounce in the Denver metropolitan area. Crack cocaine<br />
prices have remained relatively stable at $650–$1,000<br />
per ounce, while “rock” prices on the street are $20–<br />
$50 in Denver. Prices are slightly higher outside of<br />
the Denver metropolitan area. Purity is approximately<br />
66 percent throughout the front range and between 41<br />
and 91 percent on the western slope. Treatment providers<br />
stated that crack is fairly rare on the western<br />
slope, and its use remains entrenched in the African-<br />
American communities in southern Colorado.<br />
Overall, Colorado has experienced a decrease in the<br />
wholesale price of powder cocaine because these<br />
users have switched to methamphetamine. Treatment<br />
providers indicate this switch is related to cheaper<br />
prices and a longer lasting “high.” Both drugs are<br />
equally available throughout the State.<br />
Heroin and Other Opiates<br />
Heroin and other opiate use poses a considerable<br />
threat to Colorado, although indicators for both were<br />
mixed. Unweighted data accessed from DAWN Live!<br />
show that heroin ED reports in the first half of 2004<br />
totaled 292, representing 17 percent of illicit drug<br />
reports (exhibit 1).<br />
Opiates other than heroin include hydrocodone, hydromorphone,<br />
codeine, and oxycodone. Unweighted<br />
ED reports of opiates/opioids for Denver in the first<br />
half of 2004 totaled 271; of these, 72 (26.6 percent)<br />
were oxycodone reports and 67 (24.7 percent) involved<br />
hydrocodone.<br />
Hospital discharge data for 1997–2003 combined all<br />
narcotic analgesics, including heroin. These discharges<br />
have been steadily increasing, with the rate<br />
almost doubling in 7 years, from 37 per 100,000 in<br />
1997 to 73 per 100,000 in 2003 (exhibit 2). Treatment<br />
providers indicated a rapid rise in the popularity<br />
of abuse of prescription narcotics such as OxyContin<br />
and hydrocodone, and these data may reflect that.<br />
Heroin/morphine-related mortalities for the Denver<br />
PMSA fluctuated from 34 in 1996, to 79 in 1999, to 66<br />
in 2000, to 77 in 2001, and to 64 in 2002 (exhibit 4).<br />
Statewide, opiate-related deaths increased from 141<br />
(36.2 per million population) in 1997 to 182 (45.9 per<br />
million) in 1998. From this peak, such deaths declined<br />
to 142 (35.2 per million) and 147 (34 per million)<br />
in 1999 and 2000, respectively. However, opiate-related<br />
deaths climbed to 160 (36.3 per million)<br />
in 2001 and 164 (36.5 per million) in 2002. Data for<br />
2003 show that opiate-related deaths decreased<br />
slightly to 152, or 33.3 per million population.<br />
68<br />
<strong>EPIDEMIOLOGIC</strong> TRENDS IN <strong>DRUG</strong> <strong>ABUSE</strong>—Denver and Colorado<br />
Heroin and other narcotic analgesic-related calls to<br />
the RMPDC peaked in 2003 at 22 and declined<br />
slightly to 18 in 2004 (exhibit 3).<br />
According to recent ADAM data for a sample of<br />
Denver arrestees, in 2001, 5.2 percent of males and<br />
2.4 percent of females tested positive for opiates.<br />
However, in 2002 5.3 percent of females and 4 percent<br />
of males tested positive for opiates. In 2003,<br />
male arrestees again showed a slightly higher percentage<br />
of positive heroin urines (6.8 percent) than<br />
female arrestees (6.1 percent).<br />
Among Colorado treatment admissions (excluding<br />
alcohol), the proportion of clients with heroin as their<br />
primary drug of choice has steadily declined (exhibit<br />
5). In 1997, 16 percent of all drug treatment admissions<br />
identified heroin as their primary substance,<br />
while in 2004 only 8.5 percent did so. It should be<br />
noted that while in 2004 the ADAD expanded the<br />
number of DACODS reports by adding driving under<br />
the influence (DUI) clients into the DACODS database,<br />
figures used in this report exclude DUI clients.<br />
Treatment admissions for clients who stated other<br />
opiates as their primary drug have been consistent at<br />
3–4 percent from 1997 to 2004 (exhibit 5).<br />
The proportion of “new” heroin and other opiate users<br />
who entered treatment within 3 years of initial use<br />
rose from 1997 (18 percent) to 2000 (22 percent) and<br />
then declined to 16 percent in 2003 (exhibit 6). There<br />
was a very slight increase in 2004 to 17 percent. The<br />
majority of heroin users in treatment are long-time<br />
users. According to ADAD’s State FY 2004 data, it<br />
takes heroin clients an average of 13 years from first<br />
use before they enter treatment (exhibit 7).<br />
Opiates (heroin and other opiates combined) ranked<br />
low among all four generations of users, from 2 percent<br />
for the Y generation, to 8 percent for the X generation<br />
and seniors, and 12 percent for the Baby<br />
Boomers (exhibit 9).<br />
In FY 2004, all heroin/other opiate users were older<br />
than 18 at the time of admission; 61 percent were<br />
male; and 71 percent lived in urban settings (exhibit 8).<br />
Sixty-nine percent of heroin and other opiate users<br />
were White, 19 percent were Hispanic, and 8 percent<br />
were African-American in FY 2004. Forty-two percent<br />
had achieved a 12th grade education, and 34 percent<br />
had attended college. Wages were the primary source<br />
of income for 45 percent. Twenty-eight percent had no<br />
prior treatment, while 31 percent had three or more<br />
treatment episodes before this admission.<br />
Proceedings of the Community Epidemiology Work Group, Vol. II, January 2005
Fifty-three percent of the heroin/other opiate clients<br />
self-referred into treatment in FY 2004. Eighty-six<br />
percent were dependent upon heroin or other opiates,<br />
and 12 percent received the diagnostic impression of<br />
abuse. Thirty percent reported no use of heroin or<br />
other opiates in the 30 days prior to treatment, while<br />
42 percent used daily. Sixty-two percent injected the<br />
drug, and 29 percent took it orally. Twenty-six percent<br />
of these clients were younger than 18 when they<br />
first tried heroin or other opiates, and 48 percent were<br />
21 or older. Forty-two percent had no secondary<br />
drug, while 25 percent used cocaine as their secondary<br />
drug. Forty-nine percent of clients with a secondary<br />
drug began to use it before the age of 18, and 34<br />
percent began at or after the age of 21.<br />
Treatment providers have reported an increasingly<br />
young population in their early teens who used Oxy-<br />
Contin and any other drug they can obtain, usually<br />
stolen from their parents. Providers also state they are<br />
seeing more polysubstance abuse among clients.<br />
Seven percent of those in Colorado who were sentenced<br />
to Federal facilities were heroin or other opiate<br />
users, and this percentage mirrors the national<br />
percentage for Federal FY 2002. Heroin accounted<br />
for only 6 percent of all items seized by law enforcement<br />
in Colorado and submitted to forensic<br />
laboratories for analysis in 2003.<br />
Mexican black tar and brown powdered heroin are<br />
the most common types available in Colorado. Most<br />
new users are young adults who smoke or snort it.<br />
Mexican drug trafficking organizations transport heroin<br />
into Colorado and serve as the primary wholesale<br />
distributors and frequently as retail sellers who control<br />
the street-level market for heroin. Gang-related<br />
crimes are frequently associated with the sale of heroin.<br />
It is widely available in both urban and rural<br />
settings. While the predominant users are older White<br />
males who live in the lower downtown Denver area,<br />
new suburban users are emerging.<br />
One ounce of Mexican heroin at 40 percent purity<br />
costs $1,000–$3,000. One gram of heroin that is 8–64<br />
percent pure costs $100–$150. Costs in Denver are<br />
slightly lower than in the rest of the State. Heroin can<br />
be obtained in Denver for $440 per one-quarter<br />
ounce. Purity is approximately 53 percent in the<br />
Denver area.<br />
Pharmaceutical diversions of OxyContin and other<br />
narcotic analgesics are increasing, as they provide the<br />
abuser with reliable strength and dosage levels. A $4<br />
prescription dose of OxyContin sells on the street for<br />
$40 or $1 per milligram, 10 times the legal prescription<br />
price. More abusers are using the Internet to<br />
<strong>EPIDEMIOLOGIC</strong> TRENDS IN <strong>DRUG</strong> <strong>ABUSE</strong>—Denver and Colorado<br />
obtain prescription medications. Officials recently<br />
intervened when a physician from southern Colorado<br />
authorized 2,450 prescriptions on the Internet within<br />
a 3-month period without establishing any doctorpatient<br />
relationship. Drug enforcement officials have<br />
found a severe, systemic failure to keep proper records,<br />
report thefts, and maintain controlled substances<br />
in Colorado.<br />
Marijuana<br />
Marijuana indicators are mixed but suggest a high<br />
level of abuse. Marijuana is second to alcohol in the<br />
number of users in Colorado. Unweighted data accessed<br />
from DAWN Live! show that ED reports involving<br />
marijuana totaled nearly 20 percent of illicit<br />
drug reports in the first half of 2004, far below those<br />
for cocaine (exhibit 1). Marijuana-related hospital<br />
discharges increased steadily from 1997 (53 per<br />
100,000) to 2003 (71 per 100,000) (exhibit 2), while<br />
marijuana-related calls to the RMPDC declined from<br />
34 in 2001 to 29 in 2004 (exhibit 3).<br />
Marijuana-related deaths for the Denver PMSA have<br />
been quite small, ranging from 1 in 1996 to a peak of<br />
31 in 2001. Such deaths totaled 5 in 2002.<br />
According to 2001 ADAM data, 40 percent of the<br />
male arrestee sample and 33 percent of the female<br />
arrestee sample had positive marijuana urine screens.<br />
These percentages remained stable in 2002, with 40.3<br />
percent of males and 32.6 percent of females testing<br />
positive, but the proportions increased slightly in<br />
2003 (42.3 percent positives for males and 34.3 percent<br />
positives for females).<br />
Colorado has more treatment admissions for marijuana<br />
(excluding alcohol) than for any other drug<br />
(exhibit 5). The proportions of clients admitted to<br />
treatment with marijuana as their primary drug have<br />
been holding fairly steady since 1997. In 1997, 41<br />
percent of clients were in treatment for primary marijuana<br />
abuse, compared with 39 percent in 2004.<br />
More “new” marijuana users seek treatment within 3<br />
years of first use than for any other drug (exhibit 6).<br />
This finding remained consistent from 1997 (42 percent)<br />
through 2004 (33 percent). Marijuana users take<br />
an average of 7 years from time of first use to first<br />
treatment. This is a shorter timeframe than for any<br />
other drug.<br />
Demographic data show that males accounted for 73<br />
percent of treatment admissions in FY 2004 (exhibit<br />
8), maintaining the historical male-to-female ratio of<br />
approximately 3 to 1 since 1997. Forty-two percent<br />
of marijuana treatment admissions were younger than<br />
Proceedings of the Community Epidemiology Work Group, Vol. II, January 2005 69
18 at the time of admission to treatment. This figure<br />
has been fluctuating between 35 and 45 percent since<br />
1997. Seventy percent of treatment admissions with<br />
marijuana as their primary drug were living in urban<br />
settings. Race proportions remain relatively stable. In<br />
2004, 53 percent were White, 29 percent were Hispanic,<br />
and 13 percent were African-American.<br />
Whites represented 56 percent in 2003, Hispanics<br />
accounted for 27 percent, and African-Americans<br />
represented 11 percent. Sixty-four percent used tobacco<br />
products daily. Fifty-five percent had no prior<br />
treatment episodes, while 27 percent had one. Sixtyseven<br />
percent were unemployed, and 62 percent were<br />
living in a dependent setting; the majority were living<br />
with their parents. Only 9 percent self-referred to<br />
treatment, while 21 percent were referred by social<br />
services and 49 percent were referred by the non-DUI<br />
criminal justice system.<br />
Forty-seven percent of the marijuana admissions<br />
were considered abusers, as shown in exhibit 8, while<br />
40 percent were dependent on marijuana. The route<br />
of administration for 96 percent was smoking. Ninety<br />
percent of all clients stated they started using marijuana<br />
before the age of 18. Thirty-three percent had<br />
no secondary drug, while 45 percent used alcohol and<br />
11 percent used methamphetamine as their secondary<br />
drug of choice. Of those with a secondary drug, 78<br />
percent started using it before the age of 18.<br />
Of those individuals sentenced to Federal facilities in<br />
Colorado, 17 percent had use of marijuana as their<br />
primary offense, which is lower than the national<br />
percentage of 29.<br />
Cannabis represented 16 percent of all items seized<br />
by law enforcement and submitted to forensic laboratories<br />
for analysis in 2003. Both Mexican imported<br />
and locally grown marijuana is readily available<br />
statewide.<br />
The marijuana used in Colorado is primarily produced<br />
in and imported from Mexico. A small portion<br />
is grown in Colorado or other western States, particularly<br />
California. It is distributed primarily by Mexican<br />
drug trafficking organizations and criminal<br />
groups at the wholesale level and by Hispanic and<br />
African-American street gangs at the retail level.<br />
Caucasian criminal groups and local independent<br />
dealers are the primary distributors of the marijuana<br />
and sinsemilla produced in Colorado.<br />
BC Bud, a Canadian import with a high level of tetrahydrocannabinol<br />
(THC), was available only in limited<br />
quantities and relatively hard to obtain in Colorado<br />
until 2003. Since then, an increase in the availability<br />
of BC Bud has contributed to an increased<br />
70<br />
<strong>EPIDEMIOLOGIC</strong> TRENDS IN <strong>DRUG</strong> <strong>ABUSE</strong>—Denver and Colorado<br />
THC level in both the Denver and Boulder areas. BC<br />
Bud sells for $700–$1,000 per ounce and $3,200–<br />
$4,500 per pound. On the street, BC Bud costs $10<br />
per joint.<br />
Locally produced sinsemilla sold for $1,000–$3,000<br />
per ounce and $50–$200 per gram in 2002. Domestic<br />
marijuana grown indoors is preferred over Mexican<br />
grown marijuana and sells for $1,000–$3,000 per<br />
pound and $200–$300 per ounce. DEA officials report<br />
grow operations are becoming increasingly sophisticated<br />
and technical. Outdoor marijuana is most<br />
likely a product of eastern Colorado.<br />
Prices of marijuana are slightly cheaper in Colorado<br />
than in surrounding states. Trafficking on the western<br />
slope is dominated by Hispanics importing it into<br />
Colorado from Mexico. Officials are noticing more<br />
individual Mexican nationals independent of the large<br />
drug organizations trafficking marijuana statewide.<br />
Treatment providers almost uniformly indicated that<br />
marijuana use is socially accepted in their areas and<br />
that the perception of risk associated with marijuana<br />
use is declining. Treatment providers felt this decline<br />
is related to national media coverage of marijuana as<br />
a medicinal drug and to a high frequency of parental<br />
use of marijuana.<br />
Methamphetamine<br />
Most indicators for methamphetamine have increased<br />
over the past few years, and this drug is a rapidly<br />
expanding social problem for Colorado.<br />
The unweighted data accessed from DAWN Live!<br />
show that reports involving methamphetamine totaled<br />
155 in the first half of 2004, representing 9.2 percent of<br />
the illicit drug reports (exhibit 1).<br />
Methamphetamine was not broken out from other<br />
stimulants for hospital discharge data, but overall<br />
amphetamine-related hospital discharges have increased<br />
since 1999 from 16 per 100,000 to 40 per<br />
100,000 in 2003 (exhibit 2).<br />
Statewide, the number of methamphetamine-related<br />
calls to the RMPDC has tripled from 20 in 2001 to 66<br />
in 2004 (exhibit 3).<br />
Methamphetamine steadily increased in mortality<br />
mentions from 1996 (n=3) to 2002 (exhibit 4). In<br />
1999, there were 8 mentions, compared with 10 in<br />
2000, 19 in 2001, and 17 in 2002. However, amphetamine<br />
death mentions increased only slightly<br />
from five in 1997 to eight in 2001. Though amphetamine-related<br />
deaths in Colorado are far fewer<br />
Proceedings of the Community Epidemiology Work Group, Vol. II, January 2005
than those for opiates or cocaine, the number has<br />
increased sharply from only 20 between 1996 and<br />
1999 to 37 between 2000 and 2003 (an 85-percent<br />
increase).<br />
Colorado treatment providers report that methamphetamine<br />
is the most popular illegal drug of choice,<br />
and it is frequently used in combination with alcohol,<br />
marijuana, and cocaine. It is readily available, inexpensive,<br />
and, at times, free. Potency is reported to be<br />
good. Providers are seeing an increasing problem<br />
with methamphetamine use statewide, and other amphetamine<br />
use has dropped in popularity.<br />
According to ADAM data, only a small percentage of<br />
positive methamphetamine urine screens were reported<br />
in 2001: 3.4 percent of the male arrestee sample<br />
and 4.3 percent of the female arrestee sample<br />
tested positive for the drug. These figures increased<br />
slightly for males in 2002 (3.8 percent) and slightly<br />
more for females (6.6 percent). Again, only small<br />
changes were noted in 2003, with 4.7 percent of<br />
males and 5 percent of females testing positive for<br />
methamphetamine.<br />
In Colorado, treatment admissions for clients using<br />
methamphetamine as their primary drug have risen<br />
dramatically. In 2004, methamphetamine was second<br />
only to marijuana in the number of treatment admissions<br />
(excluding alcohol) (exhibit 5). In 1997, there<br />
were 1,081 admissions for methamphetamine. This<br />
number has consistently increased each year since<br />
then to 3,300 in 2004.<br />
The percentage of “new” users who seek treatment<br />
for methamphetamine within 3 years of initial use<br />
does not reflect this steady rise in methamphetamine<br />
treatment admissions. “New” users represented 34<br />
percent in 1997, 22 percent in 2001, and 24 percent<br />
in 2004 (exhibit 6). According to State FY 2004 data,<br />
methamphetamine users take an average of 8.5 years<br />
from first use to first treatment (exhibit 7).<br />
A comparison of 2002 “new” methamphetamine users<br />
(i.e., entering treatment within the first 3 years of<br />
use, n=531) to “old” methamphetamine users (i.e.,<br />
entering treatment after 4 or more years of use,<br />
n=2,022) shows dramatic differences between these<br />
two groups. Demographically, the new users are<br />
more often female (53.3 percent) than old users (44.6<br />
percent) and less often White/non-Hispanic (77 percent)<br />
than old users (83.2 percent). Also, somewhat<br />
expectedly, new users have a higher proportion of<br />
those 25 and younger (58.2 percent) as compared to<br />
old users (only 27.3 percent). Accordingly, new users<br />
are much more likely to have never been married<br />
(63.3 percent) than old users (44.7 percent). As to<br />
<strong>EPIDEMIOLOGIC</strong> TRENDS IN <strong>DRUG</strong> <strong>ABUSE</strong>—Denver and Colorado<br />
employment, old users are somewhat more likely to<br />
be employed full or part-time (36.6 percent) than new<br />
users (30.1 percent).<br />
Looking at “severity” data, old users are much more<br />
likely to be methamphetamine injectors (33.7 percent)<br />
than new users (15.4 percent), while new users<br />
report a higher proportion of smokers (67 percent)<br />
than the old user group (48.1 percent). Also, old users<br />
are more likely to have a diagnosis of drug dependence<br />
(28.6 percent) than new users (23.2 percent).<br />
Interestingly, however, new users report a higher<br />
proportion of concurrent mental health problems<br />
(31.1 percent) than their old user counterparts (27.4<br />
percent). Both new and old users averaged one arrest<br />
in the 2 years prior to treatment admission, while old<br />
users averaged seven prior lifetime treatment episodes<br />
compared with two among new users. Also,<br />
about the same proportion of old and new users (23<br />
percent and 20 percent, respectively) reside in the<br />
Denver metropolitan area. Similarly, a like proportion<br />
of old and new users live on the western slope of<br />
Colorado (16 percent and 15 percent, respectively).<br />
Methamphetamine was combined with all other<br />
stimulants in the generational snapshot of treatment.<br />
Both the X generation and the Baby Boomers use<br />
stimulants more than the Y generation or seniors, at<br />
37 percent and 27 percent, respectively (exhibit 9).<br />
During the first 6 months of 2004, few adolescents (5<br />
percent) younger than 18 were in treatment for<br />
methamphetamine as their primary drug (exhibit 8).<br />
The majority of those in treatment were between 18<br />
and 35 years of age.<br />
In methamphetamine treatment admission data for<br />
both 2003 and 2004, there is little gender differentiation,<br />
with female users being equal in number to male<br />
users. Similarly, methamphetamine use is found in<br />
both urban (61 percent) and rural (39 percent) areas<br />
of Colorado. Treatment providers stated they are seeing<br />
an increase in methamphetamine use in both rural<br />
and urban areas and an increase in the social and<br />
community problems related to this use.<br />
Whites dominated among methamphetamine admissions<br />
in 2004 (83 percent) in Colorado (exhibit 8).<br />
Few Hispanics (12 percent) and even fewer African-<br />
Americans (2 percent) use methamphetamine as their<br />
primary drug. However, treatment providers have<br />
indicated that Hispanics, who have traditionally been<br />
involved in the trafficking of methamphetamine, are<br />
beginning to use it in greater numbers. Fifty percent<br />
of methamphetamine users were referred to treatment<br />
by the non-DUI criminal justice system, and 21 percent<br />
were referred by social services.<br />
Proceedings of the Community Epidemiology Work Group, Vol. II, January 2005 71
Injecting had been the most common route of administration<br />
for methamphetamine. However, among<br />
treatment admissions, the injection drug user (IDU)<br />
proportion declined from 1997 (32.6 percent) to 2003<br />
(23 percent), while smoking became increasingly<br />
common in the last 7 years. In 2003, nearly 61 percent<br />
of methamphetamine treatment admissions<br />
smoked the drug, compared with only 29.1 percent in<br />
1997. Sixty-three percent smoked it, while, as shown<br />
in exhibit 8, 22 percent injected it in 2004. In 2004,<br />
41 percent of clients began to use methamphetamine<br />
before the age of 18. Most (72 percent) use a secondary<br />
drug in addition to methamphetamine, usually<br />
marijuana (36 percent), alcohol (21 percent), or cocaine<br />
(10 percent). Seventy-two percent of those using<br />
a secondary drug initiated use of this secondary<br />
drug before the age of 18.<br />
Federal sentencing data for Federal FY 2002 show that<br />
methamphetamine was the primary substance for 34<br />
percent of the drug convictions. This is almost double<br />
the percentages of offenders sentenced because of cocaine<br />
(powder and crack) and marijuana and four times<br />
greater than those sentenced for heroin.<br />
The DEA describes widespread methamphetamine<br />
availability, with a majority of the drug originating<br />
from Mexico or from large-scale laboratories in California.<br />
However, methamphetamine lab seizures in<br />
Colorado increased significantly from around 25 in<br />
1997 to 464 in 2002. These laboratories, generally<br />
capable of manufacturing an ounce or less per<br />
“cook,” varied from being primitive to quite sophisticated.<br />
The ephedrine reduction method remains the<br />
primary means of manufacturing methamphetamine<br />
in the area. In spite of law enforcement pressure,<br />
there has been an increase in the number of small,<br />
local methamphetamine labs with the occasional use<br />
of trucks for mobile labs.<br />
Most lab operators are able to get the precursor<br />
chemicals from legitimate businesses (e.g., discount<br />
stores, drug stores, chemical supply companies, etc.).<br />
Treatment providers report that the current practice is<br />
for separate individuals or groups to each acquire one<br />
of the key ingredients and then deliver it to the<br />
“cook,” thereby decreasing the risk involved when<br />
one party obtains all the ingredients.<br />
The DEA also reports an increase in the number of<br />
Hispanic males marrying Native American women<br />
on reservations, with the intent of establishing their<br />
kitchens and supply depots with immunity from law<br />
enforcement.<br />
A cocaine and methamphetamine trafficking organization<br />
has been transporting drugs from Phoenix to<br />
72<br />
<strong>EPIDEMIOLOGIC</strong> TRENDS IN <strong>DRUG</strong> <strong>ABUSE</strong>—Denver and Colorado<br />
Denver. Methamphetamine from this organization<br />
has purity levels of 95 percent. An organization on<br />
the western slope employs a number of drivers who<br />
transport anywhere from 2–10 pounds from Sinaloa,<br />
Mexico, or California. Methamphetamine can be obtained<br />
for $500–$1,500 per ounce, $5,500–$5,600 per<br />
one-half pound, and $13,500 per pound in the Denver<br />
area. In southern Colorado, prices are $600 per ounce<br />
and $13,000 per pound. On the western slope, it sells<br />
for $1,000–$1,200 per ounce. Purity ranges from 11<br />
to 92 percent. In Denver “ice,” a smokeable form of<br />
methamphetamine that looks like rock candy or rock<br />
salt, is nearly 100 percent pure and widely available.<br />
Street prices for methamphetamine in Denver are<br />
relatively stable at $80–$125 per gram.<br />
Other Amphetamines and Stimulants<br />
Indicators for these drugs in Colorado are scant. Reported<br />
use of other amphetamines and stimulants (excluding<br />
cocaine and methamphetamine) is only a fraction<br />
of reported use of cocaine or methamphetamine.<br />
The unweighted data accessed from DAWN Live! for<br />
the first half of 2004 show 115 emergency department<br />
reports involving amphetamines (exhibit 1).<br />
There were four calls to the RMPDC for amphetamines<br />
in 2004 (exhibit 3).<br />
In 1997, there were 52 clients (0.7 percent of admissions<br />
excluding alcohol) in treatment for using some<br />
other amphetamine or stimulant as their primary<br />
drug, the same number as in 2004, when these clients<br />
accounted for 0.4 percent of illicit drug admissions<br />
(exhibit 5).<br />
In 2000 there were 9 fatalities related to other amphetamines<br />
or stimulants, compared with 8 in 2001<br />
and 13 in 2002 (exhibit 4).<br />
Barbiturates, Sedatives, and Tranquilizers<br />
There are few indicators for the use of these drugs in<br />
Colorado. There were 145 emergency department<br />
reports involving benzodiazepines in the first half of<br />
2004, according to the unweighted data accessed<br />
from DAWN Live!.<br />
Statewide in 2004, there were 76 admissions to<br />
treatment for clients indicating barbiturates, sedatives,<br />
or tranquilizers as their primary drug of choice<br />
(exhibit 5). Sixty-three percent were female, and 85<br />
percent were adults (older than 18) (exhibit 8). Fiftyfive<br />
percent were urban, and 85 percent were White.<br />
When comparing this group to all other clients who<br />
reported other primary drugs, this group used daily<br />
tobacco the least and had the highest percentage of<br />
Proceedings of the Community Epidemiology Work Group, Vol. II, January 2005
married clients, unemployment (the category “unemployment”<br />
includes those out of the workforce, such<br />
as students, homemakers, persons with disabilities,<br />
etc.), slight to moderate socialization issues or concerns,<br />
mental health problems, and visits to medical<br />
and psychiatric emergency rooms.<br />
As shown in exhibit 8, 68 percent administered their<br />
drug orally, 21 percent smoked it, 3 percent inhaled<br />
it, and 3 percent injected it. Fifty percent were<br />
younger than 18 when they began to use this category<br />
of drugs, and 45 percent were 21 or older. Sixty-six<br />
percent used a secondary drug, such as alcohol (26<br />
percent), opiates (13 percent), and marijuana (11 percent),<br />
and 72 percent of those with a secondary drug<br />
were younger than 18 when they first used it.<br />
These drugs are frequently obtained as prescription<br />
medications and fall into the diverted pharmaceutical<br />
class as well. Local independent dealers and Internet<br />
services are the principal distributors of diverted<br />
pharmaceuticals.<br />
Club Drugs<br />
Club drugs are a group of synthetic drugs commonly<br />
associated with all night dance clubs called “raves.”<br />
These drugs include methylenedioxymethamphetamine<br />
(MDMA, or ecstasy), gamma hydroxybutyrate (GHB),<br />
Rohypnol (“roofies”), and ketamine (“Special K”).<br />
Information on use of these drugs in Colorado, while<br />
still limited, is expanding. ADAD added club drugs to<br />
the enhanced DACODS data set in July 2002. Also,<br />
there are currently two sources of institutional indicator<br />
data that include the club drugs (DAWN and<br />
RMPDC). In addition, ADAD has worked with OMNI<br />
Research and Training, a Denver-based firm, to add<br />
club drug questions to the Colorado Youth Survey.<br />
MDMA, originally developed as an appetite suppressant,<br />
is chemically similar to the stimulant amphetamine<br />
and the hallucinogen mescaline and thus produces<br />
both stimulant and psychedelic effects. MDMA<br />
is readily obtainable at raves, nightclubs, strip clubs,<br />
or private parties. The traffickers are typically White<br />
and in their twenties or early thirties. They obtain<br />
their MDMA from Nevada or California, with source<br />
connections in Europe, and target young adults and<br />
adolescents as users. Mexican trafficking organizations<br />
are making inroads in the Colorado MDMA<br />
market. The DEA reports one tablet or capsule costs<br />
$15 to $25, with larger quantities selling for $8 to<br />
$16 per tablet.<br />
GHB is a central nervous system depressant that can<br />
sedate the body, and at higher doses it can slow<br />
<strong>EPIDEMIOLOGIC</strong> TRENDS IN <strong>DRUG</strong> <strong>ABUSE</strong>—Denver and Colorado<br />
breathing and heart rate dangerously. It can be produced<br />
in clear liquid, white powder, tablet, and capsule<br />
forms, and is often used in combination with<br />
alcohol, making it even more dangerous. The DEA<br />
reports that the majority of GHB customers are White<br />
and in their twenties or thirties. Past DEA reports<br />
have placed the GHB price at $5–$10 per dosage unit<br />
(i.e., one bottle capful).<br />
Rohypnol (“roofies”) is a benzodiazepine sedative<br />
approved as a treatment for insomnia in more than 60<br />
countries, but not in the United States. Rohypnol is<br />
tasteless, odorless, and dissolves easily in carbonated<br />
beverages, and its effects are aggravated by alcohol<br />
use. There does not appear to be widespread use of<br />
Rohypnol among either the general population or the<br />
rave scene in Colorado. What use there is occurs in<br />
the adolescent to mid-thirties age range.<br />
Ketamine, often called Special K on the street, is an<br />
injectable anesthetic that has been approved for both<br />
human and animal use in medical settings. However,<br />
about 90 percent of the ketamine legally sold today is<br />
intended for veterinary use. Produced in liquid form or<br />
white powder, it can be injected, inhaled, or swallowed.<br />
Similar to phencyclidine (PCP) in its effects, it<br />
can bring about dream-like states and hallucinations.<br />
Club drugs are primarily used by young adults and<br />
adolescents, and either these clients are not coming to<br />
the attention of indicator organizations or the number<br />
of users is still quite small. Certain club drugs are<br />
also used as “date rape” drugs, and their use in this<br />
manner may be underreported.<br />
Unweighted emergency department data for club<br />
drugs, accessed from DAWN Live!, show that 31<br />
reports in the first half of 2004 involved MDMA,<br />
accounting for 1.8 percent of illicit drug reports (exhibit<br />
1). There were two reports involving GHB. In<br />
2003, there were 37 treatment admissions for clients<br />
with club drugs as their primary substance; in 2004,<br />
there were 52 treatment admissions statewide (exhibit<br />
5). For 2004 in its entirety, there were 39 calls to the<br />
RMPDC related to club drugs (exhibit 4).<br />
Alcohol<br />
Alcohol continues to be the most abused substance in<br />
the State. Colorado ranks 19 percent higher than the<br />
national average and fifth in the Nation in per capita<br />
consumption of beverage alcohol. Alcohol use disorders<br />
are medically based disorders related to abuse of<br />
or dependence on alcohol.<br />
Unweighted data accessed from DAWN Live! for the<br />
first half of 2004 show 954 ED reports involving<br />
Proceedings of the Community Epidemiology Work Group, Vol. II, January 2005 73
alcohol; 651 involved alcohol-in-combination reports<br />
and 303 represented alcohol-only reports for patients<br />
younger than 21.<br />
During the first half of calendar year 2004, 40 percent<br />
of all clients admitted to treatment in Colorado<br />
stated their primary drug of abuse was alcohol (exhibit<br />
10). Seven percent of these clients were younger<br />
than 18. Of those age 18 or older, 64 percent began to<br />
use alcohol before age 18. During State FY 2004<br />
(July 1, 2003, through June 30, 2004), ADAD reported<br />
44,514 detoxification discharges and 22,372<br />
discharges from the Drinking Driver education and<br />
therapy program. Untreated alcoholism accounts for<br />
some of Colorado’s greatest concerns, such as poverty,<br />
violent crimes, homelessness, domestic violence,<br />
vehicular crashes, overcrowded jails, and overcrowded<br />
emergency and foster care systems. Each<br />
year, Colorado spends $4.4 billion in costs related to<br />
untreated substance abuse, adding a substantial financial<br />
burden to taxes and already stressed governmental<br />
resources.<br />
Even though laws exist that prohibit selling alcoholic<br />
beverages to minors, alcohol is the primary drug of<br />
choice for adolescents in Colorado. It is readily available<br />
and inexpensive. Purveyors apparently target<br />
younger age groups. Two recent marketing trends are<br />
“jello shots,” a mixture of alcohol with fruit-flavored<br />
gelatin, and sweet soda-pop flavored alcoholic beverages.<br />
Colorado’s Youth Survey noted that almost 50 percent<br />
of students in grades 9–12 during 2003 currently<br />
were using alcohol, and 80 percent had one or more<br />
drinks of alcohol in their lifetime.<br />
Abuse of alcohol at an early age is frequently a precursor<br />
to use and abuse of illegal substances. Recently,<br />
deaths related to binge drinking on college<br />
campuses have brought national notoriety to Colorado,<br />
with five confirmed deaths of college-age individuals<br />
from alcohol poisoning.<br />
Moderate use of alcohol among adults is culturally<br />
acceptable, and denial of abuse is particularly difficult<br />
to overcome. The average treatment client in Colorado<br />
with alcohol as a primary drug uses or abuses it for 16<br />
years before seeking treatment. For detoxification clients,<br />
that time period expands to 20 years.<br />
In 2003, the Colorado State Patrol, which deals with<br />
approximately 30 percent of all vehicular crashes in<br />
the State, reported 2,161 vehicular crashes directly<br />
caused by individuals driving under the influence of<br />
alcohol. FARS data indicated in 2003 that 39 percent<br />
74<br />
<strong>EPIDEMIOLOGIC</strong> TRENDS IN <strong>DRUG</strong> <strong>ABUSE</strong>—Denver and Colorado<br />
(246) of the 632 individuals killed in Colorado in<br />
vehicular crashes involved alcohol.<br />
The CDPHE reported 511 alcohol-induced deaths<br />
unrelated to motor vehicular accidents.<br />
The number of alcohol-related calls statewide to the<br />
RMPDC increased markedly from 110 in 2001 to 223<br />
in 2004 (exhibit 3).<br />
Alcohol-related mortality data for the Denver PMSA<br />
also increased steadily from 47 in 1996 to 86 in 2002<br />
(exhibit 4).<br />
Of the four “generations” of Colorado citizens (the Y<br />
generation, the X generation, Baby Boomers, and<br />
Seniors), sedatives and tranquilizers (including alcohol<br />
and marijuana) are the drugs of choice for Baby<br />
Boomers (exhibit 9). The X generation is equally<br />
split between sedatives and tranquilizers and stimulants<br />
as their drugs of choice.<br />
Tobacco<br />
Tobacco use is the leading cause of preventable death<br />
and disability in the State, and it is one of Colorado’s<br />
most serious public health problems. Tobacco use is<br />
responsible for more than 4,200 deaths and development<br />
of 130,000 tobacco-related illnesses in adults<br />
annually. Smoking tobacco causes 30 percent of all<br />
cancer deaths, 21 percent of coronary heart diseaserelated<br />
deaths, and 18 percent of stroke deaths. In<br />
Colorado, 193,000 children are exposed to secondhand<br />
smoke at home, resulting in asthma and respiratory<br />
illnesses.<br />
Annual health care costs directly related to smoking<br />
exceed $1 billion (or $259 per capita) in the State.<br />
Every Colorado household incurs more than $511 per<br />
year in State and Federal taxes to pay for smokingrelated<br />
health care costs.<br />
Approximately 630,000 (19 percent) of all Colorado<br />
adults use tobacco products, compared to the 23 percent<br />
nationwide average. Sixty-eight percent of clients<br />
who received substance abuse treatment and/or<br />
detoxification services in State FY 2004 used tobacco<br />
products daily.<br />
Laws enacted in Colorado prohibit the sale of tobacco<br />
products to adolescents (those younger than<br />
18). In spite of that, the Youth Risk Behavior Survey<br />
identified 27 percent of students in grades 9–12 as<br />
current cigarette smokers. Adolescents who smoke<br />
are more likely to smoke as adults and be at risk for<br />
tobacco-related illnesses.<br />
Proceedings of the Community Epidemiology Work Group, Vol. II, January 2005
The sale of tobacco products is monitored by Colorado’s<br />
Department of Revenue, Tobacco Enforcement<br />
Division, and tobacco prevention efforts fall<br />
primarily under the purview of the Department of<br />
Public Health and Environment.<br />
INFECTIOUS DISEASES RELATED TO SUBSTANCE <strong>ABUSE</strong><br />
Of the 8,270 AIDS cases reported in Colorado<br />
through September 30, 2004, 9.3 percent were classified<br />
as IDUs, and 10.9 percent were classified as homosexual<br />
or bisexual males and IDUs (exhibit 11).<br />
CORRECTI<strong>ON</strong>S: THE HIDDEN POPULATI<strong>ON</strong><br />
The Colorado Department of Corrections reports annually<br />
on new court commitments and parole populations.<br />
Unfortunately, data for substance abusers are<br />
not broken out by primary drug of choice. However,<br />
this population is large enough (20,144 for the adult<br />
population as of December 2004) that to exclude it<br />
would mean giving a skewed picture of Colorado’s<br />
substance abuse problem. Seventy-seven percent of<br />
the prison population on June 30, 2003, were substance<br />
abusers. The total inmate population at that<br />
time was 15,365, so 11,831 were substance abusers.<br />
There were 5,276 new court commitments during<br />
State FY 2003. Eighty-two percent of new court<br />
commitments were identified as substance abusers.<br />
Ninety percent of the general adult inmate population<br />
were male. Demographic characteristics for sub-<br />
<strong>EPIDEMIOLOGIC</strong> TRENDS IN <strong>DRUG</strong> <strong>ABUSE</strong>—Denver and Colorado<br />
stance abusers and non-abusers were compared. This<br />
comparison indicated that substance abusers were<br />
less likely to be formally married, and more likely to<br />
be Latino, common-law married, and younger.<br />
Substance abusers had significantly more crimes on<br />
their current incarceration than non-abusers, and they<br />
averaged six times as many drug crimes as nonabusers.<br />
Substance abusers were more likely to have<br />
had a prior correctional incarceration, and they had<br />
more serious criminal histories than non-abusers.<br />
Substance abusers were less likely to be identified as<br />
sex offenders, and they were less likely to have<br />
medical needs than non-abusers. Female offenders<br />
were identified as having higher treatment needs<br />
overall than males. Substance abusers had 3 times as<br />
many drug-related crimes as non-abusers.<br />
Substance abusers represented 85 percent of the parole<br />
returns during State FY 2003. Parolees are returned<br />
to the correctional system either for a parole<br />
revocation or a new crime. Twenty-two percent of the<br />
returned substance abusers had committed a new<br />
crime while on parole.<br />
ACKNOWLEDGEMENTS<br />
Acknowledgement: All ADAD treatment data for this<br />
report were run by Randall Deyle and Troy Evatt of<br />
the Evaluation and Information Services Section of<br />
ADAD.<br />
For inquiries concerning this report, please contact Nancy E. Brace, R.N., M.A., Evaluation and Information Director, Alcohol and Drug Abuse<br />
Division, Colorado Department of Human Services, 4055 South Lowell Boulevard, Denver, CO 80236-3120, Phone: 303-866-7502, Fax: 303-<br />
866-7481, E-mail: nancy.brace@state.co.us.<br />
Proceedings of the Community Epidemiology Work Group, Vol. II, January 2005 75
76<br />
<strong>EPIDEMIOLOGIC</strong> TRENDS IN <strong>DRUG</strong> <strong>ABUSE</strong>—Denver and Colorado<br />
Exhibit 1. Illicit Drug Reports (Excluding Alcohol) in Denver EDs by Number and Percent (Unweighted 1 ):<br />
January–June 2004<br />
Drug Number Percent<br />
Cocaine 699 41.4<br />
Heroin 292 17.3<br />
Marijuana 334 19.8<br />
Amphetamine 115 6.8<br />
Methamphetamine 155 9.2<br />
MDMA 31 1.8<br />
Inhalants 29 1.7<br />
Other 2 32 1.9<br />
Total 1,687 99.9<br />
1 The unweighted data are from 8–9 Denver EDs reporting to DAWN. All DAWN cases are reviewed for quality control. Based on<br />
this review, cases may be corrected or deleted, and, therefore, are subject to change.<br />
2 Includes GHB (2), LSD (1), PCP (5), miscellaneous hallucinogens (17), and drug combinations (11).<br />
SOURCE: DAWN Live!, OAS, SAMHSA, updated 12/13/2004<br />
Exhibit 2. Drug-Related Hospital Discharges Per 100,000 Population in Colorado for Selected Drugs:<br />
1997–2003<br />
Drug 1997 1998 1999 2000 2001 2002 2003<br />
Alcohol NA 1 17,154 18,577 18,744 20,644 21,433 23,750<br />
Rate/100K 418.0 440.6 432.3 464.3 474.02 518.0<br />
Amphetamines 959 815 682 942 1,161 1,463 1,814<br />
Rate/100K 24.0 20.0 16.2 21.7 26.1 32.3 39.6<br />
Cocaine 2,245 2,492 2,517 2,732 2,787 3,305 3,658<br />
Rate/100K 56.1 60.7 59.7 63.0 63.0 73.1 80.3<br />
Marijuana 2,118 2,227 2,204 2,455 2,755 3,016 3,246<br />
Rate/100K 53.0 54.3 52.3 56.6 62.0 66.7 71.0<br />
Narcotic Analgesics<br />
1,458 1,566 1,639 2,053 2,237 2,605 3,368<br />
Rate/100K 36.5 38.2 39.0 47.3 50.3 57.6 73.4<br />
Population 3,995,923 4,102,491 4,215,984 4,335,540 4,446,529 4,521,484 4,586,455<br />
1 NA=Data not available.<br />
SOURCE: CDPHE<br />
Exhibit 3. Number of Drug-Related Calls to the Rocky Mountain Poison Control Center: 2001–2004<br />
Drug 2001 1 2002 2003 2004<br />
Alcohol 110 149 150 223<br />
Cocaine/crack 59 66 68 59<br />
Heroin/morphine 19 16 22 18<br />
Marijuana 34 37 36 29<br />
Methamphetamine 20 39 39 66<br />
Other Stimulants Amphetamines 3 3 6 4<br />
Club Drugs 30 55 40 39<br />
Inhalants 4 16 10 4<br />
1<br />
Data for years prior to 2001 were unavailable.<br />
SOURCE: RMPDC<br />
Proceedings of the Community Epidemiology Work Group, Vol. II, January 2005
<strong>EPIDEMIOLOGIC</strong> TRENDS IN <strong>DRUG</strong> <strong>ABUSE</strong>—Denver and Colorado<br />
Exhibit 4. Drug-Related Mortality Data for the Denver PMSA: 1996–2002 1<br />
Drug 1996 1997 1998 1999 2000 2001 2002<br />
Alcohol 47 49 61 74 75 99 86<br />
Cocaine/Crack 68 56 66 82 80 126 108<br />
Heroin/Morphine 34 53 51 79 66 77 64<br />
Marijuana 1 4 3 20 20 31 5<br />
Methamphetamine 3 6 3 8 10 19 17<br />
Other Stimulants/<br />
Amphetamines<br />
2 5 3 5 9 8 13<br />
Club Drugs – – – – 2 4 2<br />
Inhalants – 1 2 – 1 – 1<br />
1 Data for 2003 and 2004 were not unavailable.<br />
SOURCE: DAWN, OAS, SAMHSA<br />
Exhibit 5. Numbers and Percentages of Treatment Admissions by Drug Type, Excluding Alcohol: 1997–2004<br />
Drug 1997 1998 1999 2000 2001 2002 2003 2004 1<br />
Heroin N 1,200 1,418 1,585 1,577 1,482 1,415 1,640 1,090<br />
(%) (15.7) (14.4) 16.3) (16.3) (14.7) (13.1) (14.0) (8.5)<br />
Non-Rx Methadone N 4 15 15 16 9 17 15 28<br />
(%) (0.1) (0.2) 0.2) 0.2) (0.1) (0.2) (0.1) (0.2)<br />
Other Opiates N 195 230 274 304 386 394 519 510<br />
(%) (2.6) (2.3) (2.8) (3.1) (3.8) (3.6) (4.4) (4.0)<br />
Methamphetamine N 1,081 1,436 1,214 1,314 1,659 2,070 2,744 3,300<br />
(%) (14.2) (14.6) (12.5) (13.6) (16.5) (19.2) (23.3) (25.7)<br />
Other Amphetamines, N 52 61 89 107 91 104 78 52<br />
Stimulants (%) (0.7) (0.6) (0.9) (1.1) (0.9) (1.0) (0.7) (0.4)<br />
Cocaine N 1,797 2,309 2,099 1,916 1,888 2,193 2,330 2,614<br />
(%) (23.6) (23.5) (21.6) (19.8) (18.8) (20.3) (19.8) (20.4)<br />
Marijuana N 3,152 4,126 4,061 4,135 4,248 4,343 4,159 4,988<br />
(%) (41.3) (42.0) (41.8) (42.8) (42.3) (40.2) (35.4) (38.9)<br />
Hallucinogen N 40 56 68 72 71 38 23 22<br />
(%) (0.5) (0.6) (0.7) (0.7) (0.7) (0.4) (0.2) (0.2)<br />
PCP N 0 0 4 5 2 5 8 6<br />
(%) (0.0) (0.0) (0.0) (0.1) (0.0) (0.0) (0.1) (0.0)<br />
Barbiturates N 7 11 15 5 6 20 14 14<br />
(%) (0.1) (0.1) (0.2) (0.1) (0.1) (0.2) (0.1) (0.1)<br />
Sedatives N 4 17 16 21 13 89 63 16<br />
(%) (0.1) (0.2) (0.2) (0.2) (0.1) (0.8) (0.5) (0.1)<br />
Tranquilizers N 37 40 40 38 44 49 52 46<br />
(%) (0.5) (0.4) (0.4) (0.4) (0.4) (0.5) (0.4) (0.4)<br />
Inhalants N 28 50 28 26 31 21 20 28<br />
(%) (0.4) (0.5) (0.3) (0.3) (0.3) (0.2) (0.2) (0.2)<br />
Club Drugs N NA NA NA NA NA 12 37 52<br />
(%) (NA) (NA) (NA) (NA) (NA) (0.1) (0.3) (0.4)<br />
Other N 31 51 218 123 119 37 54 58<br />
(%) (0.4) (0.5) (2.2) (1.3) (1.2) (0.3) (0.5) (0.5)<br />
Total N 7,628 9,820 9,726 9,659 10,049 10,807 11,756 12,824<br />
1 First 6 months annualized.<br />
SOURCE: DACODS, ADAD<br />
Proceedings of the Community Epidemiology Work Group, Vol. II, January 2005 77
78<br />
<strong>EPIDEMIOLOGIC</strong> TRENDS IN <strong>DRUG</strong> <strong>ABUSE</strong>—Denver and Colorado<br />
Exhibit 6 Annual Percentages of Heroin, Methamphetamine, Cocaine, and Marijuana Users Entering<br />
Treatment Within 3 Years of Initial Use: 1997–2004<br />
Drug 1997 1998 1999 2000 2001 2002 2003 2004 1<br />
Heroin/Other Opiates N 214 314 342 340 283 267 255 188<br />
(%) (17.9) (22.3) (21.7) (21.6) (19.1) (18.9) (15.5) (17.2)<br />
Methamphetamine N 362 472 308 311 367 475 676 790<br />
(%) (33.6) (33.0) (25.5) (23.7) (22.1) (23.0) (24.6) (23.9)<br />
Cocaine N 310 423 390 374 348 394 438 472<br />
(%) (17.3) (18.4) (18.6) (19.5) (18.4) (18.0) (18.8) (18.1)<br />
Marijuana N 1,326 1,584 1,434 1,552 1,505 1,403 1,464 1,654<br />
(%) (42.4) (39.1) (35.9) (37.7) (35.7) (32.3) (35.2) (33.2)<br />
Total New Users in N 2,212 2,793 2,474 2,577 2,503 2,539 2,833 3,104<br />
Treatment in 3 Years (%) (30.8) (30.4) (27.9) (28.9) (27.1) (25.3) (26.1) (25.9)<br />
Total Users N 7,190 9,188 8,880 8,915 9,241 10,016 10,871 11,992<br />
1 First 6 months annualized.<br />
SOURCE: DACODS, ADAD<br />
Exhibit 7. Average Number of Years Between First Use of Selected Drugs and Treatment Entry: FY 2004<br />
SOURCE: DACODS, ADAD<br />
Drug Years<br />
Marijuana 7.0<br />
Methamphetamine 8.5<br />
Cocaine/Crack 10.0<br />
Other Opiates 11.0<br />
Heroin 13.0<br />
Alcohol 16.0<br />
Proceedings of the Community Epidemiology Work Group, Vol. II, January 2005
<strong>EPIDEMIOLOGIC</strong> TRENDS IN <strong>DRUG</strong> <strong>ABUSE</strong>—Denver and Colorado<br />
Exhibit 8. Profile of Colorado Treatment 1 Admissions by Primary Drug of Abuse: FY 2004<br />
Profile<br />
Age<br />
Alcohol<br />
(State<br />
FY 2003)<br />
7% < 18<br />
17% 18–25<br />
27% 26–35<br />
31% 36–45<br />
Cocaine<br />
Heroin/<br />
Other Opiates<br />
69% 26–45 100% 18+<br />
Marijuana<br />
42%
80<br />
<strong>EPIDEMIOLOGIC</strong> TRENDS IN <strong>DRUG</strong> <strong>ABUSE</strong>—Denver and Colorado<br />
Exhibit 8. Profile of Colorado Treatment 1 Admissions by Primary Drug of Abuse: FY 2004 (Cont’d.)<br />
Profile<br />
Family Issues<br />
Socialization<br />
Issues<br />
Education or<br />
Employment<br />
Issues<br />
Medical or<br />
Physical<br />
Issues<br />
Mental Health<br />
Problems<br />
Medical ER<br />
Visit in Last 6<br />
Months<br />
Medical Hospital<br />
Admission in<br />
Last 6 Months<br />
Psychiatric ER<br />
Visit in Last 6<br />
Months<br />
Psychiatric<br />
Hospital<br />
Admission in<br />
Last 6 Months<br />
Referral to<br />
Treatment<br />
Source<br />
Diagnostic<br />
Impression<br />
# Days Used<br />
in Last 30 Days<br />
Route of<br />
Administration<br />
Age of First Use<br />
Secondary<br />
Drug<br />
Age of First<br />
Use of<br />
Secondary<br />
Drug<br />
Alcohol<br />
(State<br />
FY 2003)<br />
25% none<br />
61% slightmoderate<br />
14% severe<br />
34% none<br />
60% slightmoderate<br />
6% severe<br />
40% none<br />
51% slightmoderate<br />
9% severe<br />
63% none<br />
33% slightmoderate<br />
4% severe<br />
Cocaine<br />
20% none<br />
60% slightmoderate<br />
20% severe<br />
28% none<br />
62% slightmoderate<br />
10% severe<br />
29% none<br />
57% slightmoderate<br />
14% severe<br />
59% none<br />
37% slightmoderate<br />
4% severe<br />
Heroin/<br />
Other Opiates<br />
29% none<br />
56% slightmoderate<br />
15% severe<br />
34% none<br />
57% slightmoderate<br />
9% severe<br />
38% none<br />
49% slightmoderate<br />
13% severe<br />
40% none<br />
52% slightmoderate<br />
8% severe<br />
Marijuana<br />
25% none<br />
61% slightmoderate<br />
14% severe<br />
38% none<br />
56% slightmoderate<br />
6% severe<br />
31% none<br />
58% slightmoderate<br />
11% severe<br />
75% none<br />
23% slightmoderate<br />
2% severe<br />
Metham-<br />
phetamine<br />
17% none<br />
62% slightmoderate<br />
21% severe<br />
25% none<br />
65% slightmoderate<br />
11% severe<br />
29% none<br />
58% slightmoderate<br />
13% severe<br />
60% none<br />
38% slightmoderate<br />
3% severe<br />
Barbiturates,<br />
Tranquilizers,<br />
Sedatives<br />
24% none<br />
61% slightmoderate<br />
16% severe<br />
24% none<br />
71% slightmoderate<br />
5% severe<br />
34% none<br />
52% slightmoderate<br />
13% severe<br />
42% none<br />
50% slightmoderate<br />
8% severe<br />
31% yes 28% yes 30% yes 32% yes 31% yes 45% yes<br />
77% none<br />
14% 1<br />
86% none<br />
8% 1<br />
95% none<br />
4% 1<br />
95% none<br />
4% 1<br />
17% self<br />
12% AOD<br />
provider<br />
12% Soc Ser<br />
34% Non-DUI<br />
CJ<br />
33% abuse<br />
52% dependence<br />
49% none<br />
17% 1–3<br />
13% 4–12<br />
17% 13–29<br />
4% daily<br />
99% oral<br />
<strong>EPIDEMIOLOGIC</strong> TRENDS IN <strong>DRUG</strong> <strong>ABUSE</strong>—Denver and Colorado<br />
Exhibit 9. Numbers and Percentages, Generational Drug Use Among Treatment Clients in Colorado: FY 2004<br />
Age Ranges<br />
2<br />
Y Generation<br />
N<br />
(%)<br />
X Generation 3 N<br />
(%)<br />
4 N<br />
Baby Boomers<br />
(%)<br />
N<br />
Seniors 5<br />
Total<br />
(%)<br />
N<br />
(%)<br />
Sedatives<br />
1<br />
Tranquilizers<br />
Stimulants Opiates Marijuana<br />
Hallucinogens<br />
1,079 751 90 2,241<br />
5<br />
(26) (18) (2) (54) (
82<br />
<strong>EPIDEMIOLOGIC</strong> TRENDS IN <strong>DRUG</strong> <strong>ABUSE</strong>—Denver and Colorado<br />
Exhibit 11. Colorado Cumulative AIDS Cases by Gender and Exposure Category Through September 30, 2004<br />
Gender/Exposure Category<br />
AIDS Cases<br />
Number Percent of Total<br />
Individuals with HIV Who Have Not<br />
Progressed to AIDS<br />
Number Percent of Total<br />
Total Cases (N)<br />
Gender<br />
8,270 100 3,772 100<br />
Male 7,618 92.1 3,403 90.2<br />
Female<br />
Exposure Category<br />
652 7.9 369 9.8<br />
Men/sex/men 5,558 67.2 2,402 63.7<br />
Injecting drug user (IDU) 768 9.3 405 10.7<br />
MSM and IDU 900 10.9 357 9.5<br />
Heterosexual contact 497 6.0 317 8.4<br />
Other 186 2.2 50 1.3<br />
Risk not identified 361 4.4 241 6.4<br />
SOURCE: CDPHE<br />
Proceedings of the Community Epidemiology Work Group, Vol. II, January 2005
<strong>EPIDEMIOLOGIC</strong> TRENDS IN <strong>DRUG</strong> <strong>ABUSE</strong>—Honolulu, Hawai'i<br />
Illicit Drug Use in Honolulu and the State of Hawai'i<br />
D. William Wood, M.P.H., Ph.D. 1<br />
ABSTRACT<br />
Methamphetamine abuse indicators were variable<br />
in 2004. Numbers of deaths were higher, treatment<br />
admissions were down a little, and police cases were<br />
also slightly lower. This period also saw variation<br />
for the indicators of cocaine use. The numbers of<br />
deaths and treatment admissions were down, while<br />
police cases increased slightly. Heroin use was<br />
down across all indicators, with the number of<br />
deaths and treatment admissions lower. Marijuana<br />
use was also down across all indicators. Oxycodone<br />
use appeared to have increased, with deaths up<br />
dramatically and drug seizures totaling an increase<br />
from previous periods. Oxycodone treatment admissions<br />
are now being reported and are thought to be<br />
higher than during previous periods. The Medical<br />
Examiner’s office reported 25 decedents with positive<br />
methadone toxicology in 2004.<br />
INTRODUCTI<strong>ON</strong><br />
This report presents current information on illicit<br />
drug use in Hawai'i, based on the Honolulu Community<br />
Epidemiology Work Group (CEWG), described<br />
later in this section.<br />
Area Description<br />
Hawai'i, the Aloha State, had a population of<br />
1,211,537 as of April 1, 2000, and by July 1, 2003,<br />
the population was estimated to be 3.8 percent<br />
higher, at 1,257,608.<br />
Kaua’i County<br />
City and County<br />
of Honolulu<br />
State of Hawai’i<br />
Maui County<br />
Hawai’i County<br />
1 The author is affiliated with the Department of Sociology, University of Hawai'i at Manoa, Honolulu, Hawai'i.<br />
The State’s population is differentially distributed<br />
across the seven major islands of the Hawaiian chain,<br />
shown in the figure above. There are 26 islands<br />
within the State’s boundaries, which extend from<br />
South Point on the Big Island of Hawai'i (the most<br />
southerly point in the United States) to Kure atoll,<br />
near Midway Island. The chain spans a total of 1,200<br />
miles from one end to the other. The City and County<br />
of Honolulu has 72.3 percent of the State population.<br />
Hawai'i, the Big Island, has 12.3 percent of the population,<br />
followed by Maui County (10.6 percent) and<br />
Kaua'i County (4.4 percent). The landmass of the<br />
State is 6,423 square miles, with a population density<br />
of 188.6 persons per square mile.<br />
The age and gender makeup of the State are shown in<br />
the following population pyramid, which reflects that<br />
males and females are about equally represented (sex<br />
ratio [males/100 females] = 100.96) and the median<br />
age is 36.2. While there is some variation by county,<br />
it is not significant. The dependency ratio (the number<br />
of other persons people of employment age must<br />
support) is 0.51, meaning that for every 10 persons of<br />
working age in Hawai'i (15–64 years of age), they<br />
must support, in addition to themselves, 5.1 other<br />
people.<br />
State of Hawaii,<br />
State of Hawai’i<br />
Population Pyramid (Percents),<br />
Population Pyramid 2000 (Percents): Census 2000 Census<br />
90-94<br />
Females Males<br />
10.0 8.0 6.0 4.0 2.0 0.0 2.0 4.0 6.0 8.0 10.0<br />
Proceedings of the Community Epidemiology Work Group, Vol. II, January 2005 83<br />
Age Group<br />
100+<br />
80-84<br />
70-74<br />
60-64<br />
50-54<br />
40-44<br />
30-34<br />
20-24<br />
10-14<br />
0-4<br />
Percent
The economy in Hawai'i, after a decade of stagnation,<br />
has rebounded. The mean income is now $49,820,<br />
and the median income is $56,961, suggesting that<br />
there are some very low incomes in the State as well<br />
as some extremely high incomes. The per capita<br />
money income is $21,525, and 10.7 percent of the<br />
population are below the Federal Poverty Level. 2 As<br />
an index of the extent to which life in Hawai'i compares<br />
to that on the mainland of the United States, the<br />
COLA (Cost of Living Adjustment) to Federal paychecks<br />
is often used. Currently, COLA in Hawai'i is<br />
25 percent, having risen recently from the 1998 rate<br />
of 22.5 percent. While the median value of a single<br />
family dwelling in 2000 was $272,700, by 2005 it<br />
had appreciated to $525,000 for a three-bedroom,<br />
one-bathroom, single wall construction property on<br />
8,000 square feet of land. As of the writing of this<br />
report, the Hawai'i gasoline price is $2.31 per gallon.<br />
Approximately 10 percent of the population is without<br />
health insurance.<br />
Seventeen percent<br />
of the population<br />
are foreign born,<br />
with 73.2 percent<br />
speaking English as<br />
the primary language<br />
in the home.<br />
Using U.S. Census<br />
categories, the ethnic<br />
distribution of<br />
the population is<br />
24.3 percent White,<br />
1.8 percent Black,<br />
0.3 percent American<br />
Indian and<br />
Alaska Native, 9.4<br />
percent Native Hawaiian<br />
and Other<br />
Pacific Islander,<br />
41.6 percent Asian,<br />
and 1.3 percent<br />
Others. Singlerace-only<br />
described<br />
79.6 percent of the<br />
population.<br />
The economy has rebounded from the slump resulting<br />
from the Asian economic crisis and the mainland<br />
9-11 event, both of which seriously negatively impacted<br />
the number of visitors coming to Hawai'i for<br />
vacations. As shown in the figure, unemployment is<br />
among the lowest in the United States, at about 3.3<br />
percent, and contractors are extremely busy working<br />
2 Upwardly adjusted for Hawai’i.<br />
84<br />
7<br />
6<br />
5<br />
4<br />
3<br />
2<br />
1<br />
0<br />
1990 1990<br />
5.6<br />
<strong>EPIDEMIOLOGIC</strong> TRENDS IN <strong>DRUG</strong> <strong>ABUSE</strong>—Honolulu, Hawai'i<br />
Annual Unemployment Rates for Hawaii and the U.S.<br />
1990–2005 (January)<br />
Percent<br />
8<br />
7.5<br />
2.6<br />
1993 1993<br />
6.1<br />
4.7<br />
5.9<br />
5.4<br />
1996 1996<br />
6.3<br />
4.5<br />
on delayed projects that accumulated during the recent<br />
recession in Hawai'i.<br />
A unique feature of the population of the State is that<br />
a very high number of residents are members of the<br />
armed forces, with Pearl Harbor Navy and Schofield<br />
Army Bases being home to the majority of them. In<br />
total, as of 2003, there were 101,030 armed forces<br />
members and military dependents in the State. This<br />
does not count the numbers of National Guard members<br />
(5,334) and military reserves (9,108). In total,<br />
this represents 9.2 percent of the population. The<br />
presence of the armed forces provides major financial<br />
inputs to the economy in terms of support service<br />
contracts and Federal impact moneys for the State<br />
school system. It also skews the State population<br />
profile by adding younger, male residents.<br />
With the Afghanistan and Iraq conflicts, Hawai'i has<br />
had a number of large deployments of active duty and<br />
1999 1999<br />
6.1<br />
Haw aii Rate<br />
U.S. Rate<br />
4.0<br />
5.8<br />
4.1<br />
2002 2002<br />
Rates are seasonally adjusted.<br />
SOURCE: Hawai’i Department of Labor and Industrial Relations<br />
3.9<br />
5.5<br />
2005 2005<br />
2.9<br />
reserve and guard<br />
units. The exact<br />
numbers deployed<br />
are not clear, but<br />
the short-term impact<br />
is certain.<br />
When the soldiers<br />
are away, especially<br />
for what has<br />
become an indeterminatedeployment<br />
period, families<br />
return to their<br />
roots. With the<br />
departure of Hawai'i-based<br />
troops,<br />
families have returned<br />
to the mainland<br />
to be with<br />
their own core<br />
families. Military<br />
deployment also<br />
means a decreased<br />
need for civilian<br />
support staff, so<br />
many civilian base<br />
workers have lost their jobs. Fortunately, with the<br />
unemployment rate as low as it is, finding new jobs<br />
has not been a problem. Finally, the deployment has<br />
had an impact on store owners who traditionally supply<br />
both the troops and their families with everything<br />
from “shave ice” to “Manapua.”<br />
In summary, after some tough economic times, the<br />
State is on the rebound and the economy seems to be<br />
doing well. The people are still frustrated with the<br />
continual reports and personal experiences with drugs<br />
Proceedings of the Community Epidemiology Work Group, Vol. II, January 2005
in their midst, especially crystal methamphetamine,<br />
and the apparent lack of success in State prevention<br />
and treatment efforts.<br />
Data Sources<br />
Much of the data presented in this report are from the<br />
Honolulu CEWG, which met on January 14, 2005.<br />
The meeting was hosted by the Hawai'i High Intensity<br />
Drug Trafficking Area program office, whose<br />
staff facilitated the attendance of the Drug Enforcement<br />
Administration representatives, as well as persons<br />
knowledgeable about drug data from Honolulu<br />
and neighbor islands. The State of Hawai'i Narcotics<br />
Enforcement Division, although invited, did not participate<br />
in the CEWG meeting. Several neighbor island<br />
police departments, as well as the Honolulu Police<br />
Department, submitted data, but they were not<br />
able to attend the CEWG meeting because of deployment<br />
commitments at the State level. Neighbor<br />
island data, however, remain inconsistent and are not<br />
reported in this report, since problems with the respective<br />
narcotics-vice information systems have not<br />
been resolved. For these reasons, this report is focused<br />
primarily on drug activities in O'ahu for the<br />
calendar year 2004, with the exception of State<br />
treatment data, which were available for only the first<br />
6 months of 2004. Other specific data sources are<br />
listed below:<br />
• Treatment admissions and demographic data<br />
were provided by the Hawai’i State Department<br />
of Health, Alcohol and Drug Abuse Division<br />
(ADAD). Previous data from ADAD are updated<br />
for this report whenever ADAD reviews its records.<br />
These data represent all State-supported<br />
treatment facilities (90 percent of all facilities).<br />
About 5–10 percent of these programs and two<br />
large private treatment facilities do not provide<br />
data. During this reporting period, approximately<br />
45 percent of the treatment admissions were paid<br />
for by ADAD; the remainder was covered by<br />
State health insurance agencies or by private insurance.<br />
The rate of uninsurance for the State is<br />
about 10 percent.<br />
• Drug-related death data were provided by the<br />
Honolulu City and County Medical Examiner<br />
(ME) Office. These data are based on toxicology<br />
screens performed by the ME Office on bodies<br />
brought to them for examination. The sorts of<br />
circumstances that would lead to the body being<br />
examined by the ME include unattended deaths,<br />
deaths by suspicious cause, and clear drugrelated<br />
deaths. In short, while the ME data are<br />
consistent, they are not comprehensive and ac-<br />
<strong>EPIDEMIOLOGIC</strong> TRENDS IN <strong>DRUG</strong> <strong>ABUSE</strong>—Honolulu, Hawai'i<br />
count for only about one-third of all deaths on<br />
O’ahu. To allow a direct comparison between<br />
ME data and treatment data, the ME data on the<br />
exhibits have been multiplied by 10.<br />
• Law enforcement case data for 2004 were received<br />
from the Honolulu Police Department,<br />
Narcotics/Vice Division only. Data for 2003 and<br />
earlier were received from the Kona Police Department.<br />
• Arrestee drug testing data were provided by<br />
the Arrestee Drug Abuse Monitoring (ADAM)<br />
program of the National Institute of Justice<br />
(NIJ). The ADAM program has reported its data<br />
regularly to the CEWG, but NIJ closed the<br />
ADAM program effective December 2003. Thus,<br />
the current data are all that will exist for this sentinel<br />
data source. The ADAM project collected<br />
its data at the Central Receiving Unit of the<br />
Honolulu Police Department. Data on the urine<br />
testing component, as well as the questionnaire<br />
findings, were presented. This will be the last report<br />
to include these final data.<br />
• Drug price data were provided by the Honolulu<br />
Police Department (HPD), Narcotics/Vice Division,<br />
for 2003.<br />
• Uniform Crime Reports (UCR) data were accessed<br />
from the State’s Attorney General’s Web<br />
site for 1975–2003.<br />
Emergency department (ED) drug mentions data<br />
have not been available in Hawai'i since 1994. Discussions<br />
with the Healthcare Association of Hawai'i<br />
regarding inclusion in the Drug Abuse Warning Network<br />
(DAWN) program have resulted in a briefing of<br />
all hospital CEOs and the sharing of DAWN information.<br />
Given the added burden of the cost of care of<br />
ice users and the general concern expressed at the<br />
community level, it is hoped that a meeting can be<br />
arranged between the DAWN program and the association<br />
during the coming months.<br />
<strong>DRUG</strong> <strong>ABUSE</strong> PATTERNS AND TRENDS<br />
Hawaiians and Whites remain the majority user groups<br />
among the 17 identified ethnic groups (plus 2 other<br />
categories: "other" and "unknown/blank") who access<br />
ADAD facilities for substance abuse treatment. During<br />
the first half of 2004, 47.7 percent and 19.9 percent of<br />
the admissions were Hawaiians/Part Hawaiians or<br />
Whites, respectively. All other groups represented<br />
significantly lower proportions of admissions.<br />
Proceedings of the Community Epidemiology Work Group, Vol. II, January 2005 85
Methamphetamine remains the leading primary substance<br />
of abuse for those admitted to treatment, accounting<br />
for 45.2 percent of admissions. Marijuana<br />
remained the third most frequently reported primary<br />
substance for treatment admissions (22.2 percent)<br />
behind alcohol (22.4 percent). It is important to point<br />
out, however, that almost all polydrug treatment admissions<br />
list alcohol as a substance of abuse. The 25–<br />
44 age group had the highest representation among<br />
treatment admissions, with 26.2 percent of admissions<br />
being age 25–34; 35–44-year-olds accounted<br />
for 25.0 percent. While marijuana abuse accounts for<br />
the majority of treatment admissions among those<br />
younger than 18 (the third most frequently admitted<br />
age group), the abuse of ice or crystal methamphetamine<br />
still looms as a major treatment category for<br />
this group.<br />
During this reporting period, drug prices have been<br />
stable, except for some minor upward price adjustments<br />
for crystal methamphetamine in smaller<br />
amounts (exhibit 1). The size of the drug supply appears<br />
to make for a relatively stable drug market,<br />
with only a few market adjustments caused by seizures<br />
of specific drugs or oversupply of others.<br />
Ice continues to dominate the Hawaiian drug market.<br />
Prices have increased slightly during the reporting<br />
period, and this is likely reflective of several seizures.<br />
It is now easier to purchase larger quantities than in<br />
the past. The final police evidence of increased ice<br />
availability is that of clandestine labs, almost exclusively<br />
reprocessing labs that continue to be closed at<br />
a regular pace.<br />
Marijuana remains a drug for which arrest results<br />
from circumstance, bad luck, or stupidity. The Big<br />
Island Police Department continues “Operation<br />
Green Harvest” in collaboration with Federal agencies.<br />
More than 100,000 plants are seized per halfyear<br />
on the Hilo (east) side of the island, and about<br />
an additional 30,000 plants are seized on the Kona<br />
(west) side of the island. Officials in Maui seize approximately<br />
14,000 plants per half-year. Efforts in<br />
O'ahu during the 2004 reporting period resulted in<br />
seizures of only 1,045 plants and 24,714 grams of<br />
dried marijuana, compared with 8,472 plants and<br />
45,074 grams seized in 2003 and 41,996 plants and<br />
52,269 grams of dried marijuana seized in 2002.<br />
The Hawai'i DEA continues its efforts with the<br />
Honolulu Police Department to deal with crystal<br />
methamphetamine and, in particular, to break the<br />
supply route from California for the chemicals necessary<br />
to operate Hawai'i’s ice labs. During this period,<br />
the HPD seized and closed 24 clandestine metham-<br />
86<br />
<strong>EPIDEMIOLOGIC</strong> TRENDS IN <strong>DRUG</strong> <strong>ABUSE</strong>—Honolulu, Hawai'i<br />
phetamine laboratories. In 2000, 8 labs were closed,<br />
compared with 7 in 2001, 15 in 2002, and 10 in 2003.<br />
In this paper, the police data exhibits show all<br />
neighbor island data combined and titled “neighbor<br />
island.” As noted earlier, these data could not be uniformly<br />
updated for this report, and therefore they are<br />
not considered reliable. The Honolulu data represent<br />
regular administrative reports from the HPD.<br />
Cocaine/Crack<br />
Powder cocaine and crack treatment admissions declined<br />
somewhat during the current period. There<br />
were 172 primary cocaine treatment admissions in<br />
the first half of 2004, suggesting a year-end total of<br />
about 340 admissions, compared with 355 in 2003,<br />
428 in 2002, and 433 in 2001 (exhibit 2). This shows<br />
that the number of clients listing cocaine as the primary<br />
drug, after being quite stable for several years,<br />
began a decline in 1999 that continues into 2004.<br />
Powder cocaine/crack now ranks fourth among primary<br />
drugs of treatment admissions, after methamphetamine,<br />
alcohol, and marijuana.<br />
The Honolulu ME reported 22 deaths with cocainepositive<br />
toxicology screens in 2004, compared to 26<br />
in 2003 and 22–24 deaths in 1999–2002 (exhibit 2).<br />
It should be remembered that data on the chart have<br />
been adjusted to allow for their presentation on the<br />
same axes by multiplying all death data by a constant<br />
of 10.<br />
According to the HPD, cocaine prices have remained<br />
relatively stable over the past several years. Onequarter<br />
gram of crack currently sells for $25–$30,<br />
and the same amount of cocaine powder costs $25–<br />
$35 (exhibit 1). Police cases increased slightly in<br />
2004 to 239 (exhibit 3). Over the past 6 years, the<br />
number of HPD cocaine cases plummeted from more<br />
than 1,200 cases in 1996 to 202 in 2003.<br />
Heroin and Other Opiates<br />
Black tar heroin monopolizes the heroin market of<br />
Hawai'i, and it is readily available in all areas of the<br />
State. China white heroin has been uncommon in<br />
Hawai’i for several years, but it is occasionally available<br />
for a premium price. HPD data show 1,251<br />
grams of black tar and 1.699 grams of China white<br />
were seized in 2004. This is lower than the 3,502<br />
grams of black tar seized in 2003 but higher than the<br />
0.019 grams of powder seized in 2003. For 2002, 992<br />
grams of black tar and 494 grams of powder were<br />
seized. In 2001, 530 grams of powder were seized,<br />
along with 3,258 grams of black tar heroin. Accord-<br />
Proceedings of the Community Epidemiology Work Group, Vol. II, January 2005
ing to the HPD, black tar heroin prices remained stable<br />
in Honolulu at $50–$75 per one-quarter gram,<br />
$150–$200 per gram, and $2,500–$3,500 per ounce<br />
(exhibit 1).<br />
Heroin treatment admissions continued the decline<br />
begun in 1998 (exhibit 4). In 1998, record levels of<br />
treatment admissions were recorded, with more than<br />
500 individual admissions that year. In the first half<br />
of 2004, however, heroin ranked fifth among treatment<br />
admissions at 2.1 percent (n=72).<br />
The Honolulu ME reported that deaths in which opiates<br />
were detected may remain constant in 2004, once<br />
the toxicology results are obtained on the 18 decedents<br />
currently listed as “suspected” but not confirmed.<br />
However, for now, only seven opiate deaths<br />
are confirmed for 2004 (exhibit 4). Decedents with a<br />
positive toxicological result for opiates were primarily<br />
comprised of those in whom oxycodone was detected.<br />
The exact medication (OxyContin® or another)<br />
used was not specified. However, the 15 decedents<br />
with oxycodone in their toxicology screens is a<br />
death rate for the City and County of Honolulu of<br />
17.2 per 1,000,000 persons. An additional concern<br />
was expressed by the Medical Examiner’s office this<br />
year, and that was with respect to methadone. Previously,<br />
the ME had been asked to review its records<br />
and to monitor the appearance of methadone among<br />
decedents. In 2004, there were 25 decedents with a<br />
positive toxicology screen for methadone. There were<br />
22 decedents with methadone in their toxicology results<br />
in 2003 and 28 in 2002.<br />
The HPD reported 25 heroin cases in 2001, 44 in<br />
2002, 30 in 2003, and 33 in 2004 (exhibit 5). No specific<br />
explanation of either the “spike” or “trough” in<br />
the data was provided.<br />
Marijuana<br />
Statewide, marijuana treatment admissions may have<br />
decreased a bit in 2004, with only 708 reported in the<br />
first half of the year (exhibit 6). There had been an<br />
increase in 2003, following the slight decline in admissions<br />
in 2002. The 2004 admissions remain focused<br />
on younger persons who were often referred by<br />
the courts. In examining these treatment data, it is<br />
important to remember that the number of persons in<br />
treatment for marijuana use is triple the number in<br />
treatment in 1992. It is also important to note that<br />
while marijuana is listed as the primary drug of use at<br />
admission, many of these clients also used other substances.<br />
Between 1994 and 1999, the O'ahu ME reported 12–<br />
21 deaths per year in which marijuana was found in<br />
<strong>EPIDEMIOLOGIC</strong> TRENDS IN <strong>DRUG</strong> <strong>ABUSE</strong>—Honolulu, Hawai'i<br />
the specimens submitted for toxicology screening<br />
(exhibit 6). Those numbers increased to 25 in 2000,<br />
36 in 2001, 30 in 2002, 32 in 2003, and 31 in 2004.<br />
Again, in most instances, marijuana was used with<br />
other drugs if there was a drug-related death.<br />
The HPD continues to monitor, but to not specifically<br />
report, case data for marijuana. As mentioned in previous<br />
CEWG reports, possession cases are steady at<br />
about 650 per year, although distribution cases have<br />
continued to increase. Law enforcement sources<br />
speculate that much of the Big Island's marijuana is<br />
brought to O'ahu for sale (exhibit 7).<br />
As shown in exhibit 1, marijuana costs $5–$20 per<br />
joint, $25 per gram, and $6,000–$9,000 per pound in<br />
2004.<br />
Methamphetamine<br />
It is with little pride that Honolulu and the State of<br />
Hawai'i retain the title as the crystal methamphetamine<br />
capital of the United States. Methamphetamine<br />
remains the drug of choice in the island chain. California-based<br />
Mexican sources use Hawai'i’s cultural<br />
diversity to facilitate smuggling and distribution to<br />
and within the islands. Analysis of confiscated<br />
methamphetamine reveals that the product is still a<br />
high-quality d-methamphetamine hydrochloride in<br />
the 90–100-percent purity range, which makes it<br />
ideal for smoking (the route of admission of choice).<br />
Methamphetamine treatment admissions remained<br />
extremely high (accounting for 44 percent of admissions<br />
in the first half of 2004), but they will dip<br />
slightly if the total in the initial 6 months of 2004<br />
(1,516 admissions) prevails for the balance of the<br />
year (exhibit 8). In 2003, there were 3,182 such admissions,<br />
up from 2,677 in 2002. An examination of<br />
exhibit 8 shows the trend over the past 13 years. The<br />
rate of increase in demand for treatment space for<br />
methamphetamine abusers has been nearly 2000 percent<br />
since 1991. This situation has so far outstripped<br />
the treatment system's capacity, that even people who<br />
might want treatment would not be likely to receive it<br />
in a timely manner. With court diversion programs in<br />
place, the available treatment slots for non-judicial<br />
treatment admissions are extremely tight.<br />
Between 1994 and 2000, the O'ahu ME mentioned<br />
crystal methamphetamine in 24–38 cases per year<br />
(exhibit 8). In 2001, that number jumped to 54, and<br />
methamphetamine-positive decedents increased to 62<br />
in 2002. In 2003, the number of decedents with ice<br />
detected in their toxicologies was 56. For 2004, there<br />
were 67 deaths with positive toxicology results for<br />
Proceedings of the Community Epidemiology Work Group, Vol. II, January 2005 87
methamphetamine, representing 76.5 deaths per<br />
1,000,000 for the island of O'ahu.<br />
Crystal methamphetamine prices remained stable in<br />
2004. The drug is sold in the islands as "clear" (a<br />
clear, white form) or "wash" (a brownish, less processed<br />
form). Prices for ice vary widely according to<br />
these two categories and availability, as illustrated by<br />
prices on O'ahu: $50 (wash) or $75 (clear) per 0.25<br />
gram; $200–$300 (wash) or $600–$900 (clear) per<br />
gram; $450–$600 (wash) or $1,000–$2,000 (clear)<br />
per one-quarter ounce; and $2,200–$3,000 (wash) per<br />
ounce.<br />
HPD methamphetamine case data peaked at 984 in<br />
1995 (exhibit 9). The annual number of cases subsequently<br />
declined annually, and they totaled 616 in<br />
2002 and 964 in 2003. However, in 2004, a total of<br />
8.083 cases were reported. Minimal data are available<br />
from the neighbor islands, but they also show an increase<br />
in cases.<br />
NFLIS data for FY 2003 and FY 2004 show that<br />
methamphetamine was the most often seized substance,<br />
with 62 percent of the FY 2003 and 59 percent<br />
of the FY 2004 samples testing positive for<br />
methamphetamine. The final piece of information on<br />
Hawai'i’s leading drug is from the ADAM site.<br />
Weighted data on adult male arrestees for 2001,<br />
2002, and 2003 show that the drug most frequently<br />
found in the urines of these arrestees was amphetamines,<br />
almost entirely methamphetamine (exhibit<br />
10). The weighted 2003 data show that 46.3 percent<br />
tested positive for amphetamines/methamphetamine<br />
in the first quarter, 38.0 percent were positive in the<br />
second quarter, and 46.0 percent were positive for<br />
amphetamines in the third quarter.<br />
Depressants<br />
Barbiturates, sedatives, and sedatives/hypnotics are<br />
combined into this category. Few data were provided<br />
about these drugs in the islands.<br />
ADAD maintains three categories under this heading:<br />
benzodiazepines, other tranquilizers, and barbiturates.<br />
Treatment admissions for these drugs are minimal in<br />
terms of impact on the system. Annually, the numbers<br />
admitted to treatment for these drugs total less<br />
than 10.<br />
88<br />
<strong>EPIDEMIOLOGIC</strong> TRENDS IN <strong>DRUG</strong> <strong>ABUSE</strong>—Honolulu, Hawai'i<br />
The number of ME mentions for depressants has remained<br />
stable for several years at five or less.<br />
The HPD have not reported depressant case data<br />
since 1991. Neighbor island police reported fewer<br />
than 15 cases per year since 1996.<br />
Prices remain stable at $3–$20 per unit for barbiturates<br />
and $2–$3 per pill for secobarbital (Seconal or<br />
"reds").<br />
Hallucinogens<br />
Hallucinogen treatment admissions total less than<br />
five per year. No hallucinogen ME mentions have<br />
been reported since the beginning of data collection.<br />
Prices for lysergic acid diethylamide (LSD) were $4–<br />
$6 per "hit" and $225–$275 per 100 dosage unit<br />
sheets (a "page") in this reporting period.<br />
No hallucinogen case data were generated for 2002.<br />
UCR Data<br />
The Uniform Crime Report has often been described<br />
as the most reliable database in the criminal justice<br />
area. Unfortunately, it has also been described as<br />
being none too valid in terms of the definitions used<br />
to collect the data. For Community Epidemiology<br />
Work Groups, it is yet another data set that is routinely<br />
collected by others and is in the public domain.<br />
Hawai'i produces data from the UCR via an Attorney<br />
General’s Web site, with data from 1975 to the present<br />
easily accessible to outside users. This short<br />
analysis uses the UCR data to suggest that even<br />
greater utility might be made with them if the researchers<br />
were given access to the full data set, which<br />
contains the arrest-specific information, as well as<br />
more demographic and criminal justice information<br />
on the subjects reported on in the UCR.<br />
For Honolulu, the following chart shows that violent<br />
crimes are not and have never been much of a problem.<br />
It also shows that while having several peaks<br />
and troughs, property crime is lower now than it was<br />
in the mid-1990s and early 1980s. The data included<br />
in these indexes are murders, rapes, robberies, assaults,<br />
burglaries, larceny thefts, motor vehicle thefts,<br />
and arson.<br />
Proceedings of the Community Epidemiology Work Group, Vol. II, January 2005
Number of cases<br />
80,000<br />
70,000<br />
60,000<br />
50,000<br />
40,000<br />
30,000<br />
20,000<br />
10,000<br />
0<br />
1975<br />
1977<br />
<strong>EPIDEMIOLOGIC</strong> TRENDS IN <strong>DRUG</strong> <strong>ABUSE</strong>—Honolulu, Hawai'i<br />
1979<br />
SOURCE: Uniform Crime Reports<br />
The UCR collects data on several categories of drug<br />
crime as well as associated crimes. The next analysis<br />
will include data from 1975 through 2003 that focuses<br />
on specific drug manufacture and drug trafficking<br />
data, as well as that related to driving under the<br />
influence (DUI) and other liquor offenses. To under-<br />
Number<br />
7,000<br />
6,000<br />
5,000<br />
4,000<br />
3,000<br />
2,000<br />
1,000<br />
0<br />
1975<br />
1977<br />
Crime Index for Honolulu 1975-2003<br />
from Uniform Crime Report Data<br />
1981<br />
1983<br />
1985<br />
1987<br />
Proceedings of the Community Epidemiology Work Group, Vol. II, January 2005 89<br />
1989<br />
1991<br />
1993<br />
Violent Crime Index<br />
Property Crime Index<br />
Total Index<br />
1995<br />
1997<br />
stand the following chart, it is important to note that<br />
methamphetamine is included in the non-narcotic<br />
data both for manufacture and possession. The possession<br />
data are, as would be expected, always higher<br />
than the manufacture and distribution data.<br />
UCR Data on Drugs and Petty Theft in Honolulu: 1975-2003<br />
1979<br />
1981<br />
1983<br />
1985<br />
1987<br />
1989<br />
Opium or Cocaine Marijuana Synthetic Narcotic<br />
Nonnarcotic DUI Liquor Law s<br />
1991<br />
1993<br />
1995<br />
1997<br />
1999<br />
1999<br />
2001<br />
2001<br />
2003<br />
2003
Of interest in this chart is the aggregation of data<br />
points in the lower portion, with the lowest points<br />
representing drug manufacture and distribution cases<br />
and the line above them the liquor offense cases. DUI<br />
data clearly eclipse all others on the chart. While<br />
90<br />
<strong>EPIDEMIOLOGIC</strong> TRENDS IN <strong>DRUG</strong> <strong>ABUSE</strong>—Honolulu, Hawai'i<br />
much more could be done with these data, this brief<br />
analysis suggests that when examining criminal justice<br />
data, there is a need to look at alcohol use as a<br />
much more prevalent problem than many of the other<br />
drug abuse categories.<br />
For inquiries concerning this report, please contact D. William Wood, Ph.D., Department of Sociology, University of Hawai’i at Manoa, 265<br />
North Kalaheo Avenue, Honolulu, HI 96822, Phone: 250-384-3748, Fax: 808-965-3707, E-mail: dwwood@shaw.ca.<br />
Proceedings of the Community Epidemiology Work Group, Vol. II, January 2005
Exhibit 1. Drug Prices in Honolulu: 2003<br />
Drug<br />
Paper<br />
1/4 Gram<br />
<strong>EPIDEMIOLOGIC</strong> TRENDS IN <strong>DRUG</strong> <strong>ABUSE</strong>—Honolulu, Hawai'i<br />
Gram<br />
Quarter<br />
1/4 Oz.<br />
Proceedings of the Community Epidemiology Work Group, Vol. II, January 2005 91<br />
“O”<br />
1 Oz.<br />
“LBs”<br />
1 Pound<br />
“Kilo”<br />
1 Kilogram<br />
Heroin (White) $50 $200–$300 $2,000–$3,000 $5,000 $50,000 $100,000<br />
Heroin (Black Tar) $50–$75 $150–$200 $750 $2,500–$3,500 N/A 1 N/A<br />
Cocaine $25–$35 $100–$120<br />
$500–$600<br />
$250–$350<br />
(8 ball)<br />
$1,100–$1,500<br />
$13,500–<br />
$25,000<br />
$26,000–<br />
$52,000<br />
Crack $25–$30 $100–$250 $1,000–$1,500 $24,000 N/A<br />
Crystal Methamphetamine<br />
LSD $4–$6 per hit<br />
Marijuana<br />
$50 $200–$300<br />
$5–$20 per<br />
joint<br />
$25<br />
$450–$600<br />
(8 ball)<br />
$225–$275<br />
per 100 hits<br />
$100–$200<br />
(8 ball)<br />
$2,200–$3,000 $30,000<br />
$50,000–<br />
$70,000<br />
$400–$800 $6,000–$9,000 N/A<br />
Hashish N/A $10 $40–$60 $150–$300 $1,400–$1,800<br />
Dilaudids<br />
$40–$80<br />
per capsule<br />
MDMA $25–$40 each<br />
Phencyclidine (PCP) $10–$20 $100 $350–$550 $900–$1,200 N/A N/A<br />
1 N/A= Not available.<br />
SOURCE: Honolulu Police Department<br />
Exhibit 2. Cocaine-Related Death 1 and Treatment Data in Hawaii: 1991–2004 2<br />
Number of Cases<br />
700<br />
600<br />
500<br />
400<br />
300<br />
200<br />
100<br />
0<br />
162 162<br />
150<br />
291 291<br />
300<br />
422 422<br />
210<br />
531 531<br />
380<br />
560 560<br />
230<br />
662 662<br />
320<br />
1 To allow direct comparison between ME data and treatment data, the ME data have been multiplied by 10.<br />
2 Treatment data for 2004 are for the first half only.<br />
SOURCES: Hawai’i State Department of Health, Alcohol and Drug Abuse Division; Honolulu City and County Medical Examiner<br />
Office<br />
647 647<br />
230<br />
1991 1992 1993 1994 1995 1996 1997 1998 1999 2000 2001 2002 2003 2004<br />
663 663<br />
290<br />
656 656<br />
240<br />
550 550<br />
220<br />
O'ahu Deaths * 10 Treatment Data<br />
433 433<br />
240<br />
428 428<br />
230<br />
355 355<br />
260<br />
220<br />
158 158
92<br />
<strong>EPIDEMIOLOGIC</strong> TRENDS IN <strong>DRUG</strong> <strong>ABUSE</strong>—Honolulu, Hawai'i<br />
Exhibit 3. Cocaine-Related Police Cases in Hawaii and Neighboring Islands: 1991–2004<br />
Number of Cases<br />
1,400<br />
1,200<br />
1,000<br />
800<br />
600<br />
400<br />
200<br />
0<br />
735 735<br />
316<br />
648<br />
553 553<br />
613<br />
210 210<br />
901<br />
639 639<br />
SOURCES: Honolulu and Kona Police Departments<br />
1,056<br />
1,218<br />
Exhibit 4. Heroin Deaths 1 and Treatment Admissions in Hawaii: 1991–2004 2<br />
Number of Cases<br />
700<br />
600<br />
500<br />
400<br />
300<br />
200<br />
100<br />
0<br />
474 474<br />
528 528<br />
1<br />
To allow direct comparison between O’ahu ME data and treatment data, the O’ahu ME data have been multiplied by 10.<br />
2<br />
Treatment data for 2004 are for the first half only.<br />
SOURCES: Hawai’i State Department of Health, Alcohol and Drug Abuse Division; Honolulu City and County Medical Examiner<br />
Office<br />
1,045<br />
468 468<br />
1991 1992 1993 1994 1995 1996 1997 1998 1999 2000 2001 2002 2003 2004<br />
134 134<br />
140<br />
209 209<br />
120<br />
220<br />
190 190<br />
400<br />
236 236<br />
416 416<br />
400<br />
210<br />
874<br />
345 345<br />
385<br />
384 384<br />
Honolulu Neighbor Islands<br />
346 346<br />
340<br />
130<br />
340<br />
330 330<br />
140<br />
521 521<br />
350<br />
190<br />
487 487<br />
420<br />
190<br />
351 351<br />
225<br />
470<br />
140<br />
114 114<br />
441 441<br />
153<br />
278 278<br />
122<br />
202<br />
239<br />
Proceedings of the Community Epidemiology Work Group, Vol. II, January 2005<br />
74 74<br />
590<br />
253 253<br />
570<br />
160 140<br />
1991 1992 1993 1994 1995 1996 1997 1998 1999 2000 2001 2002 2003 2004<br />
O'ahu Heroin Deaths * 10 Treatment Admissions O'ahu Opiate Deaths<br />
17 17<br />
400<br />
201 201<br />
180<br />
400<br />
70<br />
61 61
<strong>EPIDEMIOLOGIC</strong> TRENDS IN <strong>DRUG</strong> <strong>ABUSE</strong>—Honolulu, Hawai'i<br />
Exhibit 5. Heroin-Related Police Case Data: 1991–2004<br />
Number of Cases<br />
160<br />
140<br />
120<br />
100<br />
80<br />
60<br />
40<br />
20<br />
0<br />
87 87<br />
56 56<br />
46 46<br />
43<br />
107 107<br />
35<br />
120 120<br />
SOURCES: Honolulu and Kona Police Departments<br />
54<br />
Exhibit 6. Marijuana-Related Deaths 1 and Treatment Admissions 2 in Hawaii: 1991–2004 2<br />
Number of Cases<br />
1,800<br />
1,600<br />
1,400<br />
1,200<br />
1,000<br />
800<br />
600<br />
400<br />
200<br />
0<br />
148 148<br />
49<br />
1<br />
To allow direct comparison between O’ahu ME data and treatment data, the O’ahu ME data have been multiplied by 10.<br />
2<br />
Treatment data for 2004 are for the first half only.<br />
SOURCES: Hawai’i State Department of Health, Alcohol and Drug Abuse Division; Honolulu City and County Medical Examiner<br />
Office<br />
61 61<br />
39<br />
1991 1992 1993 1994 1995 1996 1997 1998 1999 2000 2001 2002 2003 2004<br />
249 249<br />
10<br />
489 489<br />
80<br />
642 642<br />
60<br />
565 565<br />
120<br />
414 414<br />
170<br />
Proceedings of the Community Epidemiology Work Group, Vol. II, January 2005 93<br />
95 95<br />
87<br />
71<br />
99 99<br />
53<br />
Honolulu Neighbor Islands<br />
948 948<br />
190<br />
1,132 1,132<br />
200<br />
1991 1992 1993 1994 1995 1996 1997 1998 1999 2000 2001 2002 2003 2004<br />
1,301 1,301<br />
150<br />
1,418 1,418<br />
210<br />
58 58<br />
250<br />
1,443 1,443<br />
39 39<br />
25<br />
O'ahu Deaths * 10 Treatment Admissions<br />
1,544 1,544<br />
360<br />
44<br />
13 13<br />
1,514 1,514<br />
300<br />
30<br />
20 20<br />
320<br />
33<br />
1,593 1,593<br />
310<br />
708 708
94<br />
<strong>EPIDEMIOLOGIC</strong> TRENDS IN <strong>DRUG</strong> <strong>ABUSE</strong>—Honolulu, Hawai'i<br />
Exhibit 7. Marijuana-Related Police Case Data: 1991–2004<br />
Number of Cases<br />
2,500<br />
2,000<br />
1,500<br />
1,000<br />
500<br />
0<br />
673 673<br />
608<br />
477 477<br />
670<br />
550 550<br />
237<br />
1,240 1,240<br />
492<br />
SOURCES: Honolulu and Kona Police Departments<br />
1,087 1,087<br />
569<br />
Exhibit 8. Methamphetamine-Related Deaths 1 and Treatment Admissions in Hawaii: 1991–2004 2<br />
Number of Cases<br />
3,500<br />
3,000<br />
2,500<br />
2,000<br />
1,500<br />
1,000<br />
500<br />
0<br />
1,365 1,365<br />
1<br />
To allow direct comparison between O’ahu ME data and treatment data, the O’ahu ME data have been multiplied by 10.<br />
2<br />
Treatment data for 2004 are for the first half only.<br />
SOURCES: Hawai’i State Department of Health, Alcohol and Drug Abuse Division; Honolulu City and County Medical Examiner<br />
Office<br />
1,210 1,210<br />
1991 1992 1993 1994 1995 1996 1997 1998 1999 2000 2001 2002 2003 2004<br />
152 152<br />
110<br />
268 268<br />
200<br />
454 454<br />
140<br />
628 628<br />
360<br />
1,008 1,008<br />
380<br />
1,065 1,065<br />
92<br />
136<br />
1,914 1,914<br />
Honolulu Neighbor Islands<br />
909 909<br />
240<br />
1,478 1,478<br />
360<br />
1991 1992 1993 1994 1995 1996 1997 1998 1999 2000 2001 2002 2003 2004<br />
1,450 1,450<br />
270<br />
340<br />
173<br />
1,922 1,922<br />
1,210 1,210<br />
2,419 2,419<br />
350<br />
115<br />
O'ahu Deaths * 10 Treatment Admissions<br />
146<br />
135<br />
Proceedings of the Community Epidemiology Work Group, Vol. II, January 2005<br />
645 645<br />
2,644 2,644<br />
540<br />
438 438<br />
2,677 2,677<br />
620<br />
308 308<br />
98<br />
3,182 3,182<br />
560<br />
1,516 1,516<br />
670
<strong>EPIDEMIOLOGIC</strong> TRENDS IN <strong>DRUG</strong> <strong>ABUSE</strong>—Honolulu, Hawai'i<br />
Exhibit 9. Methamphetamine-Related Police Case Data: 1991–2004<br />
Number of Cases<br />
1,200<br />
1,000<br />
800<br />
600<br />
400<br />
200<br />
0<br />
260<br />
SOURCES: Honolulu and Kona Police Departments<br />
Exhibit 10. ADAM Project Data: 2000–2003<br />
Percent<br />
60%<br />
50%<br />
40%<br />
30%<br />
20%<br />
10%<br />
0%<br />
Q1-<br />
2000<br />
SOURCE: ADAM, NIJ<br />
85 85<br />
434<br />
46 46<br />
915<br />
86 86<br />
589<br />
177 177<br />
254 254<br />
984<br />
502<br />
352 352<br />
742<br />
425 425<br />
1991 1992 1993 1994 1995 1996 1997 1998 1999 2000 2001 2002 2003 2004<br />
36.9<br />
29.2<br />
18.1<br />
9.5<br />
30.5<br />
8.0<br />
0.9<br />
Q2 Q3 Q4 Q1-<br />
2001<br />
35.0<br />
Proceedings of the Community Epidemiology Work Group, Vol. II, January 2005 95<br />
602<br />
385 385<br />
583<br />
342 342<br />
Honolulu Neighbor Islands<br />
30.2<br />
11.5<br />
1.9<br />
Q2 Q3 Q4 Q1-<br />
2002<br />
46.3<br />
699<br />
486 486<br />
631<br />
348 348<br />
616<br />
269 269<br />
33.7<br />
46.3<br />
11.6<br />
Q2 Q3 Q4 Q1-<br />
2003<br />
9.5<br />
2.1<br />
964<br />
Cocaine Marijuana Opiates Meth Alcohol<br />
243 243<br />
883<br />
Q2 Q3
<strong>EPIDEMIOLOGIC</strong> TRENDS IN <strong>DRUG</strong> <strong>ABUSE</strong>—Los Angeles County<br />
A Semiannual Update of Drug Abuse Patterns and Trends in<br />
Los Angeles County, California<br />
Beth Finnerty, M.P.H. 1<br />
ABSTRACT<br />
Two main themes continue to characterize the Los<br />
Angeles County-level substance abuse situation in<br />
the current reporting period (through June 2004): (1)<br />
a relatively stable or mixed pattern for many drugs<br />
and (2) increasing patterns for a few drugs, specifically<br />
methamphetamine. Despite the facts that Los<br />
Angeles is a distribution hub, transshipment area,<br />
and final destination for most, if not all, major drugs<br />
of abuse and local residents have ready access to<br />
most, if not all, illicit drugs and many diverted pharmaceuticals,<br />
heroin, crack cocaine, methamphetamine,<br />
and marijuana continue to dominate substance<br />
use/abuse indicator data in Los Angeles. With regards<br />
to treatment admissions, slightly less than one<br />
in four individuals entering a substance abuse treatment<br />
and recovery program in Los Angeles County<br />
self-report a primary heroin problem. Although primary<br />
heroin admissions constitute the largest percentage<br />
of all treatment and recovery admissions,<br />
their lead over the other major substances, such as<br />
alcohol, cocaine, and methamphetamine, remains<br />
marginal. The proportion of cocaine/crack admissions<br />
remained stable at 18 percent, while admissions<br />
for primary methamphetamine problems climbed<br />
higher in early 2004 to 21 percent of all admissions.<br />
Once again, the Los Angeles HIDTA led all California<br />
HIDTAs in terms of clandestine methamphetamine<br />
laboratory seizures, accounting for more than<br />
one-half of the 331 seizures made in California in the<br />
first half of 2004. Despite the steady decline in the<br />
number of methamphetamine laboratories in Los<br />
Angeles County specifically and the Los Angeles<br />
HIDTA in general, California is home of the domestic<br />
methamphetamine ‘superlab.’ Eighty-three percent<br />
of the 30 superlabs seized within the United<br />
States in the first half of 2004 were located in California;<br />
56 percent of those were located in four<br />
Southern California counties: Los Angeles, San Bernardino,<br />
Orange, and Riverside. Drug prices and<br />
purities were relatively stable in the first half of 2004,<br />
with small changes occurring at the midlevel and<br />
retail level for certain drugs. Los Angeles Countylevel<br />
California Poison Control System major drug<br />
exposure calls in the first half of 2004 were dominated<br />
by cocaine/crack, methamphetamine/ampheta-<br />
96<br />
mine, ecstasy, and heroin. Furthermore, among prescription<br />
and over-the-counter medication-related<br />
exposure calls, benzodiazepines were the most frequently<br />
mentioned category, followed by opiates/analgesics<br />
and Coricidin HBP. Adolescent substance<br />
use data gathered from the California Healthy Kids<br />
Survey for the 2003–2004 school year illustrated that<br />
lifetime and past-month usage percentages among<br />
Los Angeles County secondary school students in<br />
grades 7, 9, and 11 were either the same or lower<br />
than percentages reported in previous school years.<br />
Aside from alcohol, students were most likely to report<br />
lifetime marijuana use (20 percent), followed by<br />
inhalants (13 percent), cocaine or methamphetamine<br />
(each at 7 percent), and LSD/other psychedelics or<br />
ecstasy (each at 6 percent). Indicator data for prescription<br />
drugs, PCP, LSD, MDMA (ecstasy), and<br />
GHB remained limited, but use and abuse are reported<br />
among some of the nontraditional indicators.<br />
INTRODUCTI<strong>ON</strong><br />
Area Description<br />
1 The author is affiliated with UCLA Integrated Substance Abuse Programs, Los Angeles, California.<br />
Los Angeles County has the largest population<br />
(9,871,506, 2003 estimate) of any county in the Nation.<br />
If Los Angeles County were a State, it would<br />
rank ninth in population behind California, New<br />
York, Texas, Florida, Pennsylvania, Illinois, Ohio,<br />
and Michigan. Approximately 29 percent of California’s<br />
residents live in Los Angeles County. The<br />
population of Los Angeles County has increased 3.7<br />
percent since the 2000 Census. Nearly 90 percent of<br />
all Los Angeles County residents live within 88 incorporated<br />
cities; the remaining 10 percent reside in<br />
unincorporated areas of the county. The five most<br />
populated cities are, in descending order of population,<br />
Los Angeles (3,694,820), Long Beach (461,522),<br />
Glendale (194,973), Santa Clarita (151,088), and<br />
Pomona (149,473).<br />
Just over one-half of all Los Angeles County residents<br />
are female (50.6 percent) (exhibit 1). More than<br />
one-quarter (28.0 percent) are younger than 18; 10<br />
percent are older than 65. The racial and ethnic composition<br />
of Los Angeles County residents is quite<br />
diverse. Of those residents who report being of one<br />
Proceedings of the Community Epidemiology Work Group, Vol. II, January 2005
ace, just under one-half identify as White (47.8 percent),<br />
followed by Asians (11.9 percent), Blacks/African-Americans<br />
(9.8 percent), American Indians/Alaska<br />
Natives (0.8 percent), and Native Hawaiians/Other<br />
Pacific Islanders (0.3 percent). About one-quarter of<br />
residents (23.5 percent) identify with another race (not<br />
specified). Furthermore, 5 percent report two or more<br />
races. Residents of Hispanic/Latino origin may be of<br />
any race. Therefore, they are included in the appropriate<br />
racial categories above. Nearly 45 percent of Los<br />
Angeles County residents are of Hispanic/Latino origin;<br />
approximately 31 percent of Whites are not of<br />
Hispanic/Latino origin.<br />
According to an April 2004 Policy Brief from United<br />
American Indian Involvement and the UCLA Ralph<br />
and Goldy Lewis Center for Regional Policy Studies,<br />
3 percent of the Nation’s 3.7 million American Indians/Alaska<br />
Natives (AIs/ANs) reside in the Los Angeles<br />
area. The largest concentration of urbanized<br />
AIs/ANs is located in the county. Further, the local<br />
AI/AN population grew 35 percent from the 1990 to<br />
the 2000 U.S. Census, compared to the overall county<br />
growth of 7 percent.<br />
Los Angeles County encompasses approximately<br />
4,080 square miles and includes the islands of San<br />
Clemente and Santa Catalina. The county is bordered<br />
on the east by Orange and San Bernardino Counties,<br />
on the north by Kern County, on the west by Ventura<br />
County, and on the south by the Pacific Ocean. Los<br />
Angeles County’s coastline is 81 miles long.<br />
Two of the busiest maritime ports in the world—<br />
Long Beach and Los Angeles—are located in Los<br />
Angeles County. The Port of Long Beach is the Nation’s<br />
busiest maritime cargo container facility, while<br />
the Port of Los Angeles ranks second, according to a<br />
report by the National Drug Intelligence Center<br />
(NDIC) in 2001. Los Angeles County is also home to<br />
the world’s third busiest airport—Los Angeles International<br />
Airport. The airport handles more than 1,000<br />
cargo flights each day; 50 percent of this activity is<br />
international in origin or destination (NDIC 2001).<br />
Residents of Los Angeles County primarily rely on<br />
automobiles for transportation, and the Los Angeles<br />
area has one of the most intricate highway systems in<br />
the world. Of these, Interstates 5, 10, and 15 connect<br />
the area to the rest of the Nation. Interstate 5 runs<br />
from the U.S.-Canada border to the U.S.-Mexico<br />
border and links Los Angeles to other key west coast<br />
cities, such as San Diego, Oakland, San Francisco,<br />
Sacramento, Portland, and Seattle. Interstate 10<br />
originates in Santa Monica, California, and runs<br />
across the United States to I-95 in Jacksonville, Florida.<br />
Interstate 15 originates in the area and runs<br />
<strong>EPIDEMIOLOGIC</strong> TRENDS IN <strong>DRUG</strong> <strong>ABUSE</strong>—Los Angeles County<br />
northeast through Las Vegas, Nevada, to the U.S.-<br />
Canada border in Montana. In addition, State highways<br />
1 and 101 are extensively traveled roadways.<br />
The National Drug Threat Assessment 2004 identified<br />
14 primary drug market areas throughout the<br />
United States that serve as major consumption and<br />
distribution centers of cocaine, marijuana, methamphetamine,<br />
heroin, and methylenedioxymethamphetamine<br />
(MDMA or ecstasy). California is one of<br />
the most active drug smuggling and production areas<br />
in the United States and contains three market areas—Los<br />
Angeles, San Diego, and San Francisco.<br />
This is caused, in part, by the State’s proximity to the<br />
Pacific Ocean and Mexico. Los Angeles is a nationallevel<br />
transportation hub and distribution center, and it<br />
is the only primary market for all five of the major<br />
drugs of abuse listed above (NDIC 2004).<br />
Data Sources<br />
This report describes drug abuse trends in Los Angeles<br />
County from January 1997 to June 2004. Information<br />
was collected from the following sources:<br />
• Drug treatment data were derived from the<br />
California Department of Alcohol and Drug Programs<br />
(ADP), California Alcohol and Drug Data<br />
System (CADDS), and correspond to Los Angeles<br />
County alcohol and other drug treatment and<br />
recovery program admissions for July 2001 to<br />
June 2004. It should be noted that admissions for<br />
heroin treatment are disproportionately represented<br />
because of reporting requirements for facilities<br />
that use narcotic replacement therapy to<br />
treat heroin users. Both private and publicly<br />
funded narcotic treatment providers must report<br />
their admissions to the State, while for other<br />
drug types, only publicly funded providers must<br />
report.<br />
• DAWN emergency department (ED) data for<br />
the Los Angeles division of the Los Angeles<br />
metropolitan area were accessed from<br />
SAMHSA’s restricted-access database—DAWN<br />
Live!—for the first 6 months of 2004 (based on<br />
an update, January 18, 2005). Thirty-four of the<br />
79 eligible hospitals in the Los Angeles area are<br />
in the DAWN sample. The sample includes 37<br />
emergency departments (some hospitals have<br />
more than 1 ED). The data are incomplete, based<br />
on 23 to 26 EDs reporting each month over the<br />
6-month period. The data are unweighted and,<br />
thus, are not estimates for the Los Angeles area.<br />
The data cannot be compared to DAWN data for<br />
2002 and before, nor can the preliminary data be<br />
used for comparison with future data. Only<br />
Proceedings of the Community Epidemiology Work Group, Vol. II, January 2005 97
98<br />
weighted DAWN data released by SAMHSA can<br />
be used for trend analysis. The preliminary unweighted<br />
data for the first half of 2004 represent<br />
drug reports in drug-related visits; reports exceed<br />
the number of visits since a patient may report<br />
use of multiple drugs (up to six drugs and alcohol).<br />
The analysis for this paper includes the<br />
“major substances of abuse” as well as prescription<br />
drug misuse. For major substances of abuse,<br />
all case types are included (i.e., suicide attempt,<br />
seeking detoxification, alcohol only [
As a percentage of the total, cocaine admissions have<br />
remained quite stable at 18 to 20 percent for several<br />
CEWG reporting periods (exhibit 4). Alcohol was the<br />
most commonly reported secondary drug problem<br />
among primary cocaine admissions (38 percent) (exhibit<br />
5), followed by marijuana (19 percent). Smoking<br />
is the reported route of administration for 86 percent<br />
of all cocaine admissions, followed by inhalation<br />
(10 percent). When asked whether they had used any<br />
drug intravenously in the year prior to admission,<br />
approximately 5 percent of all primary cocaine admissions<br />
reported that they had used needles to administer<br />
one or more drugs intravenously at least<br />
once during the specified time period (exhibit 6).<br />
Sixty-seven percent of the primary cocaine admissions<br />
reported in the first half of 2004 were male,<br />
identical to the gender breakdown seen in the second<br />
half of 2003. Black non-Hispanics continued to<br />
dominate cocaine admissions (at 57 percent), followed<br />
by Hispanics (21 percent) and White non-<br />
Hispanics (15 percent). In terms of age at admission,<br />
nearly 40 percent were concentrated in the 36–45<br />
year age group; an additional 23 percent of all primary<br />
cocaine admissions were between the ages of<br />
26 and 35.<br />
Primary cocaine treatment admissions are more likely<br />
than treatment admissions for any other substance<br />
(alcohol, prescription medications, or illicit drugs) to<br />
report being homeless at admission (28 percent). The<br />
proportion of cocaine admissions referred to treatment<br />
through the criminal justice system in the first<br />
half of 2004 continued to decrease slightly to 20 percent<br />
of all admissions. More frequently mentioned<br />
referral sources included self-referral (33 percent) or<br />
referral through Proposition 36 (a.k.a. SACPA)<br />
court/probation (29 percent). Although one-third of<br />
primary cocaine admissions had never been admitted<br />
to treatment for a primary cocaine problem, approximately<br />
one-half (47 percent) had one or two prior<br />
treatment episodes. Forty-six percent earned a high<br />
school diploma or GED. At the time of admission,<br />
approximately 15 percent were employed either full-<br />
or part-time.<br />
Preliminary unweighted data accessed from DAWN<br />
Live! for the first half of 2004 indicate that of the<br />
4,688 major substances of abuse reported in the Los<br />
Angeles division, 1,263 (27 percent) were cocaine/crack<br />
(exhibit 7). Cocaine was the second most<br />
likely major substance to be reported, following alcohol.<br />
Seventy percent of the patients reporting cocaine<br />
use were male; 40 percent were Black (followed<br />
by 31 percent Hispanic and 24 percent White);<br />
35 percent were age 35–44; and 60 percent reported<br />
smoking crack. A total of 2,846 chief complaints<br />
<strong>EPIDEMIOLOGIC</strong> TRENDS IN <strong>DRUG</strong> <strong>ABUSE</strong>—Los Angeles County<br />
were logged for patients reporting cocaine. The top<br />
three complaints were psychiatric condition (694<br />
complaints), altered mental status (691 complaints),<br />
and intoxication (592 complaints). Cocaine-using<br />
patients were most likely to be discharged home (39<br />
percent) or admitted to a psychiatric inpatient ward<br />
(33 percent).<br />
California Poison Control System calls involving the<br />
use of cocaine/crack by Los Angeles County residents<br />
increased from 69 in 2000 to a high of 97 in<br />
2003. In the first 6 months of 2004 alone, 41 calls<br />
involving cocaine/crack were received (exhibit 8a).<br />
Between January 2003 and June 2004, 68 percent of<br />
the cocaine-exposed callers were male, and 51 percent<br />
were between the ages of 26 and 44 (exhibit 9).<br />
An additional 20 percent were between the ages of 18<br />
and 25.<br />
According to CHKS data for the 2003–2004 school<br />
year (exhibit 10), 7.4 percent of all Los Angeles<br />
County secondary school students (including 7th, 9th,<br />
and 11th graders, and a small sample of nontraditional<br />
students) who responded to the survey had ever<br />
used cocaine (crack or powder), and 3.8 percent were<br />
current cocaine users (defined as any use in the past<br />
30 days). A breakdown of the data by grade level<br />
illustrated that among responding ninth graders, 5.4<br />
percent had ever used cocaine and 3.0 percent were<br />
current cocaine users. A higher percentage of 11th<br />
graders than 9th graders reported current cocaine/crack<br />
use in the past 30 days. Of the lifetime<br />
cocaine users, 55 percent were male and 45 percent<br />
were female. The gender distribution was slightly<br />
wider for past-30-day use of cocaine (63 percent<br />
male vs. 37 percent female). Frequent cocaine use is<br />
defined as 20 or more days of use in the previous 30<br />
days. Twenty-four percent of the current cocaine users<br />
reported frequent use. Among the frequent users,<br />
74 percent were male. When asked about past-6month<br />
use of cocaine (any form), methamphetamine,<br />
or other stimulants, 7.1 percent of 9th graders and 6.5<br />
percent of 11th graders responded in the affirmative<br />
(exhibit 11).<br />
According to long-term trends calculated from CHKS<br />
data spanning over the most recent 5 school years<br />
(exhibit 12), the pattern of past-30-day cocaine<br />
(powder or crack) use among responding secondary<br />
school students was similar to usage patterns for<br />
some of the other licit and illicit drugs, such as lysergic<br />
acid diethylamide (LSD)/other psychedelics and<br />
methamphetamine. Past-30-day cocaine/crack use<br />
decreased consistently from the peak level seen in<br />
1999–2000 (4.9 percent) to 3.8 percent in 2002–<br />
2003. In 2003–2004, current cocaine use remained<br />
stable at 3.8 percent of all respondents.<br />
Proceedings of the Community Epidemiology Work Group, Vol. II, January 2005 99
A total of 5,425 cocaine arrests was made within the<br />
city of Los Angeles in the first half of 2004. This represented<br />
a 5-percent increase from the number of cocaine<br />
arrests made during the same time period in<br />
2003. Cocaine arrests accounted for 30.4 percent of all<br />
narcotics arrests made between January 1 and June 30,<br />
2004. Citywide cocaine (including crack and powder)<br />
seizures increased 120 percent, from 546.6 pounds<br />
seized in the first half of 2003 to 1,204.1 pounds seized<br />
in the first half of 2004. The street value of the seized<br />
cocaine accounted for 29 percent of the total street<br />
value of all drugs seized in the first half of 2004.<br />
Data from NFLIS for October 2003 to September 2004<br />
showed that out of 54,240 analyzed items reported by<br />
participating laboratories within Los Angeles County,<br />
37.9 percent (20,564) of all items analyzed were found<br />
to be cocaine/crack. Cocaine/crack was the most likely<br />
illicit drug to be found among items tested in the<br />
county, followed closely by methamphetamine.<br />
Los Angeles remains one of the primary markets for<br />
cocaine (in addition to Houston, Chicago, New York,<br />
Atlanta, and Miami; NDIC 2004). Mexican and Colombian<br />
traffickers control the wholesale distribution<br />
of cocaine and crack in Los Angeles; African-<br />
American and Hispanic street gangs control distribution<br />
at the retail level. All substance use and abuse<br />
indicators are higher for crack than for powder cocaine.<br />
Despite this, powder cocaine availability and<br />
use is reported in the area. Current midlevel prices of<br />
crack cocaine remained level (as compared to the June<br />
2004 report) at $500–$1,200 per ounce (exhibit 13), as<br />
did the retail price range ($10–$40 per rock). The current<br />
wholesale price for 1 kilogram of powder cocaine<br />
ranges from $14,000 to $17,000, which is identical to<br />
the wholesale price cited in the past few CEWG reports.<br />
The current midlevel and retail prices of powder<br />
cocaine remained stable, as well, at $500–$600 per<br />
ounce and $80 per gram. The purity of powder cocaine<br />
is approximately 78 percent, similar to the purity cited<br />
in the last few CEWG reports.<br />
Heroin<br />
From January to June 2004, just under 7,000 Los<br />
Angeles County treatment and recovery program<br />
admissions were attributable to primary heroin abuse,<br />
compared with 6,704 admissions reported in the<br />
county in the second half of 2003 (exhibit 3). In<br />
2003, it was thought that heroin admissions were<br />
leveling off at roughly 25.4 percent of all admissions,<br />
after several half-year decreases. In the first half of<br />
2004, however, the proportion of primary heroin admissions<br />
among all Los Angeles County treatment<br />
and recovery programs decreased slightly to 24.5<br />
percent of all admissions. It will be interesting to see<br />
100<br />
<strong>EPIDEMIOLOGIC</strong> TRENDS IN <strong>DRUG</strong> <strong>ABUSE</strong>—Los Angeles County<br />
whether heroin admissions continue to decrease in<br />
the remainder of 2004 and into 2005. Despite the<br />
consistent decline over recent years, heroin admissions<br />
continue to marginally account for the highest<br />
percentage of all treatment and recovery program<br />
admissions in the county.<br />
Demographics of heroin admissions have remained<br />
stable over recent reporting periods. In the first half<br />
of 2004, primary heroin admissions were predominantly<br />
male (71.7 percent), more likely to be age 45–<br />
50 (21.0 percent), and somewhat more likely to be<br />
Hispanic (40.2 percent) than White non-Hispanic<br />
(40.0 percent) or Black non-Hispanic (11.9 percent)<br />
(exhibit 5). Compared with other major types of illicit<br />
drug admissions, primary heroin admissions in the<br />
first half of 2004 had the largest proportion of users<br />
age 36 and older (72 percent). Just over one-third (34<br />
percent) of all primary heroin admissions initiated<br />
their heroin use prior to age 18, which is quite low<br />
compared to other primary substances, such as alcohol,<br />
marijuana, methamphetamine, and phencyclidine<br />
(PCP). If primary heroin admissions abused another<br />
drug secondarily to heroin, it was most likely to be<br />
cocaine/crack (21 percent), followed by alcohol (12<br />
percent).<br />
Heroin administration patterns remained stable in the<br />
first half of 2004, with injectors accounting for 86<br />
percent, smokers accounting for 9 percent, and inhalers<br />
(snorters) accounting for 4 percent. When asked<br />
whether they had used any drug intravenously in the<br />
year prior to admission, 88 percent of all primary<br />
heroin admissions reported that they had used needles<br />
to administer one or more drugs intravenously at least<br />
once during the specified time period (exhibit 6).<br />
Sixteen percent of all primary heroin admissions<br />
were homeless at time of admission, and only 4 percent<br />
were referred by the court or criminal justice<br />
system (exhibit 5). Primary heroin users were most<br />
likely to have self-referred themselves for the current<br />
treatment episode (72 percent of all heroin admissions).<br />
In a measure of current legal status, the majority<br />
(75 percent) were not involved at all with the<br />
criminal justice system. This corroborates with the<br />
very low proportion of criminal justice referrals<br />
among primary heroin users. Fifteen percent indicated<br />
that they had never received treatment for their<br />
heroin problem, whereas 50 percent reported three or<br />
more primary heroin treatment episodes. Forty-nine<br />
percent of all primary heroin admissions graduated<br />
from high school, and, at the time of admission, 20<br />
percent were employed full- or part-time.<br />
Preliminary unweighted data accessed from DAWN<br />
Live! for the first half of 2004 indicate that of the<br />
Proceedings of the Community Epidemiology Work Group, Vol. II, January 2005
4,688 major substances of abuse reported in the Los<br />
Angeles division, 289 (6 percent) were heroin (exhibit<br />
7). Heroin was the fifth most likely major substance<br />
to be reported, following alcohol, cocaine,<br />
stimulants (amphetamines and methamphetamine),<br />
and marijuana. Seventy percent of the patients reporting<br />
heroin use were male; 42 percent were Hispanic<br />
(followed by 40 percent White and 16 percent<br />
Black); 34 percent were age 45–54; and 82 percent<br />
reported injecting heroin. A total of 615 chief complaints<br />
were logged for individuals reporting heroin.<br />
The top three complaints were psychiatric condition<br />
(103 complaints); intoxication (101 complaints); and<br />
abscesses, cellulitis, and skin/tissue problems (69<br />
complaints). Heroin-using patients were most likely<br />
to be discharged home (36 percent) or admitted to a<br />
psychiatric inpatient ward (28 percent).<br />
Los Angeles County-based California Poison Control<br />
System calls involving exposure to heroin fluctuated<br />
between 15 and 20 from 2000 to 2003 (exhibit 8a). In<br />
the first half of 2004 alone, 11 heroin exposure calls<br />
were reported, which may indicate a shifting upward<br />
trend. Between January 2003 and June 2004, 79 percent<br />
of the heroin-exposed callers were male, and 67<br />
percent were between the ages of 26 and 54. An additional<br />
11 percent of the callers were between the ages<br />
of 18 and 25.<br />
According to CHKS data for the 2003–2004 school<br />
year (exhibit 10), 3.3 percent of all Los Angeles<br />
County secondary school students (including 7th, 9th,<br />
and 11th graders, and a small sample of nontraditional<br />
students) who responded to the survey had<br />
ever used heroin. A breakdown of the data by grade<br />
level illustrated that lifetime heroin use was nearly<br />
identical among responding 9th graders (3.1 percent)<br />
and 11th graders (3.0 percent). When asked about<br />
past-6-month use of other drugs, heroin, or sedatives,<br />
6.3 percent of 9th graders and 5.2 percent of 11th<br />
graders responded in the affirmative (exhibit 11).<br />
A total of 441 heroin arrests were made within the<br />
city of Los Angeles from January 1 to June 30, 2004.<br />
This represented a 30-percent increase from the number<br />
of heroin arrests made in the first half of 2003.<br />
Heroin arrests accounted for approximately 2.5 percent<br />
of all narcotics arrests made from January 1 to<br />
June 30, 2004.<br />
Eight and one-half pounds of black tar heroin were<br />
seized within the city of Los Angeles in the first half of<br />
2004, a decline of 4 percent from the amount seized<br />
during the same time in 2003. Similarly, seizures of<br />
other types of heroin decreased by 15 percent, from 8.9<br />
pounds seized in the first half of 2003 to 7.6 pounds<br />
seized during the first half of 2004. The street value of<br />
<strong>EPIDEMIOLOGIC</strong> TRENDS IN <strong>DRUG</strong> <strong>ABUSE</strong>—Los Angeles County<br />
all seized heroin accounted for 5 percent of the total<br />
street value of all drugs seized in the first half of 2004.<br />
According to NFLIS data based on 54,240 analyzed<br />
items reported by participating laboratories within Los<br />
Angeles County between October 1, 2003, and September<br />
30, 2004, only 3.9 percent (2,131) of all items<br />
analyzed were found to be heroin. This small proportion<br />
corresponds to the small proportion of heroin<br />
(black tar and other forms) reported among Los Angeles<br />
City seizures.<br />
As in the past, Los Angeles is the primary market for<br />
Mexican black tar heroin, and to a lesser extent,<br />
brown powder heroin distributed to other Western<br />
States (NDIC 2004). In addition, Mexican black tar<br />
heroin remains the predominant type of heroin used<br />
by Los Angeles County users. Mexican criminal<br />
groups control the transportation and wholesale, midlevel,<br />
and retail activity (NDIC 2004). According to<br />
LA CLEAR, the wholesale price per kilogram of<br />
Mexican black tar heroin is approximately $20,000<br />
(the same price reported in the last few CEWG reports)<br />
(exhibit 13). The current mid-level and retail<br />
prices are $500–$800 per “pedazo” (Mexican ounce)<br />
and $90–$100 per gram, which are stable since the<br />
last report. A regular ounce is 28.5 grams, whereas a<br />
pedazo is 25.0 grams.<br />
Mexican brown powder heroin sells for a wholesale<br />
price of $25,000 per kilogram, when available in the<br />
area. Retail distribution of Southeast Asian heroin<br />
remains limited, but it is associated with a wholesale<br />
price range of $35,000–$40,000 for a 300–350-gram<br />
unit and $70,000–$80,000 for a 700–750-gram unit.<br />
The lack of China white on the streets is related, in<br />
part, to local users’ preference for black tar.<br />
The LA HIDTA and NDIC continue to report that Colombian<br />
drug trafficking organizations may be establishing<br />
networks within the Los Angeles area to distribute<br />
South American heroin. The wholesale price<br />
for a kilogram of Colombian heroin is $86,000–<br />
$100,000. This type of heroin has a purity level of 94<br />
percent. The LA HIDTA also reports that because the<br />
Los Angeles metropolitan area has one of the largest<br />
Middle Eastern populations in the United States,<br />
Southwest Asian opium trafficking activities have increased<br />
in the area. Southwest Asian opium is associated<br />
with a cost of $650–$800 for an 18-gram stick.<br />
Other Opiates/Narcotics<br />
Other opiates/synthetics continue to constitute a marginal<br />
proportion of all Los Angeles County treatment<br />
admissions. Their representation as a primary drug of<br />
abuse has increased slightly in the local treatment<br />
Proceedings of the Community Epidemiology Work Group, Vol. II, January 2005 101
data, however, rising from 1.5 percent of all admissions<br />
in 1999 to 2.1 percent (583 admissions) in the<br />
first half of 2004. The number of other opiate/synthetic<br />
admissions reported in the first half of<br />
2004 was 10 percent lower than the number of primary<br />
other opiates/synthetic admissions reported in<br />
the second half of 2003, but nearly identical to the<br />
number of other opiate/synthetic admissions reported<br />
in the first half of 2003 (n=582). Despite the small<br />
overall numbers of admissions, it will be important to<br />
carefully monitor future treatment admissions data,<br />
given the increase in prescription opiate abuse/misuse<br />
in other major CEWG areas. Other opiates/synthetics<br />
admissions were typically male (60 percent), White<br />
non-Hispanic (74 percent), and age 36–50 (52 percent).<br />
Only 1 percent of the primary other opiate/<br />
synthetic admissions were younger than 18. Interestingly,<br />
80 percent administered other opiates/synthetics<br />
orally, but an additional 16 percent reported<br />
smoking. Sixty-one percent of primary other opiate/synthetic<br />
admissions reported no secondary or<br />
tertiary substance use. An additional 12 percent reported<br />
secondary alcohol use, and 7.5 percent reported<br />
secondary cocaine/crack use. Reports of primary<br />
non-prescription methadone admissions continued<br />
to be minimal among Los Angeles County treatment<br />
admissions (47 admissions, 0.2 percent of all<br />
admissions).<br />
In addition to encompassing major substances of<br />
abuse, unweighted data accessed from DAWN Live!<br />
cover pharmaceutical drug categories, such as psychotherapeutic<br />
agents (antidepressants, antipsychotics,<br />
anxiolytics, sedatives and hypnotics, and central<br />
nervous system [CNS] stimulants), CNS agents (analgesics,<br />
anticonvulsants, antiparkinson agents, and<br />
muscle relaxants), respiratory agents, cardiovascular<br />
agents, and anti-infectives. The case types that are of<br />
interest for pharmaceuticals include seeking detoxification,<br />
overmedication, and other. Of the 1,318<br />
pharmaceuticals falling within these three case types<br />
in the first half of 2004 in the Los Angeles division,<br />
164 (12 percent) were opiates/opioids and an additional<br />
169 (13 percent) were other analgesics (exhibit<br />
14). For the opiates/opioids, overmedication was the<br />
most frequently stated case type (43 percent of opiates/opioids),<br />
followed closely by “other” (41 percent)<br />
and more distantly by seeking detoxification<br />
(16 percent). Among other analgesics, 82 percent<br />
(139) of the drugs were reported as overmedication<br />
cases.<br />
Los Angeles County-based California Poison Control<br />
System calls involving exposure to opiates/analgesics<br />
increased from a low of 25 in 2000 to a high of 67 in<br />
2003 (exhibit 8b). In the first half of 2004 alone, 31<br />
opiate/analgesic exposure calls were reported, which<br />
102<br />
<strong>EPIDEMIOLOGIC</strong> TRENDS IN <strong>DRUG</strong> <strong>ABUSE</strong>—Los Angeles County<br />
may indicate a stabilizing of the trend line. Between<br />
January 2003 and June 2004, calls involving an exposure<br />
to hydrocodone were more likely than calls involving<br />
an exposure to oxycodone (58 calls vs. 11<br />
calls, respectively).<br />
Approximately 688 of the 54,240 items analyzed and<br />
reported to NFLIS between October 1, 2003, and September<br />
30, 2004, were identified as pharmaceuticals/prescription/non-controlled<br />
non-narcotic medications<br />
(as opposed to illicit substances). Of those, more<br />
than one-half (361 items; 52.5 percent) were found to<br />
be narcotic/other analgesics. The most frequently cited<br />
analgesics were hydrocodone (204 items; 57 percent)<br />
and codeine (62 items; 17 percent). Other analgesics<br />
identified included methadone (35 items), oxycodone<br />
(21 items), and propoxyphene (10 items). To put these<br />
numbers/percentages into perspective, analgesics accounted<br />
for 0.7 percent of all items analyzed by participating<br />
Los Angeles County laboratories.<br />
Efforts are underway throughout Los Angeles to<br />
quantify the extent of pharmaceutical diversion to the<br />
street. One result of this effort is the availability of<br />
expanded prices for diverted opiates/analgesics. According<br />
to LA CLEAR, Vicodin, a member of the<br />
hydrocodone family of opiate pain relievers, continues<br />
to retail for $5 per 5-milligram tablet in Los Angeles<br />
County (exhibit 13). OxyContin, the trade name<br />
for the powerful analgesic oxycodone hydrochloride,<br />
sells on the streets for $1 per milligram. LA CLEAR<br />
reports reveal that OxyContin is “readily available”<br />
in the LA HIDTA. Percocet sells for $5–$10 per 5milligram<br />
tablet; MS Contin sells for $20 per 60milligram<br />
tablet; codeine sells for $5 per tablet; Dilaudid<br />
(hydromorphone) sells for $100 per 4milligram<br />
tablet; fentanyl patches sell for $25–$100<br />
each; and methadone sells for $10 per tablet.<br />
Marijuana<br />
From the first to second half of 2003, the number of<br />
primary marijuana treatment admissions decreased 6<br />
percent (exhibit 3). A reversal of this decreasing trend<br />
was observed in early 2004. From the second half of<br />
2003 to the first half of 2004, primary marijuana admissions<br />
increased 10 percent (from 3,452 admissions<br />
to 3,812 admissions). As a percentage of the total,<br />
marijuana accounted for 13.4 percent of all admissions<br />
reported in January–June 2004. Like many of the other<br />
major drugs of abuse, the user demographics of primary<br />
marijuana admissions were relatively stable in<br />
the first half of 2004. Three out of four primary marijuana<br />
admissions were male, and individuals younger<br />
than 18 constituted 48 percent of these admissions<br />
(exhibit 5). Primary marijuana admissions were most<br />
likely to be Hispanic (48 percent), followed by Black<br />
Proceedings of the Community Epidemiology Work Group, Vol. II, January 2005
non-Hispanics (27 percent) and White non-Hispanics<br />
(17 percent).<br />
Alcohol was identified as a secondary drug problem<br />
for 41 percent of the primary marijuana admissions in<br />
the second half of 2003. An additional 14 percent reported<br />
methamphetamine, and 8 percent reported cocaine/crack<br />
as their secondary drug problem. Compared<br />
with other major illicit drug admissions, primary<br />
marijuana admissions had the largest proportion of<br />
males (75 percent) and users age 17 and younger (48<br />
percent). When asked whether they had used any drug<br />
intravenously in the year prior to admission, less than 2<br />
percent of all primary marijuana admissions answered<br />
affirmatively (exhibit 6).<br />
Approximately 7 percent of the primary marijuana<br />
treatment admissions in the first half of 2004 were<br />
homeless at the time of admission, and 32 percent<br />
were referred to treatment by the court or criminal<br />
justice system (most likely by the juvenile justice<br />
system, given the large proportion of adolescents<br />
represented among primary marijuana admissions).<br />
Sixty-seven percent were entering treatment for the<br />
first time. Twenty-six percent had graduated from<br />
high school, and, at the time of admission, 14 percent<br />
were employed full- or part-time. Such characteristics<br />
reflect the fact that just under one-half of all primary<br />
marijuana admissions were younger than 18 at the<br />
time of admission.<br />
Preliminary unweighted data accessed from DAWN<br />
Live! for the first half of 2004 indicate that of the<br />
4,688 major substances of abuse reported in the Los<br />
Angeles division, 516 (11 percent) were marijuana<br />
reports (exhibit 7). Marijuana was the fourth most<br />
likely major substance to be reported, following alcohol,<br />
cocaine, and stimulants. Sixty-seven percent of<br />
the patients reporting marijuana use were male; 40<br />
percent were Hispanic (followed by 24 percent Black<br />
and 22 percent White); and 61 percent were age 12–<br />
29. A total of 1,094 chief complaints were logged for<br />
individuals reporting marijuana. The top three complaints<br />
were intoxication (298 complaints), altered<br />
mental status (231 complaints), and psychiatric condition<br />
(197 complaints). Marijuana-using patients<br />
were most likely to be discharged home (54 percent)<br />
or admitted to a psychiatric inpatient ward (21 percent).<br />
California Poison Control System calls involving<br />
exposure to marijuana among Los Angeles County<br />
residents were stable at 35–39 calls between 2000<br />
and 2003 (exhibit 8a). In the first half of 2004, marijuana-related<br />
exposure calls plummeted to eight calls.<br />
Between January 2003 and June 2004, 74 percent of<br />
<strong>EPIDEMIOLOGIC</strong> TRENDS IN <strong>DRUG</strong> <strong>ABUSE</strong>—Los Angeles County<br />
the marijuana-exposed callers were male, and 81 percent<br />
were age 25 or younger.<br />
According to CHKS data for the 2003–2004 school<br />
year (exhibit 10), 19.8 percent of all Los Angeles<br />
County secondary school students (including 7th, 9th,<br />
and 11th graders, and a small sample of nontraditional<br />
students) who responded to the survey had<br />
ever used marijuana, and 10.3 percent were current<br />
marijuana users (defined as any use in the past 30<br />
days). A breakdown of the data by grade level illustrated<br />
that among responding seventh graders, 7.3<br />
percent had ever used marijuana and 4.3 percent were<br />
current marijuana users. A higher percentage of 9th<br />
graders than 7th graders and a higher percentage of<br />
11th graders than 9th graders reported current marijuana<br />
use in the past 30 days. When asked about past-<br />
6-month use of marijuana, 9.2 percent of 7th graders,<br />
15.9 percent of 9th graders, and 22.7 percent of 11th<br />
graders responded in the affirmative (exhibit 11).<br />
According to long-term trends calculated from CHKS<br />
data spanning over the most recent 5 school years<br />
(exhibit 12), the pattern of past-30-day marijuana use<br />
among responding secondary school students was<br />
more likely than the use of many other drugs, but<br />
slightly less likely than binge drinking. Past-30-day<br />
marijuana use has decreased consistently from the<br />
peak level of 13.2 percent seen in 1999–2000 to 10.3<br />
percent in 2003–2004.<br />
According to NFLIS data based on 54,240 analyzed<br />
items reported by participating laboratories within Los<br />
Angeles County between October 2003 and September<br />
2004, 23 percent (12,210) of all items analyzed were<br />
found to be cannabis. Cannabis was the third most<br />
frequently identified substance in Los Angeles County.<br />
A total of 3,151 marijuana arrests were made within<br />
the city of Los Angeles in the first half of 2004; this<br />
represents a 15-percent increase over the number of<br />
marijuana arrests made during the same time period in<br />
2003 (2,738). Marijuana arrests accounted for approximately<br />
18 percent of all narcotics arrests made<br />
between January 1 and June 30, 2004.<br />
Marijuana continues to dominate drug seizures in the<br />
city of Los Angeles. The amount of marijuana seized<br />
increased nearly 200 percent, from 9,285.5 pounds in<br />
the first half of 2003 to 27,691 pounds in the first half<br />
of 2004. Between January and June 2004, the amount<br />
of marijuana seized accounted for more than 95 percent<br />
of the total weight of drugs (in pounds) seized.<br />
Cocaine was a very distant second, accounting for an<br />
additional 4 percent of the total weight. The street<br />
value of the seized marijuana accounted for approximately<br />
56 percent of the total street value of all drugs<br />
seized in the first half of 2004.<br />
Proceedings of the Community Epidemiology Work Group, Vol. II, January 2005 103
According to NDIC, California and Mexico appear to<br />
supply most of the marijuana available throughout<br />
the United States. In addition, cultivation of marijuana<br />
on U.S. public lands is widespread, especially<br />
in California. This is evidenced by the fact that more<br />
than two-thirds of all cannabis plants eradicated from<br />
National Forest System lands were located in California<br />
(NDIC 2004). Caucasian, Mexican, and Jamaican<br />
trafficking groups are responsible for the wholesale<br />
distribution of marijuana to Los Angeles. Street<br />
gangs and independent dealers distribute domestic-<br />
and Mexican-grown marijuana in both Los Angeles<br />
and San Diego (NDIC 2004). The wholesale price of<br />
Mexican-grade marijuana ranges from $300 to $400<br />
per pound (exhibit 13). The midlevel and retail prices<br />
of commercial grade marijuana are $60–$80 per<br />
ounce and $10 per gram. All prices have been stable<br />
since early 2003. The wholesale price of domestic<br />
mid-grade marijuana ranges from $1,000 to $1,200<br />
per pound. Midlevel and retail prices are $200–$250<br />
per ounce and $25 per gram. The wholesale price of<br />
high-grade sinsemilla is $2,500–$6,000 per pound.<br />
An ounce of sinsemilla sells for $300–$600 per<br />
ounce, and one-eighth ounce sells for $60–$80.<br />
Indications regarding the local availability of “BC<br />
Bud,” a hybrid type of cannabis bud grown in Canadian<br />
British Columbia, continue to circulate. A pound<br />
of BC Bud, which would cost approximately $1,500<br />
in Vancouver, has a wholesale per pound value of<br />
$6,000 in Los Angeles. Supposedly, a pound of BC<br />
Bud can be swapped straight across for a pound of<br />
cocaine. Demand for hashish, the compressed form of<br />
tetrahydrocannabinol (THC)-rich resinous cannabis<br />
material, remained limited throughout the Los Angeles<br />
HIDTA. When it is available, it has a wholesale<br />
price of $8,000 per pound.<br />
Stimulants<br />
The proportion of primary methamphetamine admissions<br />
to Los Angeles County treatment and recovery<br />
programs increased further from the second half of<br />
2003 to the first half of 2004, breaking the 20 percent<br />
mark for the first time ever (exhibit 3). The 5,840<br />
primary methamphetamine admissions reported in<br />
January–June 2004 accounted for 20.6 percent of all<br />
admissions. Methamphetamine is the one illicit drug<br />
that has continually increased among treatment admissions<br />
over the past 4 years (exhibit 4). Compared<br />
with other major illicit drug admissions, primary<br />
methamphetamine admissions had the largest proportion<br />
of females (39.9 percent), White Non-Hispanics<br />
(41.4 percent), Asian/Pacific Islanders (3.4 percent),<br />
18–25-year-olds (30.4 percent), and 26–35-year-olds<br />
(33.8 percent) (exhibit 5).<br />
104<br />
<strong>EPIDEMIOLOGIC</strong> TRENDS IN <strong>DRUG</strong> <strong>ABUSE</strong>—Los Angeles County<br />
The closing of the racial/ethnic gap between White<br />
non-Hispanic and Hispanic methamphetamine treatment<br />
admissions continued in the first half of 2004.<br />
The proportion of White non-Hispanics decreased<br />
further to 41.4 percent, whereas the proportion of<br />
Hispanics increased to 41.9 percent.<br />
At one time, females accounted for 49 percent of<br />
both primary methamphetamine and other amphetamine<br />
admissions. This practically equal distribution<br />
of males and females was unique to methamphetamine<br />
and other amphetamines. The shifting<br />
gender distribution with methamphetamine treatment<br />
admissions has been discussed in detail in recent reports.<br />
In the second half of 2003, the percentage of<br />
females among primary other amphetamine admissions<br />
plummeted to 36.8 percent. In early 2004, however,<br />
the proportion of females climbed back up a bit<br />
to 40 percent of all admissions. It is important to<br />
monitor this drug category to see if the gender distribution<br />
will return to equitable proportions, or if this<br />
is a one-time reporting issue.<br />
In the second half of 2003, primary amphetamine<br />
admissions were most likely to fall within the 31–35<br />
age group (23.6 percent), which was the modal age<br />
group in the second half of 2002. Between January<br />
and June 2004, however, primary amphetamine admissions<br />
were most likely to fall within the 26–30<br />
age group (20.6 percent). Primary amphetamine admissions<br />
were more likely to be Hispanic (40.7 percent)<br />
than White non-Hispanic (31.0 percent). Primary<br />
methamphetamine and other amphetamine admissions<br />
tended to most frequently report secondary<br />
abuse of alcohol or marijuana.<br />
As shown in exhibit 5, smoking continued as the<br />
most frequently mentioned way for primary methamphetamine<br />
admissions to administer the drug. In<br />
1999, one-half of all primary methamphetamine admissions<br />
smoked the drug. By the first half of 2004,<br />
67.9 percent reported this mode of administration.<br />
Conversely, the proportions of injectors and inhalers<br />
continued to decline, from 15.2 and 29.5 percent,<br />
respectively, in 1999, to 7.1 and 20.4 percent, respectively,<br />
in the first half of 2004.<br />
Like primary methamphetamine admissions, the mode<br />
of other amphetamine administration has shifted in<br />
recent years, as well. Nearly three out of five of all<br />
other amphetamine admissions in the first half of 2004<br />
smoked amphetamines (59.3 percent), followed by<br />
22.8 percent who inhaled, 11.7 percent who ingested<br />
orally, and 2.8 percent who injected. In 1999, a lower<br />
percentage smoked, and higher percentages injected,<br />
inhaled, and used other amphetamines orally.<br />
Proceedings of the Community Epidemiology Work Group, Vol. II, January 2005
Twelve percent of all primary methamphetamine admissions<br />
reported past-year intravenous use of one or<br />
more drugs (exhibit 6). Approximately one-fifth of the<br />
primary methamphetamine treatment admissions<br />
were homeless (20.1 percent) and referred by the<br />
court or criminal justice system (20.0 percent). Fortysix<br />
percent were entering treatment for the first time.<br />
Forty-two percent had graduated from high school,<br />
and, at the time of admission, 18.3 percent were employed<br />
full- or part-time.<br />
Preliminary unweighted data accessed from DAWN<br />
Live! for the first half of 2004 indicate that of the<br />
4,688 major substances reported in the Los Angeles<br />
division, 658 (14 percent) were stimulants (exhibit 7).<br />
The stimulant category encompasses amphetamines<br />
and methamphetamine. Stimulants were the third<br />
most likely major substance to be reported, following<br />
alcohol and cocaine. For the remainder of the DAWN<br />
discussion, stimulant user demographics will be broken<br />
down into amphetamines and methamphetamine.<br />
According to the unweighted DAWN data, 75 percent<br />
of the patients reporting methamphetamine use<br />
were male and 52 percent were Hispanic (followed<br />
by 33 percent White and 3 percent Black). More than<br />
one-half (55 percent) were age 25–44, and an additional<br />
30 percent were 18–24. The three most frequently<br />
reported complaints were intoxication (269<br />
complaints), altered mental status (258 complaints),<br />
and psychiatric condition (254 complaints). Methamphetamine-using<br />
patients were most likely to be discharged<br />
home (41 percent) or admitted to a psychiatric<br />
inpatient ward (38 percent).<br />
Fifty-five percent of the ED patients reporting amphetamines<br />
were male, and 56 percent were Hispanic<br />
(followed by 24 percent White and 8 percent Black).<br />
Fifty-six percent were age 25–44, and an additional<br />
28 percent were 18–24. The top three complaints<br />
were intoxication (88 complaints), altered mental<br />
status (86 complaints), and withdrawal (76 complaints).<br />
Amphetamine-using patients were most<br />
likely to be discharged home (43 percent) or admitted<br />
to a psychiatric inpatient ward (25 percent).<br />
California Poison Control System calls involving exposure<br />
to methamphetamine/amphetamine among Los<br />
Angeles County residents have fluctuated over the<br />
years, with 48 calls logged for 2000, a high of 63 calls<br />
in 2001, and approximately 55 calls in 2002 and 2003<br />
(exhibit 8a). In the first half of 2004 alone, 33<br />
methamphetamine/amphetamine-related exposure calls<br />
were made to the system. If an equal number of calls<br />
are made in the second half of 2004, the overall number<br />
will exceed the peak level seen in 2001. Between<br />
January 2003 and June 2004, slightly more callers<br />
<strong>EPIDEMIOLOGIC</strong> TRENDS IN <strong>DRUG</strong> <strong>ABUSE</strong>—Los Angeles County<br />
reporting exposure to methamphetamine or other amphetamines<br />
were male (53 percent) than female (47<br />
percent), and 64 percent were between the ages of 18<br />
and 34 (exhibit 9). In addition to calls relating to<br />
methamphetamine and amphetamine exposure, a total<br />
of 37 Ritalin/Adderall exposure calls were recorded<br />
between January 2000 and June 2004.<br />
According to CHKS data for the 2003–2004 school<br />
year (exhibit 10), 7.3 percent of all Los Angeles<br />
County secondary school students (including 7th, 9th,<br />
and 11th graders, and a small sample of nontraditional<br />
students) who responded to the survey had ever<br />
used methamphetamine, and 3.7 percent were current<br />
methamphetamine users (defined as any use in the<br />
past 30 days). A breakdown of the data by grade level<br />
illustrated that among responding ninth graders, 5.4<br />
percent had ever used methamphetamine and 2.9 percent<br />
were current users. A higher percentage of 11th<br />
than 9th graders reported current methamphetamine<br />
use in the past 30 days. A nearly equal proportion of<br />
males and females identified as lifetime methamphetamine<br />
users (51 percent were male and 49 percent<br />
were female). The gender gap widened with<br />
past-30-day use of methamphetamine (63 percent<br />
male vs. 37 percent female). Frequent methamphetamine<br />
use is defined as 20 or more days of use in the<br />
previous 30 days. Twenty-three percent of the current<br />
methamphetamine users reported frequent use.<br />
Among the frequent users, 68 percent were male and<br />
the remaining 32 percent were female. When asked<br />
about past-6-month use of cocaine, methamphetamine,<br />
or other stimulants, 7.1 percent of 9th graders<br />
and 6.5 percent of 11th graders responded in the affirmative<br />
(exhibit 11).<br />
According to long-term trends calculated from CHKS<br />
data spanning over the most recent 5 school years (exhibit<br />
12), the pattern of past-30-day methamphetamine<br />
use among responding secondary school students was<br />
similar to those seen for cocaine and LSD/other psychedelics.<br />
From 1999–2000 to 2001–2002, past-30day<br />
methamphetamine use decreased consistently from<br />
the peak level of 4.6 percent in 1999–2000 to 4.1 percent<br />
in 2001–2002. In 2002–2003, the percentage of<br />
current methamphetamine users increased slightly to<br />
4.3 percent, but it decreased to 3.7 percent (the lowest<br />
level yet) in 2003–2004.<br />
According to NFLIS data based on 54,240 analyzed<br />
items reported by participating laboratories within Los<br />
Angeles County between October 2003 and September<br />
2004, 33 percent (17,727) of all items analyzed were<br />
found to be methamphetamine/amphetamine. Methamphetamine<br />
accounted for the second largest proportion<br />
of samples positively identified by NFLIS. An<br />
additional 22 items were identified as amphetamine,<br />
Proceedings of the Community Epidemiology Work Group, Vol. II, January 2005 105
and 15 items were identified as pseudoephedrine (each<br />
accounting for less than one-tenth of a percent).<br />
Throughout the first half of calendar year 2004, 221<br />
amphetamine arrests were made within the city of<br />
Los Angeles, exceeding the number of arrests made<br />
during the same period in 2003 (135 arrests) by 64<br />
percent. Despite this large increase in the overall<br />
number of amphetamine arrests, as a class, they continued<br />
to account for slightly more than 1 percent of<br />
the total. Arrests for methamphetamine are included<br />
in the category “other narcotics.” In early 2004, 8,497<br />
arrests for other narcotics were made, accounting for<br />
48 percent of all arrests.<br />
While methamphetamine is not reported separately in<br />
citywide drug arrests, it is broken out in citywide<br />
seizures. Citywide methamphetamine seizures increased<br />
101 percent, from 84.9 pounds seized in the<br />
first half of 2003 to 171 pounds seized in the first half<br />
of 2004. The street value of the seized methamphetamine<br />
accounted for approximately 8 percent of<br />
the total street value of all drugs seized in early 2004.<br />
Los Angeles is considered by NDIC to be one of the<br />
largest methamphetamine markets in the United<br />
States. Mexican criminal groups based in both Mexico<br />
and California control the wholesale and midlevel<br />
distribution of methamphetamine and distribute the<br />
drug via private vehicles and commercial trucks. Not<br />
only does a large quantity of the drug stay in the<br />
southern California region, but methamphetamine is<br />
transported to other major cities and regions, including<br />
San Francisco and Phoenix, and the West Central,<br />
Southwest, and Southeast areas of the United States.<br />
Hispanic gangs, independent dealers, outlaw motorcycle<br />
gangs (OMGs), and Asian gangs control the<br />
retail distribution of methamphetamine within and<br />
beyond California.<br />
The wholesale price per pound of methamphetamine<br />
ranged from $5,000 to $7,000 (exhibit 13), which is<br />
similar to the range reported in June 2004, but higher<br />
than the wholesale price reported in 2002–2003<br />
($3,700 to $5,000). The midlevel and retail prices<br />
are $450–$550 per ounce, $20 per one-quarter gram,<br />
$40–$100 per gram, $60 per one-sixteenth ounce<br />
(“teener”), and $100–$120 per one-eighth ounce.<br />
According to one intelligence source, the purity of<br />
finished methamphetamine available in the Los Angeles<br />
area remains at approximately 30–35 percent.<br />
Given the many different production “recipes” and<br />
the multiple types of methamphetamine entering into<br />
and staying in the Los Angeles area (locally produced<br />
and Mexican produced), however, it is very possible<br />
that there is a wide range of purity (especially since<br />
106<br />
<strong>EPIDEMIOLOGIC</strong> TRENDS IN <strong>DRUG</strong> <strong>ABUSE</strong>—Los Angeles County<br />
such a high percentage of users report smoking<br />
methamphetamine).<br />
Crystal methamphetamine has a wholesale price of<br />
$8,000–$11,000 per pound in Los Angeles. The midlevel<br />
price for an ounce of crystal methamphetamine is<br />
$600–$800. A double case of pseudoephedrine (17,000<br />
60-milligram tablets per case) sells for $3,250–$4,000.<br />
In parts of the United States, the number of methamphetamine<br />
clandestine laboratory seizures has consistently<br />
increased. According to Rudy Lovio, Criminal<br />
Intelligence Specialist in the LA CLEAR Research<br />
and Analysis Unit, this increase is due to the proliferation<br />
of “Nazi” methamphetamine labs (small-scale<br />
labs capable of producing gram to ounce quantities of<br />
finished product) in the Midwest and rural South.<br />
Since calendar year 1999, however, the number of<br />
clandestine laboratory incidents has decreased consistently<br />
in both the LA HIDTA and in California overall.<br />
In 1999, 2,090 labs were seized in California<br />
(1,187 of which occurred in the 4-county LA HIDTA<br />
region). By 2003, only 831 labs were seized statewide<br />
(452 in the LA HIDTA). Possible explanations<br />
for the decrease in seizures include precursor chemical<br />
restrictions, chemical control laws, increased<br />
methamphetamine production in Mexico, and the<br />
downsizing of clandestine laboratory enforcement<br />
teams. Despite the decrease in the number of seizures,<br />
the wholesale and retail prices for methamphetamine<br />
have remained relatively stable over the<br />
same time period, which is a barometer for methamphetamine<br />
availability in Los Angeles County.<br />
According to EPIC’s National Clandestine Laboratory<br />
Seizure System, California had the fourth highest<br />
number of laboratory-only seizures in the first<br />
half of 2004 (243), following Tennessee (353), Arkansas<br />
(300), and Illinois (244). Within California,<br />
the Los Angeles HIDTA once again led the State in<br />
the overall number of methamphetamine seizures<br />
(including laboratories, dumpsites, and chemicals/glass/equipment)<br />
made in the first half of 2004,<br />
accounting for 49 percent of all seizures made in<br />
California (138 of 331 total incidents). Of the 4 counties<br />
in the LA HIDTA, Los Angeles County had the<br />
second highest number of seizures during that time<br />
period (37), lagging behind San Bernardino County<br />
(60), but followed very closely by Riverside County<br />
(36). Orange County rounded out the HIDTA with<br />
just five seizures.<br />
Even though three States exceed California in terms<br />
of laboratory seizures, California leads the country in<br />
the number of domestic “superlabs.” Twenty-five of<br />
30 U.S. superlabs (83 percent) seized in the first half<br />
Proceedings of the Community Epidemiology Work Group, Vol. II, January 2005
of 2004 were in California. In the past, these largescale<br />
labs were capable of producing 10 or more<br />
pounds of finished methamphetamine in a single production<br />
cycle, but superlabs have stepped up the pace<br />
and are now capable of producing 20 or more pounds<br />
of finished drug in a single production cycle (NDIC<br />
2004). The LA HIDTA reported the highest proportion<br />
of superlabs seized throughout California (14<br />
out of 25 superlabs seized between January 1 and<br />
July 1, 2004, or 56 percent). This proportion is a<br />
slight decrease over LA HIDTA’s contribution in<br />
2003. Within the LA HIDTA, Los Angeles County<br />
led with six superlab seizures, followed by Riverside<br />
County (four), San Bernardino County (three), and<br />
Orange County (one). Furthermore, totals reported in<br />
the LA HIDTA exceeded totals reported by all States<br />
outside of California.<br />
The cost to clean up labs located in the LA HIDTA in<br />
the first half of 2004 totaled $466,003. One-third of<br />
this total corresponds to the cost of cleaning up Los<br />
Angeles County laboratories, second only to Riverside<br />
County (36 percent of the cleanup costs). It is<br />
important to note that these clean-up figures do not<br />
encompass building and environment remediation,<br />
which each cost taxpayers even more money.<br />
A negative consequence of clandestine methamphetamine<br />
laboratory activity is the affect on children<br />
living in or around the makeshift, often home- or<br />
apartment-based, laboratories. Local, statewide, and<br />
national efforts, known as Drug Endangered Children<br />
Programs, have been launched to address the issue of<br />
what happens to children who are found at a<br />
methamphetamine laboratory when it is seized. Nationally,<br />
in the first half of 2004, 2,016 children were<br />
“affected” by methamphetamine laboratories. Nine<br />
percent of the children affected resided in California.<br />
Within California, 109 of the 174 affected children<br />
resided in the 4 LA HIDTA counties. The highest<br />
proportion were reported in Riverside County (73 of<br />
the 109 children), followed by San Bernardino<br />
County (22), Los Angeles County (9), and Orange<br />
County (5). It is important to note that these numbers<br />
are underreported, due to differences in county- and<br />
State-level reporting procedures.<br />
Depressants<br />
In the first half of 2004, treatment and recovery program<br />
admissions associated with primary barbiturate,<br />
benzodiazepine, or other sedative/hypnotic abuse<br />
continued to account for less than 1 percent of all<br />
admissions in Los Angeles County.<br />
Of the 1,318 pharmaceuticals reported among those<br />
seeking detoxification, overmedication, and other<br />
<strong>EPIDEMIOLOGIC</strong> TRENDS IN <strong>DRUG</strong> <strong>ABUSE</strong>—Los Angeles County<br />
cases accessed from DAWN Live! for the first half of<br />
2004 in the Los Angeles division, 192 (15 percent)<br />
were antidepressants, 218 were antipsychotics (17<br />
percent), 25 were barbiturates (2 percent), and 266<br />
were benzodiazepines (21 percent) (exhibit 14). For<br />
all of the above categories except for barbiturates,<br />
overmedication was the most frequently stated reason<br />
for visiting the emergency department. The proportion<br />
of overmedication cases ranged from a low of 70<br />
percent (for benzodiazepines) to a high of 88 percent<br />
(antipsychotics).<br />
Los Angeles County-based California Poison Control<br />
System calls involving exposure to benzodiazepines<br />
fluctuated. From 2000 to 2001, benzodiazepinerelated<br />
exposure calls increased from 64 to 83 calls<br />
(exhibit 8b). In 2002, the number of calls decreased<br />
to 52, and such calls then increased to 70 in 2003. In<br />
the first half of 2004 alone, 52 benzodiazepine exposure<br />
calls were reported, which may indicate a further<br />
increase from the number of calls seen in 2003. Between<br />
January 2003 and June 2004, 19 of the benzodiazepine-related<br />
exposure calls were for alprazolam,<br />
29 were for clonazepam, and 20 were for diazepam.<br />
In addition to calls for benzodiazepine exposures, a<br />
total of 52 antidepressant exposure calls and 25 antipsychotic<br />
calls were reported between January 2000<br />
and June 2004.<br />
Approximately 688 of the 54,240 items analyzed<br />
and reported to the NFLIS system in calendar year<br />
2003 were identified as pharmaceuticals/prescripttion/non-controlled<br />
non-narcotic medications (as<br />
opposed to illicit substances). Of those, roughly 24<br />
percent (163 items) were found to be benzodiazepines.<br />
The most frequently cited benzodiazepines<br />
were diazepam (75 items; 46 percent) and clonazepam<br />
(48 items; 29 percent).<br />
According to LA CLEAR, Valium retails for $2 per<br />
tablet (exhibit 13), which is one-half the cost reported<br />
in the June 2004 report.<br />
Phencyclidine (PCP) and Hallucinogens<br />
Primary PCP treatment admissions accounted for<br />
approximately 1.0 percent of all admissions in the<br />
first half of 2004 (exhibit 3). The proportion of PCP<br />
admissions among all admissions has been stable for<br />
several years, but the overall number of PCP admissions<br />
increased 89 percent from 1999 to the first half<br />
of 2003. In the second half of 2003, however, the<br />
number of PCP admissions decreased slightly (16<br />
percent) to 262 admissions, and they continued to<br />
decrease further (12 percent) in the first half of 2004 to<br />
230 admissions. Alcohol (23 percent), cocaine/crack<br />
(22 percent), and marijuana (18 percent) were the three<br />
Proceedings of the Community Epidemiology Work Group, Vol. II, January 2005 107
most frequently reported secondary drugs among primary<br />
PCP admissions. A vast majority (96 percent) of<br />
the primary PCP admissions smoked the drug. There<br />
were no notable changes from the previous reporting<br />
period in terms of user demographics. Other hallucinogens,<br />
such as LSD, peyote, and mescaline, continued<br />
to account for approximately 0.1 percent of the<br />
total treatment admissions.<br />
Preliminary unweighted data accessed from DAWN<br />
Live! for the first half of 2004 indicate that of the<br />
4,688 major substances of abuse reported in the Los<br />
Angeles division, 75 (2 percent) were PCP (exhibit<br />
7). Seventy-five percent of the patients reporting PCP<br />
use were male and 35 percent were White (followed<br />
by 33 percent Black and 27 percent Hispanic). Sixtyfive<br />
percent were age 30–54, and an additional 16<br />
percent were between 18 and 25. A total of 161 chief<br />
complaints were logged for patients reporting PCP.<br />
The top three complaints were altered mental status<br />
(38 complaints), intoxication (33 complaints), and<br />
psychiatric condition (23 complaints). User patients<br />
were more likely to smoke PCP (45 percent) than<br />
inject (16 percent). PCP-using patients were most<br />
likely to be discharged home (44 percent) or admitted<br />
to a psychiatric inpatient ward (21 percent).<br />
California Poison Control System calls involving<br />
exposure to PCP among Los Angeles County residents<br />
fluctuated between 10 and 20 calls from 2000<br />
to 2003 (exhibit 8a). In the first half of 2004, there<br />
were five PCP-related exposure calls.<br />
According to CHKS data for the 2003–2004 school<br />
year, 5.8 percent of all Los Angeles County secondary<br />
school students (including 7th, 9th, and 11th<br />
graders, and a small sample of nontraditional students)<br />
who responded to the survey had ever used<br />
LSD or another psychedelic, and 2.9 percent had<br />
used LSD/other psychedelics in the past 30 days (exhibit<br />
10). A breakdown of the data by grade level<br />
illustrated that among responding ninth graders, 4.4<br />
percent had ever used LSD/other psychedelics, and<br />
2.5 percent were current users. Among 11th graders,<br />
5.9 percent had ever used LSD/other psychedelics,<br />
and 2.5 percent used a psychedelic at least once<br />
within the past 30 days.<br />
According to long-term trends calculated from CHKS<br />
data spanning over the last 5 school years (exhibit<br />
12), the pattern of past-30-day LSD/other psychedelics<br />
use among responding secondary school students<br />
(in grades 7, 9, and 11), was similar to usage patterns<br />
seen with other licit and illicit drugs. Current use of<br />
LSD/other psychedelics has been trending downward<br />
since the late 1990s, to a low of 2.8 percent in 2002–<br />
108<br />
<strong>EPIDEMIOLOGIC</strong> TRENDS IN <strong>DRUG</strong> <strong>ABUSE</strong>—Los Angeles County<br />
2003. In 2003–2004, the percentage was slightly<br />
higher at 2.9 percent of all respondents.<br />
According to NFLIS data based on 54,240 analyzed<br />
items reported by participating laboratories within Los<br />
Angeles County between October 2003 and September<br />
2004, 0.7 percent (n=345) of all items analyzed were<br />
found to be PCP.<br />
Nearly 100 PCP arrests were made within the city of<br />
Los Angeles in the first half of 2004, identical to the<br />
number of arrests made during the same time period in<br />
2003. Like amphetamine arrests, PCP arrests accounted<br />
for a very low proportion (less than 1 percent).<br />
The street value of the PCP seized between January<br />
and June 2004 represented approximately 1.5 percent<br />
of the total street value of all drugs seized during that<br />
period. The total amount of PCP seized in the early<br />
part of 2004 (26.3 pounds) was 218 percent higher<br />
than the amount seized during the same period in<br />
2003 (8.3 pounds).<br />
The wholesale price for a gallon of PCP remains at the<br />
high level reported in June 2004, ranging from<br />
$15,000 to $20,000 (exhibit 13). The ounce price,<br />
however, decreased recently, from $600 to $300–$350.<br />
A sherm cigarette dipped in liquid PCP continues to<br />
sell for $20–$30. A tight-knit group of Los Angelesbased<br />
African-American street gang members continues<br />
to produce, supply, and distribute PCP in the Los<br />
Angeles area.<br />
A sheet of approximately 100 doses of LSD has a<br />
wholesale price range of $150–$200. Typically, a<br />
single dose sells for $5–$10. At the retail level, psilocybin<br />
mushrooms cost about $20 per one-eighth<br />
ounce.<br />
Club Drugs<br />
Comprehensive indicator data relating to the use and<br />
abuse of club drugs is still lacking for Los Angeles<br />
County. Therefore, it is difficult to accurately and<br />
comprehensively describe the use and abuse patterns<br />
of club drugs in Los Angeles County. Despite this<br />
lack of traditional indicator information, anecdotal<br />
evidence from a variety of sources continues to circulate<br />
with regard to the availability of club drugs in<br />
Los Angeles County, particularly MDMA (ecstasy)<br />
and gamma hydroxybutyrate (GHB).<br />
Collectively, club drugs played a limited role in preliminary<br />
unweighted data accessed from DAWN Live!<br />
for the first half of 2004. Fifty of the 4,688 major substances<br />
of abuse reported in the Los Angeles division<br />
were MDMA (ecstasy), and 2 were GHB (exhibit 7).<br />
Proceedings of the Community Epidemiology Work Group, Vol. II, January 2005
Ketamine and Rohypnol did not have a presence at all.<br />
Fifty-six percent of the patients reporting MDMA use<br />
were male, and 38 percent were Hispanic (followed by<br />
22 percent White and Black). More than one-half of<br />
the MDMA users (56 percent) were between 12 and 24<br />
years of age. Of the 122 complaints, the three most<br />
frequently reported complaints were altered mental<br />
status (40 complaints), intoxication (36 complaints),<br />
and psychiatric condition (31 complaints). Methamphetamine-using<br />
patients were most likely to be admitted<br />
to a psychiatric inpatient ward (50 percent) or discharged<br />
(20 percent).<br />
California Poison Control System calls involving<br />
exposure to ecstasy among Los Angeles County residents<br />
have decreased consistently over recent years,<br />
from a high of 56 in 2000 to a low of 16 in 2003 (exhibit<br />
8a). In the first half of 2004 alone, however, 12<br />
calls relating to ecstasy exposure were reported. If an<br />
equal number of calls are made in the second half of<br />
2004, the overall number will exceed the 2003 level.<br />
Between January 2003 and June 2004, slightly more<br />
callers reporting exposure to ecstasy were male (57<br />
percent) than female (43 percent), and 64 percent<br />
were between the ages of 13 and 25 (exhibit 9). In<br />
addition to calls relating to ecstasy exposure, a total<br />
of 14 GHB exposure calls, 4 ketamine calls, and 3<br />
Rohypnol calls were recorded between January 2000<br />
and June 2004.<br />
The California Poison Control System also kept track<br />
of calls relating to Coricidin HBP and dextromethorphan<br />
(DXM) exposures. Between January 2003 and<br />
June 2004, 50 Coricidin HBP calls and 17 DXM calls<br />
were logged in the system (exhibit 9). Fifty-two percent<br />
of Coricidin HBP calls and 58 percent of DXM<br />
calls were male. Furthermore, 84 percent of the Coricidin<br />
HBP calls and 58 percent of the DXM calls<br />
were made because of exposure to individuals<br />
younger than 18. Eighteen to 24-year-olds represented<br />
an additional 16 percent of the Coricidin HBP<br />
calls and 21 percent of the DXM calls.<br />
According to CHKS data for the 2003–2004 school<br />
year (exhibit 10), 5.5 percent of all Los Angeles<br />
County secondary school students (including 7th, 9th,<br />
and 11th graders, and a small sample of nontraditional<br />
students) who responded to the survey had ever<br />
used ecstasy. Current use of ecstasy was not assessed,<br />
although a question regarding past-6-month use of<br />
psychedelics, ecstasy, or other club drugs was included<br />
in the survey. Overall, 6.2 percent of all respondents<br />
reported use of these drugs (exhibit 11).<br />
By grade, 6 percent of 9th graders and 5 percent of<br />
11th graders answered in the affirmative.<br />
<strong>EPIDEMIOLOGIC</strong> TRENDS IN <strong>DRUG</strong> <strong>ABUSE</strong>—Los Angeles County<br />
According to NFLIS data based on 54,240 analyzed<br />
items reported by participating laboratories within Los<br />
Angeles County between October 2003 and September<br />
2004, less than 1 percent (288) of all items analyzed<br />
were found to be MDMA, GHB, or ketamine. Of those<br />
three club drugs, MDMA was most likely to be detected;<br />
it represented 81 percent of the club drug samples<br />
analyzed by NFLIS. GHB represented an additional<br />
12 percent of the samples, and ketamine accounted<br />
for 7 percent.<br />
According to NDIC, the majority of MDMA available<br />
in Los Angeles is transported directly from<br />
Western Europe. Los Angeles is a source of both<br />
wholesale and midlevel amounts of MDMA, which is<br />
destined for markets around the United States, including<br />
Pacific, Southwest, and West Central States<br />
(NDIC 2004). Israeli and Russian criminal groups<br />
control the wholesale distribution, and independent<br />
dealers (usually White males) are responsible for<br />
retail marketing and distribution. Mail service and air<br />
travel are the two most likely ways to transport the<br />
product into Los Angeles. Within Los Angeles, Israeli<br />
and Russian traffickers control the distribution<br />
at the wholesale level.<br />
With the exception of GHB, wholesale and retail<br />
prices for club drugs remained stable since the June<br />
2004 report. In multiple quantities, MDMA has a<br />
wholesale price of $12 per pill or capsule (exhibit<br />
13). At the retail level, ecstasy usually sells for $20–<br />
$40 per pill. A standard dose of ecstasy is 60–150<br />
milligrams, which is equivalent to one or two pills. In<br />
Los Angeles, ecstasy “boats” continue to be mentioned.<br />
A boat contains 1,000 MDMA pills and sells<br />
for $8,000. Flunitrazepam (Rohypnol), when available,<br />
has a retail value of $6–$10 for a 1-milligram<br />
pill. On the street, ketamine sells for $100–$200 per<br />
10-milliliter vial. In addition, ketamine retails for $20<br />
for two-tenths grams of powder. The wholesale price<br />
for GHB increased since the last report. A gallon<br />
sells for $275–$300, and a liter sells for $80–$100. A<br />
16-ounce bottle of GHB, which once ranged from<br />
$65 to $100, now sells for $120. Capfuls can still be<br />
purchased for $5–$20 each. The vast majority of<br />
GHB users ingested the drug as a liquid, either in<br />
straight shots or mixed with a drink.<br />
INFECTIOUS DISEASES RELATED TO <strong>DRUG</strong> <strong>ABUSE</strong><br />
A cumulative total of 48,510 adult/adolescent AIDS<br />
cases were reported in Los Angeles County through<br />
June 30, 2004. Of those cases, 996 were reported<br />
between January 1, 2004, and June 30, 2004. Currently,<br />
approximately 19,700 Los Angeles County<br />
Proceedings of the Community Epidemiology Work Group, Vol. II, January 2005 109
esidents are living with advanced HIV disease. Los<br />
Angeles County cumulative cases represent approximately<br />
36 percent of the 135,982 cumulative cases in<br />
California and approximately 6 percent of the<br />
886,575 cumulative cases nationwide. Of the cumulative<br />
cases reported in Los Angeles County, 47 percent<br />
were White, 30 percent were Hispanic, 20 percent<br />
were African-American, 44 percent were age<br />
30–39, and 92 percent were male.<br />
The proportion of newly diagnosed males solely exposed<br />
through injection drug use has ranged between<br />
5 and 7 percent from 1997 to 2003 (exhibit 15). The<br />
proportions for other exposure categories, such as the<br />
combination of male-to-male sexual contact and injection<br />
drug use, heterosexual contact, blood transfusion,<br />
and hemophilia/coagulation disorder, have remained<br />
relatively stable since 1997. The proportion<br />
of men exposed to AIDS through male-to-male sexual<br />
contact has decreased steadily, from 66 percent in<br />
1997 to 64 percent in 2003. The proportion of male<br />
cases with an “other” or “undetermined” exposure<br />
category continues to rise steadily, and in 2003, it<br />
accounted for 21 percent of all male cases diagnosed<br />
that year.<br />
The modal exposure category for females diagnosed<br />
with AIDS in 1997 was heterosexual contact (46 percent).<br />
This exposure category has been associated<br />
with a lower proportion of female AIDS cases since<br />
then; in 2003, it was associated with 34 percent of all<br />
newly diagnosed female AIDS cases. Female cases<br />
attributable to injection drug use, which were stable at<br />
16–17 percent of all female cases from 2000 to 2002,<br />
decreased to 11 percent in 2003. The proportion of<br />
female cases with an “other” or “undetermined” exposure<br />
category continued to increase, accounting for 54<br />
percent of all female cases diagnosed in 2003.<br />
110<br />
<strong>EPIDEMIOLOGIC</strong> TRENDS IN <strong>DRUG</strong> <strong>ABUSE</strong>—Los Angeles County<br />
In Los Angeles County, approximately 7 percent of<br />
all AIDS cases have involved injection drug use<br />
(alone) as the primary route of exposure. Among the<br />
3,403 cumulative cases primarily attributable to injection<br />
drug use, 73 percent occurred among males.<br />
African-Americans are the modal group of male injection<br />
drug users (IDUs) (accounting for 38 percent),<br />
followed by equal percentages of Whites and<br />
Hispanics (each accounting for 31 percent). A similar<br />
pattern was seen with female IDU AIDS cases. African-Americans<br />
continued to constitute the greatest<br />
proportion (44 percent), followed by Whites (31 percent)<br />
and Hispanics (22 percent).<br />
An additional 7 percent of the total cumulative cases<br />
were attributable to a combination of male-to-male<br />
sexual contact and injection drug use. Fifty-two percent<br />
of the male-to-male sexual contact and injection<br />
drug use cases were White.<br />
ACKNOWLEDGEMENTS<br />
The author wishes to thank those individuals and<br />
agencies that provide the wide array of valuable alcohol-<br />
and drug-related data, statistics, and information.<br />
Los Angeles County’s participation in and contribution<br />
to the Community Epidemiology Work Group would<br />
be extremely difficult without the continuous cooperation<br />
of several local, State, and national agencies. In<br />
particular, the author wishes to thank Craig Chaffee<br />
(California Department of Alcohol and Drug Programs),<br />
Rudy Lovio and Jeff Sharon (Los Angeles<br />
Criminal Information Clearinghouse), the LAPD Staff<br />
Services Unit staff (Narcotics Division), Valley Rachal<br />
and Liqun Wong (NFLIS), Judy Ball and Erin Mallonee<br />
(DAWN), Stu Heard and Terry Carlson (California<br />
Poison Control System), Greg Austin and Kiku<br />
Annon (WestEd), and Gordon Bunch and the<br />
LACDHS HIV Epidemiology Program staff.<br />
For inquiries concerning this report, please contact Beth Finnerty, M.P.H., University of California at Los Angeles, Integrated Substance Abuse<br />
Programs, 1640 South Sepulveda Blvd., Suite 200, Los Angeles, CA 90025, Phone: 310-445-0874 ext. 376, Fax: 310-312-0538, E-mail: .<br />
Proceedings of the Community Epidemiology Work Group, Vol. II, January 2005
<strong>EPIDEMIOLOGIC</strong> TRENDS IN <strong>DRUG</strong> <strong>ABUSE</strong>—Los Angeles County<br />
Exhibit 1. Population Characteristics, Los Angeles County and the State of California, by Percent:<br />
2000 U.S. Census<br />
Population Characteristics Los Angeles County California<br />
Population, 2003 estimate (N) (9,871,506) (35,484, 453)<br />
Population, percent change, April 1, 2000,<br />
to July 1, 2003<br />
3.7 4.8<br />
Population, year 2000 (N) (9,519,338) (33,871,648)<br />
Persons younger than 5 7.7 7.3<br />
Persons younger than 18 28.0 27.3<br />
Persons age 65 and older 9.7 10.6<br />
Female 50.6 50.2<br />
White 48.7 59.5<br />
Black or African-American 9.8 6.7<br />
American Indian or Alaska Native 0.8 1.0<br />
Asian persons 11.9 10.9<br />
Native Hawaiian or Other Pacific Islander 0.3 0.3<br />
Persons reporting some other race 23.5 16.8<br />
Persons reporting two or more races 4.9 4.7<br />
White, not Hispanic/Latino origin 31.1 46.7<br />
Persons of Hispanic/Latino origin 44.6 32.4<br />
SOURCE: U.S. Census Bureau, State and County QuickFacts<br />
Exhibit 2. Number of ED Visits, by Case Type, in the Los Angeles County Division (Unweighted 1 ):<br />
January–June 2004<br />
Case Type Number of ED Visits 1<br />
Suicide Attempt 313<br />
Seeking detoxification 115<br />
Alcohol only (age
112<br />
<strong>EPIDEMIOLOGIC</strong> TRENDS IN <strong>DRUG</strong> <strong>ABUSE</strong>—Los Angeles County<br />
Exhibit 3. Number and Proportion of Semiannual Treatment Admissions in Los Angeles County, by Primary<br />
Illicit Drug of Abuse: July 2001–June 2004<br />
07/01–12/01<br />
Primary Drug<br />
Number<br />
(%)<br />
Cocaine/Crack 4,354<br />
(19.4)<br />
Heroin 8,033<br />
(35.8)<br />
Marijuana 2,028<br />
(9.0)<br />
Methamphetamine 3,015<br />
(13.4)<br />
PCP 207<br />
(0.9)<br />
01/02–06/02<br />
Number<br />
(%)<br />
4,655<br />
(19.6)<br />
7,767<br />
(32.8)<br />
2,686<br />
(11.3)<br />
3,453<br />
(14.6)<br />
196<br />
(0.8)<br />
07/02–12/02<br />
Number<br />
(%)<br />
4,354<br />
(19.0)<br />
7,096<br />
(30.9)<br />
2,816<br />
(12.3)<br />
3,692<br />
(16.1)<br />
219<br />
(0.9)<br />
01/03–06/03<br />
Number<br />
(%)<br />
5,242<br />
(19.3)<br />
6,891<br />
(25.4)<br />
3,669<br />
(13.5)<br />
4,961<br />
(18.3)<br />
314<br />
(1.2)<br />
07/03–12/03<br />
Number<br />
(%)<br />
4,815<br />
(18.2)<br />
6,704<br />
(25.4)<br />
3,452<br />
(13.1)<br />
5,095<br />
(19.3)<br />
262<br />
(1.0)<br />
01/04–06/04<br />
Number<br />
(%)<br />
5,137<br />
(18.1)<br />
6,942<br />
(24.5)<br />
3,812<br />
(13.4)<br />
5,840<br />
(20.6)<br />
Total Admissions 22,430 23,695 22,934 27,110 26,393 28,371<br />
SOURCE: California Alcohol and Drug Data System (CADDS)<br />
Exhibit 4. Number and Proportion of Annual/Semiannual Treatment Admissions in Los Angeles County, by<br />
Primary Illicit Drug of Abuse: January 2001–June 2004<br />
Primary Drug<br />
2001<br />
Number (%)<br />
2002<br />
Number (%)<br />
2003<br />
Number (%)<br />
1H 2004<br />
Number (%)<br />
Cocaine/Crack 8,703 (18.9) 9,009 (19.3) 10,057 (18.8) 5,137 (18.1)<br />
Heroin 17,560 (38.1) 14,863 (31.9) 13,595 (25.4) 6,942 (24.5)<br />
Marijuana 4,286 (9.3) 5,502 (11.8) 7,121 (13.3) 3,812 (13.4)<br />
Methamphetamine 5,418 (11.7) 7,145 (15.3) 10,056 (18.8) 5,840 (20.6)<br />
PCP 405 (0.9) 415 (0.9) 576 (1.1) 230 (0.8)<br />
Total Admissions 46,127 46,629 53,503 28,371<br />
SOURCE: California Alcohol and Drug Data System (CADDS)<br />
230<br />
(0.8)<br />
Proceedings of the Community Epidemiology Work Group, Vol. II, January 2005
<strong>EPIDEMIOLOGIC</strong> TRENDS IN <strong>DRUG</strong> <strong>ABUSE</strong>—Los Angeles County<br />
Exhibit 5. Characteristics of Treatment Admissions in Los Angeles County, by Primary Illicit Drug of Abuse<br />
and Percent: January–June 2004<br />
Characteristics Cocaine/Crack Heroin Marijuana<br />
Metham-<br />
phetamine<br />
All<br />
Admissions<br />
Gender<br />
Male 67.0 71.7 74.7 60.1 67.3<br />
Female<br />
Race/Ethnicity<br />
33.0 28.3 25.3 39.9 32.7<br />
White non-Hispanic 14.9 40.0 16.6 41.4 31.7<br />
Black non-Hispanic 56.5 11.9 26.8 3.9 23.2<br />
Hispanic 21.0 40.2 47.6 41.9 36.0<br />
American Indian 0.4 0.7 0.6 1.0 0.8<br />
Asian/Pacific Islander 1.5 1.2 2.1 3.4 2.0<br />
Other<br />
Age<br />
5.7 6.1 6.3 8.4 6.3<br />
17 and younger 1.5 0.2 48.4 8.5 11.8<br />
18–25 9.2 8.1 24.4 30.4 15.8<br />
26–35 23.4 19.9 14.6 33.8 22.8<br />
36 and older<br />
Route of Administration<br />
65.9 71.8 12.6 27.3 49.6<br />
Oral 1.6 1.4 3.7 3.5 23.2<br />
Smoking 86.4 8.6 95.8 67.9 46.2<br />
Inhalation 10.0 3.5 0.5 20.4 7.2<br />
Injection 0.9 85.6 0.0 7.1 22.7<br />
Unknown/other 0.6 0.8 0.1 1.1 0.8<br />
Secondary Drug Alcohol<br />
Cocaine/<br />
Crack<br />
Alcohol Marijuana Alcohol<br />
Total Admissions (N) (5,137) (6,942) (3,812) (3,812) (28,371)<br />
SOURCE: California Alcohol and Drug Data System (CADDS)<br />
Exhibit 6. Additional Characteristics of Treatment Admissions in Los Angeles County, by Primary Illicit Drug<br />
of Abuse and Percent: January–June 2004<br />
Characteristics<br />
Cocaine/<br />
Crack<br />
Heroin Marijuana<br />
Metham-<br />
phetamine<br />
All<br />
Admissions<br />
Positive for Intravenous<br />
Drug Use in Past Year<br />
4.5 88.4 1.5 12.0 26.4<br />
Homeless 28.2 16.0 6.7 20.1 18.8<br />
Employed Full- or Part-<br />
Time<br />
14.5 19.6 13.5 18.3 17.1<br />
Graduated from High<br />
School<br />
Referred by<br />
46.0 49.4 25.9 42.1 43.0<br />
Court/Criminal Justice<br />
System (Not Including<br />
SACPA 1 Referrals)<br />
19.6 3.9 32.2 20.0 16.4<br />
First Treatment Episode 32.6 15.0 66.8 45.5 40.3<br />
Total Admissions (N) (5,137) (6,942) (3,812) (5,840) (28,371)<br />
1 SACPA = Substance Abuse and Crime Prevention Act of 2000 (a.k.a., Proposition 36)<br />
SOURCE: California Alcohol and Drug Data System (CADDS)<br />
Proceedings of the Community Epidemiology Work Group, Vol. II, January 2005 113
114<br />
<strong>EPIDEMIOLOGIC</strong> TRENDS IN <strong>DRUG</strong> <strong>ABUSE</strong>—Los Angeles County<br />
Exhibit 7. Number of ED Reports, by Drug and Drug Category (Major Substances of Abuse), in the Los<br />
Angeles County Division (Unweighted 1 ): January–June 2004<br />
Major Substance of Abuse Number of ED Reports 1<br />
Alcohol<br />
1,812<br />
Alcohol only (age
<strong>EPIDEMIOLOGIC</strong> TRENDS IN <strong>DRUG</strong> <strong>ABUSE</strong>—Los Angeles County<br />
Exhibit 8b. Los Angeles County Poison Control Center Exposure Calls for Prescription and Over-the-<br />
Counter Medications and Common Household Substances: January 2000–June 2004<br />
Substance 1<br />
2000<br />
Number<br />
2001<br />
Number<br />
2002<br />
Number<br />
2003<br />
Number<br />
1H2004<br />
Number<br />
Total<br />
Number<br />
Antidepressants<br />
10 8 12 15 7 52<br />
Antipsychotics<br />
Benzodiazepines<br />
4 5 5 4 7 25<br />
Alprazolam<br />
10<br />
14<br />
8<br />
12<br />
7<br />
51<br />
Clonazepam<br />
14<br />
23<br />
10<br />
15<br />
14<br />
76<br />
Diazepam<br />
16<br />
17<br />
8<br />
16<br />
4<br />
61<br />
Other<br />
24<br />
29<br />
26<br />
27<br />
27<br />
133<br />
Barbiturates<br />
Opiates/Analgesics<br />
0 1 0 2 1 4<br />
Codeine<br />
2<br />
6<br />
2<br />
4<br />
1<br />
15<br />
Hydrocodone<br />
5<br />
10<br />
32<br />
39<br />
19<br />
105<br />
Methadone<br />
3<br />
4<br />
5<br />
3<br />
1<br />
16<br />
Oxycodone<br />
1<br />
4<br />
7<br />
9<br />
2<br />
23<br />
Narcotic analgesics<br />
5<br />
6<br />
6<br />
8<br />
3<br />
28<br />
Other (non-narcotic)<br />
9<br />
14<br />
10<br />
4<br />
5<br />
42<br />
Fentanyl 1 1 2 0 1 5<br />
Dextromethorphan 8 10 10 12 5 45<br />
Coricidin HBP 4 13 26 28 22 93<br />
Miscellaneous<br />
anxiolytics<br />
1 4 2 8 1 16<br />
Muscle relaxants 7 6 8 13 8 42<br />
Ritalin/Adderall 5 10 11 9 2 37<br />
Other stimulants 2 4 2 1 0 9<br />
Other 13 20 23 16 12 84<br />
Unknown 2 2 3 4 2 13<br />
1<br />
Includes calls for the following exposure reasons: intentional misuse, intentional abuse, intentional unknown, contamination/<br />
tampering, and other malicious.<br />
SOURCE: California Poison Control System<br />
Exhibit 9. Los Angeles County Poison Control Center Exposure Calls for Select Substances, by Gender and<br />
Age: January 2003-June 2004<br />
Gender<br />
Male<br />
Female<br />
Unknown<br />
Age Group<br />
Younger than 13<br />
13–17<br />
18–25<br />
26–34<br />
35–44<br />
45–54<br />
55 and older<br />
Total Number of<br />
Calls<br />
Cocaine/<br />
Crack<br />
68%<br />
32%<br />
0%<br />
9%<br />
7%<br />
21%<br />
25%<br />
26%<br />
12%<br />
116<br />
<strong>EPIDEMIOLOGIC</strong> TRENDS IN <strong>DRUG</strong> <strong>ABUSE</strong>—Los Angeles County<br />
Exhibit 10. Reported Drug Use Among Los Angeles County Secondary School Students, by Percent:<br />
2003–2004 School Year<br />
Usage Patterns Among<br />
Survey Respondents<br />
Cocaine (any form)<br />
Lifetime<br />
Past 30 days<br />
Ecstasy<br />
Lifetime<br />
Past 30 days<br />
Heroin<br />
Lifetime<br />
Past 30 days<br />
Inhalants<br />
Lifetime<br />
Past 30 days<br />
LSD/Other Psychedelics<br />
Lifetime<br />
Past 30 days<br />
Marijuana<br />
Lifetime<br />
Past 30 days<br />
Methamphetamine<br />
Lifetime<br />
Past 30 days<br />
7th Grade 1 9th Grade 11th Grade All Respondents 2<br />
***<br />
***<br />
***<br />
N/A 3<br />
***<br />
***<br />
12.5<br />
5.5<br />
***<br />
***<br />
7.3<br />
4.3<br />
***<br />
***<br />
1 The 7th grade data for several drugs (i.e., cocaine/crack, ecstasy, heroin, LSD/other psychedelics, and methamphetamine) were<br />
based on responses from a very small subset of 7th graders. Therefore, these results have been suppressed (***).<br />
2 All respondents include responding 7th graders (when applicable), 9th graders, 11th graders, and a small sample of nontraditional<br />
students (enrolled in continuation or alternative schooling programs).<br />
3 N/A=Not applicable.<br />
SOURCE: California Healthy Kids Survey, Los Angeles County Sample, WestEd<br />
Exhibit 11. Past-6-Month Substance Use Among Los Angeles County Secondary School Students, by<br />
Percent: 2003–2004 School Year<br />
Usage Patterns Among<br />
Survey Respondents<br />
7th Grade 1 9th Grade 11th Grade All Respondents 2<br />
Any Alcohol 22.1 36.7 52.5 34.7<br />
Inhalants 10.4 9.2 6.2 9.2<br />
Marijuana<br />
Cocaine (any form), Metham-<br />
9.2 15.9 22.7 15.4<br />
phetamine, or Other<br />
Stimulants<br />
*** 7.1 6.5 7.5<br />
Psychedelics, Ecstasy, or<br />
Other Club Drugs<br />
*** 6.2 5.0 6.2<br />
Other Drugs, Heroin, or<br />
Sedatives<br />
*** 6.3 5.2 6.2<br />
Two or More Drugs at the<br />
Same Time<br />
9.9 9.4 12.4 11.4<br />
1<br />
The 7th grade data for several drug categories were based on responses from a very small subset of 7th graders. Therefore, these<br />
results have been suppressed (***).<br />
2<br />
All respondents include: responding 7th graders (when applicable), 9th graders, 11th graders, and a small sample of nontraditional<br />
students (enrolled in continuation or alternative schooling programs).<br />
SOURCE: California Healthy Kids Survey, Los Angeles County Sample, WestEd<br />
5.4<br />
3.0<br />
4.3<br />
N/A<br />
3.1<br />
N/A<br />
13.7<br />
5.3<br />
4.4<br />
2.5<br />
20.4<br />
10.9<br />
5.4<br />
2.9<br />
7.5<br />
3.5<br />
5.7<br />
N/A<br />
3.0<br />
N/A<br />
12.6<br />
4.1<br />
5.9<br />
2.5<br />
32.8<br />
15.1<br />
7.2<br />
3.4<br />
7.4<br />
3.8<br />
5.5<br />
N/A<br />
3.3<br />
N/A<br />
13.4<br />
5.3<br />
5.8<br />
2.9<br />
19.8<br />
10.3<br />
7.3<br />
3.7<br />
Proceedings of the Community Epidemiology Work Group, Vol. II, January 2005
<strong>EPIDEMIOLOGIC</strong> TRENDS IN <strong>DRUG</strong> <strong>ABUSE</strong>—Los Angeles County<br />
Exhibit 12. Long-Term Trends in the Percentage of Current Substance Users Among a Sample of Los<br />
Angeles County Secondary School Students, by Percent: 1999–2004<br />
Respondents School Year<br />
1 Reporting Past 30-Day<br />
Use of… 1999-00 2000-01 2001-02 2002–03 2003-04<br />
At Least One Drink of Alcohol<br />
5+ Alcoholic Drinks/Occasion (a.k.a., Binge<br />
29.2 28.4 25.4 24.8 24.6<br />
Drinking)<br />
14.4 13.4 12.4 12.4 12.3<br />
Cocaine (any form) 4.9 4.3 3.9 3.8 3.8<br />
Inhalants 5.7 5.1 5.0 5.3 5.3<br />
LSD/Other Psychedelics 5.0 4.4 3.3 2.8 2.9<br />
Marijuana 13.2 13.0 12.0 10.9 10.3<br />
Methamphetamine 4.6 4.3 4.1 4.3 3.7<br />
1 All respondents include: responding 7th graders (when applicable), 9th graders, 11th graders, and a small sample of nontraditional<br />
students (enrolled in continuation or alternative schooling programs).<br />
SOURCE: California Healthy Kids Survey, Los Angeles County Sample, WestEd<br />
Proceedings of the Community Epidemiology Work Group, Vol. II, January 2005 117
118<br />
<strong>EPIDEMIOLOGIC</strong> TRENDS IN <strong>DRUG</strong> <strong>ABUSE</strong>—Los Angeles County<br />
Exhibit 13. Illicit and Prescription Drug Prices in Los Angeles: January–June 2004<br />
Type of Drug<br />
Cocaine<br />
Powder<br />
Crack Cocaine<br />
Heroin<br />
Mexican Black Tar<br />
Mexican Brown<br />
Powder<br />
Southeast Asian<br />
Southwest Asian<br />
Opium<br />
Wholesale<br />
Price<br />
Midlevel Retail<br />
$14,000–$17,000 per kilogram<br />
N/R 1<br />
$20,000 per kilogram<br />
$25,000 per kilogram<br />
$35,000–$40,000 per 300–350-<br />
gram unit<br />
$70,000–$80,000 per 700–750-<br />
gram unit<br />
$30,000 per kilogram<br />
$650–$800 per 18-gram stick<br />
$500–$600 per ounce<br />
$500–$1,200 per ounce<br />
$500–$800 per 25 grams<br />
N/R<br />
$80 per gram<br />
$10–$40 per rock<br />
South American<br />
Marijuana<br />
$86,000–$100,000 per kilogram N/R<br />
N/R<br />
Mexico-produced $300–$400 per pound<br />
$60–$80 per ounce<br />
$10 per gram<br />
Domestic<br />
$1,000–$1,200 per pound<br />
$200–$250 per ounce<br />
$25 per gram<br />
Sinsemilla<br />
$2,500–6,000 per pound<br />
$300–$600 per ounce<br />
$60–$80 per 1/8 ounce<br />
BC Bud<br />
$6,000 per pound<br />
N/R<br />
N/R<br />
Hashish $8,000 per pound N/R N/R<br />
Methamphetamine<br />
$5,000–$7,000 per pound<br />
$450–$550 per ounce<br />
$20 per 1/4 gram<br />
$40–$100 per gram<br />
$60 per 1/16 ounce<br />
$100–$120 per 1/8<br />
ounce<br />
Crystal Methamphetamine $8,000–$11,000 per pound<br />
$3,250–$4,000 double case<br />
$600–$800 per ounce<br />
N/R<br />
Pseudoephedrine<br />
(1 case=17,000 60-mg<br />
tablets)<br />
N/R N/R<br />
PCP $15,000–$20,000 per gallon $300–$350 per ounce<br />
$20–$30 per sherm<br />
cigarette<br />
LSD $150–$200 per sheet (100 doses) N/R $5–$10 per dose<br />
Psilocybin Mushrooms N/R N/R $20 per 1/8 ounce<br />
MDMA (ecstasy) $8,000 per boat (1,000 tablets)<br />
$275–$350 per gallon<br />
$12 per tablet (multiple quantities)<br />
$20–$40 per tablet<br />
GHB<br />
$80–$100 per liter<br />
$120 per 16 ounce bottle<br />
N/R $5–$20 per capful<br />
GBL $600 per liter NR N/R<br />
Ketamine N/R $100–$200 per 10 milliliter vial $20 per two-tenths gram<br />
Rohypnol (flunitrazepam) N/R N/R $6–$10 per 1-mg pill<br />
Steroids N/R N/R $10 per dose<br />
Valium (diazepam) N/R N/R $2 per tablet<br />
Vicodin (hydrocodone) N/R N/R $5 per 5-mg tablet<br />
OxyContin (oxycodone) N/R N/R $1 per mg<br />
MS Contin N/R N/R $20 per 60-mg tablet<br />
Percocet/Percodan N/R N/R $5–10 per 5-mg tablet<br />
Dilaudid (hydromorphone) N/R N/R $100 per 4-mg tablet<br />
Methadone N/R N/R $10 per tablet<br />
Codeine N/R N/R $5 per tablet<br />
Fentanyl Patch N/R N/R $25–$100 per patch<br />
1 N/R=Not reported.<br />
SOURCE: NDIC and LA CLEAR<br />
N/R<br />
N/R<br />
N/R<br />
N/R<br />
$90–$100 per gram<br />
N/R<br />
N/R<br />
N/R<br />
N/R<br />
N/R<br />
Proceedings of the Community Epidemiology Work Group, Vol. II, January 2005
<strong>EPIDEMIOLOGIC</strong> TRENDS IN <strong>DRUG</strong> <strong>ABUSE</strong>—Los Angeles County<br />
Exhibit 14. Number of ED Reports, by Drug Category and Case Type (Selected Drugs) in the Los Angeles<br />
County Division (Unweighted 1 ): January–June 2004<br />
Selected Drug Categories, by Case Type Number of ED Reports 1<br />
Antidepressants<br />
Seeking detoxification<br />
Overmedication<br />
Other<br />
Antipsychotics<br />
Seeking detoxification<br />
Overmedication<br />
Other<br />
Barbiturates<br />
Seeking detoxification<br />
Overmedication<br />
Other<br />
Benzodiazepines<br />
Seeking detoxification<br />
Overmedication<br />
Other<br />
Opiates/Opioids<br />
Seeking detoxification<br />
Overmedication<br />
Other<br />
Other Analgesics<br />
Seeking detoxification<br />
Overmedication<br />
Other<br />
1 The unweighted data are from 23 to 26 EDs reporting to Los Angeles area hospitals. All DAWN cases are reviewed for quality control.<br />
Based on this review, cases may be corrected or deleted. Therefore, these data are subject to change.<br />
SOURCE: DAWN Live!, OAS, SAMHSA, updated 1/18/05<br />
Proceedings of the Community Epidemiology Work Group, Vol. II, January 2005 119<br />
192<br />
2<br />
162<br />
28<br />
218<br />
0<br />
191<br />
27<br />
25<br />
1<br />
3<br />
21<br />
266<br />
16<br />
186<br />
64<br />
164<br />
26<br />
70<br />
68<br />
169<br />
1<br />
139<br />
29
120<br />
<strong>EPIDEMIOLOGIC</strong> TRENDS IN <strong>DRUG</strong> <strong>ABUSE</strong>—Los Angeles County<br />
Exhibit 15. Annual Adult/Adolescent AIDS Cases by Gender, Year of Diagnosis, and Exposure<br />
Category: 1997–2003<br />
Adult/Adolescent<br />
Exposure Category 1<br />
1997<br />
Number<br />
(%)<br />
1998<br />
Number<br />
(%)<br />
1999<br />
Number<br />
(%)<br />
2000<br />
Number<br />
(%)<br />
2001<br />
Number<br />
(%)<br />
2002 2<br />
Number<br />
(%)<br />
2003 2<br />
Number<br />
(%)<br />
Male-to-Male Sexual Contact 1,250 1,105<br />
Males<br />
1,007 886 847 866 746<br />
(66) (65) (64) (62) (61) (61) (64)<br />
Injection Drug Use 138 104 79 92 98 77 58<br />
(7) (6) (5) (6) (7) (5) (5)<br />
Male-to-Male Sexual Con- 119 106 92 94 87 87 63<br />
tact/Injection Drug Use<br />
(6) (6) (6) (7) (6) (6) (5)<br />
Hemophilia or Coagulation<br />
9
<strong>EPIDEMIOLOGIC</strong> TRENDS IN <strong>DRUG</strong> <strong>ABUSE</strong>—Miami-Ft. Lauderdale, Florida<br />
Drug Abuse in South Florida: January–June 2004<br />
James N. Hall 1 and Madeline Camejo, Pharm.D. 2<br />
ABSTRACT<br />
Indicators of cocaine abuse remain stable at high<br />
levels, with cocaine’s consequences accounting for<br />
one-half of drug deaths, medical emergencies, and<br />
addiction treatment admissions. Illicit street drugs<br />
dominate problems in Miami-Dade County, while<br />
rates of prescription medication abuse are higher in<br />
Broward and Palm Beach Counties. Heroin and<br />
narcotic prescription analgesics are fueling a major<br />
problem with opiate abuse. Broward and Palm<br />
Beach Counties lead the State in the number of<br />
heroin-related deaths, and both the wholesale and<br />
retail prices of heroin have declined over the past<br />
year. Methadone-related deaths are increasing.<br />
Marijuana is still the most commonly abused drug<br />
among young emergency department patients in<br />
local hospitals. More than one-third of addiction<br />
treatment admissions were for marijuana. The club<br />
drugs, MDMA (or ecstasy) and GHB, continue to<br />
decline in measures of their use and consequences.<br />
New sources and trafficking patterns have increased<br />
the flow of methamphetamine into South<br />
Florida, where the drug commands some of the<br />
highest street prices in the Nation. Prescription benzodiazepines<br />
are second only to alcohol in the number<br />
of substance-related deaths across Florida.<br />
INTRODUCTI<strong>ON</strong><br />
This report addresses drug abuse in Miami-Dade and<br />
Broward Counties, Florida, during the first half of<br />
2004. It includes data on drug-related deaths, medical<br />
emergencies, addiction treatment admissions, and law<br />
enforcement intelligence. Information is presented by<br />
primary substance of abuse, with topics including<br />
cocaine, heroin, other opiates, marijuana, gamma<br />
hydroxybutyrate (GHB), methylendioxymethamphetamine<br />
(MDMA or “ecstasy”), methamphetamine,<br />
and benzodiazepines. While the information is classified<br />
by a single drug or category, the reader should<br />
note an underlying problem of polysubstance abuse<br />
as mentioned throughout this report. Exhibits for the<br />
report follow the narrative text.<br />
Area Description<br />
Located in the extreme southern portion of the Florida<br />
peninsula, Miami-Dade County has a population of<br />
nearly 2.6 million; 56 percent are Hispanic, 21 percent<br />
are Black, 21 percent are White, and 2 percent are<br />
Asian/Pacific Islander. Miami is Dade County’s largest<br />
city, with 360,000 residents. More than 100,000 immigrants<br />
arrive in Florida each year; one-half establish<br />
residency in Miami-Dade County.<br />
Broward County, situated due north of Miami-Dade, is<br />
composed of Ft. Lauderdale plus 28 other municipalities<br />
and an unincorporated area. The county covers<br />
1,197 square miles, including 25 miles of coastline.<br />
According to the 2000 census, the population was<br />
1,649,925. The population is roughly 63 percent White<br />
non-Hispanic, 21 percent Black non-Hispanic, and 17<br />
percent Hispanic.<br />
Broward County is the second most populated county<br />
in Florida and accounts for approximately 10 percent of<br />
Florida’s population. Broward was the top growth<br />
county in Florida in the 1990s and added 367,000 more<br />
people during that decade. Palm Beach County (population<br />
1,154,464) is located due north of Broward<br />
County and is the third most populated county in the<br />
State. Together, the 5.4 million people of these 3 counties<br />
constitute one-third of the State’s 16.3 million<br />
population.<br />
Starting in 2003, these three counties constitute the new<br />
federally designated Metropolitan Statistical Area<br />
(MSA) for South Florida, making it the sixth largest in<br />
the Nation. Previously, the MSA was only Miami-Dade<br />
County. This means that Broward County will now be<br />
included in more national data sets tracking healthrelated<br />
conditions and criminal justice information. One<br />
change is that more local hospitals will become a part<br />
of the national Drug Abuse Warning Network<br />
1<br />
Mr. Hall is the director of the Center for the Study and Prevention of Substance Abuse at Nova Southeastern University and is executive director<br />
of Up Front Drug Information Center in Miami, Florida.<br />
2<br />
Dr. Camejo is affiliated with the Memorial Regional Hospital, Hollywood, Florida, and the United Way of Broward County Commission on<br />
Substance Abuse, Ft. Lauderdale, Florida.<br />
Proceedings of the Community Epidemiology Work Group, Vol. II, January 2005 121
(DAWN) that monitors emergency department (ED)<br />
mentions of drug-related episodes.<br />
Approximately 25 million tourists visit South Florida<br />
annually. The region is a hub of international transportation<br />
and the gateway to commerce between the<br />
Americas, accounting for sizable proportions of the<br />
Nation’s trade: 40 percent with Central America, 37<br />
percent with the Caribbean region, and 17 percent with<br />
South America. South Florida’s airports and seaports<br />
remain among the busiest in the Nation for both cargo<br />
and international passenger traffic. These ports of entry<br />
make this region a major gateway for illicit drugs.<br />
Smuggling by cruise ship passengers is an important<br />
trend in South Florida drug trafficking and has apparently<br />
been growing because of airline security increases<br />
after September 11, 2001.<br />
Several factors impact the potential for drug abuse<br />
problems in South Florida, including the following:<br />
• Proximity to the Caribbean and Latin America<br />
exposes South Florida to the entry and distribution<br />
of illicit foreign drugs destined for all regions<br />
of the United States. Haiti remains a major<br />
link with Colombian traffickers.<br />
• South Florida is a designated High Intensity Drug<br />
Trafficking Area and one of the Nation’s leading<br />
cocaine importation centers. It also became a<br />
gateway for Colombian heroin in the 1990s. Millions<br />
of MDMA (“ecstasy,” or “XTC”) tablets<br />
originate in the Benelux countries and often—<br />
more recently—are flown to the Caribbean before<br />
entering the United States in South Florida.<br />
• Extensive coastline and numerous private air and<br />
sea vessels make it difficult to pinpoint drug importation<br />
routes into Florida and throughout the<br />
Caribbean region.<br />
• Lack of a prescription monitoring system in<br />
Florida now makes the State a source for diverted<br />
medications throughout the southeastern<br />
United States.<br />
Data Sources<br />
This report describes current drug abuse trends in<br />
South Florida, using the data sources summarized<br />
below:<br />
• Drug-related mortality data were provided by<br />
the Florida Department of Law Enforcement<br />
(FDLE), Medical Examiners Commission's 2004<br />
Interim Report of Drugs Identified in Deceased<br />
122<br />
<strong>EPIDEMIOLOGIC</strong> TRENDS IN <strong>DRUG</strong> <strong>ABUSE</strong>—Miami-Ft. Lauderdale, Florida<br />
Persons by the Florida Medical Examiners’<br />
Commission.<br />
• Emergency department data for Miami-Dade<br />
County and Broward County, Florida, were accessed<br />
primarily through the Drug Abuse Warning<br />
Network (DAWN) Live! restricted-access<br />
online query system, which is administered by<br />
the Office of Applied Studies (OAS), Substance<br />
Abuse and Mental Health Services Administration<br />
(SAMHSA). In Miami-Dade County, 17 of<br />
the 21 eligible hospitals were in the DAWN sample<br />
in 2004; there were 17 EDs in the sample. In<br />
Broward County, the number of eligible hospitals<br />
totaled 27; 22 were in the DAWN sample, with a<br />
total of 22 EDs in the sample. The data in this paper<br />
are for the first half of 2004, with the exception<br />
of methamphetamine reports, which are for<br />
the full 12 months of 2004. All data were accessed<br />
from DAWN Live! on December 7, 2004,<br />
with the exception of the data from the two Broward<br />
County EDs for the first half of 2004. Data<br />
for the first 6 months from Broward County EDs<br />
were accessed by the CEWG representative directly<br />
from the two participating hospitals, since<br />
at least four EDs in an area must report before the<br />
data are accessible through DAWN Live!. The<br />
unweighted data reported in this paper were not<br />
complete. During the first 6 months of 2004, between<br />
8 and 10 EDs in Miami-Dade County reported<br />
data to DAWN; in the last 6 months, 5–10<br />
reported each month. In Broward County, between<br />
two and three EDs reported in the first 6<br />
months, and between four and seven reported over<br />
the last 6 months. Since all DAWN cases are reviewed<br />
for quality control, and may be corrected<br />
or deleted based on the review, the data reported<br />
here are subject to change. The information derived<br />
from DAWN Live! for this paper represents<br />
some case-type data but primarily represents drug<br />
reports in drug-related visits. Reports exceed the<br />
number of ED visits because a patient may report<br />
use of multiple drugs (up to six drugs and alcohol<br />
may be represented in DAWN). These data cannot<br />
be compared with DAWN data from 2002 and before,<br />
nor can these preliminary data be used for<br />
comparison with future data. Only weighted ED<br />
data released by SAMHSA can be used for trend<br />
analysis. A full description of the DAWN system<br />
can be found at the DAWN Web site<br />
.<br />
• Drug treatment data for the first half of 2004<br />
were provided by the Spectrum Programs, Inc.,<br />
and the Broward Addiction Recovery Centers<br />
Proceedings of the Community Epidemiology Work Group, Vol. II, January 2005
<strong>EPIDEMIOLOGIC</strong> TRENDS IN <strong>DRUG</strong> <strong>ABUSE</strong>—Miami-Ft. Lauderdale, Florida<br />
(BARC) of the Broward County Department of<br />
Human Services.<br />
• Crime lab drug analyses data were derived<br />
from the Drug Enforcement Administration’s<br />
(DEA) National Forensic Laboratory Information<br />
System (NFLIS) 2004 Annual Report for Miami-<br />
Dade County (October 1, 2003, to September 30,<br />
2004) and by the Broward Sheriff’s Office<br />
(BSO) Crime Lab in the first half of 2004 for<br />
Broward County.<br />
• Drug pricing data for South Florida were derived<br />
from the National Drug Intelligence Center<br />
(NDIC), Narcotics Digest Weekly, December 28,<br />
2004.<br />
• Heroin price and purity information is from<br />
the U.S. DEA Domestic Monitoring Program<br />
2003 Report.<br />
• Survey data on prevalence of drug use are from<br />
the Centers for Disease Control and Prevention’s<br />
(CDC’s) 2003 Youth Risk Behavior Survey and<br />
the National Institute on Drug Abuse’s (NIDA’s)<br />
2004 Monitoring the Future Survey of students<br />
in grades 8–12 nationally.<br />
Other information on drug use patterns was derived<br />
from ethnographic research and callers to local drug<br />
information hotlines.<br />
<strong>DRUG</strong> <strong>ABUSE</strong> PATTERNS AND TRENDS<br />
Cocaine/Crack<br />
Cocaine abuse indicators remain stable at high levels.<br />
Cocaine abuse rates in South Florida rank among the<br />
highest in the Nation, as indicated by drug deaths,<br />
hospital ED visits, crime lab data, and drug treatment<br />
admissions. Many of these indicators reflect cocaine<br />
use in combination with other drugs, including opiates<br />
and benzodiazepines.<br />
Throughout Florida, the number of cocaine-related<br />
deaths stabilized in the first half of 2004 after steadily<br />
increasing since 2001. There were 820 cocainerelated<br />
fatalities during the first half of 2004 across<br />
Florida, a 3-percent increase from the 799 deaths in<br />
the second half of 2003. There were 1,614 cocainerelated<br />
fatalities during all of 2003, representing a 23percent<br />
increase over the 1,307 cocaine-related fatalities<br />
in 2002 and a 46-percent increase from the total<br />
for 2001. Among the 2004 cases, 75 percent involved<br />
the use of another drug, thus reflecting prevalent<br />
polydrug abuse patterns with cocaine (exhibit 1). A<br />
large proportion of cocaine ED episodes also involved<br />
at least one other substance.<br />
There were 96 deaths related to cocaine abuse in Miami-Dade<br />
County during the first half of 2004 (exhibit<br />
2), representing a 1-percent increase over the<br />
total from 2003. One of the 2004 cocaine-related<br />
fatalities was younger than 18; 16 percent were age<br />
18–25, 17 percent were 26–34, 40 percent were 35–<br />
50, and 26 percent were older than 50. Cocainerelated<br />
deaths in Miami-Dade County totaled 189 in<br />
2003, 151 in 2002, 149 in 2001, 144 in 2000, 226 in<br />
1999, and 273 in 1998.<br />
There were 61 deaths related to cocaine abuse in<br />
Broward County during the first half of 2004 (exhibit<br />
3), representing a 23-percent decrease over the 79<br />
cases from the second half of 2003 and a small increase<br />
from the 59 cases during the first half of 2003.<br />
None of the 2004 cocaine-related fatalities was<br />
younger than 18; 11 percent were age 18–25, 18 percent<br />
were 26–34, 49 percent were 35–50, and 21 percent<br />
were older than 50. Cocaine-related deaths in<br />
Broward County totaled 138 in 2003, 121 in 2002, 94<br />
in 2001, 80 in 2000, and a record high 139 in 1999.<br />
In Florida, a drug is considered to be a cause of death<br />
if it is detected in an amount considered to be a lethal<br />
dose by the local medical examiner (ME). Statewide,<br />
the number of lethal cocaine-induced death cases declined<br />
slightly from 275 in the first half of 2003, to<br />
266 in the second half of that year, to 264 in the first 6<br />
months of 2004. Among the Miami-Dade cocaine<br />
deaths in the first half of 2004, the drug was detected<br />
at a lethal dose in 36 deaths or 38 percent of the cocaine-related<br />
deaths, up from 25 percent of the 2003<br />
cases and 21 percent of the 2002 cocaine-related<br />
deaths. Among the Broward County cocaine death<br />
cases in the first half of 2004, the drug was detected at<br />
a lethal dose level in 17 deaths or 28 percent of cocaine-related<br />
deaths, a proportion that is down from 45<br />
percent of 2003 cases and 53 percent of the 2002<br />
cases. Nonspecific, polydrug mixtures were detected<br />
in 75 percent of cocaine deaths statewide during the<br />
first half of 2004 (exhibit 1), 56 percent of the 96 such<br />
deaths in Miami-Dade County (exhibit 2), and 89 percent<br />
of the 61 cocaine-related deaths in Broward<br />
County (exhibit 3).<br />
Miami-Dade County had the highest number of cocaine-related<br />
deaths in the State during the first half of<br />
2004, with 96 cases, followed by Jacksonville with 90,<br />
St. Petersburg with 78, West Palm Beach with 72,<br />
Orlando with 69, and Broward County with 61. Miami<br />
reported the highest number of lethal cocaine deaths<br />
with 36, followed by West Palm Beach with 34.<br />
Proceedings of the Community Epidemiology Work Group, Vol. II, January 2005 123
Beginning in 2003, SAMHSA’s national DAWN<br />
Live! increased the number of hospitals reporting to<br />
the national system and enhanced the surveillance of<br />
drug-related hospital ED mentions to provide expanded<br />
and more rapid local reporting on such activity.<br />
In South Florida, DAWN is currently recruiting<br />
new hospitals for the system in Broward and Palm<br />
Beach Counties to complete coverage for the region’s<br />
newly expanded national MSA. The new area is<br />
named the Miami-Ft. Lauderdale MSA. DAWN will<br />
also expand to the Tampa/St. Petersburg MSA in<br />
Florida as well.<br />
Unweighted data on ED cocaine reports in Miami-<br />
Dade County were accessed from DAWN Live! for<br />
the first 6 months of 2004. Cocaine was clearly the<br />
most commonly involved illicit drug in local emergency<br />
department visits, accounting for 50 percent of<br />
the 5,163 Miami-Dade drug abuse reports in the first<br />
half of 2004 (exhibit 4).<br />
Most (72 percent) of the 2,594 Miami-Dade cocaineinvolved<br />
ED patients were male. Thirty percent were<br />
non-Hispanic Whites, 48 percent were non-Hispanic<br />
Blacks, and 18 percent were Hispanic/other. Cocaineinvolved<br />
ED patients were 30 years of age or older in<br />
77 percent of the reports, which continues a pattern<br />
of older cocaine ED patients. The patients’ ages were<br />
as follows: less than 1 percent (14) were age 12–17,<br />
11 percent were 18–24, 25 percent were 25–34, and<br />
63 percent were age 35 or older. Crack cocaine was<br />
specifically mentioned in 58 percent of the cocaine<br />
reports in which the route of administration was<br />
noted in the medical record during the first half of<br />
2004.<br />
Broward County drug-related ED episodes are based<br />
on a review of two Broward County hospitals participating<br />
in DAWN during the first 6 months of 2004.<br />
The network is expanding, and data from more hospitals<br />
will be included in future reports. Cocaine was<br />
clearly the most commonly reported illicit drug in<br />
local emergency department visits, accounting for 44<br />
percent of the 1,198 Broward drug abuse reports in<br />
the first half of 2004 (exhibit 5).<br />
Most (71 percent) of the 523 Broward cocaine ED<br />
patients were male. Fifty-four percent were non-<br />
Hispanic Whites, 38 percent were non-Hispanic<br />
Blacks, and 7 percent were Hispanic/other. Cocaineinvolved<br />
ED patients were 30 years of age or older in<br />
74 percent of these cases, which continues a pattern<br />
of older cocaine ED patients. The patients’ ages were<br />
as follows: less than 1 percent were in their teens, 10<br />
percent were age 18–24, 54 percent were 25–34, and<br />
32 percent were age 35 or older. Crack cocaine was<br />
124<br />
<strong>EPIDEMIOLOGIC</strong> TRENDS IN <strong>DRUG</strong> <strong>ABUSE</strong>—Miami-Ft. Lauderdale, Florida<br />
specifically mentioned in 17 percent of the cases in<br />
the first half of 2004.<br />
Addiction treatment profiles showed 1,674 BARC<br />
clients in treatment for cocaine in the first half of<br />
2004, representing 49 percent of BARC’s 3,416 clients.<br />
For Spectrum, 38 percent of its 641 clients, or<br />
244 patients, in the first half of 2004 were seeking<br />
treatment for cocaine addiction. Combined, the programs<br />
reported 1,919 cocaine treatment cases, or 47<br />
percent of the 4,057 total cases in the first half of<br />
2004. Most clients were older than 35, and most were<br />
non-Hispanic Whites.<br />
Powder cocaine and crack are still described as<br />
“widely available” throughout Florida. Cocaine is<br />
still the most commonly analyzed substance by the<br />
Miami-Dade and Broward Sheriff’s Office crime<br />
labs. It accounted for 10,496 cases in Miami-Dade<br />
for the 12-month period from October 2003 to September<br />
2004 and for 2,839 items analyzed in Broward<br />
County in the shorter period from January to<br />
June 2004. The second most commonly analyzed<br />
substance was marijuana in both counties. The number<br />
of cocaine cases analyzed in Miami-Dade is up<br />
12 percent from last year, and the total in Broward is<br />
down 9 percent from the 3,136 cases in the first 6<br />
months of 2003. However, beginning in 2001, the<br />
Broward Crime Lab began to work only those cases<br />
submitted by the State Attorney’s Office, and of<br />
those cases only the items requested. This has resulted<br />
in about a 20-percent decrease in the number<br />
of items tested.<br />
According to the National Drug Intelligence Center,<br />
in South Florida powder cocaine sells for $18,000–<br />
$26,000 per kilogram wholesale, $700–$800 per<br />
ounce, and $40–$110 per gram retail. Crack cocaine<br />
sells for $700–$800 per ounce, $100 per gram, and<br />
$10–$20 per “rock” in South Florida.<br />
In 2003, current cocaine use was reported in results<br />
of the CDC’s Youth Risk Behavior Survey by 2.2<br />
percent of Broward County high school students<br />
(down from 2.6 percent in 2001) (exhibit 6). This was<br />
the lowest proportion in the State. Among Miami-<br />
Dade County high school students, 3.2 percent reported<br />
current cocaine use in 2003 (down from 4.0<br />
percent in 2001). In Palm Beach County, 4.6 percent<br />
of high school students reported current cocaine use<br />
in the same survey. The proportion for the high<br />
school students in all of Florida was 4.0 percent,<br />
compared with 4.1 percent for students nationwide.<br />
Nationally, the 2004 Monitoring the Future Survey<br />
reported that current cocaine use (defined as any use<br />
Proceedings of the Community Epidemiology Work Group, Vol. II, January 2005
<strong>EPIDEMIOLOGIC</strong> TRENDS IN <strong>DRUG</strong> <strong>ABUSE</strong>—Miami-Ft. Lauderdale, Florida<br />
within the past 30 days) was reported by 0.9 percent<br />
of 8th graders, 1.7 percent of 10th graders, and 2.3<br />
percent of 12th graders. These percentages reflected<br />
no change for 8th graders from the same survey in<br />
2003, a 0.4-percent increase for 10th graders, and a<br />
0.3-percent increase for 12th graders.<br />
Heroin<br />
The wholesale and retail prices of heroin have declined<br />
locally over the past year as the area has experienced<br />
a diversification of opioid abuse to include<br />
oxycodone, methadone, hydrocodone, heroin, and<br />
other opioids. Frequently, benzodiazepines are involved<br />
as well. Most deaths, ED visits, and addiction<br />
treatment admissions continue to be among older,<br />
White males.<br />
Broward County, along with Palm Beach County, led<br />
the State in the number of heroin-related deaths in the<br />
first half of 2004. South American heroin has been<br />
entering the area over the past decade. Abuse of narcotic<br />
pain medication has fueled opioid consequences.<br />
Polydrug abuse patterns have facilitated<br />
first-time use of opioid drugs, including heroin.<br />
Throughout Florida, there were 110 heroin-related<br />
deaths in the first half of 2004, representing a 6percent<br />
decline from the 117 such deaths in the previous<br />
6 months. Heroin was found to be the most<br />
lethal drug, with 82 percent (n=90) of heroin-related<br />
deaths being caused by the drug in the first 6 months<br />
of 2004, a 10-perent decline from the second half of<br />
2003. Yet deaths from narcotic opiates increased 13<br />
percent over the same period. Polysubstance abuse<br />
was noted in 82 percent of the heroin-related deaths<br />
statewide (exhibit 1). Across Florida, there were 261<br />
heroin-related deaths in 2003, which represented a<br />
20-percent decline from the previous year. During all<br />
of 2002, there were 326 heroin-related deaths, a<br />
slight decline of only 2 cases from 328 such deaths in<br />
2001.<br />
In the first half of 2004, Broward County and Palm<br />
Beach County had the greatest number of heroinrelated<br />
deaths in the State, with 16 cases each. They<br />
were followed by Orlando (15 cases), Miami-Dade<br />
County (12 cases), Sarasota (11 cases), Tampa (11<br />
cases), and St. Petersburg (9 cases).<br />
In Miami-Dade County, heroin was found at a lethal<br />
dose level in all of the 12 deaths in which heroin was<br />
detected. Other drugs were detected in seven (58 percent)<br />
of the cases (exhibit 2). None of the heroinrelated<br />
fatalities was younger than 26; 33 percent<br />
were age 26–34, 50 percent were 35–50, and 17 percent<br />
were older than 50.<br />
The 12 heroin-related deaths in Miami-Dade during<br />
the first half of 2004 reflected a 25-percent decrease<br />
over the number in 2003. In all of 2003, there were 32<br />
heroin-related deaths, compared to the 36 heroinrelated<br />
deaths in 2002 and 32 in 2001. Heroin deaths<br />
peaked in Miami-Dade County in 2000 with 61 deaths.<br />
In Broward County, the 16 deaths in which heroin<br />
was detected included 9 cases (56 percent) in which it<br />
was found at a lethal dose level. Other drugs were<br />
detected in 15 (94 percent) of the cases (exhibit 3).<br />
None of the heroin-related fatalities was younger than<br />
18; 13 percent were age 18–25, 38 percent were 26–<br />
34, 19 percent were 35–50, and 31 percent were older<br />
than 50.<br />
The 16 heroin-related deaths during the first half of<br />
2004 in Broward County reflected a 33-percent decrease<br />
over the 24 such deaths in the previous 6<br />
months. In all of 2003, there were 49 heroin-related<br />
deaths, compared to the 50 heroin-related deaths in<br />
2002 and 41 in 2001. The relatively low number of<br />
24 heroin-related deaths in 2000 was attributed to a<br />
sharp rise in other opioid deaths linked to prescription<br />
narcotics at that time. The increase in heroinrelated<br />
deaths over the past 8 years rose from 9 in<br />
1995 to 49 in 2003.<br />
Based on unweighted data accessed from DAWN<br />
Live! from Miami-Dade County emergency departments<br />
during the first half of 2004, there were a total<br />
of 661 heroin reports, representing 13 percent of all<br />
illicit substance reports (exhibit 4). Males accounted<br />
for 81 percent of these patients, and 49 percent were<br />
non-Hispanic Whites. Blacks represented 27 percent<br />
of the heroin ED patients, and Hispanics accounted<br />
for 25 percent of the patients. There were two patients<br />
younger than 15 and two age 12–17, while 11<br />
percent were age 18–24, 34 percent were 25–34, and<br />
54 percent were older than 34. Among the 218 heroin<br />
patients for whom the route of administration was<br />
included in the medical record, 78 percent injected<br />
the heroin, 21 percent reported snorting, and 1 percent<br />
cited smoking heroin.<br />
Unweighted data for the first half of 2004 from the<br />
Broward emergency departments identified a total of<br />
54 heroin reports, representing 5 percent of all illicit<br />
substance abuse ED reports (exhibit 5). The heroin<br />
ED patients were predominantly older White males<br />
experiencing withdrawal and/or seeking detoxification.<br />
Males accounted for 76 percent of the patients,<br />
and 80 percent were non-Hispanic Whites. Hispanics<br />
accounted for 11 percent of the heroin ED patients,<br />
and Blacks represented 9 percent of the patients.<br />
There were no patients younger than 18, while 7 percent<br />
were age 18–24, 28 percent were age 25–34, and<br />
Proceedings of the Community Epidemiology Work Group, Vol. II, January 2005 125
65 percent were older than 34. The most common<br />
reason for a heroin patient to visit the ED was dependence<br />
and withdrawal or seeking detoxification in<br />
51 percent of the cases.<br />
BARC reported that 15 percent (n=506) of its 3,416<br />
clients in the first half of 2004 were admitted for heroin<br />
addiction. Spectrum Programs reported 3 percent<br />
(22) of the 641 addiction clients served in the first<br />
half of 2004 sought treatment for heroin. Combined,<br />
the two programs had 528 heroin clients or 13 percent<br />
of their 4,057 patients during the first 6 months<br />
of 2004. A majority of clients were older than 35 and<br />
non-Hispanic White.<br />
Heroin accounted for 608 crime lab cases in Miami-<br />
Dade for the 12-month period from October 2003 to<br />
September 2004 according to the NFLIS, representing<br />
4 percent of all drugs tested and a 2-percent increase<br />
over the total for the previous year. There<br />
were 87 heroin cases worked by the Broward Sheriff’s<br />
Office Crime Lab in the first half of 2004, a 51percent<br />
decrease from the 171 heroin cases in the<br />
second half of 2003 and a slight increase from the 85<br />
cases reported in the first half of 2003. The U.S. DEA<br />
Do-mestic Monitoring Program analyzed 39 streetlevel<br />
samples of heroin in South Florida in 2003. All<br />
of the samples were of South American heroin, and<br />
they averaged 25.6 percent pure heroin. The average<br />
price per milligram pure was $0.90. Nationally, there<br />
were 468 South American heroin samples tested by<br />
the program in 2003. The average purity was 41.8<br />
percent heroin, and the average price was $0.89 per<br />
milligram pure.<br />
Colombian heroin is widely available in South Florida<br />
as described by law enforcement officials and<br />
epidemiologists/ethnographers. According to NDIC,<br />
1 kilogram of heroin sells for $45,000–$65,000 in the<br />
region and for $2,500 per ounce; retail prices are<br />
roughly $100–$150 per gram. The top price for heroin<br />
has dropped 19 percent at the kilogram level and<br />
25 percent at the gram level in the past 12 months.<br />
The most common street unit of heroin is a bag of<br />
heroin (roughly 20 percent purity) weighing about<br />
one-tenth of a gram that sells for $10.<br />
In 2003, any lifetime heroin use was reported in results<br />
of the CDC’s Youth Risk Behavior Survey by<br />
2.3 percent of high school students in Broward<br />
County (exhibit 6). This was the lowest proportion in<br />
the region and represented a 30-percent decline from<br />
the 2001 rate of 3.3 percent. Among high school students<br />
in Miami-Dade County, 2.5 percent reported<br />
lifetime heroin use. In Palm Beach County, 3.7 percent<br />
of high school students reported lifetime heroin<br />
use in the same survey. The proportion for the high<br />
126<br />
<strong>EPIDEMIOLOGIC</strong> TRENDS IN <strong>DRUG</strong> <strong>ABUSE</strong>—Miami-Ft. Lauderdale, Florida<br />
school students in all of Florida and nationwide as<br />
well was 3.3 percent.<br />
Nationally, the 2004 Monitoring the Future Survey<br />
reported that current use of heroin (defined as any use<br />
within the past 30 days) was reported by 0.5 percent<br />
of 8th, 10th, and 12th graders. These percentages<br />
reflected no change for 8th graders from the same<br />
survey in 2003 and a 0.1-percent increase for 10th<br />
and 12th graders.<br />
Other Opiates<br />
Deaths from opiates other than heroin (including hydrocodone,<br />
oxycodone, and methadone) have been<br />
tracked in Florida since 2000. Beginning in 2003,<br />
morphine, propoxyphene, fentanyl, hydromorphone,<br />
meperidine, and other opioids were included in the<br />
Florida Medical Examiners Commission’s surveillance<br />
monitoring program.<br />
Methadone-related deaths statewide increased 32<br />
percent between the last 6 months of 2003 and the<br />
first half of 2004, when they reached 392. This continues<br />
a steady increase of methadone-related deaths<br />
since 2001. Methadone was the cause of death in 67<br />
percent of the methadone cases during the first half of<br />
2004, causing a 50-percent increase in methadoneinduced<br />
deaths compared to the last half of 2003.<br />
The number of oxycodone-related deaths increased 9<br />
percent statewide between the last 6 months of 2003<br />
and the first half of 2004, when they reached 333.<br />
Oxycodone was the cause of death in 50 percent of<br />
the oxycodone cases during the first half of 2004,<br />
causing an 18-percent increase in oxycodone-induced<br />
deaths compared to the last half of 2003.<br />
The number of hydrocodone deaths increased 6 percent<br />
statewide between the last 6 months of 2003 and<br />
the first half of 2004, when they reached 293. Hydrocodone<br />
was the cause of death in 36 percent of the<br />
hydrocodone-related deaths during the first half of<br />
2004, causing a 25-percent increase in hydrocodoneinduced<br />
deaths compared to the last half of 2003.<br />
Additional opiate-related analgesic deaths statewide<br />
in the first half of 2004 included morphine (307),<br />
propoxyphene (184), fentanyl (93), hydromorphone<br />
(42), meperidine (17), and other opioids (106). When<br />
the ME mentions for all opiate analgesics are added<br />
to those for heroin, these opioid-related ME mentions<br />
in Florida during the first half of 2004 total 1,877<br />
cases. This total is even greater than the 1,720 alcohol-related<br />
deaths during the same 6 month period.<br />
Most of the statewide opioid cases were polydrug<br />
episodes, including 88 percent of the oxycodone ME<br />
Proceedings of the Community Epidemiology Work Group, Vol. II, January 2005
<strong>EPIDEMIOLOGIC</strong> TRENDS IN <strong>DRUG</strong> <strong>ABUSE</strong>—Miami-Ft. Lauderdale, Florida<br />
cases, 87 percent of the methadone ME cases, 85<br />
percent of the hydrocodone ME cases, 82 percent of<br />
the heroin deaths, 79 percent of propoxyphene<br />
deaths, and 75 percent of morphine ME cases (exhibit<br />
1).<br />
Miami-Dade County recorded 16 oxycodone-related<br />
deaths during the first half of 2004, of which 6 (38<br />
percent) were oxycodone induced. Fourteen of these<br />
deaths (88 percent) involved oxycodone found in<br />
combination with at least one other drug (exhibit 2).<br />
Miami-Dade County recorded 10 hydrocodonerelated<br />
deaths during the first half of 2004, and 3 (30<br />
percent) were hydrocodone induced. Miami-Dade<br />
County recorded six methadone-related deaths during<br />
the first half of 2004, with four (67 percent) considered<br />
methadone induced. Miami-Dade recorded 22<br />
morphine-related deaths during the first half of 2004,<br />
of which 6 (27 percent) were morphine induced. There<br />
were seven propoxyphene-related deaths in Miami-<br />
Dade County during the first half of 2004, of which<br />
two (29 percent) were propoxyphene induced.<br />
Broward County recorded 37 oxycodone-related<br />
deaths during the first half of 2004, of which 25 (68<br />
percent) were oxycodone induced. All of these deaths<br />
involved oxycodone found in combination with at<br />
least one other drug (exhibit 3). Broward County recorded<br />
18 hydrocodone-related deaths during the first<br />
half of 2004, and 10 (56 percent) were hydrocodone<br />
induced. Broward County recorded 39 methadonerelated<br />
deaths during the first half of 2004, with 22<br />
(56 percent) considered methadone induced. Broward<br />
County recorded 23 morphine-related deaths during<br />
the first half of 2004, of which 6 (26 percent) were<br />
morphine induced. Broward County recorded 13 propoxyphene-related<br />
deaths during the first half of<br />
2004, of which 4 (31 percent) were propoxyphene<br />
induced. The two drugs from this category for which<br />
there were increases in related deaths between 2003<br />
and the first half of 2004 in Broward County are<br />
methadone and morphine.<br />
Unweighted data accessed from DAWN Live! for<br />
Miami-Dade County EDs for the first half of 2004<br />
show 101 oxycodone ED reports. There were also 33<br />
hydrocodone ED reports, 20 methadone reports, and<br />
44 ED reports from 9 other narcotic analgesics. Of<br />
the total 198 narcotic analgesic ED reports, males<br />
accounted for 56 percent of the patients. White, non-<br />
Hispanics represented 60 percent of the patients; 15<br />
percent were Black non-Hispanics; and 24 percent<br />
were Hispanic/other. There were two patients<br />
younger than 18, while 9 percent of the narcotic analgesic<br />
ED patients were age 18–24, 18 percent were<br />
25–34, and 72 percent were older than 34.<br />
Unweighted data from the Broward County EDs for<br />
the first half of 2004 show 42 oxycodone ED reports.<br />
Males accounted for 66 percent of these patients.<br />
White, non-Hispanics represented 85 percent of the<br />
patients; 7 percent were Black, non-Hispanics; and 5<br />
percent were Hispanic/other. There were no patients<br />
younger than 18, while 21 percent of the oxycodone<br />
ED patients were age 18–24, 26 percent were 25–34,<br />
and 52 percent were older than 34. The most common<br />
reasons or chief complaints for the oxycodone<br />
ED patients to visit the ED were overdose and altered<br />
mental status.<br />
The NFLIS reported 51 oxycodone crime lab cases,<br />
31 hydrocodone cases, and 9 methadone cases in the<br />
12-month period from October 2003 to September<br />
2004 in Miami-Dade County. The Broward Sheriff’s<br />
Office Crime Lab worked 139 oxycodone cases in<br />
the first 6 months of 2004. That is a 15-percent increase<br />
from the 120 oxycodone cases in the second<br />
half of 2003. There were also 96 hydrocodone cases<br />
in the first 6 months of 2004, compared to 73 cases in<br />
the last half of 2003.<br />
Nationally, the 2004 Monitoring the Future Survey<br />
reported that current use of opiates other than heroin<br />
(defined as any use within the past 30 days) was reported<br />
by 4.3 percent of 12th graders, representing a<br />
0.2-percent increase from the same survey in 2003.<br />
Marijuana<br />
Marijuana is abused by more Americans, particularly<br />
youth, than any other illicit drug. Consequences of its<br />
abuse and addiction continue even as rates of its use<br />
are declining among youth.<br />
Cannabinoids were detected in 460 deaths statewide<br />
in Florida during the first half of 2004, representing<br />
an increase of 40 percent from the 328 such cases<br />
during the previous 6 months.<br />
Unweighted data accessed from DAWN Live! for the<br />
Miami-Dade hospital emergency departments show<br />
that marijuana was involved in 21 percent or 1,109 of<br />
the 5,163 drug abuse ED reports in the first half of<br />
2004 (exhibit 4). Seventy-eight percent of the marijuana<br />
ED patients were male. Non-Hispanic Blacks<br />
accounted for 47 percent of these patients; non-<br />
Hispanic Whites accounted for 30 percent; and Hispanic/others<br />
accounted for 23 percent. There were 40<br />
patients (4 percent) younger than 18, while 28 percent<br />
of the patients were age 18–24, 30 percent were<br />
25–34, and 38 percent were older than 34.<br />
Unweighted ED data from Broward County show<br />
that marijuana was involved in 19 percent or 231 of<br />
Proceedings of the Community Epidemiology Work Group, Vol. II, January 2005 127
the 1,198 drug abuse ED reports in the first half of<br />
2004 (exhibit 5). Sixty-four percent of the marijuana<br />
ED patients were male. Non-Hispanic Whites accounted<br />
for 76 percent of these patients, non-<br />
Hispanic Blacks for 16 percent, and Hispanics/other<br />
for 7 percent. Marijuana is still the most commonly<br />
abused illicit drug among young people visiting the<br />
emergency department. Roughly 67 percent of all<br />
illicit substance abuse patients in the 12–34 age<br />
group involved marijuana. There were 17 patients (7<br />
percent) younger than 18, while 27 percent of patients<br />
were age 18–24, 34 percent were 25–34, and 32<br />
percent were older than 34.<br />
BARC reported that 32 percent (n=1,080) of its<br />
3,416 clients in the first half of 2004 were admitted<br />
for marijuana addiction. Spectrum Programs reported<br />
57 percent (370) of the 641 addiction clients served<br />
in the first half of 2004 sought treatment for marijuana.<br />
Combined, the two programs had 1,450 marijuana<br />
clients (36 percent) among their 4,057 patients<br />
during the first 6 months of 2004. Approximately<br />
one-half of marijuana clients from both programs<br />
were non-Hispanic Whites, one-third were non-<br />
Hispanic Blacks, and the remainder were Hispanics/other.<br />
Most (45 percent) of Spectrum Programs<br />
marijuana clients were younger than 18, and most (43<br />
percent) of the BARC clients were age 35 or older.<br />
The NFLIS reported 3,111 marijuana crime lab cases<br />
in Miami-Dade County in the 12-month period from<br />
October 2003 to September 2004, representing 20<br />
percent of all exhibits analyzed. There were 461<br />
marijuana cases worked by the BSO Crime Lab in the<br />
first half of 2004. Statewide, marijuana was seized<br />
more frequently than any other illicit drug in Florida.<br />
Marijuana is still described as widely available<br />
throughout Florida, with local commercial, sinsemilla,<br />
and hydroponic grades available. A pound of<br />
commercial grade marijuana sells for $450–$1,000<br />
per pound. Hydroponic grades sell for $2,500–$4,000<br />
per pound. Commerical grade prices range from $100<br />
to $150 per ounce, while hydroponic grade marijuana<br />
sells for $350–$450 per ounce. Depending on its potency,<br />
marijuana may sell for $5–$18 per gram.<br />
In 2003, current marijuana use was reported in results<br />
of the CDC’s Youth Risk Behavior Survey by 17.9<br />
percent of high school students in Broward County<br />
(down from 21.8 percent in 2001) and by 15.8 percent<br />
of high school students in Miami-Dade County<br />
(down from 17 percent in 2001) (exhibit 6). In Palm<br />
Beach County, 22.6 percent of high school students<br />
reported current marijuana use in the same survey.<br />
The proportion for the high school students in all of<br />
Florida was 21.4 percent, compared with 22.4 percent<br />
for students nationwide.<br />
128<br />
<strong>EPIDEMIOLOGIC</strong> TRENDS IN <strong>DRUG</strong> <strong>ABUSE</strong>—Miami-Ft. Lauderdale, Florida<br />
Nationally, the 2004 Monitoring the Future Survey<br />
reported that current marijuana use (defined as any<br />
use within the past 30 days) was reported by 6.4 percent<br />
of 8th graders, 15.9 percent of 10th graders, and<br />
19.9 percent of 12th graders. These percentages reflected<br />
a 1.2-percent decrease for 8th and 10th graders<br />
from the same survey in 2003 and a 1.3-percent<br />
decrease for 12th graders.<br />
Gamma Hydroxybutyrate (GHB)<br />
GHB, an anesthetic, has been a commonly abused<br />
substance in South Florida for the past 8 years. There<br />
are several compounds that are converted by the body<br />
to GHB, including gamma butyrolactone (GBL) and<br />
1,4 butanediol (1,4 BD). Most recently, GHB abuse<br />
involves the abuse of 1,4 BD. Indicators of abuse of<br />
these drugs continue to decline. Commonly used with<br />
alcohol, they have been implicated in drug-facilitated<br />
rapes and other crimes. They have a short duration of<br />
action and are not easily detectable on routine hospital<br />
toxicology screens. GHB was declared a federally<br />
controlled Schedule I drug in March 2000, and indicators<br />
of its abuse have declined since that time.<br />
More recently, GHB and its related substances are<br />
reported to be used by those seeking to come down<br />
from stimulant effects of methamphetamine.<br />
There were four GHB-related deaths statewide during<br />
the first half of 2004. The drug was considered the<br />
cause of death in three (75 percent) of these cases.<br />
There were 5 GHB-related deaths reported statewide<br />
during the second half of 2003 and 11 GHB-related<br />
deaths in all of 2003, 3 (27 percent) of which were<br />
considered to have been caused by the drug. In all of<br />
Florida, GHB-related deaths increased from 23 in<br />
2000 to 28 in 2001 and then declined to 19 in 2002<br />
and again in 2003 to 11.<br />
Unweighted data accessed from DAWN Live! for<br />
Miami-Dade County show 12 GHB-related ED reports<br />
in the first half of 2004. One-half of the patients<br />
were male, 80 percent were White, non-Hispanic, and<br />
20 percent were Hispanic. Five of the patients (42<br />
percent) were age 21–24; 33 percent were age 25–34,<br />
and 25 percent were older than 35.<br />
From the previous tracking system for drug-related<br />
hospital ED episodes in Broward County, there had<br />
been a dramatic decrease in the number of GHB<br />
emergency department cases treated in emergency<br />
departments from 2000 to 2003. The Broward General<br />
Medical Center Emergency Department treated<br />
three people with GHB or GHB precursor overdose<br />
in 1996. The number of these cases increased to 48 in<br />
1999 and peaked at 77 in 2000. There were 71 GHB<br />
cases in 2001 and 34 cases in 2002. In 2003, there<br />
Proceedings of the Community Epidemiology Work Group, Vol. II, January 2005
<strong>EPIDEMIOLOGIC</strong> TRENDS IN <strong>DRUG</strong> <strong>ABUSE</strong>—Miami-Ft. Lauderdale, Florida<br />
were 30 GHB ED cases at BGMC. This downward<br />
trend reflects the national pattern with GHB since<br />
2000, when the drug was banned by Federal legislation.<br />
In the unweighted DAWN data, there was only<br />
one GHB-related ED report for Broward County in<br />
the first half of 2004; this may change as more hospitals<br />
join the network. The one patient was a White,<br />
non-Hispanic, female age 21–24.<br />
The NFLIS reported there were 18 1,4 butanediol<br />
(1,4 BD) crime lab cases in Miami-Dade County in<br />
the 12-month period from October 2003 to September<br />
2004, and there were no GHB cases.<br />
Methylenedioxymethamphetamine (MDMA, or<br />
“Ecstasy”)<br />
MDMA’s popularity appears to be declining. Measures<br />
of MDMA abuse suggest problems may have<br />
peaked in 2001.<br />
Ecstasy pills generally contain 75–125 milligrams of<br />
MDMA, although pills are often adulterated and may<br />
contain other drugs being sold as “ecstasy.” The major<br />
sources of the designer logo-emblazoned pills<br />
seem to be clandestine labs in Western Europe, especially<br />
the Netherlands and Belgium (and more recently<br />
Spain). The pills enter South Florida from the<br />
Caribbean because of post 9-11 airline security.<br />
There were 17 MDMA-related deaths statewide in<br />
Florida during the first half of 2004, with the drug<br />
being cited as the cause of death in 1 of these cases.<br />
There were also 13 methylenedioxyamphetamine<br />
(MDA)-related deaths statewide in Florida during the<br />
first half of 2004, with that drug being cited as the<br />
cause of death in 1 of the cases. There were 13<br />
MDMA-related deaths and 9 MDA-related deaths<br />
during the last half of 2003, down from the 23<br />
MDMA deaths and 12 MDA deaths in the first half<br />
of that year.<br />
Unweighted DAWN data show 48 MDMA ED reports<br />
from Miami-Dade County during the first half<br />
of 2004. Males accounted for 74 percent of these<br />
patients. White, non-Hispanics accounted for 43 percent<br />
of the patients; Hispanics accounted for 34 percent;<br />
and Black, non-Hispanics accounted for 23 percent.<br />
Two (4 percent) of the patients were younger<br />
than 18, 54 percent were age 18–24, 27 percent were<br />
age 25–34, and 15 percent were older than 35.<br />
In the unweighted DAWN data for Broward County<br />
in the first half of 2004, there were four MDMArelated<br />
ED reports. Two of the patients were males<br />
and two were females; two were non-Hispanic<br />
Whites and two were non-Hispanic Blacks. One was<br />
age 12–17, two were 18–20, and one was 25–29.<br />
The NFLIS reported the Miami-Dade Crime Lab analyzed<br />
266 MDMA exhibits and 28 MDA exhibits in<br />
the 12-month period from October 2003 to September<br />
2004, representing 2 percent of all substances<br />
analyzed. In the first half of 2004, MDMA was the<br />
sixth most common case worked at the Broward<br />
Sheriff’s Office Crime Lab, behind cocaine, alprazolam,<br />
marijuana, oxycodone, and hydrocodone. In<br />
the first half of 2004, there were 57 BSO MDMA<br />
cases analyzed and 9 MDA cases. In the last half of<br />
2003, the Crime Lab analyzed 58 MDMA cases and<br />
10 MDA cases. The number of MDMA cases peaked<br />
in the first half of 2001 with 132 cases and declined<br />
67 percent in the first half of 2004 (exhibit 7).<br />
In South Florida, ecstasy tablets sell for $5–$7 per<br />
tablet wholesale (in bulk), $10–$20 retail for a single<br />
pill, or up to $50 per pill at expensive nightclubs.<br />
These prices have remained the same since 2002.<br />
In 2003, any lifetime ecstasy use was reported in results<br />
of the CDC’s Youth Risk Behavior Survey by<br />
7.8 percent of high school students in Broward<br />
County and by 8.2 percent of high school students in<br />
Miami-Dade County (exhibit 6). In Palm Beach<br />
County, 12.1 percent of high school students reported<br />
lifetime ecstasy use in the same survey. The proportion<br />
for the high school students in Florida was 9.7<br />
percent, compared with 11.1 percent by high school<br />
students nationwide.<br />
Nationally, the 2004 Monitoring the Future Survey<br />
reported that current MDMA (ecstasy) use (defined<br />
as any use within the past 30 days) was reported by<br />
0.8 percent of 8th and 10th graders and 1.2 percent of<br />
12th graders. These proportions reflected a 0.1percent<br />
increase for 8th graders from the same survey<br />
in 2003, a 0.4-percent decrease for 10th graders, and<br />
no change for 12th graders.<br />
Other Stimulants<br />
Methamphetamine abuse continues to be a local<br />
problem. Law enforcement sources confirm increased<br />
trafficking from Atlanta and North Carolina of high<br />
grade Mexican-manufactured methamphetamine.<br />
There have also been several seizures of relatively<br />
small local methamphetamine labs. Signs of methamphetamine<br />
abuse spreading to new populations indicate<br />
the local epidemic has progressed from the incubation<br />
period of the past 3 years to an expansion phase<br />
with growing numbers of users.<br />
Proceedings of the Community Epidemiology Work Group, Vol. II, January 2005 129
“Crystal” or smokeable methamphetamine has been<br />
shipped by overnight delivery from California for several<br />
years. Mexican drug trafficking organizations<br />
were also mentioned as a source of powdered<br />
methamphetamine in 2003. More recently, active trafficking<br />
from Georgia and North Carolina of highgrade<br />
Mexican-produced crystal methamphetamine<br />
has been observed.<br />
Methamphetamine-related deaths totaled 47 in the<br />
first half of 2004 statewide in Florida, representing a<br />
38-percent increase from the 34 such deaths in the<br />
previous 6 months. Methamphetamine was considered<br />
the cause of death in 10 of the 47 cases in the<br />
first half of 2004. There were also 43 amphetaminerelated<br />
deaths in the first 6 months of 2004 in Florida,<br />
a 26-percent increase over the last half of 2003. Amphetamine<br />
was considered the cause of death in 3 of<br />
the 43 cases in the first half of 2004.<br />
Unweighted data accessed from DAWN Live! show<br />
15 methamphetamine-related ED reports during the<br />
first half of 2004 in Miami-Dade County. There was<br />
only one methamphetamine-related DAWN ED report<br />
for Broward County in the first half of 2004. In<br />
the second half of 2004 as more hospitals joined the<br />
network, there were 13 methamphetamine-related ED<br />
reports in Broward County, and there were 26 such<br />
reports from Miami-Dade County. From January<br />
2003 to December 2004, the unweighted DAWN data<br />
show 95 methamphetamine-related ED reports in<br />
these South Florida EDs; 87 percent of these patients<br />
were males. White, non-Hispanics accounted for 58<br />
percent of the ED patients, Hispanics for 28 percent,<br />
and Blacks for 13 percent. No methamphetamine ED<br />
patients were younger than 18; 29 percent were age<br />
18–24, 48 percent were age 25–34, and 22 percent<br />
were older than 34.<br />
The NFLIS reported the Miami-Dade Crime Lab analyzed<br />
150 methamphetamine exhibits in the 12month<br />
period from October 2003 to September 2004,<br />
representing 1 percent of all substances analyzed. In<br />
the first half of 2004, there were 55 Broward Sheriff’s<br />
Office Crime Lab methamphetamine cases analyzed.<br />
In the last half of 2003, there were 54 such<br />
cases, compared to 36 cases in the first 6 months of<br />
2003. The number of cases has more than doubled<br />
since 2001.<br />
Statewide, the number of clandestine methamphetamine<br />
labs or equipment seizures has risen from 30<br />
cases in fiscal year 2000 (October 1999 to September<br />
2000) to 332 in the fiscal year ending September 30,<br />
2004 (exhibit 8).<br />
130<br />
<strong>EPIDEMIOLOGIC</strong> TRENDS IN <strong>DRUG</strong> <strong>ABUSE</strong>—Miami-Ft. Lauderdale, Florida<br />
In South Florida, methamphetamine has some of the<br />
highest prices in the nation: $15,000–$20,000 per<br />
pound and $900–$1,200 per ounce. Higher potency<br />
“crystal” methamphetamine sells for $1,800–$2,000<br />
per ounce and $50 per quarter gram.<br />
In 2003, any lifetime methamphetamine use was reported<br />
in results of the CDC’s Youth Risk Behavior<br />
Survey by 4.5 percent of high school students in<br />
Broward County (down from 5.6 percent in 2001)<br />
and by 3.8 percent of high school students in Miami-<br />
Dade County (down from 4.8 percent in 2001) (exhibit<br />
6). In Palm Beach County, 7.1 percent of high<br />
school students reported lifetime methamphetamine<br />
use in the same survey. The proportion for the high<br />
school students in all of Florida was 6.4 percent,<br />
compared with 7.6 percent for high school students<br />
nationwide (exhibit 6).<br />
Nationally, the 2004 Monitoring the Future Survey<br />
reported that current methamphetamine use (defined<br />
as any use within the past 30 days) was reported by<br />
0.6 percent of 8th graders, 1.3 percent of 10th graders,<br />
and 2.3 percent of 12th graders. These figures<br />
reflected a 0.6-percent decrease for 8th graders from<br />
the same survey in 2003, a 0.1-percent decrease for<br />
10th graders, and a 0.3-percent decrease for 12th<br />
graders.<br />
Methylphenidate (Ritalin) has also received local and<br />
national media attention as being abused by college<br />
students either orally or crushed and used intranasally.<br />
Hotline calls and student personnel administrators<br />
at local universities confirm the suspected<br />
abuse of methylphenidate.<br />
Benzodiazepines<br />
Benzodiazepines in general and alprazolam (Xanax)<br />
in particular are a substantial problem. Benzodiazepines<br />
were second only to alcohol in their involvement<br />
in drug-related deaths throughout Florida for the past<br />
several years, and this continued in the first half of<br />
2004. There were 994 benzodiazepine-related deaths<br />
across Florida in the first 6 months of 2004, representing<br />
a 15-percent increase over the 866 such<br />
deaths in the previous 6 months. Of the related deaths<br />
in the first half of 2004, a benzodiazepine was identified<br />
as the cause of death in 233 cases (or 31 percent).<br />
In Miami-Dade County, there were 37 alprazolamrelated<br />
deaths during the first half of 2004, of which 9<br />
(33 percent) were alprazolam induced. Seventy-three<br />
percent of the deaths involved at least one other drug<br />
(exhibit 2). There were also 15 diazepam-related<br />
deaths in Miami-Dade County, of which 2 (13 percent)<br />
Proceedings of the Community Epidemiology Work Group, Vol. II, January 2005
<strong>EPIDEMIOLOGIC</strong> TRENDS IN <strong>DRUG</strong> <strong>ABUSE</strong>—Miami-Ft. Lauderdale, Florida<br />
were caused by the drug; 87 percent of these deaths<br />
involved at least one other drug.<br />
Broward County recorded 57 alprazolam-related<br />
deaths during the first half of 2004, of which 18 (32<br />
percent) were induced by the drug. Only three of the<br />
deaths involved alprazolam alone (exhibit 3). In the<br />
same period, Broward County recorded 60 diazepamrelated<br />
(Valium) deaths, of which 11 (18 percent)<br />
were diazepam induced. All of these cases involved<br />
at least one other drug.<br />
The unweighted DAWN data show that benzodiazepines<br />
accounted for 17 percent of Broward County ED<br />
reports in the first half of 2004 and for 8 percent of the<br />
Miami-Dade County ED reports. In Miami, alprazolam<br />
was involved in 238 (55 percent) of the 431<br />
benzodiazepine reports, clonazepam represented 10<br />
percent of the reports, lorazepam accounted for 6 percent,<br />
and diazepam was involved in 4 percent. Five<br />
other benzodiazepines were involved in the other re-<br />
ports in this category. Thirty-two percent of the patients<br />
were seeking detoxification; 30 percent of the<br />
cases were classified as overmedication; and 38 percent<br />
were related to intentional misuse or abuse of the<br />
medications.<br />
The NFLIS reported that the Miami-Dade Crime lab<br />
analyzed 259 alprazolam exhibits in the 12 months<br />
from October 2003 to September 2004 as well as 14<br />
diazepam exhibits and 6 clonazepam cases.<br />
Nationally, the 2004 Monitoring the Future Survey<br />
reported that current past-30-day use of “tranquilizers”<br />
(which has included “Xanax” as an example since<br />
2001) was reported by 1.2 percent of 8th graders, 2.3<br />
percent of 10th graders, and 3.1 percent of 12th graders.<br />
These percentages reflected a 0.2-percent decrease<br />
for 8th graders from the same survey in 2003, a 0.1percent<br />
decrease for 10th graders, and a 0.4-percent<br />
increase for 12th graders.<br />
For inquiries regarding this report, please contact James N. Hall, Center for the Study and Prevention of Substance Abuse, Up Front Drug<br />
Information Center, Nova Southeastern University, Suite 215, 12360 Southwest 132nd Court, Miami, FL 33186, Phone: (954) 262-3446 or<br />
(786) 242-8222, E-mail: upfrontin@aol.com.<br />
Proceedings of the Community Epidemiology Work Group, Vol. II, January 2005 131
132<br />
<strong>EPIDEMIOLOGIC</strong> TRENDS IN <strong>DRUG</strong> <strong>ABUSE</strong>—Miami-Ft. Lauderdale, Florida<br />
Exhibit 1. Numbers of Drug-Related Deaths in Florida, by Single Drug or In Combination:<br />
January–June 2004<br />
900<br />
800<br />
700<br />
600<br />
500<br />
400<br />
300<br />
200<br />
100<br />
0<br />
In Combination 611 423 306 294 341 248 229 146 90<br />
Only Drug 209 40 30 39 51 45 78 38 20<br />
SOURCE: FDLE, Florida Medical Examiners Commission<br />
Exhibit 2. Numbers of Drug-Related Deaths in Miami-Dade County, by Single Drug or In Combination:<br />
January–June 2004<br />
120<br />
100<br />
80<br />
60<br />
40<br />
20<br />
0<br />
Cocaine Alprazolam Diazepam Oxycodone Methadone<br />
Cocaine<br />
Alprazolam<br />
In Combination<br />
Only Drug<br />
Diazepam Oxycodone<br />
Methadone<br />
In Combination<br />
Only Drug<br />
Hydrocodone<br />
Hydrocodone<br />
Morphine<br />
Propoxyphene<br />
Morphine Propoxyphene<br />
In Combination 54 27 10 14 5 8 16 6 7<br />
Only Drug 42 10 5 2 1 2 6 1 5<br />
SOURCE: FDLE, Medical Examiners Commission<br />
Heroin<br />
Heroin<br />
Proceedings of the Community Epidemiology Work Group, Vol. II, January 2005
<strong>EPIDEMIOLOGIC</strong> TRENDS IN <strong>DRUG</strong> <strong>ABUSE</strong>—Miami-Ft. Lauderdale, Florida<br />
Exhibit 3. Numbers of Drug-Related Deaths in Broward County, by Single Drug or In Combination:<br />
January–June 2004<br />
70<br />
60<br />
50<br />
40<br />
30<br />
20<br />
10<br />
0<br />
Cocaine<br />
Alprazolam<br />
In Combination<br />
Only Drug<br />
Diazepam Oxycodone<br />
In Combination 54 54 58 37 35 16 17 10 15<br />
Only Drug 7 3 2 0 4 2 6 3 1<br />
SOURCE: FDLE, Florida Medical Examiners Commission<br />
Exhibit 4. ED Drug Abuse Reports in Miami-Dade County, by Percent (Unweighted 1 ): January–June 2004<br />
Ecstasy & Amphetamines<br />
2%<br />
Oxycodone/Hydrocodone<br />
2%<br />
Heroin<br />
13%<br />
Benzodiazepine<br />
8%<br />
Other<br />
4%<br />
Marijuana<br />
21%<br />
1<br />
The unweighted data are from 8–10 Miami-Dade County EDs reporting to DAWN. All DAWN cases are reviewed for quality control.<br />
Based on this review, cases may be corrected or deleted, and, therefore, are subject to change.<br />
SOURCE: DAWN Live!, OAS, SAMHSA, Updated 12/07/2004<br />
Proceedings of the Community Epidemiology Work Group, Vol. II, January 2005 133<br />
Methadone<br />
Hydrocodone<br />
Morphine Propoxyphene<br />
Cocaine<br />
50%<br />
Heroin
134<br />
<strong>EPIDEMIOLOGIC</strong> TRENDS IN <strong>DRUG</strong> <strong>ABUSE</strong>—Miami-Ft. Lauderdale, Florida<br />
Exhibit 5. ED Drug Abuse Reports in Broward County, by Percent (Unweighted 1 ): January–June 2004<br />
Ecstasy &<br />
Amphetamines<br />
2%<br />
Oxycodone/<br />
Hydrocodone<br />
5%<br />
Benzodiazepine<br />
17%<br />
Heroin<br />
5%<br />
1 The unweighted data are from 2 Broward County EDs reporting to DAWN. All DAWN cases are reviewed for quality control. Based<br />
on this review, cases may be corrected or deleted, and, therefore, are subject to change.<br />
SOURCE: DAWN Live!, OAS, SAMHSA, Updated 12/07/2004<br />
Exhibit 6. Drug Use 1 Among High School Students in Grades 9–12, by Site and Percent: 2003<br />
Marijuana (Current)<br />
Cocaine (Current)<br />
Heroin (Lifetime)<br />
Methamphetamine (Lifetime)<br />
Ecstasy (Lifetime)<br />
1 Current=past-30-day use; lifetime=ever used.<br />
SOURCE: YRBS, CDC<br />
4.1<br />
4.0<br />
3.2<br />
2.2<br />
4.6<br />
3.3<br />
3.3<br />
2.5<br />
2.3<br />
3.7<br />
3.8<br />
4.5<br />
Other<br />
8%<br />
Marijuana<br />
19%<br />
7.6<br />
6.4<br />
7.1<br />
8.2<br />
7.8<br />
9.7<br />
11.1<br />
12.1<br />
US<br />
15.8<br />
Florida<br />
Miami-Dade<br />
Brow ard<br />
Palm Beach<br />
Cocaine<br />
44%<br />
17.9<br />
22.4<br />
21.4<br />
22.6<br />
Proceedings of the Community Epidemiology Work Group, Vol. II, January 2005
<strong>EPIDEMIOLOGIC</strong> TRENDS IN <strong>DRUG</strong> <strong>ABUSE</strong>—Miami-Ft. Lauderdale, Florida<br />
Exhibit 7. Numbers of Items Analyzed by the Broward County Crime Lab Found to be Ecstasy: 2001–2004<br />
132<br />
121<br />
115<br />
0<br />
1H 2001 2H 2001 1H 2002 2H 2002 1H 2003 2H 2003 1H 2004<br />
SOURCE: Broward County Sheriff’s Office Crime Lab<br />
Exhibit 8. Numbers of Clandestine Methamphetamine Lab Seizures in Florida: FY 2000–FY 2004<br />
400<br />
350<br />
300<br />
250<br />
200<br />
150<br />
100<br />
50<br />
150<br />
140<br />
130<br />
120<br />
110<br />
100<br />
90<br />
80<br />
70<br />
60<br />
50<br />
40<br />
30<br />
20<br />
10<br />
30 28<br />
0<br />
2000 2001 2002 2003 2004<br />
SOURCE: South Florida Methamphetamine Task Force<br />
Proceedings of the Community Epidemiology Work Group, Vol. II, January 2005 135<br />
73<br />
129<br />
79<br />
229<br />
58 57<br />
332
<strong>EPIDEMIOLOGIC</strong> TRENDS IN <strong>DRUG</strong> <strong>ABUSE</strong>—Minneapolis/St. Paul<br />
Drug Abuse Trends in Minneapolis/St. Paul<br />
Carol Falkowski 1<br />
ABSTRACT<br />
Drug abuse-related mortality in the Twin Cities<br />
metropolitan area remained stable in 2004. Most<br />
accidental overdose deaths involved opiates or cocaine.<br />
In hospital emergency departments, (unweighted)<br />
reports involving cocaine outnumbered<br />
those involving any other illicit drug. Methamphetamine<br />
remained a major focus of law enforcement.<br />
For the first time, methamphetamine addicts<br />
accounted for almost 10 percent of patients entering<br />
metropolitan area addiction treatment programs.<br />
More patients sought treatment for marijuana than<br />
for any other illicit drug (21.3 percent of total admissions),<br />
and one-half were younger than 18. The<br />
abuse of alcohol, tobacco, and MDMA (ecstasy)<br />
among metropolitan area high school seniors declined<br />
from 2001 to 2004, according to the Minnesota<br />
Student Survey. Still, alcohol remained the<br />
number one drug of abuse among adolescents, with<br />
60 percent of high school seniors reporting drinking<br />
in the past year. At area hospital emergency departments,<br />
623 reports (unweighted) involved underage<br />
drinking in 2004, and one-half of all admissions<br />
to addiction treatment programs were for alcohol.<br />
INTRODUCTI<strong>ON</strong><br />
This report is produced twice annually for participation<br />
in the Community Epidemiology Work Group of<br />
the National Institute on Drug Abuse, an epidemiological<br />
surveillance network comprised of researchers<br />
from 21 U.S. areas who monitor trends in drug abuse,<br />
using the most recent data from multiple sources.<br />
Area Description<br />
The Minneapolis/St. Paul, “Twin Cities,” metropolitan<br />
area includes the city of Minneapolis (Hennepin<br />
County), the capital city of St. Paul (Ramsey<br />
County), and the surrounding counties of Anoka,<br />
Dakota, and Washington. According to the 2000 census,<br />
the population of the metropolitan area is<br />
2,482,353, roughly one-half of the Minnesota State<br />
population. More than one-half (56 percent) of the<br />
Ramsey County population live in the city of St.<br />
Paul, and one-third (34.2 percent) of the Hennepin<br />
County population live in the city of Minneapolis.<br />
136<br />
In the five-county metropolitan area, 84 percent of<br />
the population is White. African-Americans constitute<br />
the largest minority group in Hennepin County,<br />
while Asians are the largest minority group in Ramsey,<br />
Anoka, Dakota, and Washington Counties.<br />
The remainder of the State is less densely populated<br />
and predominantly rural in character. To the north,<br />
Minnesota shares an international border with Canada,<br />
and to the west it borders North Dakota and<br />
South Dakota, two of the country’s most sparsely<br />
populated States. Illicit drugs are sold and distributed<br />
within Minnesota by Mexican drug trafficking organizations,<br />
street gangs, independent entrepreneurs,<br />
and other criminal groups.<br />
Data Sources<br />
1 The author is affiliated with Hazelden Foundation, Butler Center for Research, Center City, Minnesota.<br />
Data for this report were drawn from the following<br />
sources:<br />
• Mortality data on drug-related deaths are<br />
from the Hennepin County Medical Examiner<br />
and the Ramsey County Medical Examiner<br />
(through September 2004). Hennepin County<br />
cases include those in which drug toxicity was<br />
the immediate cause of death and those in which<br />
the recent use of a drug was listed as a significant<br />
condition contributing to the death. Ramsey<br />
County cases include those in which drug toxicity<br />
was the immediate cause of death and those<br />
in which drugs were present at the time of death.<br />
• Hospital emergency department (ED) data were<br />
accessed from the Drug Abuse Warning Network<br />
(DAWN) Live!, a restricted-access online system<br />
administered by the Office of Applied Studies<br />
(OAS) of the Substance Abuse and Mental Health<br />
Services Administration (SAMHSA). The unweighted<br />
data are from participating hospital<br />
emergency departments in the Minneapolis and<br />
St. Paul Standard Metropolitan Statistical Area<br />
from January 1, 2004, through December 13,<br />
2004; the data were updated 12/13/2004. The<br />
DAWN sample includes 26 of the 28 eligible hospitals<br />
in the area, with 26 emergency departments.<br />
The data reported in this paper are incomplete.<br />
Over the approximately 12-month period, between<br />
7 and 13 EDs reported data, with almost<br />
Proceedings of the Community Epidemiology Work Group, Vol. II, January 2005
all reporting basically complete data (90 percent<br />
or greater). All DAWN cases are reviewed for<br />
quality control. Based on the review, cases may be<br />
corrected or deleted. Therefore, the data reported<br />
in this paper are subject to change. Data accessed<br />
from DAWN Live! represent drug reports in drugrelated<br />
visits. Reports exceed the number of visits<br />
because a patient may report use of multiple drugs<br />
(up to six drugs plus alcohol). The unweighted<br />
data are not estimates for the Minneapolis/St. Paul<br />
area. These data cannot be compared with data<br />
from 2002 and before, and they cannot be used for<br />
comparison with future DAWN data. Only<br />
weighted data released by SAMHSA can be used<br />
for trend analysis. A full description of the<br />
DAWN system can be found at the DAWN Web<br />
site .<br />
• Treatment data are from addiction treatment<br />
programs (residential, outpatient, extended care)<br />
in the five-county metropolitan area as reported on<br />
the Drug and Alcohol Abuse Normative Evaluation<br />
System (DAANES) of the Minnesota Department<br />
of Human Services through June 2004.<br />
• Drug price data are from the National Drug Intelligence<br />
Center, Narcotics Digest Weekly, Vol.<br />
3, No. 52, December 28, 2004.<br />
• Crime lab data for St. Paul are from the National<br />
Forensic Laboratory Information System<br />
(NFLIS). This system, which began in 1997, is<br />
sponsored by the U.S. Drug Enforcement Administration<br />
and collects solid dosage drug analyses<br />
conducted by State and local forensic laboratories<br />
across the country on drugs seized by law enforcement.<br />
Minnesota data on methamphetamine<br />
labs are from the El Paso Intelligence Center<br />
(EPIC), U.S. Drug Enforcement Administration.<br />
• Student survey data on selected drugs of abuse<br />
are from the 2001 and the 2004 Minnesota Student<br />
Survey. Responses concerning drug use in<br />
the past year are presented for high school seniors<br />
in the 5-county metropolitan area, representing<br />
14,140 respondents in 2001 and 16,156 in 2004.<br />
• Acquired immunodeficiency syndrome (AIDS)<br />
and hepatitis C (HCV) data for 2003 were provided<br />
by the Minnesota Department of Health.<br />
<strong>DRUG</strong> <strong>ABUSE</strong> PATTERNS AND TRENDS<br />
Cocaine/Crack<br />
Accidental overdose deaths involving cocaine appear<br />
stable, with 32 in Hennepin and 10 in Ramsey<br />
<strong>EPIDEMIOLOGIC</strong> TRENDS IN <strong>DRUG</strong> <strong>ABUSE</strong>—Minneapolis/St. Paul<br />
County through September 2004. These increased<br />
from 2002 to 2003 in Hennepin County (from 34 to<br />
44). In Ramsey County, there were 10 such deaths in<br />
2003 and 11 in 2002.<br />
The unweighted data accessed through DAWN Live!<br />
show that cocaine maintained a strong presence in<br />
hospital emergency department data, outnumbering<br />
reports involving any other illicit drug in 2004 (exhibit<br />
1).<br />
Admissions to addiction treatment programs with<br />
cocaine as the primary substance problem declined<br />
slightly. In 2004, 12.5 percent of treatment admissions<br />
reported cocaine as the primary substance problem,<br />
compared with 13.3 percent in 2003. Most cocaine<br />
admissions were for crack cocaine; nearly onethird<br />
were women; and 48.4 percent were African-<br />
American. Additional patient characteristics appear<br />
in exhibit 2.<br />
Cocaine generally sold for $70–$150 per gram, $200<br />
per “eight-ball” (one-eighth ounce), $700–$2,000 per<br />
ounce, and $18,000–$28,000 per kilogram (exhibit<br />
3). The price of a rock of crack was $15–$25. Upward<br />
variations in price were attributed to higher<br />
purity products. The street-level, retail distribution of<br />
crack cocaine remained gang-involved in 2004. Cocaine<br />
accounted for 22 percent of the drug seizures<br />
reported to NFLIS in St. Paul (exhibit 4).<br />
Cocaine use among metropolitan area students was<br />
relatively unchanged from 2001 to 2004 according to<br />
the Minnesota Student Survey data. Past-year cocaine<br />
use was reported by 6.1 percent of high school seniors<br />
in 2004, compared with 5.5 percent in 2001 (exhibit<br />
5).<br />
Heroin<br />
Opiate-related deaths, mostly accidental heroin overdoses,<br />
continued at heightened levels, and outnumbered<br />
cocaine-related deaths in both counties since<br />
2001. Hennepin County reported 50 opiate-related<br />
deaths in 2003 and 41 in 2004 through September. In<br />
Ramsey County, 19 such deaths were reported in<br />
2003 and 16 were reported through September 2004.<br />
Hospital ED reports of heroin nearly doubled from<br />
2000 to 2002. In the preliminary unweighted data<br />
accessed through DAWN Live! for 2004, there were<br />
647 heroin-related ED reports, ranking fourth among<br />
illicit drug cases (exhibit 1).<br />
Patients in treatment for heroin tended to be older<br />
than in the past. None was younger than 18 in 2004<br />
(exhibit 2). The most common route of administra-<br />
Proceedings of the Community Epidemiology Work Group, Vol. II, January 2005 137
tion was injection (62.9 percent), followed by sniffing<br />
(31.2 percent), and smoking, also known as “foiling”<br />
(5.9 percent) (exhibit 2). Whites accounted for<br />
59.5 percent in 2004, compared with 51.8 percent in<br />
2003. African-Americans accounted for 32.3 percent<br />
in 2004, compared with 42.9 percent in 2003, and<br />
Hispanics represented 5.6 percent in 2004, compared<br />
with 2.8 percent in 2003.<br />
Five methadone maintenance programs served<br />
roughly 1,500 clients in the metropolitan area. Patients<br />
who were newly enrolled in some of these programs<br />
may be reflected in the treatment data, however,<br />
the private for-profit programs do not report to<br />
DAANES.<br />
Retail heroin prices remained at low levels: $20–$40<br />
per dosage unit or “paper,” and $150–$200 per gram<br />
(exhibit 3). In April 2004, four Nigerians were apprehended<br />
at the Minneapolis/St. Paul International<br />
Airport on a flight from Amsterdam carrying suitcases<br />
filled with 25 pounds of heroin valued at $25<br />
million.<br />
Other Opiates/Narcotics<br />
Prescription narcotic analgesics, used medically in<br />
the treatment of pain, were increasingly used nonmedically<br />
as drugs of abuse for the strong, euphoric,<br />
heroin-like effects. Of particular concern were drugs<br />
containing oxycodone—Percodan, Percocet (oxycodone<br />
combined with aspirin or acetaminophen),<br />
and the long-acting OxyContin.<br />
According to DAWN Live! data, 1,122 reports involved<br />
opioid prescription misuse at emergency departments<br />
in 2004. Of these, 389 (34.6 percent) involved<br />
oxycodone, and 238 (21.2 percent) involved<br />
hydrocodone.<br />
Marijuana<br />
Marijuana indicators continued upward trends that<br />
began more than a decade ago. In the unweighted<br />
data accessed from DAWN Live!, there were 2,058<br />
marijuana-involved reports at emergency departments<br />
in 2004, ranking second only to cocaine (exhibit<br />
1).<br />
Marijuana-related treatment admissions outnumbered<br />
those for any other illicit drug (exhibit 2). One out of<br />
five (21.3 percent) people entering addiction treatment<br />
programs in 2004 reported marijuana as the<br />
primary substance problem, compared with only 8<br />
percent in 1991. More than one-half (51.8 percent)<br />
were age 17 or younger. The average age of first<br />
marijuana use was 13.9 years.<br />
138<br />
<strong>EPIDEMIOLOGIC</strong> TRENDS IN <strong>DRUG</strong> <strong>ABUSE</strong>—Minneapolis/St. Paul<br />
Marijuana, readily available according to multiple<br />
sources, sold for $5 per joint. Standard, commercial<br />
grade marijuana sold for $50 per quarter ounce.<br />
Prices varied considerably depending on alleged potency,<br />
from $80 to $600 per ounce and $600–$2,400<br />
per pound (exhibit 3). Marijuana joints that are<br />
dipped in formaldehyde, which is often mixed with<br />
phencyclidine (PCP), are known as “wets,” “wet<br />
sticks,” or “water.” Marijuana joints containing crack<br />
cocaine are known as “primos.”<br />
Marijuana use declined among metropolitan area<br />
students in 2004, according to the Minnesota Student<br />
Survey data. Past-year marijuana use was reported by<br />
30.2 percent of high school seniors in 2004, compared<br />
with 33.9 percent in 2001 (exhibit 5).<br />
Methamphetamine/Other Stimulants<br />
Methamphetamine is also known as “meth,” “crystal,”<br />
or “crank,” and amphetamine is known as “speed” or<br />
“crank.” These are long-acting stimulants of abuse.<br />
Prolonged abuse of these long-acting stimulants can<br />
result in addiction, which is often accompanied by<br />
long periods of sleep and food deprivation, agitated<br />
behavior, and pronounced paranoid delusions.<br />
From 2002 to 2003, accidental deaths related to<br />
methamphetamine abuse increased from 3 to 10 in<br />
Ramsey County, with 5 reported in 2004 (through September).<br />
Methamphetamine-related deaths increased<br />
from 11 in 2002 to 15 in 2003 in Hennepin County,<br />
with 13 reported in 2004 (through September).<br />
Hospital ED reports involving methamphetamine<br />
increased steadily over the past few years. In the preliminary<br />
unweighted data for 2004, there were 705<br />
reports involving methamphetamine (exhibit 1). An<br />
additional 143 reports involved amphetamines.<br />
In 2004 (through June), patients addicted to methamphetamine<br />
accounted for an unprecedented 9.5 percent<br />
of total treatment admissions, compared with 7.5<br />
percent in 2003 and only 2.9 percent in 1998. Women<br />
accounted for 37.5 percent, and most were White<br />
(92.1 percent) (exhibit 2). Smoking was the most<br />
common route of methamphetamine use (62.0 percent)<br />
followed by sniffing (21.3 percent).<br />
Methamphetamine abuse among metropolitan-area<br />
students was relatively stable from 2001 to 2004,<br />
according to the Minnesota Student Survey. Past-year<br />
methamphetamine use was reported by 5.0 percent of<br />
high school seniors in 2004, compared with 5.7 percent<br />
in 2001 (exhibit 5). Still, since the beginning of<br />
2004, most onsite, high school-based drug abuse<br />
Proceedings of the Community Epidemiology Work Group, Vol. II, January 2005
counselors reported growing problems related to<br />
methamphetamine abuse by students.<br />
Methamphetamine prices were as low as $70 per<br />
gram, $600 per ounce, and $6,000 per pound (exhibit<br />
3). “Glass,” or “ice,” the high-purity form that is<br />
smoked, typically costs twice as much.<br />
Methamphetamine remained a major focus of law<br />
enforcement at all levels. There were 193 clandestine,<br />
makeshift methamphetamine labs dismantled with the<br />
assistance of the Drug Enforcement Administration<br />
in Minnesota in fiscal year (FY) 2004, compared with<br />
319 in FY 2003. Seizures of methamphetamine by<br />
law enforcement continued upward trends and accounted<br />
for 61 percent of the total samples reported<br />
to NFLIS from October 2003 through September<br />
2004 (exhibit 4).<br />
Abuse of 3,4 methylenedioxymethamphetamine<br />
(MDMA), known as “ecstasy,” “X,” or “e,” contributed<br />
to the deaths of four young males in Hennepin<br />
County in 2004. In 2004, the preliminary unweighted<br />
DAWN data show that 87 ED reports were for<br />
MDMA (exhibit 1).<br />
MDMA use declined markedly among metropolitanarea<br />
students in 2004, according to the Minnesota<br />
Student Survey. Past-year MDMA use was reported<br />
by 4.5 percent of high school seniors in 2004, compared<br />
with 9.1 percent in 2001 (exhibit 5).<br />
Khat, a plant with stimulant effects that is chewed or<br />
brewed in tea in East Africa and Middle Eastern cultures,<br />
remained a drug of abuse within the Somali<br />
communities of the Twin Cities and Rochester, Minnesota.<br />
Its active ingredients, cathinone and catheine,<br />
are controlled substances in the United States.<br />
Methylphenidate (Ritalin), a prescription drug used in<br />
the treatment of attention deficit hyperactive disorder,<br />
is also used nonmedically as a drug of abuse to increase<br />
alertness and concentration and to suppress<br />
appetite. The pills, sometimes known as “hyper<br />
pills,” or “homework pills,” are crushed and snorted<br />
or ingested orally. They sold for $5 per pill or were<br />
simply shared with fellow students.<br />
Hallucinogens<br />
Salvia Divinorum, a sage plant that is also known as<br />
diviner’s sage, can be smoked, chewed, or brewed in<br />
tea. Some high school students consume it at school<br />
by placing the leaves in their lunchtime beverages. Its<br />
abuse was reported at the University of Minnesota<br />
and some metropolitan area high schools in 2004.<br />
<strong>EPIDEMIOLOGIC</strong> TRENDS IN <strong>DRUG</strong> <strong>ABUSE</strong>—Minneapolis/St. Paul<br />
Effects include intense but very short-lived hallucinations<br />
and out-of-body experiences.<br />
Over-the-counter cough and cold products that contain<br />
dextromethorphan, a cough suppressant, continued<br />
to be used as drugs of abuse by ingesting doses<br />
many times in excess of the recommended amount.<br />
Dextromethorphan (also known as “DXM”) is the<br />
active ingredient in Coricidin HBP Cough and Cold<br />
(known as “Triple Cs”) and Robitussin. Excessive<br />
dosages produce long-acting hallucinations, altered<br />
time perception, slurred speech, profuse sweating,<br />
uncoordinated movements, and high blood pressure.<br />
Being under the influence of these products is known<br />
as “Robo-tripping” or “Skittle-ing.”<br />
Lysergic acid diethylamide (LSD or “acid”) is a<br />
strong, synthetically produced hallucinogen, typically<br />
sold as saturated, tiny pieces of paper known as<br />
“blotter acid,” for $5–$10 per dosage unit. In the unweighted<br />
data accessed from DAWN Live!, there<br />
were 19 hospital ED reports involving LSD in 2004<br />
(exhibit 1). An additional 53 involved “miscellaneous<br />
hallucinogens.”<br />
Ketamine, also known as “Special K,” is a veterinary<br />
anesthetic that first appeared as a drug of abuse<br />
among young people in Minnesota in 1997; it rarely<br />
appears in ED data. There were three ED reports of<br />
ketamine in the 2004 unweighted data. It is snorted,<br />
injected, or put into capsules or pills.<br />
PCP, a dissociative anesthetic, is most often used in<br />
combination with marijuana, but it can also be injected<br />
or snorted. In the 2004 unweighted data, there<br />
were 17 ED reports involving PCP at area hospital<br />
emergency departments.<br />
Sedative/Hypnotics<br />
Gamma hydroxybutyrate (GHB), known as "G,”<br />
“Liquid E,” or “Liquid X,” is a concentrated liquid<br />
abused for its stupor-like, depressant effects and as a<br />
predatory knock-out, drug-facilitated rape drug. It<br />
sells for $10 by the capful. GHB hospital ED episodes<br />
declined significantly in recent years. There<br />
were 18 in 2004 (exhibit 1).<br />
According to hospital ED data, 463 reports in 2004<br />
involved benzodiazepines, and 83 involved muscle<br />
relaxants.<br />
Other Drugs<br />
Alcohol remained the most widely used moodaltering<br />
substance. For the first time, DAWN Live!<br />
Proceedings of the Community Epidemiology Work Group, Vol. II, January 2005 139
included reports of ED cases involving underage<br />
drinking—623 in 2004 (exhibit 1).<br />
One-half of all admissions to addiction treatment<br />
programs (49.3 percent) were attributable to alcohol<br />
(exhibit 2). The average age of first use was 16.<br />
While still the number one drug of abuse among high<br />
school students, alcohol use declined in 2004, according<br />
to the Minnesota Student Survey. Past-year alcohol<br />
use was reported by 60.4 percent of high school<br />
seniors in 2004, compared with 65.0 percent in 2001<br />
(exhibit 5).<br />
Similarly, tobacco use declined significantly in 2004.<br />
According to the Minnesota Student Survey, pastyear<br />
use of tobacco products was reported by 41.8<br />
percent of high school seniors in 2004, compared<br />
with 48.4 percent in 2001 (exhibit 5).<br />
Daily tobacco use remained widespread among patients<br />
in addiction treatment programs (exhibit 2).<br />
Prescription drug abuse, a category that includes the<br />
nonmedical abuse of a wide range of prescription<br />
140<br />
<strong>EPIDEMIOLOGIC</strong> TRENDS IN <strong>DRUG</strong> <strong>ABUSE</strong>—Minneapolis/St. Paul<br />
drugs, increased somewhat in 2004 among students in<br />
the Twin Cities area. According to the Minnesota Student<br />
Survey, past-year prescription drug abuse was<br />
reported by 11.0 percent of high school seniors in<br />
2004, compared with 9.4 percent in 2001 (exhibit 5).<br />
INFECTIOUS DISEASES RELATED TO SUBSTANCE <strong>ABUSE</strong><br />
Most AIDS cases in Minnesota were in the Minneapolis/St.<br />
Paul area in 2003. Of the 1,642 people living<br />
with AIDS, the exposure categories were as follows:<br />
men who have sex with men (54 percent); injection<br />
drug use (8 percent); men who have sex with men<br />
and injection drug use (5 percent); heterosexual contact<br />
(12 percent); perinatal/other (2 percent); unspecified<br />
(8 percent); and no interview (11 percent).<br />
The Minnesota Department of Health reported 2,400<br />
newly identified hepatitis C virus cases in 2003, most<br />
of whom were chronically infected. Of the 23 acute<br />
cases, 57 percent reported past injection drug abuse.<br />
The level of HCV, a blood-borne liver disease,<br />
among injection drug abusers remained high, with<br />
estimated rates as high as 90 percent among patients<br />
in methadone treatment programs.<br />
For inquiries concerning this report, please contact Carol Falkowski, Director of Research Communications, Hazelden Foundation, Butler<br />
Center for Research, 15245 Pleasant Valley Road, Box 11, Center City, MN 55012-0011, Phone: 651-213-4566, Fax: 651-213-4344, E-mail:<br />
cfalkowski@hazelden.org.<br />
Proceedings of the Community Epidemiology Work Group, Vol. II, January 2005
<strong>EPIDEMIOLOGIC</strong> TRENDS IN <strong>DRUG</strong> <strong>ABUSE</strong>—Minneapolis/St. Paul<br />
Exhibit 1. Reports of Major Substances of Abuse in Twin Cities Hospital Emergency Departments (Un-<br />
weighted 1 ): 2004<br />
Number of Reports<br />
3,000<br />
2,500<br />
2,000<br />
1,500<br />
1,000<br />
500<br />
0<br />
Cocaine<br />
2,441<br />
Marijuana<br />
2,058<br />
Methamphetamine<br />
705<br />
Heroin<br />
647 623<br />
Underage Drinking<br />
Amphetamines<br />
1 The unweighted data are from 7–12 EDs reporting to DAWN from 1/1/04 through 12/13/04.<br />
SOURCE: DAWN Live!, OAS, SAMHSA, updated 12/13/2004<br />
Proceedings of the Community Epidemiology Work Group, Vol. II, January 2005 141<br />
143<br />
MDMA<br />
87 76 19 18 17<br />
Inhalants<br />
LSD<br />
GHB<br />
PCP
142<br />
<strong>EPIDEMIOLOGIC</strong> TRENDS IN <strong>DRUG</strong> <strong>ABUSE</strong>—Minneapolis/St. Paul<br />
Exhibit 2. Characteristics of Persons Admitted to Twin Cities Area Addiction Treatment Programs by<br />
Primary Substance Problem and Percent: January–June 2004<br />
Characteristic<br />
(N=9,366)<br />
Gender<br />
Male<br />
Female<br />
Race/Ethnicity<br />
White<br />
African-American<br />
Hispanic<br />
American Indian<br />
Asian<br />
Age<br />
17 and younger<br />
18–25<br />
26–34<br />
35 and older<br />
Route of Administration<br />
Smoking<br />
Sniffing<br />
Injecting<br />
Other<br />
Alcohol<br />
(n=4,614)<br />
49.3%<br />
72.2<br />
27.8<br />
79.7<br />
10.5<br />
5.3<br />
3.1<br />
0.6<br />
3.4<br />
15.3<br />
20.2<br />
61.1<br />
Marijuana<br />
(n=1,999)<br />
21.3%<br />
76.7<br />
23.3<br />
66.5<br />
20.3<br />
5.6<br />
3.2<br />
1.4<br />
51.8<br />
27.2<br />
12.4<br />
8.6<br />
Cocaine<br />
(n=1,173)<br />
12.5%<br />
69.4<br />
30.6<br />
43.6<br />
48.4<br />
4.5<br />
2.2<br />
0.5<br />
2.8<br />
9.8<br />
25.6<br />
61.8<br />
81.9<br />
17.0<br />
1.1<br />
–<br />
Alcohol<br />
52.5<br />
Alcohol<br />
41.2<br />
Methamphetamine<br />
(n=887)<br />
9.5%<br />
62.5<br />
37.5<br />
92.1<br />
0.8<br />
2.8<br />
1.6<br />
1.6<br />
18.3<br />
35.7<br />
25.3<br />
20.8<br />
62.0<br />
21.3<br />
11.8<br />
Oral 4.9<br />
Marijuana<br />
53.9<br />
Alcohol<br />
48.8<br />
Heroin<br />
(n=268)<br />
2.9%<br />
72.0<br />
28.0<br />
59.5<br />
32.3<br />
5.6<br />
2.1<br />
0.0<br />
0.0<br />
22.5<br />
23.6<br />
53.9<br />
5.9<br />
31.2<br />
62.9<br />
–<br />
Cocaine<br />
Secondary Drug<br />
Marijuana<br />
58.5<br />
Alcohol<br />
71.2<br />
36.2<br />
Tertiary Drug<br />
Cocaine<br />
32.5<br />
Alcohol<br />
33.1<br />
Alcohol<br />
29.7<br />
No Prior Treatment 29.0 44.9 18.4 34.9 14.7<br />
Average Age First Use (in<br />
Years)<br />
(16.0) (13.9) (25.6) (20.2) (22.8)<br />
Daily Nicotine Use 59.4 56.3 67.9 76.2 68.3<br />
SOURCE: Drug and Alcohol Abuse Normative Evaluation System (DAANES), Minnesota Department of Human Services, 2004<br />
Exhibit 3. Illicit Drug Prices in Minneapolis: July–December 2004<br />
Drug Wholesale Price Midlevel Price Retail Price<br />
Cocaine powder $18,000–$28,000 per kilogram $700–$2,000 per ounce $70–$150 per gram<br />
Crack cocaine NA $600–$1,750 per ounce $15–$25 per rock<br />
Heroin NA $4,500–$5,000 per ounce $150–$200 per gram<br />
Marijuana $600–$2,400 per pound $80–$600 per ounce $5–$20 per gram<br />
Methamphetamine $6,000–$14,000 per pound $600–$2,000 per ounce $70–$150 per gram<br />
MDMA $8 per dosage unit NA $45 per dosage unit<br />
SOURCE: National Drug Intelligence Center, Narcotics Digest Weekly, Vol. 3, No. 52, December 28, 2004 (Product No. 2004-<br />
R0485-052)<br />
Proceedings of the Community Epidemiology Work Group, Vol. II, January 2005
<strong>EPIDEMIOLOGIC</strong> TRENDS IN <strong>DRUG</strong> <strong>ABUSE</strong>—Minneapolis/St. Paul<br />
Exhibit 4. Drug Seizures in St. Paul, Minnesota: October 2003 through September 2004<br />
Substance Count Percent<br />
Methamphetamine 1,922 61.43<br />
Cocaine 682 21.8<br />
Cannabis 193 6.17<br />
3,4-Methylenedioxymethamphetamine 45 1.44<br />
Psilocin 42 1.34<br />
Acetaminophen 41 1.31<br />
Heroin 30 0.96<br />
Hydrocodone 29 0.93<br />
Oxycodone 23 0.74<br />
Amphetamine 21 0.67<br />
Non-controlled Non-narcotic drug 19 0.61<br />
Diazepam 7 0.22<br />
Alprazolam 6 0.19<br />
Methylphenidate 6 0.19<br />
Lysergic Acid Diethylamide 4 0.13<br />
Ibuprofen 4 0.13<br />
Caffeine 4 0.13<br />
Propoxyphene 4 0.13<br />
Pseudoephedrine 4 0.13<br />
Clonazepam 3 0.10<br />
Guaifenesin 3 0.10<br />
Methadone 3 0.10<br />
Methocarbamol 3 0.10<br />
Morphine 2 0.06<br />
Nitroglycerine 2 0.06<br />
Total 3,102 99.14<br />
Total Items Reported 3,129<br />
SOURCE: NFLIS, DEA<br />
Proceedings of the Community Epidemiology Work Group, Vol. II, January 2005 143
144<br />
<strong>EPIDEMIOLOGIC</strong> TRENDS IN <strong>DRUG</strong> <strong>ABUSE</strong>—Minneapolis/St. Paul<br />
Exhibit 5. Past-Year Use of Selected Drugs by High School Seniors in the Twin Cities Metropolitan Area:<br />
2001 and 2004<br />
Percent of Seniors<br />
80<br />
70<br />
60<br />
50<br />
40<br />
30<br />
20<br />
10<br />
0<br />
65.0<br />
60.4<br />
Alcohol Alcohol<br />
48.4<br />
Tobacco Tobacco<br />
41.8<br />
33.9<br />
30.2<br />
Marijuana Marijuana<br />
9.4<br />
11.0<br />
9.1<br />
4.5<br />
Rx Rx Drugs Drugs<br />
2001<br />
2004<br />
5.5 6.1 5.7 5.0<br />
SOURCE: 2001 and 2004 Minnesota Student Survey for high school seniors in the 5-county metropolitan area including the counties<br />
of Hennepin, Ramsey, Anoka, Dakota, and Washington. There were 14,140 respondents in 2001 and 16,156 in 2004. Pastyear<br />
use refers to any use in the past year.<br />
MDMA MDMA<br />
Cocaine Cocaine<br />
Methamphetamine<br />
Methamphetamine<br />
Proceedings of the Community Epidemiology Work Group, Vol. II, January 2005
<strong>EPIDEMIOLOGIC</strong> TRENDS IN <strong>DRUG</strong> <strong>ABUSE</strong>—Newark PMSA<br />
Drug Abuse in the Newark Primary Metropolitan<br />
Statistical Area<br />
Allison S. Gertel-Rosenberg, M.S. 1<br />
ABSTRACT<br />
In this report, drug abuse indicators in the Newark<br />
primary metropolitan statistical area (Newark<br />
PMSA) are presented using substance abuse treatment<br />
data, emergency department data, medical<br />
examiner cases, and other information. Most primary<br />
admissions (72.6 percent) in the first half of<br />
2004 were for illicit drugs. Heroin accounted for<br />
73.9 percent of all primary admissions for illicit<br />
drugs in the Newark PMSA, compared with 10.9<br />
percent for primary crack/cocaine and 11.3 percent<br />
for primary marijuana use. Consistent with the<br />
treatment data, emergency department reports of<br />
heroin in the Newark PMSA accounted for the<br />
largest proportion of drug reports. Heroin purity<br />
remained high, at 61.3 percent in 2003. Between<br />
October 2003 and September 2004, cocaine accounted<br />
for 45.6 percent of items analyzed by<br />
NFLIS, followed by heroin (34.7 percent) and marijuana<br />
(10.2 percent).<br />
INTRODUCTI<strong>ON</strong><br />
Area Description<br />
The Newark primary metropolitan statistical area<br />
(PMSA) consists of five counties: Essex, Morris,<br />
Sussex, Union, and Warren. In 2003, there were an<br />
estimated 2,069,188 residents in the PMSA, with 38<br />
percent living in Essex County (which contains Newark<br />
City), 26 percent in Union County, 23 percent in<br />
Morris County, and the rest residing in the remaining<br />
counties. According to the 2000 Census, the population<br />
of the Newark PMSA is diverse in respect to<br />
race: 66 percent are White, 22 percent are Black, and<br />
4 percent are Asian. Hispanics account for 13 percent<br />
of the PMSA population. There is also a wide variation<br />
in racial/ethnic breakdowns for each county. In<br />
Essex County, 45 percent of the population are White<br />
and 41 percent are Black. Union County is 65 percent<br />
White and 21 percent Black. By comparison, Morris<br />
County is 87 percent White and 3 percent Black; Sussex<br />
County is 96 percent White and 1 percent Black;<br />
and Warren County is 95 percent White and 2 percent<br />
Black. Hispanics account for 15 percent of the population<br />
in Essex, 8 percent in Morris, 3 percent in Sussex,<br />
20 percent in Union, and 4 percent in Warren.<br />
The counties are also very diverse by socioeconomic<br />
status. In the Newark PMSA as a whole, 5.8 percent<br />
of families with children younger than 18 live below<br />
the poverty level. For counties within the PMSA, the<br />
poverty status for families with children younger than<br />
18 is 18 percent in Essex, 3 percent in Morris, 4 percent<br />
in Sussex, 9 percent in Union, and 5 percent in<br />
Warren. These social, demographic, and economic<br />
variations suggest substantial differences in drug use<br />
behaviors of residents by county.<br />
New Jersey is situated between major industrial markets<br />
in New York and Pennsylvania and has been<br />
referred to as the “crossroads of the east.” It is a<br />
gateway State, with major interstate highways, roadways,<br />
airports, seaports, and other infrastructures<br />
capable of accommodating large amounts of passenger<br />
and cargo traffic from both the eastern and western<br />
parts of the United States. New Jersey can therefore<br />
be considered an ideal strategic, as well as vulnerable,<br />
corridor for the transportation of drug contraband<br />
and illicit currency. 2<br />
New Jersey has one of the highest concentrations of<br />
pharmaceutical and biochemical manufacturing firms<br />
in the country. According to the Drug Enforcement<br />
Administration (DEA), the most prevalent sources of<br />
diverted pharmaceutical drugs in New Jersey include<br />
doctor shopping, prescription forgery, and organized<br />
prescription rings. The forging of prescriptions is a<br />
continuing problem among employees in the medical<br />
field, who use their positions to gain access to blank<br />
prescription pads. The most commonly diverted<br />
pharmaceuticals are the benzodiazepines and opiates,<br />
especially the hydrocodone products, with Percocet,<br />
Percodan, Xanax, Dilaudid, Valium, and Vicodin<br />
representing the most common brand name drugs<br />
diverted. The DEA is also reporting an increase in the<br />
diversion of OxyContin (oxycodone), both in Newark<br />
and South Jersey, where it has become a particular<br />
problem among teenagers and young adults.<br />
1 The author is affiliated with the New Jersey Division of Addiction Services, Department of Human Services, Trenton, New Jersey.<br />
2 DEA Briefs and Background State Fact Sheets. New Jersey 2004. .<br />
Proceedings of the Community Epidemiology Work Group, Vol. II, January 2005 145
From November 10 to 16, 2004, 18 members of an<br />
OxyContin distribution group were arrested as part of<br />
Operation Doctor Feelgood. DEA agents, in cooperation<br />
with State and local law enforcement agencies,<br />
arrested 14 suspects in New Jersey. During the course<br />
of the arrests, agents and law enforcement officers<br />
seized tens of thousands of prescription drug tablets<br />
(mostly OxyContin). A member of the group in New<br />
Jersey was the primary supplier of prescription drugs.<br />
She frequently obtained OxyContin and other prescription<br />
drugs by forging stolen prescription forms.<br />
Most of the drugs were obtained at two pharmacies.<br />
She also obtained prescription drugs from retail-level<br />
distributors. The suspect then sold the drugs to the<br />
distribution group leader. Some of the drugs were<br />
distributed locally, but most were transported by vehicle<br />
and train to Massachusetts. The distribution<br />
group leaders hired New Jersey-based couriers to<br />
transport the prescription drugs destined for Massachusetts<br />
to Connecticut and Rhode Island, where the<br />
drugs were handed off to retail-level distributors. The<br />
distributors sold the OxyContin tablets primarily to<br />
college students in the Brockton, Massachusetts, area<br />
for prices ranging from $80 to $100 per tablet. 3<br />
Data Sources<br />
This report uses data from various sources, as indicated<br />
below:<br />
• Drug treatment data were obtained from the<br />
New Jersey Substance Abuse Monitoring System<br />
(NJSAMS) and the Alcohol and Drug Abuse<br />
Data System (ADADS), statewide, episodebased<br />
data systems operated by the Division of<br />
Addiction Services of the Department of Human<br />
Services. The preliminary data for the first half<br />
of 2004 include profiles by primary drug of<br />
abuse in Newark City, the Newark PMSA, and<br />
statewide programs. Additional data used to analyze<br />
characteristics of clients seeking treatment<br />
for stimulant use were collected for calendar year<br />
2003 (January through December) to allow for a<br />
larger sample. The 2003 Treatment Episode Data<br />
Set (TEDS), Office of Applied Studies (OAS),<br />
was used to depict demographic characteristics<br />
of statewide admissions.<br />
• Emergency department (ED) drug reports<br />
data were obtained from the Drug Abuse Warning<br />
Network (DAWN) and DAWN Live!, a restricted-access<br />
online query system administered<br />
by the Office of Applied Studies (OAS), Substance<br />
Abuse and Mental Health Services Administration<br />
(SAMHSA), for January through<br />
3 Narcotics Digest Weekly, Dec 7, 2004.<br />
146<br />
<strong>EPIDEMIOLOGIC</strong> TRENDS IN <strong>DRUG</strong> <strong>ABUSE</strong>—Newark PMSA<br />
June 2004 (updated 1/13/2005). The DAWN systems<br />
collected data on ED cases in the Newark<br />
PMSA (i.e., in Essex, Morris, Sussex, Union,<br />
and Warren Counties). Thirty-nine of the 47 eligible<br />
hospitals in the area are in the DAWN<br />
sample. The number of EDs in the DAWN sample<br />
totals 43. (Some hospitals have more than<br />
one ED). The unweighted data presented in this<br />
paper are incomplete. Over the 12-month period,<br />
between 10 and 12 EDs reported each month;<br />
however, most reported data that were 90–100<br />
percent complete. All DAWN cases are reviewed<br />
for quality control. Based on the review, cases<br />
may be corrected or deleted. Therefore, the data<br />
reported in this paper are subject to change. The<br />
data presented represent drug reports in drugrelated<br />
ED visits. The number of reports exceed<br />
the number of visits, since a patient may report<br />
use of multiple drugs (up to six drugs plus alcohol).<br />
Drug reports via DAWN Live! do not indicate<br />
single drug or multidrug visits; therefore, in<br />
analyzing specific drug reports, one cannot conclude<br />
if the drug was used alone or in concert<br />
with other substances. Because the data are unweighted,<br />
they cannot be used as estimates for<br />
the Newark area. These data cannot be compared<br />
with DAWN data from 2002 and before, nor can<br />
they be used for comparison with future data.<br />
Only weighted data released by SAMHSA can<br />
be used for trend analysis. A full description of<br />
the DAWN system may be found at<br />
.<br />
• Forensic analysis data on specific drugs were<br />
provided by the Drug Enforcement Administration’s<br />
National Forensic Laboratory Information<br />
System (NFLIS) for October 2003 through September<br />
2004.<br />
• Mortality data were obtained from the<br />
SAMHSA January 2004 report entitled “Mortality<br />
Data From the Drug Abuse Warning Network<br />
2002.” The DAWN system compiled data for<br />
counties in the Newark PMSA. The DAWN system<br />
covered 88 percent of the metropolitan statistical<br />
area (MSA) population in 2002.<br />
• Illicit drug price data were obtained from the<br />
Current Intelligence Unit at the National Drug<br />
Intelligence Center. The data for July through<br />
December 2004 were reported in the December<br />
28, 2004, edition of Narcotics Digest Weekly.<br />
• Human immunodeficiency virus (HIV) and<br />
acquired immunodeficiency syndrome (AIDS)<br />
data were obtained from the statewide AIDS<br />
Registry maintained by the New Jersey Depart-<br />
Proceedings of the Community Epidemiology Work Group, Vol. II, January 2005
ment of Health and Senior Services, Division of<br />
AIDS Prevention and Control, HIV/AIDS Surveillance<br />
Program. Data on the State, Newark<br />
PMSA, and Newark City compiled as of June 30,<br />
2004, are used in this report.<br />
<strong>DRUG</strong> <strong>ABUSE</strong> PATTERNS AND TRENDS<br />
Cocaine/Crack<br />
In preliminary data for January through June 2004,<br />
primary cocaine/crack treatment admissions accounted<br />
for 6.8 percent of all admissions in Newark<br />
City (compared to 6.1 percent in 2003) and for 7.4<br />
percent of admissions for illicit drugs (i.e., excluding<br />
alcohol, compared to 6.6 percent in 2003) (exhibits 1<br />
and 2). Approximately 74 percent of the cocaine admissions<br />
in the first half of 2004 were for abuse of<br />
crack cocaine.<br />
In the Newark PMSA, the proportion of primary<br />
crack/cocaine admissions (excluding alcohol) was<br />
somewhat higher than in the city—10.9 percent in the<br />
first half of 2004, up slightly from 9.8 percent in<br />
2003. The proportion of crack/cocaine admissions<br />
among all admissions was higher in the PMSA as<br />
well: 7.8 percent in 2003 and 8.8 percent in 2004. In<br />
the first half of 2004, crack accounted for 63.7 percent<br />
of cocaine admissions in the PMSA, up slightly<br />
from 62.3 percent in 2003.<br />
The proportion of primary cocaine/crack admissions<br />
(excluding alcohol) statewide decreased slightly from<br />
15.6 percent in 2003 to 14.7 percent in the first half<br />
of 2004. In 2004, the proportion of statewide primary<br />
crack/cocaine admissions was much higher than the<br />
proportion for such admissions reported in Newark<br />
City and almost 4 percentage points higher than in<br />
the PMSA (exhibit 1). Admissions for crack abuse<br />
accounted for more than 62 percent of the primary<br />
cocaine admissions statewide. TEDS data for the<br />
State for 2003 show crack admissions were somewhat<br />
more likely to be Black than White (50 vs. 47<br />
percent) and male rather than female (60 vs. 40 percent)<br />
(exhibit 3). Admissions for primary abuse of<br />
powder cocaine, however, were substantially more<br />
likely to be White than Black (71 vs. 25 percent) and<br />
male rather than female (72 versus 28 percent).<br />
In January through June 2004, cocaine ranked second<br />
to heroin in the number of ED reports in the Newark<br />
PMSA (exhibit 4). The preliminary unweighted data<br />
for 2004 accessed from the DAWN Live! system on<br />
January 13, 2005, indicate 662 cocaine ED reports<br />
for all causes. Approximately 71 percent of the cocaine<br />
ED reports were for patients who were Black<br />
(exhibit 5), and 84 percent represented clients age 30<br />
<strong>EPIDEMIOLOGIC</strong> TRENDS IN <strong>DRUG</strong> <strong>ABUSE</strong>—Newark PMSA<br />
and older. Psychiatric conditions were the most frequently<br />
cited reason for visiting the ED (45 percent),<br />
followed by other reasons (22 percent) and altered<br />
mental status (16 percent).<br />
The most recently available mortality data indicated<br />
127 cocaine/crack-related deaths in 2002.<br />
Between October 2003 and September 2004, cocaine/crack<br />
accounted for 45.6 percent of the 2,760<br />
items analyzed by NFLIS, the highest proportion for<br />
any drug (exhibit 6).<br />
Between July and December 2004, the retail price for<br />
powder cocaine in Newark was $9–$100 per gram;<br />
crack sold for $20–$100 per gram (exhibit 7).<br />
Heroin<br />
As a proportion of illicit drug treatment admissions,<br />
primary heroin accounted for 82.6 percent in Newark<br />
City in the first half of 2004, which was lower than<br />
the 85.4 percent in 2003 (exhibits 1 and 2). In the<br />
Newark PMSA, primary heroin admissions accounted<br />
for 73.9 percent of illicit drug admissions in<br />
the first half of 2004, slightly lower than the 77.1<br />
percent in 2003, and for 59.2 percent of all treatment<br />
admissions (including alcohol).<br />
Primary heroin admissions predominated across the<br />
State in the first half of 2004, accounting for 60.8<br />
percent of all admissions for drugs other than alcohol<br />
(exhibit 1). This is down from 64.2 percent in 2003<br />
(exhibit 2) and represents the second decrease in the<br />
proportion of primary heroin admissions statewide<br />
since 1996. TEDS data for 2003 indicate that, statewide,<br />
54.6 percent of primary heroin admissions were<br />
White and 39.2 percent were Black (exhibit 3). About<br />
17.3 percent were Hispanic. Primary heroin users<br />
were also predominately male (65.7 percent).<br />
The unweighted data accessed from DAWN Live!<br />
show that the number of ED reports for heroin in<br />
2004 continued to be higher than the number of reports<br />
for other single drugs, at 803 reports between<br />
January and June 2004. Of the 803 heroin ED reports,<br />
51 percent were for male patients, 65 percent were<br />
for patients who were Black (exhibit 5), and 83 percent<br />
were for patients age 30 and older. A psychiatric<br />
condition was the most frequently cited reason for<br />
contacting the ED (36 percent), followed by other<br />
reasons (23 percent) and seeking detoxification (22<br />
percent).<br />
Although heroin is the leading drug among treatment<br />
admissions and ED reports in Newark, it accounted<br />
for only 34.7 percent of the 2,760 items analyzed by<br />
Proceedings of the Community Epidemiology Work Group, Vol. II, January 2005 147
NFLIS between October 2003 and September 2004<br />
(exhibit 6).<br />
The most recently available mortality data indicate 149<br />
heroin death mentions in 2002. The number of death<br />
mentions was down from 177 reported in 2001, however,<br />
and 179 reported in 2000. The slight downward<br />
trend in death mentions in 2002 is consistent with recent<br />
patterns in both treatment and ED data.<br />
Heroin purity is still very high, but it decreased<br />
somewhat in 2003 in the Newark PMSA. In 2001,<br />
heroin was 70.5 percent pure, and in 2002, it was<br />
71.4 percent pure. In 2003, however, heroin purity<br />
dropped to 61.3 percent pure. The price per gram<br />
between July and December 2004 was $25–$320<br />
(exhibit 7). In 2003, despite the drop in heroin purity,<br />
the Newark PMSA had the highest heroin purity coupled<br />
with the lowest price among the 21 DAWN cities.<br />
According to the DEA, almost all the heroin sold<br />
in the Newark PMSA is South American.<br />
Opiates Other Than Heroin<br />
In the first half of 2004, primary treatment admissions<br />
for “other opiates or synthetics” in Newark City<br />
totaled six (0.3 percent of the admissions, excluding<br />
alcohol admissions). The number was higher in the<br />
PMSA—86 (1.4 percent of the admissions, excluding<br />
alcohol). In 2003, figures for the city and PMSA,<br />
respectively, were 0.2 and 1.3 percent. In the State as<br />
a whole, primary admissions for other opiates in the<br />
first half of 2004 totaled 679, or 3.4 percent of all<br />
admissions, excluding alcohol. In 2003, the number<br />
of primary admissions for other opiates totaled 1,049,<br />
representing more than double the admissions reported<br />
in 1997 (513). The biggest increase in the<br />
number of other opiate admissions occurred between<br />
2000 (592) and 2002 (1,124). In 2003, the last year of<br />
full data for New Jersey, admissions reporting other<br />
opiates as a primary, secondary, or tertiary drug of<br />
abuse numbered 2,303 and accounted for nearly 6<br />
percent of all drug admissions statewide. In the<br />
TEDS data for 2003, 92 percent of the primary “other<br />
opiate” admissions were White and 6 percent were<br />
Black (exhibit 3). Only 5.5 percent of the primary<br />
“other opiate” admissions were Hispanic. About 63<br />
percent were male.<br />
ED data show 153 reports of narcotic analgesics/combinations<br />
between January and June 2004.<br />
Reports of methadone account for a substantial proportion<br />
of the total reports: 36.7 percent (n=56).<br />
In 2002, there were 151 ME death mentions for narcotic<br />
analgesic/combinations, representing the largest<br />
number of death mentions for any drug. Although the<br />
148<br />
<strong>EPIDEMIOLOGIC</strong> TRENDS IN <strong>DRUG</strong> <strong>ABUSE</strong>—Newark PMSA<br />
number of mentions was down from 190 in 2001, the<br />
number of mentions was more than twice that reported<br />
in 2000 (75) and more than 3 times the number<br />
in 1999 (44).<br />
Marijuana<br />
Primary marijuana treatment admissions represented<br />
7.2 percent of all treatment admissions in Newark<br />
City in the first half of 2004, compared with 9.1 percent<br />
in the Newark PMSA and 12.1 percent in the<br />
State as a whole. As a proportion of illicit drug treatment<br />
admissions, marijuana accounted for 7.9 percent<br />
in Newark City and 11.3 percent in the Newark<br />
PMSA (exhibit 1) in the first half of 2004, both approximately<br />
1 percentage point higher than in 2003<br />
(exhibit 2).<br />
Statewide primary marijuana admissions (excluding<br />
alcohol) were more than twice the proportion of those<br />
in Newark City (16.6 vs. 7.9 percent) and more than<br />
5 percentage points higher than those in the Newark<br />
PMSA (16.6 percent and 11.3 percent, respectively)<br />
(exhibit 1). Statewide TEDS data for 2003 indicate<br />
that 82 percent of primary marijuana admissions were<br />
male, 55 percent were White, and 40 percent were<br />
Black (exhibit 3). About 18 percent of primary marijuana<br />
admissions statewide were Hispanic. Across<br />
the State, approximately 50 percent of primary marijuana<br />
admissions were younger than 21, and about 73<br />
percent were younger than 26.<br />
The number of marijuana ED reports between January<br />
and June 2004 for all causes was 257. Approximately<br />
58 percent of the marijuana reports were<br />
made by individuals younger than 30. The three most<br />
frequent chief complaints when presenting with a<br />
marijuana report were other reasons (38 percent),<br />
psychiatric condition (33 percent), and altered mental<br />
status (21 percent).<br />
Among the 2,760 items analyzed by NFLIS between<br />
October 2003 and September 2004, marijuana accounted<br />
for 10.2 percent (281 items) (exhibit 6).<br />
Between July and December 2004, locally produced<br />
marijuana sold in Newark for $5–$30 per bag (exhibit<br />
7).<br />
Benzodiazepines and Barbiturates<br />
In an analysis run January 13, 2005, the DAWN Live!<br />
system recorded 208 benzodiazepine ED reports for<br />
all causes between January and June 2004 (exhibit 4).<br />
There were also 20 barbiturates ED reports for all<br />
causes.<br />
Proceedings of the Community Epidemiology Work Group, Vol. II, January 2005
The 2002 DAWN mortality data show only 54 benzodiazepine<br />
mentions in the Newark PMSA. However,<br />
this represents an increase from 33 mentions in<br />
2001 and 35 mentions in 2000. Benzodiazepines accounted<br />
for approximately 7.8 percent of all ME<br />
death mentions in 2002, up from 4.2 percent in 2001.<br />
Methamphetamine and Amphetamines<br />
In the first half of 2004, only 17 primary amphetamine<br />
treatment admissions, including 4 primary<br />
methamphetamine admissions, were reported in the<br />
Newark PMSA. As a primary drug of abuse, amphetamines<br />
were also rare in the State. There were 87<br />
primary amphetamine admissions in the first half of<br />
2004, including 41 admissions for methamphetamine.<br />
If the measured rate of admissions between January<br />
and June 2004 continued through the rest of the calendar<br />
year, the number of total admissions for primary<br />
amphetamine abuse will increase from the 112<br />
admissions reported in 2003.<br />
To analyze the characteristics of cases presenting for<br />
treatment in New Jersey for a drug in the stimulant<br />
category (including methylenedioxymethamphetamine<br />
[MDMA], methamphetamines, other amphetamines,<br />
and other stimulants), data from calendar year<br />
2003 were used. There were 554 statewide admissions<br />
for stimulants as primary, secondary, or tertiary<br />
drug of abuse in 2003 (exhibit 8). These cases presented<br />
with another primary drug 100 percent of the<br />
time—28 percent of the cases were for the treatment<br />
of a primary “other drug,” followed by 25 percent for<br />
marijuana, 18.6 percent for alcohol, 17.9 percent for<br />
heroin, and 10.4 percent for cocaine. The clients were<br />
more than twice as likely to be male than female<br />
(68.5 vs. 31.5 percent, respectively). Stimulant users<br />
seeking treatment were most likely White (68.2 percent),<br />
although 14.7 percent in 2003 were Black and<br />
10.8 percent reported Hispanic ethnicity. The clients<br />
were young: 14.4 percent were younger than 18 and<br />
32.7 percent were between the ages of 18 and 24.<br />
Approximately 62 percent had prior treatment experiences.<br />
In the Newark PMSA, there were 133 cases of treatment<br />
for stimulants in 2003 (exhibit 8). Marijuana<br />
was the most likely primary drug at admission (37.9<br />
percent), followed by other drugs (22.9 percent), alcohol<br />
(17.9 percent), heroin (14.3 percent), and cocaine<br />
(7.1 percent). The clients are similar to the<br />
State in gender breakdown—67.9 percent male vs.<br />
32.1 percent female. The racial and ethnic breakdown<br />
was less dramatic in the PMSA. White clients accounted<br />
for 46.4 percent of the population, while<br />
Blacks constituted 29.3 percent. The clients were also<br />
<strong>EPIDEMIOLOGIC</strong> TRENDS IN <strong>DRUG</strong> <strong>ABUSE</strong>—Newark PMSA<br />
young, with 10.7 percent younger than 18 and 40<br />
percent between the ages of 18 and 24.<br />
Preliminary unweighted data accessed through<br />
DAWN Live! for January through June 2004 show<br />
only two methamphetamine ED reports for all causes.<br />
ED reports for amphetamines, however, were higher,<br />
with 20 reports (exhibit 4). Approximately 50 percent<br />
of stimulant reports were made by those younger than<br />
25. The three chief complaints when presenting included<br />
altered mental status (50 percent), other reasons<br />
(36 percent), and overdose (36 percent).<br />
Wholesale and midlevel methamphetamine prices<br />
have fluctuated in New Jersey. These price variations<br />
resulted primarily from increased costs associated<br />
with obtaining methamphetamine (particularly crystal<br />
methamphetamine) from other regions of the country<br />
and other countries and transporting the drug to New<br />
Jersey. Methamphetamine previously sold for $8,500<br />
to $20,000 per kilogram and $800 to $1,000 per<br />
ounce, but between July and December 2004,<br />
methamphetamine sold for $15,000–$25,000 per<br />
kilogram and $800–$1,500 per ounce (exhibit 7). On<br />
the retail level, methamphetamine sold for between<br />
$20 and $180 per gram.<br />
Methylenedioxymethamphetamine (MDMA or<br />
Ecstasy)<br />
The number of MDMA ED reports between January<br />
and June 2004 in the DAWN Live! system was seven<br />
(exhibit 4). Approximately 86 percent of those mentioning<br />
MDMA were male. More than 70 percent of<br />
the MDMA reports were made by individuals younger<br />
than 30, including 57 percent younger than 25. Altered<br />
mental status (57 percent) was the chief single complaint<br />
registered when mentioning MDMA in the ED.<br />
Between July and December 2004, MDMA sold for<br />
$20–$30 per tablet (exhibit 7).<br />
Phencyclidine (PCP)<br />
The unweighted number of PCP ED reports between<br />
January and June 2004 accessed from DAWN Live!<br />
was nine (exhibit 4). Approximately 78 percent of<br />
those reporting PCP were male. Almost 44 percent of<br />
the PCP reports were made by individuals younger<br />
than 30. Altered mental status (33 percent) and psychiatric<br />
condition (33 percent) were the top complaints<br />
given when mentioning PCP in the ED.<br />
Alcohol<br />
In the Newark PMSA, alcohol-only treatment admissions<br />
as a proportion of all admissions decreased<br />
Proceedings of the Community Epidemiology Work Group, Vol. II, January 2005 149
from 12.2 percent in the first half of 2003 to 10.4<br />
percent in the first half of 2004, while alcohol-incombination<br />
admissions increased slightly from 8.6<br />
percent to 10.4 percent during the same time period.<br />
Unweighted data from DAWN Live! show that alcohol-in-combination<br />
with other drugs or alcohol alone<br />
for those younger than 21 accounted for 574 ED reports<br />
in the Newark PMSA between January and<br />
June 2004, as indicated by data received January 13,<br />
2005.<br />
INFECTIOUS DISEASES RELATED TO <strong>DRUG</strong> <strong>ABUSE</strong><br />
In 2003, New Jersey ranked fifth nationally in cumulative<br />
AIDS cases, third in cumulative pediatric AIDS<br />
cases, and ninth in cases reported in 2003. As of June<br />
30, 2004, there were 64,219 cumulative HIV/AIDS<br />
cases reported in New Jersey, about 464 of which were<br />
reported in the first half of 2004. Of the cumulative<br />
cases, 25,452 (39.6 percent of the State total) were in<br />
the Newark PMSA, and 12,329 (19.2 percent of the<br />
State total) were in Newark City. A total of 62,993<br />
cumulative HIV/AIDS cases statewide, and 12,045 in<br />
Newark City, were adults/adolescents age 13 or older.<br />
Statewide, the proportion of HIV/AIDS cases involving<br />
injection drug use has declined substantially.<br />
Thus, approximately 42 percent of cumulative HIV/<br />
AIDS cases statewide involved injection drug use<br />
alone, compared to 17 percent of cases diagnosed<br />
between July 2003 and June 2004. In Newark City,<br />
49 percent of cumulative cases involved injection<br />
drug use alone (only cumulative transmission mode<br />
data are available for Newark).<br />
The proportion of cases linked to heterosexual transmission<br />
in New Jersey has increased dramatically.<br />
Approximately 28 percent of cumulative cases and 48<br />
percent of cases reported between July 2003 and June<br />
2004 can be attributable to heterosexual transmission.<br />
The majority of this difference is found in the “partners<br />
of unknown HIV risk” category. There has been<br />
a slight increase in the number of transmission cases<br />
related to men who have sex with men (MSM). The<br />
cumulative proportion for this risk category is 19<br />
percent, while the proportion for cases reported be-<br />
150<br />
<strong>EPIDEMIOLOGIC</strong> TRENDS IN <strong>DRUG</strong> <strong>ABUSE</strong>—Newark PMSA<br />
tween July 2003 and June 2004 is 20 percent. Additionally,<br />
15 percent of cases reported between July<br />
2003 and June 2004 are still recording in the “other<br />
or unknown” transmission mode category.<br />
In Newark City, 9 percent of cumulative HIV/AIDS<br />
cases involved MSM transmission, 20 percent involved<br />
heterosexual contact, and 18 percent involved<br />
“other or unknown” transmission. A larger proportion<br />
of females (34 percent of cumulative cases in Newark<br />
and 36 percent in the State) were infected through<br />
heterosexual contact than males (11 percent and 8<br />
percent in Newark and the State, respectively).<br />
There has been a steady increase in the number of<br />
persons living with HIV/AIDS in Newark and in the<br />
State as a whole. The total number statewide has increased<br />
from 25,343 in 1997 32,401 as of June 30,<br />
2004.<br />
Among people living with HIV/AIDS as of June 30,<br />
2004, about 35 percent statewide and 41 percent in<br />
Newark City are female. Compared to the State as a<br />
whole, a substantially higher proportion of people<br />
living with HIV/AIDS in Newark are non-Hispanic<br />
Black (79 vs. 55 percent) (exhibits 9 and 10). About<br />
17 percent among those living with HIV/AIDS in<br />
Newark and 21 percent statewide are Hispanic, and<br />
about 3 percent in Newark and 22 percent statewide<br />
are non-Hispanic White.<br />
With respect to transmission mode among people<br />
living with HIV/AIDS, injection drug use alone accounted<br />
for 32 percent of cases statewide and 39 percent<br />
in Newark (exhibits 9 and 11). Heterosexual<br />
contact accounted for 21 percent of cases statewide<br />
and 25 percent in Newark. MSM contact alone accounted<br />
for 19 percent statewide 10 percent in Newark,<br />
while MSM and injection drug user (IDU) combined<br />
were involved in 3 percent of cases statewide<br />
and 3 percent of cases in Newark. The continued increase<br />
in heroin injection by the young (aged 18–25)<br />
and the very high levels of heroin abuse and heroinrelated<br />
deaths continue to pose a serious risk for an<br />
increase in the prevalence of infectious diseases.<br />
However, no data are yet available to document any<br />
rise in the prevalence of HIV/AIDS in New Jersey.<br />
For inquiries concerning this report, please contact Allison S. Gertel-Rosenberg, M.S., Program Manager, Division of Addiction Services, Office<br />
of Policy Development, New Jersey Department of Human Services, 120 South Stockton Street, 3rd Floor, P.O. Box 362, Trenton, NJ 08625,<br />
Phone: 609-984-4050, Fax: 609-292-1045, E-mail: allison.gertel@dhs.state.nj.us.<br />
Proceedings of the Community Epidemiology Work Group, Vol. II, January 2005
<strong>EPIDEMIOLOGIC</strong> TRENDS IN <strong>DRUG</strong> <strong>ABUSE</strong>—Newark PMSA<br />
Exhibit 1. Percentages of Primary Treatment Admissions (Excluding Alcohol) for Selected Drugs in Newark<br />
City, Newark PMSA, and New Jersey: January–June 2004<br />
Marijuana<br />
Cocaine/Crack<br />
Heroin<br />
SOURCE: ADADS, NJSAMS, Division of Addiction Services, NJ Department of Human Services<br />
Exhibit 2. Percentages of Primary Treatment Admissions (Excluding Alcohol) for Selected Drugs in Newark<br />
City, Newark PMSA, and New Jersey: January–December 2003<br />
SOURCE: ADADS, NJSAMS, Division of Addiction Services, NJ Department of Human Services<br />
Exhibit 3. Characteristics of Primary Substance Abuse Treatment Admissions in the State, by Percent:<br />
January–December 2003 1<br />
Characteristic<br />
Marijuana<br />
Cocaine/Crack<br />
Heroin<br />
16.6<br />
11.3<br />
7.9<br />
14.7<br />
10.9<br />
7.4<br />
15.2<br />
10.0<br />
7.0<br />
9.8<br />
6.6<br />
Alcohol<br />
Only<br />
15.6<br />
State<br />
Newark PMSA<br />
Newark City<br />
State<br />
Alcohol-in-<br />
Combination<br />
Newark PMSA<br />
Newark City<br />
Crack Cocaine Marijuana Heroin<br />
Other<br />
Opiates<br />
Gender<br />
Male 72.9 74.7 59.5 72.0 82.5 65.7 62.9<br />
Female 26.9 25.2 40.4 27.8 17.5 34.2 36.9<br />
Race/Ethnicity<br />
White 83.3 70.6 47.4 70.8 55.1 54.6 92.1<br />
Black 12.9 26.6 49.8 25.4 40.1 39.2 6.1<br />
Hispanic 12.1 11.0 8.8 18.9 17.8 17.3 5.5<br />
Age at Admission<br />
17 and younger 1.3 6.1 0.9 3.0 32.7 0.4 1.8<br />
18–25 9.8 21.6 12.6 19.2 40.3 17.4 18.4<br />
26–35 18.0 25.4 33.4 33.6 18.9 31.7 31.0<br />
36 and older 70.9 46.8 53.2 44.1 8.0 50.3 48.8<br />
1 Percentages may not add to 100 due to rounding or missing values.<br />
SOURCE: TEDS, OAS, SAMHSA<br />
Proceedings of the Community Epidemiology Work Group, Vol. II, January 2005 151<br />
60.8<br />
64.2<br />
73.9<br />
82.6<br />
77.1<br />
85.4
152<br />
<strong>EPIDEMIOLOGIC</strong> TRENDS IN <strong>DRUG</strong> <strong>ABUSE</strong>—Newark PMSA<br />
Exhibit 4. Number of ED Reports for Selected Drugs in the Newark PMSA (Unweighted 1 ): January–June 2004<br />
Heroin<br />
Cocaine<br />
Marijuana<br />
Benzodiazepines<br />
NA/Combinations<br />
Amphetamines<br />
Barbiturates<br />
PCP<br />
MDMA<br />
1 The unweighted data are from 10–12 Newark EDs reporting to DAWN. All DAWN cases are reviewed for quality control. Based on<br />
this review, cases may be corrected or deleted, and, therefore, are subject to change.<br />
SOURCE: DAWN Live!, OAS, SAMHSA, updated 1/13/2005<br />
Exhibit 5. Race/Ethnicity of ED Reports for Selected Drugs (Unweighted 1 ): January–June 2004<br />
Race/Ethnicity<br />
N<br />
Cocaine<br />
(%) N<br />
Heroin<br />
(%)<br />
White 113 17.1 165 20.5<br />
Black 467 70.5 520 64.8<br />
Hispanic 47 7.1 77 9.6<br />
Race/Ethnicity NTA 1 0.2 0 0<br />
Not Documented 34 5.1 41 5.1<br />
TOTAL 662 100 803 100<br />
1 The unweighted data are from 10–12 Newark EDs reporting to DAWN. All DAWN cases are reviewed for quality control. Based on<br />
this review, cases may be corrected or deleted, and, therefore, are subject to change.<br />
SOURCE: DAWN Live!, OAS, SAMHSA, updated 1/13/2005<br />
Exhibit 6. Number of Items Analyzed for Specific Drugs in Newark and Percentage of Total Items:<br />
October 2003–September 2004 1<br />
Substance Number Percent (%)<br />
Cocaine 1,256 45.57<br />
Heroin 958 34.69<br />
Marijuana 281 10.17<br />
1 N = 2,760.<br />
SOURCE: NFLIS, DEA<br />
9<br />
7<br />
20<br />
20<br />
153<br />
208<br />
257<br />
662<br />
Proceedings of the Community Epidemiology Work Group, Vol. II, January 2005<br />
803
<strong>EPIDEMIOLOGIC</strong> TRENDS IN <strong>DRUG</strong> <strong>ABUSE</strong>—Newark PMSA<br />
Exhibit 7. Illicit Drug Prices for Newark City: July 2004–December 2004<br />
Drug<br />
Price in Dollars ($)<br />
Wholesale Midlevel Retail<br />
Powdered Cocaine $15,000–$34,000 per kilogram $600–$1,800 per ounce $9–$100 per gram<br />
Crack Cocaine $20,000–$35,000 per kilogram $644–$2,000 per ounce<br />
$20–$100 per gram<br />
$150–$200 per 1/8 ounce<br />
Heroin $52,000–$120,000 per kilogram $1,600–$3,360 per ounce $25–$320 per gram<br />
Marijuana<br />
$500–$1,700 per pound boogie<br />
$3,500–$6,500 per pound HY 1<br />
$6,000–$7,000 per pound purple<br />
haze<br />
$50–$600 per ounce<br />
$100–$400 per ounce HY<br />
$400–$1,100 per 1/4 pound<br />
$250–$,750 per 1/4 pound HY<br />
$400–$2,000 per 1/2 pound<br />
$500–$2,500 per 1/2 pound HY<br />
$2–$5 per joint<br />
$5–$20 per blunt<br />
$5–$30 per bag<br />
$10–$30 per bag HY<br />
$20–$50 per gram<br />
$20–$180 per gram<br />
$9–$180 per gram crystal<br />
Methamphetamine<br />
$8,000–$20,000 per pound<br />
$15,000–$25,000 per kilogram<br />
$800–$1,500 per ounce<br />
methamphetamine<br />
$140–$300 per 1/8 ounce<br />
$400–$1,200 per 1/2<br />
ounce<br />
MDMA 7-12 per tablet NA 20-30 per tablet<br />
1 HY=Hydroponic.<br />
SOURCE: Narcotics Digest Weekly (Dec 28, 2004), National Drug Intelligence Center<br />
Exhibit 8. Number of Primary, Secondary, or Tertiary Treatment Admissions for Stimulants in Newark City,<br />
Newark PMSA, and New Jersey: January–December 2003<br />
Substance State PMSA City<br />
Ecstasy 184 65 12<br />
Methamphetamine 136 47 10<br />
Other Amphetamine 234 21 3<br />
Total Stimulants 554 133 25<br />
SOURCE: ADADS, NJSAMS, Division of Addiction Services, NJ Department of Human Services<br />
Proceedings of the Community Epidemiology Work Group, Vol. II, January 2005 153
154<br />
<strong>EPIDEMIOLOGIC</strong> TRENDS IN <strong>DRUG</strong> <strong>ABUSE</strong>—Newark PMSA<br />
Exhibit 9. Numbers 1 and Percentages of Adult/Adolescent Cases Living with HIV/AIDS in New Jersey by<br />
Exposure Category, Race/Ethnicity and Gender as of June 30, 2004<br />
Adult/Adolescent AIDS<br />
Males Females Total<br />
Cases<br />
Exposure Category<br />
N (%) N (%) N (%)<br />
Men/sex/men (MSM) 6,035 29 0 0 6,035 19<br />
Injection drug user (IDU) 6,661 32 3,605 32 10,266 32<br />
IDU/MSM 875 4 0 0 875 3<br />
Heterosexual Contact 2,314 11 4,394 39 6,708 21<br />
Other/Unknown 4,673 23 3,134 28 7,807 25<br />
TOTAL<br />
Race/Ethnicity<br />
20,558 100 11,133 100 31,691 100<br />
White 5,178 25 1,948 17 7,126 22<br />
Black 10,633 51 7,279 63 17,912 55<br />
Hispanic 4,723 23 2,069 18 6,792 21<br />
Asian/Pacific Islander 151 1 59 1 210 1<br />
Other/Unknown 222 1 139 1 361 1<br />
TOTAL 20,907 100 11,494 100 32,401 100<br />
1 Total number of cases for race/ethnicity includes pediatric cases, exposure category does not.<br />
SOURCE: New Jersey Department of Health and Senior Services, Division of AIDS Prevention and Control<br />
Exhibit 10. Race/Ethnicity of Cases Living with HIV/AIDS as of June 30, 2004: Newark City<br />
Race/Ethnicity<br />
Adult/Adolescent<br />
N (%)<br />
Pediatric<br />
N (%) N<br />
Total<br />
(%)<br />
White, Non-Hispanic # # # # 193 3<br />
Black, Non-Hispanic 4,476 79 86 89 4,562 79<br />
Hispanic 971 17 8 8 979 17<br />
Other # # # # 53 1<br />
TOTAL 5,690 100 97 100 5,787 100<br />
# Indicates that number is not shown due to small cell size, in accordance with NJDHSS security and confidentiality policies.<br />
SOURCE: New Jersey Department of Health and Senior Services, Division of AIDS Prevention and Control<br />
Exhibit 11. Adult/Adolescent Cases Living with HIV/AIDS in Newark City by Exposure Category and Gender<br />
as of June 30, 2004<br />
Exposure Category<br />
N<br />
Males<br />
(%) N<br />
Females<br />
(%) N<br />
Total<br />
(%)<br />
Men/sex/men (MSM) 559 17 0 0 559 10<br />
Injection drug user (IDU) 1,317 40 849 37 2,166 39<br />
IDU/MSM 161 5 0 0 161 3<br />
Heterosexual Contact 493 15 888 39 1,381 25<br />
Other/Unknown 801 24 552 24 1,353 24<br />
TOTAL 3,331 100 2,289 100 5,620 100<br />
SOURCE: New Jersey Department of Health and Senior Services, Division of AIDS Prevention and Control<br />
Proceedings of the Community Epidemiology Work Group, Vol. II, January 2005
<strong>EPIDEMIOLOGIC</strong> TRENDS IN <strong>DRUG</strong> <strong>ABUSE</strong>—New Orleans<br />
Drug Abuse Indicators in New Orleans<br />
Gail Thornton-Collins 1<br />
ABSTRACT<br />
Cocaine, especially crack, remains a major problem<br />
in New Orleans, although indicators suggest some<br />
decline in abuse of this drug. Heroin indicators are<br />
also declining. A growing problem is the abuse of<br />
narcotic analgesics. Admissions for opiates other<br />
than heroin accounted for 11–21 percent of all admissions<br />
in four parishes and between 5 and 9 percent<br />
in the other four. Marijuana continues to be a<br />
major drug of abuse, accounting for a large proportion<br />
of drug arrests in 2003 and for nearly 53 percent<br />
of the items analyzed by NFLIS in FY 2004.<br />
Also, admissions for primary marijuana abuse exceeded<br />
those for all other substances for the first<br />
time in fiscal year 2004. Treatment admissions data<br />
from eight other parishes for FY 2004 show that<br />
alcohol, cocaine, and marijuana accounted for<br />
large proportions of primary admissions.<br />
INTRODUCTI<strong>ON</strong><br />
Area Description<br />
New Orleans is located in southern Louisiana. The<br />
city covers 366 square miles, of which 164 are water.<br />
About one-half of the metropolitan area’s 1.3 million<br />
inhabitants live in Orleans Parish, the largest of Louisiana’s<br />
64 parishes. The State has a total population<br />
of about 4.5 million people.<br />
Serviced by several deep-water ports, New Orleans is<br />
located at the connection of two principal waterways:<br />
the Gulf Intracoastal Waterway and the Mississippi<br />
River. Barge lines, ocean carriers, and truck lines<br />
serve the Port of New Orleans. Exhibit 1 shows the<br />
race/ethnicity breakdown for both New Orleans and<br />
the State of Louisiana in 2000 and estimates for<br />
2003. As shown, New Orleans had a much higher<br />
percentage of African-Americans (67.3 vs. 32.5 percent)<br />
and a much lower percentage of Whites (28.1<br />
vs. 63.9 percent) than the State in 2000.<br />
Data Sources<br />
Information for this report was collected from the<br />
sources described below:<br />
1 The author is affiliated with the New Orleans Health Department, New Orleans, Louisiana.<br />
• Emergency department (ED) data for January–June<br />
2004 were accessed through the Drug<br />
Abuse Warning Network (DAWN) Live! restricted<br />
access online query system, which is<br />
administered by the Office of Applied Studies<br />
(OAS), Substance Abuse and Mental Health<br />
Services Administration (SAMHSA). Nineteen<br />
of the 21 eligible hospitals in the New Orleans<br />
metropolitan area are in the DAWN sample,<br />
with a total of 21 EDs in the sample. (Some<br />
hospitals have more than one ED.) The data reported<br />
in this paper were not complete. During<br />
the 6-month period, between 8 and 11 of the 19<br />
EDs in the DAWN sample reported data each<br />
month. The data in this paper were updated by<br />
OAS on December 13, 2004; they are unweighted<br />
and are not estimates for the new Orleans<br />
area. Since all DAWN cases are reviewed<br />
for quality control, and may be corrected or deleted,<br />
the data reported here are subject to<br />
change. The information derived from DAWN<br />
Live! represent drug reports in drug-related visits;<br />
reports exceed the number of ED visits because<br />
a patient may report use of multiple drugs<br />
(up to six drugs and alcohol may be represented<br />
in DAWN). This paper presents data on “Illicit<br />
Drugs of Abuse” (excluding “Alcohol Only” for<br />
patients under 21) and nonmedical use of two<br />
prescription-type drugs. These data cannot be<br />
compared with DAWN data from 2002 and before,<br />
nor can these preliminary data be used for<br />
comparison with future data. Only weighted ED<br />
data released by SAMHSA can be used for<br />
trend analysis. A full description of the DAWN<br />
system can be found at the DAWN Web site<br />
.<br />
• Drug treatment data were provided by the Louisiana<br />
State Office for Addictive Disorders and<br />
by not-for-profit treatment facilities for Orleans<br />
Parish for fiscal year (FY) 1995 through FY<br />
2004, when 2,306 persons were treated in New<br />
Orleans Parish. (Fiscal years run July through<br />
June.) Data for FY 2004 in eight of the largest<br />
parishes in the State are also reported.<br />
• Drug arrest data were provided by the New<br />
Orleans Police Department (NOPD) for 2002–<br />
Proceedings of the Community Epidemiology Work Group, Vol. II, January 2005 155
156<br />
2003. Anecdotal information on arrests in 2004<br />
was also provided by NOPD.<br />
• Forensic laboratory testing data were provided<br />
by the Drug Enforcement Administration for FY<br />
2004 (October 2003–September 2004), as reported<br />
to the National Forensic Laboratory Information<br />
System (NFLIS).<br />
• Drug price, purity, and seizure information<br />
was extracted from Narcotics Digest Weekly,<br />
Volume 3, Number 52, December 28, 2004, National<br />
Drug Intelligence Center (NDIC), and the<br />
Drug Enforcement Administration (DEA) for the<br />
last quarter of 2004. Data for heroin purity were<br />
derived from the DEA’s Domestic Monitor Program<br />
(DMP) for 2003.<br />
• Acquired immunodeficiency syndrome (AIDS)<br />
and human immunodeficiency virus (HIV) data<br />
were provided by the Louisiana HIV/AIDS Surveillance<br />
Program and represent cases reported in<br />
the third quarter of 2004.<br />
No recent mortality, survey, or drug-related mortality<br />
data were available for this reporting period. Trends in<br />
drug-related mortality data (DAWN); the Youth Risk<br />
Behavior Surveillance (YRBS) survey, Centers for<br />
Disease Control and Prevention; and drug-related mortality<br />
data can be found in “Overview of Drug Abuse<br />
Indicators in New Orleans,” Epidemiologic Trends in<br />
Drug Abuse, Proceedings Vol. II, June 2004.<br />
<strong>DRUG</strong> <strong>ABUSE</strong> PATTERNS AND TRENDS<br />
Cocaine/Crack<br />
Crack has been and continues to be the most serious<br />
drug problem in New Orleans. It is associated with<br />
high rates of violence and crime in the city. The DEA<br />
reports that, in 2004, crack and cocaine hydrochloride<br />
(HCl) were widely available in New Orleans in quantities<br />
from kilograms to grams.<br />
Surprisingly, despite the impact and availability of<br />
cocaine/crack, primary treatment admissions for the<br />
drug have been decreasing since 1993. Exhibit 2<br />
shows the percentages of treatment admissions for<br />
the most commonly abused substances in Orleans<br />
Parish—cocaine/crack, alcohol-in-combination, marijuana,<br />
and heroin. Cocaine/crack treatment admissions<br />
in the parish decreased from 40.4 percent of all<br />
admissions in FY 1995 to 31.6 percent in FY 2004.<br />
There were many possible reasons for the decreases<br />
in cocaine admissions, including increases in referrals<br />
of marijuana abusers to treatment by the courts. A<br />
<strong>EPIDEMIOLOGIC</strong> TRENDS IN <strong>DRUG</strong> <strong>ABUSE</strong>—New Orleans<br />
relatively high proportion (39.8 percent) of primary<br />
cocaine/crack treatment admissions in 2004 were<br />
female. Most (80.3 percent) of the male and female<br />
primary cocaine/crack admissions were African-<br />
American. A relatively large percentage (41.4 percent)<br />
of the African-American female cocaine/crack<br />
admissions were in the 35–44-year-old age category.<br />
Among eight other Louisiana parishes, primary cocaine<br />
admissions in 2004 were highest in East Baton<br />
Rouge Parish (45.5 percent) and lowest in Calcasieu<br />
Parish (15.8 percent) (exhibit 3).<br />
Other cocaine/crack indicators remained high in New<br />
Orleans, including hospital emergency department<br />
cases, items identified by police forensic labs, and<br />
arrests for cocaine possession and distribution.<br />
Preliminary unweighted data accessed from DAWN<br />
Live! show cocaine ED reports totaled 494 from<br />
January 1 through June 2004 (exhibit 4), another indicator<br />
of the cocaine problem in New Orleans.<br />
Approximately 38 percent of all items analyzed by<br />
NFLIS labs in New Orleans in FY 2004 were cocaine<br />
(see exhibit 5). This was lower than the percentage of<br />
cannabis items identified (53 percent), but much<br />
higher than the percentages for other drugs identified.<br />
In 2003, there were lower numbers of arrests for cocaine<br />
possession (n=2,941) and distribution (1,262)<br />
than in 2002 (3,649 for possession and 1,434 for distribution)<br />
(exhibit 6).<br />
In New Orleans, Mexican and Caribbean drug trafficking<br />
organizations (DTOs) are the primary distributors<br />
of cocaine HCl at the wholesale level. They<br />
generally do not sell cocaine in the crack form because<br />
of the more severe Federal sentencing guidelines<br />
for the distribution of cocaine in this form. So,<br />
street dealers generally assume responsibility for<br />
converting cocaine HCl to crack. The dominant<br />
street-level crack dealers in New Orleans are African-<br />
Americans.<br />
At the retail level, crack is commonly sold in the<br />
form of rocks and cookies, in small plastic bags, clear<br />
plastic vials, and 35-millimeter film canisters. The<br />
DEA reported that, in the last half of 2004, purity<br />
levels for crack ranged from 40 to 90 percent, while<br />
purity levels for HCl were more variable in the 17 to<br />
90 percent range.<br />
Cocaine HCl is commonly sold in one-quarter, onehalf,<br />
and 1 ounce quantities. Prices range from $800<br />
to $1,200 per ounce and approximately $18,000 to<br />
Proceedings of the Community Epidemiology Work Group, Vol. II, January 2005
$25,000 per kilogram. When cut/mixed with adulterants,<br />
and less potent, cocaine HCl can be purchased<br />
at low prices at the street level. Crack has been available<br />
at $5 to $25 per rock and can be purchased on<br />
the street for $900 to $1,200 per ounce.<br />
Methamphetamine/Amphetamines<br />
Methamphetamine indicators remained at low levels<br />
in New Orleans in 2003–2004. The DEA New Orleans<br />
Field Division (NOFD), however, reports that<br />
methamphetamine may be gaining popularity in some<br />
small towns and communities in the State. An increase<br />
in small clandestine methamphetamine labs<br />
has been reported in some rural areas. Most of the<br />
methamphetamine seized in Louisiana came from<br />
Mexico and was transported into the State from California<br />
or Texas in private and commercial vehicles.<br />
In FY 2004, only five primary methamphetamine<br />
abusers entered treatment programs in Orleans Parish,<br />
representing only 0.2 percent of all admissions during<br />
the 1-year period. Primary methamphetamine admissions<br />
are higher in eight other parishes, based on the<br />
assessment of the Louisiana State Epidemiology<br />
Work Group. As shown in exhibit 3, the parishes in<br />
Louisiana with the highest numbers and percentages<br />
of primary methamphetamine admissions in 2004<br />
include Rapides (6.7 percent), Bossier (6.2 percent),<br />
Calcasieu (4.2 percent), and Ouachita (3.8 percent).<br />
Rapides is located near the Texas border, through<br />
which most of the methamphetamine in Louisiana<br />
was transported.<br />
Of the unweighted drug reports accessed from<br />
DAWN Live! in New Orleans during the first half of<br />
2004, 10 involved amphetamines (exhibit 4); there<br />
were no reports of methamphetamine.<br />
Of the items analyzed by NFLIS labs in FY 2004,<br />
only eight (0.2 percent of all items analyzed) contained<br />
methamphetamine (exhibit 5).<br />
Heroin<br />
In New Orleans, heroin indicators have remained<br />
relatively stable from 2001 to 2004. After increasing<br />
from 8.4 percent of all treatment admissions in 1998<br />
to 14.8 percent in 2001, heroin treatment admissions<br />
remained level, at about 11.0 percent from 2002 to<br />
2004. As in the prior 3 years, most of the heroin admissions<br />
were male (74.5 percent). Of the males,<br />
80.5 percent were African-Americans and 52.6 percent<br />
were in the 25–34 age category. Slightly more<br />
than one-half (53.8 percent) of the female heroin admissions<br />
were African-American. St. Tammany (3.3<br />
<strong>EPIDEMIOLOGIC</strong> TRENDS IN <strong>DRUG</strong> <strong>ABUSE</strong>—New Orleans<br />
percent) was the only other parish in which more than<br />
1 percent of admissions were primary heroin abusers<br />
(exhibit 3).<br />
Other heroin indicators were relatively low compared<br />
to indicators for other illicit drugs. In the period from<br />
October 2003 through February 2004, only 6.6 percent<br />
of all drug items (n=260) analyzed by forensic<br />
labs in New Orleans included heroin (exhibit 5). In<br />
the first half of 2004, unweighted data accessed from<br />
DAWN Live! show that ED reports involving heroin<br />
totaled 185, accounting for nearly 17 percent of illicit<br />
drug reports (exhibit 4). This was a much smaller<br />
number than the numbers of cases reported for other<br />
illicit drugs, including cocaine and marijuana.<br />
The DEA reported that the primary heroin traffickers<br />
for the heroin that is marketed in New Orleans are<br />
Colombian, Nigerian, and African-American. Much of<br />
the heroin is transported into the area from Texas in<br />
privately owned vehicles. Some of the heroin is also<br />
brought into the ports near New Orleans via vessels.<br />
Like crack cocaine, heroin has a major impact on the<br />
homicide and robbery rates in New Orleans. The<br />
NOPD reported that a relatively high percentage of<br />
individuals arrested for robbery in 2004 were African-Americans<br />
in the 25–36 year age category. The<br />
2003 arrest data show that African-Americans predominated<br />
in arrests involving heroin (exhibit 6).<br />
African-American trafficking organizations have<br />
been distributing heroin in government-supported<br />
housing projects and in other low-income neighborhoods.<br />
Heroin is most commonly sold on the streets<br />
of New Orleans in “bags” or “papers.” Mixtures containing<br />
0.3 to 0.5 grams are wrapped in small foil<br />
packages that are placed in plastic sandwich bags for<br />
multiple sales. Bags or papers are sold for $20 to $25<br />
each at the retail level, but it is possible to buy a bundle<br />
(25) bags for about $300.<br />
In 2003, most of the DMP heroin street buys in New<br />
Orleans were of South American origin. The purity of<br />
the heroin averaged 31.8 percent and sold for $1.62<br />
per milligram pure<br />
Marijuana<br />
Marijuana indicators were stable in 2004, but this<br />
drug is still the most readily available illicit drug in<br />
New Orleans and the State of Louisiana. The price of<br />
marijuana decreased in recent years as the supply<br />
from Mexico increased. Mexican DTOs dominate the<br />
wholesale distribution of marijuana, which flows up<br />
through the Southwest border and through such<br />
Texas hub sites as Houston, Dallas, San Antonio,<br />
Proceedings of the Community Epidemiology Work Group, Vol. II, January 2005 157
Brownsville, and El Paso. African-American and<br />
Mexican criminal groups transport large quantities of<br />
the drug and make it available to local dealers. Local<br />
independent dealers, street gangs, and other small<br />
groups are the local distributors.<br />
According to the NDIC, the price of marijuana was<br />
stable in 2004. Joints sold for as low as $2, and grams<br />
could be purchased for $10. Marijuana was sold retail<br />
by the ounce for $125–$160 and wholesale by the<br />
pound for $800–$1,000.<br />
In FY 2004, nearly one-third (32.1 percent, n=740) of<br />
the 2,306 drug abuse treatment admissions in Orleans<br />
Parish were primary marijuana/hashish abusers (exhibit<br />
2). Most (80.5 percent) were male. Marijuana<br />
treatment admissions increased sharply from 11.5<br />
percent in 1993 to 16.5 percent in 1994 to 28.2 percent<br />
in 1995. However, from 1995 to 2004, the percentage<br />
of marijuana treatment admissions remained<br />
relatively stable.<br />
More than one-half (52.8 percent) of the items analyzed<br />
in NFLIS labs in the first half of 2004 contained<br />
cannabis (exhibit 5). This was, by far, the drug<br />
most often identified by the police labs.<br />
In the unweighted data accessed from DAWN Live!,<br />
there were 306 marijuana ED reports in the first half<br />
of 2004, accounting for 27.5 percent of illicit drug<br />
reports (exhibit 4).<br />
Other Opiates/Narcotics<br />
Indicators for opiates other than heroin remained low<br />
over the last 7 years. Hydromorphone (Dilaudid) is<br />
being replaced by OxyContin as the most popular<br />
opiate of abuse in the New Orleans area, but hydrocodone<br />
(Vicodin), propoxyphene (Darvon), alprazolam<br />
(Xanax), oxycodone (Percodan), and hydromorphone<br />
are the most widely diverted opiates.<br />
Unweighted DAWN ED data for the first half of 2004<br />
show 492 reports of opiates/opioids. Of the opiate/opioid<br />
reports, 41.9 percent were hydrocodone<br />
reports and 6.2 percent were oxycodone reports.<br />
Among treatment admissions in Orleans Parish in FY<br />
2004, 82 (3.6 percent) were for primary abuse of<br />
“other opiates or synthetic opioids” or nonprescription<br />
methadone. All but seven were White; 57 percent were<br />
White females and 35 percent were White males.<br />
Whites also dominated among these other opiate admissions<br />
in other parishes. The proportions of these<br />
admissions in East Baton Rouge and Ouachita Parishes<br />
(ranging from 4.7 to 5.0 percent) were similar to that in<br />
158<br />
<strong>EPIDEMIOLOGIC</strong> TRENDS IN <strong>DRUG</strong> <strong>ABUSE</strong>—New Orleans<br />
Orleans Parish, while those in the other parishes were<br />
higher, ranging from approximately 7 to 21 percent. In<br />
St. Tammany Parish, 21 of the 216 other opiate admissions<br />
were for nonprescribed methadone, the highest<br />
number in any of the 9 parishes represented in exhibits<br />
2 and 3. Across the other eight parishes as shown in<br />
exhibit 3, other opiates admissions were highest in St.<br />
Tammany Parish (21.1 percent) and Lafayette Parish<br />
(11.5 percent).<br />
According to news reports, a large number of persons<br />
abusing methadone were from pain management clinics.<br />
Because of the large number of deaths, many of<br />
which involved methadone and other opiates, the State<br />
of Louisiana asked for an investigation of pain clinics<br />
in the New Orleans area. The Legislative Branch has<br />
closed down many of these clinics and placed stricter<br />
guidelines on others.<br />
Of the 3,964 items analyzed by NFLIS in FY 2004, 30<br />
(0.8 percent) were “other opiates/narcotics” (exhibit<br />
5); 21 (70 percent) of these were hydrocodone.<br />
Club Drugs<br />
Use of club drugs continues to be reported in clubs<br />
and bars around the French Quarter area of the city.<br />
Drugs such as methylenedioxymethamphetamine<br />
(MDMA or ecstasy) and gamma hydroxybutyrate<br />
(GHB) are particularly abused near large metropolitan<br />
areas of the State where college populations are<br />
large. Use of drugs such as ecstasy and flunitrazepam<br />
(Rohypnol) and similar “date rape” drugs are on the<br />
rise among youth in the city. Youth continue to be<br />
lured to these drugs because of their “hipness” and<br />
the myth that club drugs are safe. Ketamine abuse<br />
appears to have declined in the city, with little mention<br />
of the drug other than among teenagers experimenting<br />
with it.<br />
Unweighted data accessed from DAWN Live! for the<br />
first half of 2004 show 35 MDMA reports, representing<br />
3.1 percent of illicit drug reports (exhibit 4). ED reports<br />
for other drugs used in the “club scene” were few in<br />
number: nine phencyclidine (PCP) reports, six gamma<br />
hydroxybutyrate (GHB) reports, and two lysergic acid<br />
diethylamide (LSD) reports.<br />
Of the 3,964 items analyzed by NFLIS in FY 2004,<br />
only 17 were MDMA or methylenedioxyamphetamine<br />
(MDA) (exhibit 5). Another two were ketamine and<br />
one was LSD.<br />
The retail cost of MDMA in the second half of 2004<br />
was $15–$20 per tablet (exhibit 7).<br />
Proceedings of the Community Epidemiology Work Group, Vol. II, January 2005
Benzodiazepines<br />
The unweighted data from DAWN Live! show that<br />
ED reports of benzodiazepines totaled 413 in the first<br />
half of 2004.<br />
Benzodiazepines accounted for 1 percent of the items<br />
analyzed by NFLIS in FY 2004 (exhibit 5). Of the 39<br />
benzodiazepine-type items, 24 (61.5 percent) were<br />
alprazolam.<br />
Alcohol<br />
Alcohol abuse is a serious problem in New Orleans,<br />
as it is in many cities and towns in the United States.<br />
Alcohol and drugs are often used together, also a<br />
common pattern across the Nation.<br />
In Orleans Parish, primary alcohol admissions accounted<br />
for nearly 19 percent of all admissions in FY<br />
2004 (exhibit 2). Primary alcohol admissions in eight<br />
other parishes in 2004 ranged from a low of 25 per-<br />
<strong>EPIDEMIOLOGIC</strong> TRENDS IN <strong>DRUG</strong> <strong>ABUSE</strong>—New Orleans<br />
cent in St. Tammany Parish to a high of 41 percent in<br />
Bossier Parish (exhibit 3).<br />
Deaths<br />
There were 147 homicides in the city of New Orleans<br />
from July 2004 to December 2004; 110 (75 percent)<br />
were drug-related. Methadone and cocaine were the<br />
drugs most frequently cited.<br />
INFECTIOUS DISEASES RELATED TO <strong>DRUG</strong> <strong>ABUSE</strong><br />
In the third quarter of 2004, there were 7,393 persons<br />
living with HIV or AIDS in the New Orleans metropolitan<br />
area. Of the 4,761 for whom exposure risk was<br />
known, 16.4 percent—502 men and 277 women—<br />
were exposed through injection drug use. Another 8.2<br />
percent of the exposed cases were men who have sex<br />
with men and inject drugs. In addition, approximately<br />
18 percent of the cases (634 women and 238 men)<br />
were exposed through heterosexual contact.<br />
For inquiries concerning this report, please contact Gail Thornton-Collins, New Orleans Health Department, 2025 Canal Street, Suite 200, New<br />
Orleans, LA 70112, Phone:(504) 528-1912, E-mail .<br />
Proceedings of the Community Epidemiology Work Group, Vol. II, January 2005 159
160<br />
<strong>EPIDEMIOLOGIC</strong> TRENDS IN <strong>DRUG</strong> <strong>ABUSE</strong>—New Orleans<br />
Exhibit 1. Population Demographics for the City of New Orleans vs. the State of Louisiana, by Percent:<br />
2000 and 2003 (Estimates)<br />
Population Demographic<br />
2000<br />
New Orleans Louisiana<br />
2003 (Estimates)<br />
New Orleans Louisiana<br />
Total Population (N) (484,674) (4,468,976) (451,316) (4,361,271)<br />
Male 46.9 48.4 46.1 48.1<br />
Female 53.1 51.6 53.9 51.9<br />
Median Age (Years) (33.1) (34.0) (34.3) (34.7)<br />
One Race 98.7 98.9 99.3 98.9<br />
White 28.1 63.9 28.1 64.0<br />
Black or African-American 67.3 32.5 67.2 32.1<br />
Asian 2.3 1.2 2.6 1.5<br />
Other 1.1 1.3 1.4 1.2<br />
Two or More Races 1.3 1.1 0.7 1.1<br />
Hispanic or Latino (of any race) 3.1 2.4 3.1 2.5<br />
Average Household Size (n) (2.48) (2.62) (2.49) (2.61)<br />
Median Household Income ($) ($27,133) ($32,566) ($35,677) ($34,141)<br />
Individuals Living Below Poverty Level 27.9 19.6 20.8 20.3<br />
SOURCE: U.S. Census Bureau<br />
Exhibit 2. Percentages of Treatment Admissions in Orleans Parish, by Selected Drug: FYs 1995–2004<br />
45.0<br />
40.0<br />
35.0<br />
30.0<br />
25.0<br />
20.0<br />
15.0<br />
10.0<br />
5.0<br />
0.0<br />
1995 1996 1997 1998 1999 2000 2001 2002 2003 2004<br />
Cocaine 40.4 41.1 36.2 38.1 35.5 34.4 32.5 34.5 34.0 31.6<br />
Heroin 3.5 3.6 6.2 8.4 12.2 11.2 14.8 11.8 10.6 11.1<br />
Marijuana 28.2 31.3 30.9 30.2 33.0 29.2 30.5 29.8 28.9 32.1<br />
Alcohol 25.5 22.3 24.9 21.4 17.8 20.5 18.6 19.3 21.2 18.7<br />
SOURCE: Louisiana State Office of Alcohol and Drug Abuse<br />
Proceedings of the Community Epidemiology Work Group, Vol. II, January 2005
<strong>EPIDEMIOLOGIC</strong> TRENDS IN <strong>DRUG</strong> <strong>ABUSE</strong>—New Orleans<br />
Exhibit 3. Treatment Admissions for Selected Drugs in Eight Parishes Outside Orleans Parish, by Percent:<br />
2004<br />
Drug<br />
Bossier Calcasieu<br />
East Baton<br />
Rouge<br />
Parish<br />
Lafayette Ouachita Rapides<br />
St.<br />
Tammany Terrebonne<br />
Cocaine 26.7 15.8 45.5 32.3 24.8 26.5 28.4 17.3<br />
Heroin 0.0 0.3 0.8 0.9 0.3 0.7 3.3 0.3<br />
Other Opiates 8.9 11.4 5.0 11.5 4.7 11.4 21.1 7.5<br />
Marijuana 15.4 30.0 13.2 13.3 26.6 17.5 17.3 37.3<br />
Methamphetamine 6.2 4.2 2.1 1.0 3.8 6.7 1.6 1.0<br />
Alcohol 40.8 30.7 32.6 37.8 36.1 32.9 24.7 34.2<br />
Other Drugs 2.0 7.6 0.8 3.2 3.7 4.3 3.6 2.4<br />
Total (N=) 1 (292) (983) (3,432) (885) (914) (1,295) (1,026) (986)<br />
1 Excludes a few admissions for whom a primary drug was not reported.<br />
SOURCE: Louisiana State Office of Alcohol and Drug Abuse<br />
Exhibit 4. Numbers and Percentages of Selected Illicit 1 ED Drug Reports (Unweighted 2 ): January–June 2004<br />
Drug Number Percent<br />
Cocaine 494 44.3<br />
Amphetamines 10 4.5<br />
Heroin 185 16.6<br />
Marijuana 306 27.5<br />
MDMA 35 3.1<br />
Other Illicit Drugs 44 3.9<br />
1 Excludes “Alcohol Only” reports for patients younger than age 21.<br />
2 The unweighted data are from 8–11 New Orleans EDs reporting to DAWN. All DAWN cases are reviewed for quality control. Based<br />
on this review, cases may be corrected or deleted and, therefore, are subject to change.<br />
SOURCE: DAWN Live!, OAS, SAMHSA, Updated 12/13/2004<br />
Exhibit 5. Numbers of Analyzed Items and Percentages of All Items Tested 1 in New Orleans, by Drug:<br />
FY 2004<br />
Drug Number Percent<br />
Cannabis 2,094 52.8<br />
Cocaine 1,512 38.1<br />
Heroin 260 6.6<br />
Other Opiates 30 0.8<br />
Benzodiazepines 39 1.0<br />
MDMA/MDA 17 0.4<br />
Methamphetamine/Amphetamine 8 0.2<br />
1 A total of 3,964 items were reported.<br />
SOURCE: NFLIS, DEA<br />
Proceedings of the Community Epidemiology Work Group, Vol. II, January 2005 161
162<br />
<strong>EPIDEMIOLOGIC</strong> TRENDS IN <strong>DRUG</strong> <strong>ABUSE</strong>—New Orleans<br />
Exhibit 6. Drug Arrests in Orleans Parish by Race/Ethnicity, Gender, and Offense: 2002–2003<br />
Drug/<br />
Offense<br />
Cocaine<br />
Possession<br />
Distribution<br />
Heroin<br />
Possession<br />
Distribution<br />
Marijuana<br />
Possession<br />
Distribution<br />
Black<br />
Males<br />
White Other Black<br />
Females<br />
White Other<br />
Total<br />
2002 2003 2002 2003 2002 2003 2002 2003 2002 2003 2002 2003 2002 2003<br />
2,430<br />
1,223<br />
204<br />
177<br />
4,345<br />
808<br />
2,134<br />
1,086<br />
230<br />
155<br />
4,389<br />
832<br />
430<br />
46<br />
53<br />
3<br />
1,018<br />
51<br />
306<br />
38<br />
66<br />
5<br />
1,034<br />
80<br />
10<br />
6<br />
1<br />
0<br />
16<br />
2<br />
14<br />
6<br />
0<br />
0<br />
18<br />
1<br />
646<br />
148<br />
18<br />
13<br />
384<br />
107<br />
385<br />
120<br />
24<br />
16<br />
447<br />
119<br />
129<br />
10<br />
25<br />
3<br />
196<br />
13<br />
101<br />
11<br />
Proceedings of the Community Epidemiology Work Group, Vol. II, January 2005<br />
38<br />
0<br />
182<br />
23<br />
4<br />
1<br />
0<br />
0<br />
0<br />
0<br />
1<br />
1<br />
0<br />
0<br />
0<br />
2<br />
3,649<br />
1,434<br />
301<br />
196<br />
5,959<br />
981<br />
2,941<br />
1,262<br />
358<br />
176<br />
6,070<br />
1,057<br />
Other Drugs 299 197 81 51 2 1 40 24 117 25 0 0 539 298<br />
Drug Paraphernalia<br />
1,340 1,404 636 631 11 18 447 402 204 195 2 2 2,640 2,652<br />
SOURCE: NOPD<br />
Exhibit 7. Illicit Drug Prices in New Orleans: July–December 2004<br />
Drug<br />
Price in Dollars<br />
Wholesale Midlevel Retail<br />
Powder Cocaine $18,000–$25,000 per kilogram $800–$1,200 per ounce $250 per ¼ ounce<br />
$9,000–$10,000 per pound<br />
$80–$150 per gram<br />
Crack $20,000–$28,000 per kilogram $900–$1,200 per ounce $5–$25 per rock<br />
$8,000 per pound<br />
$80–$125 per gram<br />
Heroin $80,000–$100,000 per kilo- $4,000–$9,000 per ounce $20–$25 per paper<br />
gram<br />
$300–$600 per gram<br />
Marijuana $2,000 per kilogram<br />
$125–$160 per ounce $10 per gram<br />
$800–$1,000 per pound<br />
$2 per joint<br />
Methamphetamine $20,000 per pound $1,400–$1,600 per ounce $400–$500 per ¼ ounce<br />
$100 per gram<br />
MDMA $8–$12 per tablet $12–$15 per tablet $15–$20 per tablet<br />
SOURCE: DEA and Narcotics Digest Weekly, NDIC
<strong>EPIDEMIOLOGIC</strong> TRENDS IN <strong>DRUG</strong> <strong>ABUSE</strong>—New York City<br />
Drug Use Trends in New York City<br />
Rozanne Marel, Ph.D., John Galea, M.A., and Robinson B. Smith, M.A. 1<br />
ABSTRACT<br />
Drug use trends were again mixed for this reporting<br />
period. Cocaine indicators in New York City appeared<br />
to be stable in this reporting period. Although both<br />
cocaine powder and crack remain of good quality,<br />
many crack locations are seeing a decline in buyers<br />
and sellers. Heroin indicators also remained stable.<br />
Heroin remains widely available, although the purity<br />
levels have fallen below the recently reported 60percent<br />
level. Marijuana indicators, which had been<br />
reaching new peaks, seem to have stabilized. Marijuana<br />
continues to be available in a wide variety of<br />
flavors and colors. Although the numbers remain<br />
small, methamphetamine indicators are showing an<br />
increase. Both New York City and upstate areas have<br />
experienced an increase in treatment admissions.<br />
Many kinds of prescription drugs continue to be<br />
available on the street, and they seem to be growing in<br />
popularity, based on indicator data and street observations.<br />
Among the 88,479 New Yorkers living with<br />
HIV or AIDS, men having sex with men and injection<br />
drug use history were the two major transmission risk<br />
factors.<br />
INTRODUCTI<strong>ON</strong><br />
Area Description<br />
New York City, with 8 million people, is by far the<br />
largest city in the United States. It is situated in the<br />
southeastern corner of the State on the Atlantic coast<br />
and encompasses an area of 320 square miles. It has<br />
nearly 600 miles of waterfront and one of the world’s<br />
largest harbors.<br />
Historically, New York City has been home to a large<br />
multiracial, multiethnic population. New York City is<br />
the largest and most racially/ethnically diverse city in<br />
the country. As has been true throughout its history,<br />
immigration continues to shape the character of New<br />
York City. It has contributed to a substantial shift in the<br />
race/ethnic composition of New York. Findings from<br />
the 2000 census show that the population diversity continues:<br />
35 percent are White; 27 percent are Black; 27<br />
percent are Hispanic of any race; and 10 percent are<br />
Asian and Pacific Islander. The five largest Asian<br />
groups in the city are Chinese, Asian Indian, Korean,<br />
Filipino, and Pakistani, and the five largest groups of<br />
Hispanic origin are Dominican, Mexican, Puerto Rican,<br />
Colombian, and Ecuadorian. Moreover, New York City<br />
includes people who identify with races/ethnicities<br />
from all over the world. It is estimated, for example,<br />
that in Queens alone more than 120 languages are spoken.<br />
Nearly 3 million New York City residents are<br />
foreign born (2,871,032), which represents 36 percent<br />
of the resident population, and about 1.2 million legal<br />
immigrants became New York City residents between<br />
1990 and 2000. The Dominican Republic remains the<br />
city’s largest source of immigrants.<br />
The city remains the economic hub of the Northeast. Its<br />
main industries include services and wholesale and<br />
retail trade. Of the more than 3.7 million people employed<br />
in the city, 22 percent commute from surrounding<br />
areas. Overall, the unemployment rate in New<br />
York City for October 2004 was 6.1 percent, compared<br />
with 5.2 percent in New York State and 5.5 percent in<br />
the Nation. According to the Bureau of Labor Statistics,<br />
the New York City rate is dramatically lower than it<br />
was in October 2003, when it was 8.3, but it is higher<br />
than the unemployment rate for October 2000, when<br />
the rate was 5.4. New York City is still experiencing<br />
the economic aftereffects of the September 11, 2001,<br />
attacks on the World Trade Center. Many jobs in New<br />
York City were lost as a result of decreased business<br />
activity and the relocation of business firms.<br />
Census 2000 data showed that the median household<br />
income for New York City residents was $38,323, as<br />
compared to $43,393 for State residents and $41,994<br />
for U.S. residents as a whole. The percentages of persons<br />
living below the poverty level for New York City<br />
and the State as a whole were 21.2 percent and 14.6<br />
percent, respectively. The comparable figure for U.S.<br />
residents as a whole in 2000 was 12.4 percent.<br />
New York City is also believed to be an economic hub<br />
for the underground economy. Defined as all off-thebooks<br />
and unregulated activity, the underground economy<br />
is believed to be growing in the United States,<br />
especially in cities with large immigrant populations<br />
like Los Angeles, Miami, and New York. For example,<br />
in a November 2004 report by the New York City<br />
Comptroller dealing with just one sector of the under-<br />
1 The authors are affiliated with the New York State Office of Alcoholism and Substance Abuse Services, New York, New York.<br />
Proceedings of the Community Epidemiology Work Group, Vol. II, January 2005 163
ground economy, it was estimated that New York City<br />
is home to a $23 billion annual illegal counterfeiting<br />
industry, causing the city to lose more than $1 billion in<br />
tax revenues each year.<br />
Data Sources<br />
This report describes current drug abuse trends in New<br />
York City from 1995 to 2004, using the data sources<br />
summarized below:<br />
• Emergency department (ED) drug mentions data<br />
were derived from the Drug Abuse Warning Network<br />
(DAWN), Office of Applied Studies (OAS),<br />
Substance Abuse and Mental Health Services Administrative<br />
(SAMHSA), for 1995 through 2002.<br />
The weighted data are based on a representative<br />
sample of hospitals in New York City and Westchester,<br />
Rockland, and Putnam Counties.<br />
• Drug abuse-related death data are from the<br />
DAWN mortality system. Data from 1995 covered<br />
New York City, Long Island, and Putnam County<br />
and included heroin/morphine and unspecified types<br />
of opiates. Beginning in 1996, DAWN covered only<br />
New York City, and the category for heroin/morphine<br />
no longer included other opiates.<br />
According to Mortality Data From the Drug Abuse<br />
Warning Network, 2001, incomplete data were received<br />
for the New York metropolitan area, so data<br />
for New York were not presented for 2001.<br />
• Treatment admissions data were provided by the<br />
New York State Office of Alcoholism and Substance<br />
Abuse Services (OASAS) for 1995 through<br />
the first half of 2004 and included both State-funded<br />
and nonfunded admissions. Demographic data are<br />
for the first half of 2004.<br />
• Arrestee drug testing data were provided by the<br />
Arrestee Drug Abuse Monitoring (ADAM) program,<br />
National Institute of Justice (NIJ), for 2003.<br />
Adult males were sampled representatively, and<br />
data are weighted. Female data are unweighted.<br />
• Drug-related arrest data were provided by the<br />
New York City Police Department (NYPD) for<br />
1994–2002.<br />
• Forensic laboratory testing data for New York<br />
City were provided by the Drug Enforcement Administration<br />
(DEA)’s National Forensic Laboratory<br />
Information System (NFLIS) for fiscal year (FY)<br />
2004 (from October 1, 2003, through September<br />
2004).<br />
164<br />
<strong>EPIDEMIOLOGIC</strong> TRENDS IN <strong>DRUG</strong> <strong>ABUSE</strong>—New York City<br />
• Drug price, purity, and trafficking data were<br />
provided by the DEA’s Domestic Monitor Program<br />
(DMP) for heroin. These data are supplemented by<br />
information from the OASAS Street Studies Unit<br />
(SSU) reports. Data on methamphetamine laboratories<br />
were provided by the New York State Police.<br />
• Cocaine use during pregnancy data were provided<br />
by the New York City Department of Health<br />
for 1995–2003.<br />
• Acquired immunodeficiency syndrome (AIDS)<br />
and human immunodeficiency virus (HIV) data<br />
were provided by the New York City Department of<br />
Health for 1984–2003.<br />
<strong>DRUG</strong> <strong>ABUSE</strong> PATTERNS AND TRENDS<br />
Cocaine/Crack<br />
In general, many cocaine indicators, which had been<br />
declining, are beginning to show increases, and the<br />
drug still accounts for major problems in New York<br />
City (exhibit 1).<br />
For the New York City metropolitan area, DAWN estimates<br />
for cocaine ED mentions remained essentially<br />
the same in 2001 and 2002 (13,898 and 13,961, respectively).<br />
There was a significant decline, however,<br />
between 1995, when there were 19,715 mentions, and<br />
2002—a decrease of 29 percent. The rate of cocaine ED<br />
mentions per 100,000 population in the New York City<br />
metropolitan area for 2002 was 166, the same as the<br />
previous 2 years, but a decline of 32 percent since<br />
1995. The comparable national rate for 2002 was 78.<br />
While the national rate had been relatively stable, there<br />
was a 33-percent increase in this rate since 1995.<br />
While primary cocaine treatment admissions to Statefunded<br />
and nonfunded programs in New York City<br />
declined from 17,572 in 1998 to 14,059 in 2000, they<br />
increased to 16,114 in 2003. In the first half of 2004,<br />
primary cocaine admissions remained essentially the<br />
same as in the first half of 2003, with 8,208 admissions.<br />
It should be noted that even when the cocaine treatment<br />
admissions were in decline, they did not show the same<br />
type of dramatic long-term decline that was seen in the<br />
other indicators. In the first half of 2004, cocaine admissions<br />
constituted 24 percent of all New York City’s<br />
34,676 drug and alcohol treatment admissions (excluding<br />
alcohol-only).<br />
Exhibit 2 shows demographic characteristics of cocaine<br />
treatment admissions for the first half of 2004 by the<br />
two primary modes of use: smoking crack (representing<br />
61 percent of cocaine admissions) and using cocaine<br />
Proceedings of the Community Epidemiology Work Group, Vol. II, January 2005
intranasally (representing 36 percent). Those who<br />
smoke crack are more likely than intranasal users to be<br />
female (37 vs. 25 percent), Black (68 vs. 43 percent),<br />
readmissions to treatment (81 vs. 70 percent), and without<br />
income (34 vs. 26 percent), although for both<br />
groups, there were fewer clients with no source of income<br />
than in the previous reporting period. Those using<br />
intranasally are more likely to be Hispanic or White<br />
and to have some criminal justice status. The two<br />
groups are similar in secondary drugs of abuse, primarily<br />
alcohol and marijuana. It should be noted that all<br />
admissions for primary cocaine abuse represent an aging<br />
population, and those smoking crack tend to be<br />
older than those using cocaine intranasally.<br />
ADAM urinalysis data for 2003 showed different patterns<br />
for males and females. Findings show cocaine<br />
positives for 35.7 percent of males and 50.0 percent of<br />
females. More female arrestees tested positive for cocaine<br />
than for any other drug. For males, there were<br />
more positives for cocaine than for opiates, but fewer<br />
than for marijuana. Moreover, the percentage of cocaine<br />
positives for males was considerably lower than<br />
in recent years.<br />
Another data source, the DEA’s National Forensic<br />
Laboratory Information System, showed that of the<br />
64,878 items reported for New York City in 2003,<br />
36,807 (57 percent) were cocaine.<br />
According to the Street Studies Unit, cocaine hydrochloride<br />
(HCL) buying and use continues at a stable pace.<br />
Although cocaine has traditionally been sold from indoor<br />
locations, field observers report that there are a substantial<br />
number of street sellers offering powder cocaine in<br />
various parts of New York City. Cocaine prices can fluctuate,<br />
as sellers vary the purity of the product and offer<br />
several different size packages. Typically, cocaine is<br />
sold in $20, $30, and $50 packages. The most common<br />
price on the street is the $20 packet, which contains approximately<br />
0.25 ounces of cocaine powder. While most<br />
users interviewed reported that the quality of the cocaine<br />
currently available remains high, they also indicated that<br />
a number of sellers are attempting to extend their product<br />
by adulterating it with manitol, baking soda, or<br />
Diamond Crystal salt.<br />
Two methods have traditionally been used in the packaging<br />
of cocaine—plastic bags and aluminum foil.<br />
Many users prefer the malleability of aluminum, but<br />
dislike the fact that the cocaine can “cook-up” (melt) in<br />
the foil from simple body heat, which may happen in<br />
the club setting. The use of brand names in association<br />
with the sale of cocaine is becoming increasingly rare,<br />
since brand names may attract attention from law enforcement<br />
and may be easily duplicated by competitors.<br />
<strong>EPIDEMIOLOGIC</strong> TRENDS IN <strong>DRUG</strong> <strong>ABUSE</strong>—New York City<br />
According to the DEA, the majority of the cocaine in<br />
New York City is supplied by Colombians. Dominican<br />
drug gangs continue to dominate the distribution of<br />
cocaine in New York City. Many cocaine sellers appear<br />
to be part of an extended organization composed of<br />
family, blood relatives, and enduring friendship ties. At<br />
the street level, most sellers are of the same ethnic identity<br />
as the largest ethnic group in the community. Most<br />
street sellers abuse the very drug they sell. Cocaine HCl<br />
sellers appear to have a relatively less severe addiction<br />
problem than crack sellers. If their habit becomes<br />
worse, though, they may be relegated to selling crack<br />
on the street.<br />
There are three basic methods used to sell cocaine HCl.<br />
Many sellers prefer the delivery method, in which the<br />
buyer contacts the seller (via beeper, cell phone, or<br />
Internet) and places an order and a delivery is arranged.<br />
The seller does not enter the buyer’s building. Rather,<br />
the seller and buyer meet on the street and the seller<br />
typically charges $10 extra for the delivery. In the second<br />
method, sellers work out of their own apartments.<br />
Compared to crack sellers, cocaine sellers have a<br />
smaller, more disciplined set of clients, which enables<br />
sellers to manage access by requiring buyers to make<br />
appointments that are appropriately spaced to obscure<br />
traffic in and out of the apartment. The third method is<br />
selling cocaine on the street. These sellers deal solely<br />
with the “personal use” buyer who may want to buy<br />
$10 or $20 amounts of cocaine. Individuals who are<br />
interested in buying larger quantities have to use an<br />
indoor connection, who is better able to tailor an ideal<br />
product/price package. The selling of cocaine on the<br />
street for personal use is typically found in black and<br />
Hispanic low-income communities. Normally, individuals<br />
selling cocaine do not sell other drugs. In the<br />
Bronx, a field researcher recently was informed that a<br />
local bodega was selling cocaine laced with phencyclidine<br />
(PCP). According to the report, this combination<br />
can be snorted or smoked in a cigarette or with marijuana.<br />
This combination is unusual, and the SSU is<br />
continuing to investigate.<br />
The majority of the cocaine HCl street buyers are Hispanic<br />
and Black. Compared to heroin and crack,<br />
however, cocaine also has the largest number of White<br />
street buyers. Cocaine users as a whole tend to have a<br />
higher social-economic status (SES). This is probably<br />
the result of cocaine’s popularity among young, whitecollar<br />
professionals. According to field observations,<br />
cocaine users appear to be almost evenly split in terms<br />
of gender, but the majority of the individuals actually<br />
making the buys continue to be males. Cocaine users<br />
appear to be younger on average than either heroin or<br />
crack users.<br />
Proceedings of the Community Epidemiology Work Group, Vol. II, January 2005 165
According to street interviews, most cocaine HCl users<br />
report that they “only” snort the drug. Most users report<br />
that they use cocaine solely for recreational purposes;<br />
typically in group settings; at special events, such as<br />
parties or at clubs; and only on weekends.<br />
Crack users report that crack cocaine continues to be<br />
highly available; however, due to police pressure, street<br />
sellers and low-level dealers are experiencing an extremely<br />
difficult and precarious period. As a result,<br />
sales activity near many crack locations appears to be<br />
down. The quality of street crack remains stable. According<br />
to users, the quality of crack is good, and the<br />
amount provided seems satisfactory, but there are some<br />
complaints about the current selling atmosphere. Buyers<br />
have to contend with constant police harassment<br />
and potential arrest.<br />
Field researchers report that street-level crack in New<br />
York City continues to be sold in $5 and $10 packages.<br />
The most common price/package combination is the<br />
$10 packet. Two years ago, there was a substantial decline<br />
in the number of selling locations offering crack<br />
in $5 amounts. During that period, there was an attempt<br />
to make the $20 (2-milligram) package the industry<br />
standard. The larger package would have reduced the<br />
number of total sales for a seller in a day and would<br />
have limited his exposure to arrest.<br />
Today, many crack locations are experiencing a substantial<br />
decline in buyers and sales. Some sellers are<br />
complaining about the frequency of having to sell<br />
“shorts” (below-price sales). Although the $10 amount<br />
continues to be the dominant price and package size<br />
around the city, some sellers have revived the $5 package<br />
in an attempt to stimulate sales and avoid shorts.<br />
Most street sellers buy their supply in grams. The price<br />
of a gram varies from $24 to $40. If the street seller<br />
gets his supply from a low-level dealer, he may pay as<br />
much as $40 dollars for a gram. When this individual<br />
attempts to sell his product on the street, his profit margin<br />
will be relatively small. These low-level dealers sell<br />
at a higher price, and their product is more likely to be<br />
adulterated.<br />
If the street seller makes contact with a higher level<br />
dealer and is able to purchase an eighth of a key, he is<br />
likely to obtain a near pure product at or near $24 per<br />
gram. The price for a gram will range from $26 to $30.<br />
These dealers usually have three levels of quality of<br />
cocaine for sale (bad, good, and pure). The final price<br />
and the quality of the product will depend on the relationship<br />
between the dealer and buyer and the buyer’s<br />
knowledge and experience. Interestingly, the $30 per<br />
gram price is usually more profitable, because the<br />
product is of a higher level of purity. As a result, there<br />
166<br />
<strong>EPIDEMIOLOGIC</strong> TRENDS IN <strong>DRUG</strong> <strong>ABUSE</strong>—New York City<br />
is less weight lost in the cocaine to crack conversion.<br />
The lower priced products ($26 or $27) usually have<br />
been adulterated to some degree, and the street seller is<br />
going to lose a greater proportion of the original weight<br />
of the cocaine when it is converted (cooked) into crack.<br />
Another factor related to profit is the street seller’s ability<br />
as a “cook” in the preparation of crack. Some sellers<br />
maintain that a good cook, with a near pure product,<br />
can convert $1,000 worth of cocaine into $2,000 or<br />
even $2,500 worth of crack.<br />
There are three basic packaging methods associated<br />
with crack in New York City. They are thumbnail-size<br />
plastic bags, plastic vials, and glassine bags. Of these,<br />
the thumbnail-size bag continues to be the most popular<br />
packaging method. Vials and glassine bags are experiencing<br />
a steady decline as packaging methods.<br />
In Harlem, street sellers are selling crack rocks unpackaged.<br />
It is not clear whether this is being done to save<br />
the expense of having the crack packaged, as the result<br />
of some difficulty obtaining packing material, or as a<br />
strategy intended to hamper police efforts, since unpacked<br />
crack may be easier to hide or throw away.<br />
What typically serves as a brand name in the selling of<br />
crack on the street is the color of the package or top—<br />
(“blue bag” or “green tops,” etc.). However, the use of<br />
brand names, in general, is becoming increasingly rare.<br />
Currently, most of the street crack sellers are smalltime<br />
independent entrepreneurs or small, limited partnerships<br />
of two or three individuals. According to some<br />
street sellers, money is tight and crack is not as profitable<br />
as it once was. A crack street seller was<br />
complaining to a street observer that he was putting in<br />
more hours, and that last month he had trouble paying<br />
the rent. At one point, a seller could establish credit<br />
with a dealer and be “fronted” a gram of cocaine. Today,<br />
no one is giving credit, and all transactions are<br />
cash up front. The only form of credit that is still available<br />
on the street involves low-level crack dealers. The<br />
dealer may give a street seller a supply of 15 packets of<br />
crack (worth $150 on street). The stipulation is that the<br />
seller must return $120 to the dealer before he can obtain<br />
a new supply of crack. (Two years ago, the same<br />
arrangement would only have required that the seller<br />
return $100 to the dealer.) Most sellers avoid this arrangement,<br />
because the profit margin is so small and<br />
the arrangement is potentially dangerous. In these arrangements,<br />
the dealer expects his money, regardless of<br />
arrest, lost, “shorts,” paying below price, or rip-offs.<br />
The seller who fails to pay back the dealer chances serious<br />
injury or death.<br />
According to street contacts, the middle-level dealers<br />
are predominantly Dominican and operate from the<br />
Proceedings of the Community Epidemiology Work Group, Vol. II, January 2005
Washington Heights area of Manhattan. Street crack<br />
sellers are typically male and Black or Hispanic. Although<br />
street sellers often reflect the racial composition<br />
of the community, there appear to be more Hispanic<br />
street sellers than Black street sellers. In the upper west<br />
side, however, there has been a recent shift in the ethnic<br />
composition of street sellers. The growing majority of<br />
the street sellers in this area are young (16–27 years<br />
old) Black males. The diminishing number of Dominican<br />
street sellers seems to be related directly to pressure<br />
from law enforcement. Many of the old-time Hispanic<br />
sellers have been arrested, have retired, or have<br />
switched to selling marijuana, which they perceive to<br />
be less dangerous.<br />
Large open-air markets no longer exist. Their disappearance<br />
is attributed to police efforts aimed at the<br />
suppression of street-selling operations. Selling crack<br />
from indoor locations has proven to be impractical as<br />
well. The impulsive nature of crack users and their constant<br />
in-and-out traffic from an indoor selling location<br />
(e.g., an apartment) serves to quickly generate complaints<br />
from neighbors, elicit unwanted police attention,<br />
and eventually lead to either an eviction or arrest. Due<br />
to current police tactics, crack sellers are also unable to<br />
work from lobbies, vestibules, or hallways of buildings.<br />
If a seller or buyer is caught in a building and is unable<br />
to prove that he has a legitimate reason for being there,<br />
he will be arrested and receive a 5-day jail sentence.<br />
The trespassing sentence will increase by 5 days for<br />
each subsequent trespassing charge. As a result, many<br />
crack sellers remain on the street. Operating in the open<br />
is also becoming more difficult, because the police are<br />
employing special surveillance camera setups to monitor<br />
heavy selling locations, particularly those in or<br />
around housing projects. These cameras are suspended<br />
from buildings and street lights. Initially, the police<br />
target the buyers, who are allowed to leave the immediate<br />
area before they are picked-up, searched, and<br />
arrested. After a number of buyers are arrested, the police<br />
will then arrest the seller. One of the biggest<br />
complaints crack sellers have is that, “Today everyone<br />
(buyer) is a snitch.” To counteract police camera surveillance,<br />
sellers and buyers are using dark, oversize<br />
clothing, hoods, and hats to prevent identification.<br />
Fearing arrest, sellers do not carry more than 2 milligrams<br />
of crack at any time. A larger amount would<br />
automatically bump-up a simple possession charge to<br />
felony possession with intent to sell. After a buy, a<br />
crack user may hide his drugs between the cheeks of<br />
his buttocks. Many buyers believe that a quick patting<br />
down by the police is likely to miss something hidden<br />
there and that a more thorough body search requires a<br />
warrant. The heavy surveillance has also created opportunities<br />
for the brave and desperate. For example, some<br />
crack users utilize intermediary buyers to purchase their<br />
drug supplies. Those using intermediaries are individu-<br />
<strong>EPIDEMIOLOGIC</strong> TRENDS IN <strong>DRUG</strong> <strong>ABUSE</strong>—New York City<br />
als who might normally stand out (e.g., White), feel<br />
vulnerable (e.g., female, older person), or have sensitive<br />
jobs (e.g., teacher). The intermediary charges the<br />
client $10 to obtain and deliver five packets of crack<br />
(street value $50). To ensure repeated visits from the<br />
intermediary, the seller provides the five packets at<br />
$40. The intermediary makes a net profit of $20. In<br />
addition, the more unscrupulous intermediaries will<br />
occasionally substitute a packet of fake crack for one of<br />
the real packets.<br />
Most crack buyers on the street are Black or Hispanic<br />
males. According to some street contacts, the majority<br />
of the crack users are females. Originally, crack had a<br />
strong appeal among young adults (mean age of 20),<br />
but it appears that crack users are getting older. Field<br />
researchers report that most buyers appear to be in their<br />
thirties. They estimate the mean age of crack users to<br />
be about 35. They report few very young users (below<br />
21); most buyers appear to be veteran users.<br />
Many female crack users supported themselves through<br />
prostitution. It was not uncommon to see hordes of females<br />
trying to sell themselves. Street observations<br />
indicate that this phenomenon has been greatly reduced<br />
because of police intervention.<br />
Every crack user interviewed reports smoking crack,<br />
typically using a glass stem. The stem pipe is an important<br />
artifact for a crack user. The Pyrex pipe can last<br />
several months, as long as it is not dropped. Crack users<br />
report that there is a shortage of genuine Pyrex crack<br />
pipes. What is currently available at some bodegas and<br />
smoke shops are the plain glass look-a-likes, often sold<br />
with a miniature paper flower inside. These fakes are<br />
known on the street as “mouth pieces.” (A mouth piece<br />
is an extension of a larger pipe that conducts the smoke<br />
from the bowl to the mouth; since this part is not directly<br />
exposed to the flame, it does not have to be heat resistant.)<br />
Many crack users are upset because these look-alike<br />
stems usually have a 1-day lifespan. Replacing the<br />
fake pipes can be expensive. The mouth pieces originally<br />
sold for $1. At some locations, these fake pipes sell for<br />
as much as $3. At the higher price, the store may provide<br />
free screens or a liter. (From a manufacturing perceptive,<br />
it is the ideal product; the item is cheap to produce, has a<br />
short lifespan, and requires repeated replacement.)<br />
Stores that carry the fake pipes usually do not openly<br />
display them, and most shopkeepers will not sell one to a<br />
stranger. The buyer needs to refer to the stem as a<br />
“Demo” or ask for a “red” or “green,” referring to the<br />
color of the flower, in order to let the storekeeper know<br />
that he or she wants to buy a stem.<br />
The DEA reports that prices for cocaine powder for<br />
July to December 2003 were $22,000–$26,000 per<br />
kilogram and $800–$1,600 per ounce. The DEA reports<br />
Proceedings of the Community Epidemiology Work Group, Vol. II, January 2005 167
that crack sells for about $28,000–$30,000 per kilogram,<br />
$800–$1,600 per ounce, $27–$45 per gram, and<br />
$7–$10 per rock.<br />
DAWN figures for cocaine-involved deaths, which declined<br />
steadily from 1995 to 1999, showed a 26-percent<br />
increase in 2000 (to 492 from 394 in 1999) (exhibit 1).<br />
For the cocaine drug-related deaths in 2000, 40 percent<br />
involved one drug, 36 percent involved two drugs, 16<br />
percent involved three drugs, and 8 percent involved<br />
four or more drugs. No DAWN mortality data were<br />
available for 2001, but in 2002, there were 421 deaths,<br />
more than for any other drug in New York City DAWN<br />
data.<br />
The NYPD reports a decline in cocaine arrests since<br />
1995 (n=40,846) (exhibit 1). The number of cocaine<br />
arrests in 2002 was 13,574, a 67-percent decrease since<br />
1995. Of the cocaine arrests in 2002, 79 percent involved<br />
crack.<br />
Another important indirect indicator of cocaine involvement<br />
is the number of births in New York City to<br />
women who admit using cocaine during pregnancy.<br />
This not only indicates use among women, but it underscores<br />
a serious aspect of the cocaine problem. For<br />
several years, the number of women using cocaine during<br />
pregnancy increased. In 1989, the number of births<br />
to women who used cocaine peaked at 3,168. After<br />
1989, the number steadily declined to 354 in 2003—an<br />
89-percent decline over 14 years (exhibit 1). It should<br />
be noted, however, that the change between 2002 and<br />
2003, 2 percent, is the smallest decline in recent years.<br />
Heroin<br />
Heroin indicators generally increased during this reporting<br />
period (exhibit 3). The number of heroin ED<br />
mentions in the New York metropolitan area remained<br />
relatively stable between 1995 (n=10,706) and 2002<br />
(10,397). The New York metropolitan area recorded a<br />
rate of 123 heroin mentions per 100,000 population for<br />
2002, almost the same as the rate for 2001 (127). The<br />
estimated national rate was 36 heroin mentions per<br />
100,000 population.<br />
Primary heroin admissions to treatment programs in<br />
New York City gradually increased between 1995 and<br />
2003, from 18,287 to 23,563, a 23-percent increase<br />
(exhibit 3). In the first half of 2004, primary heroin<br />
admissions remained at the same level as in the previous<br />
year, 11,878, and constituted 34 percent of New<br />
York City’s 34,676 drug and alcohol treatment admissions<br />
(excluding alcohol-only).<br />
Intranasal heroin use may have peaked in the second<br />
half of 1998, with 62 percent of heroin admissions to<br />
168<br />
<strong>EPIDEMIOLOGIC</strong> TRENDS IN <strong>DRUG</strong> <strong>ABUSE</strong>—New York City<br />
all New York City drug treatment programs reporting<br />
this as their primary route of administration. Since then,<br />
the proportions reporting intranasal use declined<br />
slightly, to 60 percent in 1999 through 2002, 59 percent<br />
in 2003, and 61 percent in the first half of 2004.<br />
Meanwhile, heroin injection increased among heroin<br />
admissions, from 32 percent in the second half of 1998<br />
to 37 percent in 2003, and 36 percent in the first half of<br />
2004.<br />
Exhibit 4 highlights general demographic characteristics<br />
of heroin abusers admitted to all New York City<br />
treatment programs in the first half of 2004 by mode of<br />
use. In general, primary heroin admissions were overwhelmingly<br />
male (75 percent), older than 35 (71<br />
percent), more likely to be Hispanic (53 percent) than<br />
Black (26 percent) or White (18 percent), usually readmissions<br />
to treatment (88 percent), and likely to<br />
report cocaine as a secondary drug of abuse (38 percent).<br />
Compared with heroin injectors, intranasal users<br />
were more likely to be Black (32 vs. 16 percent) and<br />
have some criminal justice status (36 vs. 26 percent). In<br />
contrast, primary heroin injectors were more likely than<br />
intranasal users to be White (30 vs. 11 percent), to report<br />
cocaine as a secondary drug of abuse (45 vs. 35<br />
percent), and to have started use before reaching age 20<br />
(56 vs. 41 percent).<br />
In addition to heroin admissions to traditional treatment<br />
programs, heroin admissions for detoxification or crisis<br />
services in New York City have become sizable in<br />
number. These special services are usually short term,<br />
provided in a hospital or community-based setting, and<br />
medically supervised. In 1995, 4,503 such admissions<br />
were reported for heroin abuse; by 2003 that figure<br />
increased to 16,058, essentially the same as in 2002<br />
(16,083). In the first half of 2004, the number of admissions<br />
to crisis services for heroin was 8,350.<br />
DAWN medical examiner (ME) figures for heroininvolved<br />
deaths in the New York City metropolitan<br />
area show a pattern of steady increases since 1999 (exhibit<br />
3). In 1999, there were 174 such deaths, and in<br />
2000, there were 194 heroin-involved deaths. No<br />
DAWN mortality data were available for 2001, but in<br />
2002, there were 224 heroin-involved deaths.<br />
ADAM urinalysis data show fewer adult arrestees testing<br />
positive for opiates than for marijuana or cocaine.<br />
In 2003, 23.3 percent of females tested opiate-positive,<br />
as did 15.0 percent of males. The percentage for New<br />
York City females was the highest for the 10 CEWG<br />
areas where adult females were tested in 2003.<br />
NFLIS data show that 14 percent of the cases for New<br />
York City in 2004 (9,071) were related to heroin.<br />
Proceedings of the Community Epidemiology Work Group, Vol. II, January 2005
From 1992 to 2000, the DMP found average heroin<br />
purities to be generally above 60 percent. Findings for<br />
2003, however, show an average purity of 53.5 percent,<br />
down from 61.4 percent in 2002. The associated price<br />
is $0.48 per milligram pure, an increase from $0.36 per<br />
milligram pure in 2002. According to the DEA, kilogram<br />
prices for January to June 2004 were $60,000–<br />
$70,000 for South American heroin and $60,000–<br />
$90,000 for Southwest Asian heroin.<br />
According to the SSU field staff, heroin in New York<br />
City continues to be highly available and accessible.<br />
However, street observers indicate that during the year,<br />
there were brief periods of sporadic shortages of heroin.<br />
Street sources reported some dealers from New York<br />
City were traveling to Newark, New Jersey, for their<br />
heroin. The DEA Drug Monitoring Program lists Newark<br />
as having the highest purity levels in their recent<br />
sampling.<br />
In general, heroin sellers tend to be less overt and less<br />
aggressive than their crack-selling counterparts. The<br />
selling of heroin in half-grams or larger amounts continues<br />
to be an indoor activity. Heroin for personal use,<br />
(i.e., the $10 bag) is primarily relegated to the street<br />
seller, who is better able to tolerate the greater pedestrian<br />
traffic. Street heroin is sold by independent sellers or<br />
small crews (2–4 individuals). The areas of the city in<br />
which heroin is most readily available are primarily lowincome<br />
Hispanic and Black communities. Many heroin<br />
users maintain that in Manhattan, the South Bronx, and<br />
Brooklyn, they are never more than five or six blocks<br />
away from a heroin connection. Although the use (i.e.,<br />
injecting or sniffing) of heroin is not a common public<br />
spectacle, field observers have reported a slight increase<br />
in the number of people seen nodding in public. This<br />
symptom is typically the result of a drug abuser combining<br />
heroin and pharmaceuticals, such as Xanax.<br />
The source of most of the heroin sold and used in New<br />
York City is South America. According to the DEA,<br />
Colombians are the principal importers and smugglers.<br />
Street sources indicate that the high and middle level<br />
distribution of heroin in New York City is done by Dominican<br />
drug gangs. The majority of the low-level<br />
distributors and street sellers in some sections of New<br />
York continue to be Hispanics and in other sections,<br />
Blacks.<br />
Several street sources indicate that Dominicans are<br />
starting to pull out of the low-level heroin dealing and<br />
street sales. In many instances, they are being replaced<br />
by Blacks or Mexicans. Recently, Mexican immigrants<br />
have been attempting to get a foothold in the street distribution<br />
of heroin. This phenomenon began in Queens<br />
and has spread to other parts of the city, as the Mexican<br />
population has grown and spread across the city. Ac-<br />
<strong>EPIDEMIOLOGIC</strong> TRENDS IN <strong>DRUG</strong> <strong>ABUSE</strong>—New York City<br />
cording to some informants, the Mexican heroin street<br />
sellers are working directly or indirectly for Dominican<br />
mid-level distributors, and, as time goes on, Mexican<br />
sellers may seek to establish their own direct importation<br />
connection.<br />
According to various street contacts, the most common<br />
form of heroin in the city appears to be associated with<br />
Colombian drug gangs. In general, quality throughout<br />
the city is reported to be good to very good for snorting.<br />
One exception is midtown Manhattan, where poor<br />
quality heroin, brownish in color and often sold under<br />
the brand name “the Cure” (the packet is stamped with<br />
a decal of a hypodermic), has appeared.<br />
Individuals from out-of-town continue to come into the<br />
city to take advantage of the better quality heroin. Once<br />
in their hometown, they often sell part of their drug<br />
supply at a higher price in order to defer the cost of<br />
their own habit. Recently, the DEA reported that Newark,<br />
New Jersey, has the highest heroin purity in the<br />
metropolitan area and that some New Yorker heroin<br />
users are traveling to Newark to purchase heroin.<br />
Heroin demonstrates far less price variation than other<br />
drugs sold on the streets of New York, and over the last<br />
6 months, heroin prices have been described as stable.<br />
The street seller usually sells one-sized packets. The<br />
predominant price for street-bought heroin is $10 per<br />
packet, and each packet contains approximately 0.10<br />
milligrams of powder. Recently, the $5 (0.5-milligram)<br />
bag appeared to be undergoing a limited resurgence.<br />
Last year, $5 bags were only found in North Manhattan,<br />
but now $5 bags are also being reported in other<br />
parts of the city as well. This appears to be an attempt<br />
to make the price of heroin more affordable, and it may<br />
be a consequence of increased competition among<br />
street sellers. There are some local sellers who are selling<br />
their product at slightly higher prices. For example,<br />
a street seller operating in Downtown Brooklyn sold his<br />
product for $13, claiming that his higher price reflected<br />
the better quality of his product. Out-of-town users/sellers<br />
usually resell part of their supply of $10<br />
packets for $15 in their home-town.<br />
The glassine bag is by far the most popular heroin<br />
packaging method. Observers report a continued decline<br />
in the use of the thumbnail-size bags and aluminum<br />
foil as packaging methods for heroin.<br />
At one point, the use of brand names was losing favor.<br />
Although most sellers do not use brand names, the use<br />
of brand names has recently experienced a resurgence.<br />
This new trend is probably a consequence of competition<br />
and a need to differentiate one’s product from a<br />
host of others selling essentially the same product. The<br />
following brand names are popular—Cross Over,<br />
Proceedings of the Community Epidemiology Work Group, Vol. II, January 2005 169
Benloton, X-man, 911, Lean Back, Set Back, The Cure,<br />
Tuna, First Class, Tyson, and Purple Passion. In some<br />
locations, instead of using a brand name, the seller<br />
wears a distinctive article of clothing (e.g., red, white,<br />
and blue cap) or some other prop (bicycle) to distinguish<br />
himself from other sellers.<br />
The majority of the individuals buying heroin on the<br />
street are chronic users; they are usually male, Black<br />
and/or Hispanic, and tend to be between 35 and 50<br />
years old. Street observers, nevertheless, have seen<br />
buyers in their twenties frequenting heroin selling locations.<br />
These individuals have a robust appearance not<br />
normally associated with chronic users. These observations<br />
suggest that heroin continues to attract new users.<br />
Chronic heroin users tend to demonstrate more social<br />
interdependence and stronger emotional bonds with<br />
“running buddies” than other drug users. By contrast,<br />
the crack user seems to be the most independent and<br />
least trusting. Most heroin buyers claim that they only<br />
snort and do not inject heroin. This suggests that the<br />
heroin on the street continues to have a relatively high<br />
purity level in New York City. However, observations<br />
at needle exchange programs would suggest that at<br />
least some individuals continue to inject heroin.<br />
According to some street sources, heroin dealers are<br />
using sleep medication to cut heroin. Some street contacts<br />
report that dealers are also using 80-milligram<br />
OxyContin tablets as an adulterant for heroin. As a rule,<br />
street heroin sellers offer only one drug, heroin, and in<br />
only one size packet (e.g., $10 bag). Street observers<br />
report, however, that in some sections of the city, heroin<br />
street sellers are also selling crack. According to<br />
one street contact, this is temporary, and it is attributed<br />
to a slowdown in heroin sales. Researchers also report<br />
that some dealers in Harlem who cater to individuals<br />
that “speedball” (take heroin and cocaine simultaneously)<br />
sell eight-balls of heroin and cocaine. These<br />
sales are usually not conducted on the street; instead,<br />
such transactions occur indoors.<br />
Much like cocaine arrests, heroin arrests reached a high<br />
of 28,083 in 1989, declined for a few years, and then<br />
peaked in 1995 (n=38,131) (exhibit 3). Heroin arrests<br />
decreased from 33,665 in 2000 to 27,863 in 2001, but<br />
they increased again in 2002 to 34,098, an increase of<br />
22 percent in the year.<br />
Other Opiates/Narcotics<br />
Although the numbers are small, ED mentions of hydrocodone/combinations<br />
and oxycodone/combinations<br />
have shown increases. According to DAWN data, hydrocodone/combinations<br />
ED mentions increased from<br />
34 in 1995 to 88 in 2002, an increase of 159 percent.<br />
Between 2001 and 2002, however, the number of men-<br />
170<br />
<strong>EPIDEMIOLOGIC</strong> TRENDS IN <strong>DRUG</strong> <strong>ABUSE</strong>—New York City<br />
tions went from 98 to 88. Oxycodone/combinations ED<br />
mentions also showed a tremendous increase, from 56<br />
in 2000 to 135 in 2002, an increase of 141 percent. In<br />
addition, between 1995 and 2002, oxycodone mentions<br />
increased 297 percent (from 34 to 135). Methadone<br />
mentions remained stable, with 1,304 ED mentions in<br />
2002 and 1,237 in 2001.<br />
Although street researchers have not observed people<br />
hawking OxyContin, they have encountered a number<br />
of street buyers asking for OxyContin and claiming that<br />
the tablets are selling for $10 per pill. OxyContin tablets<br />
are sometimes said to be crushed and snorted.<br />
Among ME deaths reported by DAWN, the category of<br />
narcotic analgesics, which includes all legal and illegal<br />
narcotic analgesics and combinations (excluding heroin/morphine),<br />
showed a large increase in New York<br />
City from 252 in 1998 and 271 in 1999 to 590 in 2000.<br />
It should be noted, however, that in 1996 there were<br />
511 such deaths. In 2002, the total increased to 641.<br />
(No DAWN mortality data were available for New<br />
York City for 2001.) For specific narcotic-type drugs in<br />
DAWN ME reports, methadone accounted for 169<br />
deaths in the New York metropolitan area.<br />
According to the SSU, OxyContin sold for $10 for an<br />
80-milligram tablet.<br />
Marijuana<br />
In New York City, marijuana indicators, which had<br />
recently increased steadily and dramatically, appear to<br />
be stabilizing (exhibit 5). The total number of marijuana<br />
ED mentions increased insignificantly from 2,974<br />
in 1995 to 3,924 in 2002. The rate of marijuana ED<br />
mentions in 2002 for the New York City metropolitan<br />
area was 47 per 100,000 population, the highest rate in<br />
recent years. It equaled the national estimate of 47 per<br />
100,000 population for that year.<br />
Primary marijuana admissions to all treatment programs<br />
had been increasing steadily over the past<br />
several years. The number increased more than ninefold<br />
between 1991 and 2002, from 1,374 to 14,310, the<br />
highest annual number (exhibit 5). Although the number<br />
fell to 13,471 in 2003, that is still the second<br />
highest yearly total for primary marijuana admissions.<br />
In the first half of 2004, that number remained stable at<br />
6,746. In 1991, primary marijuana admissions represented<br />
less than 5 percent of all treatment admissions;<br />
by the first half of 2004, these admissions represented<br />
20 percent of admissions (excluding alcohol-only) to all<br />
New York City treatment programs.<br />
Exhibit 6 shows demographic characteristics of primary<br />
marijuana admissions to all New York City treatment<br />
Proceedings of the Community Epidemiology Work Group, Vol. II, January 2005
programs in the first half of 2004. The vast majority<br />
were male (78 percent), and 30 percent were younger<br />
than 21. More than one-half (56 percent) were Black,<br />
about one-third (32 percent) were Hispanic, and 9 percent<br />
were White. Alcohol was the secondary drug of<br />
abuse for 38 percent of the marijuana admissions, and<br />
almost two-thirds had some criminal justice status (64<br />
percent).<br />
Marijuana is the most abused illicit substance in New<br />
York City. According to street contacts, marijuana continues<br />
to be readily available. There are a variety of<br />
forms of marijuana that are currently available in New<br />
York City, including Purple Haze, Hydro, and Chocolate.<br />
Of these, Purple Haze seems to be the most<br />
popular or most readily available.<br />
Street contacts also report that most of the marijuana<br />
that is currently available in New York City is considered<br />
“good” to “very good” in quality. The generally<br />
good quality of the marijuana tends to attract out-oftown<br />
buyers/users. A young Hispanic female from New<br />
Jersey indicated that she and her friends regularly pool<br />
some money together and come into the Washington<br />
Heights area or nearby South Bronx to buy 5–8 $20<br />
bags of marijuana.<br />
Street-level marijuana is sold in $10 and $20 amounts,<br />
although the $10 package seems to be on a decline.<br />
Although individuals can buy multiple $20 packets, an<br />
individual desiring larger quantities at a discount must<br />
go through a house-connection, which requires an introduction<br />
from a regular, “trusted” buyer.<br />
According to the SSU, in the Bronx, an ounce of chocolate<br />
marijuana sells for $250–$300. Purple Haze and<br />
Hydro are slightly more expensive, selling for $325–<br />
$400 per ounce. In Manhattan, Purple Haze and Hydro<br />
are more expensive and sell for about $450–$480 an<br />
ounce. A pound of Purple Haze or Hydro can cost<br />
about $6,000.<br />
The most commonly used packaging method for the<br />
sale of marijuana in New York City is the plastic bag.<br />
The thumbnail size sells for $10. There is also a slightly<br />
larger size bag that sells for $20. Previous packaging<br />
methods, such as the manila envelope, aluminum foil,<br />
and glassine bags, are no longer commonly used because<br />
customers are unable to see the product clearly<br />
through the package. A recent marketing ploy involved<br />
the use of colorful plastic rectangular boxes with covers<br />
(size 2”x 1”x 0.75”). These boxes are called “coffins”<br />
on the street. A coffin, which contains a mixture of<br />
three types of marijuana—Hydro, Purple Haze, and<br />
Chocolate—sells for $20.<br />
<strong>EPIDEMIOLOGIC</strong> TRENDS IN <strong>DRUG</strong> <strong>ABUSE</strong>—New York City<br />
Brand names are not typically used in the marketing of<br />
marijuana on the street. Customers depend more on the<br />
type of marijuana and the face-recognition, i.e., reputation,<br />
of the seller.<br />
The majority of marijuana sellers are adolescents and<br />
young adults, typically between 16 and 30 years old.<br />
The sellers tend to reflect the ethnic makeup of their<br />
community. The majority of the street-level sellers tend<br />
to be Black or Hispanic males. In more affluent communities,<br />
however, the seller is usually White and<br />
operates from his home rather than the street. Most of<br />
the marijuana sellers are independent sellers. As a result<br />
of police pressure, a number of former crack sellers<br />
have switched to selling marijuana, which they perceive<br />
as a safer activity.<br />
Although the use of marijuana cuts across all social<br />
groups, the drug seems to be most popular among adolescents<br />
and young adults. According to street<br />
observations, the majority of marijuana buyers are Hispanic<br />
and Black. This drug, however, also has the<br />
greatest number of White buyers, who are also utilizing<br />
the same street-selling locations.<br />
Based on field observations, researchers estimate that<br />
the mean age of marijuana buyers is 23. Compared to<br />
heroin, crack, or cocaine, marijuana users probably<br />
have the highest proportion of high school and college<br />
students. According to observations by field staff, the<br />
majority of buyers are male, but researchers noted a<br />
substantial number of lone female buyers. Based on<br />
street interviews, the use of marijuana varies from the<br />
occasional weekend-only user to the chronic user. A<br />
22-year-old, working, Black female indicated that she<br />
smokes one cigar loaded with marijuana a day, each<br />
day of the week. She estimates that she spends about<br />
$120–$140 a week on marijuana. A Hispanic male,<br />
chronic smoker claims that he smokes about 10 times a<br />
day, everyday of the week. This individual is able to<br />
afford his habit because he deals marijuana. The marijuana<br />
seller said, “most people would be surprised as to<br />
how many people smoke marijuana and how often.”<br />
Currently, the most popular method of smoking marijuana<br />
involves the use of a blunt, a hollowed-out cigar,<br />
or wrapping the marijuana in cigar leaves and smoking<br />
the combined substance. One of the most popular cigars<br />
is the vanilla-favored Dutch Master cigar. According to<br />
field researchers, a number of marijuana smokers say<br />
they prefer the Dutch Master because it is smoother and<br />
burns more slowly than either the White Owl or Phillies<br />
cigars. It seems the cigar industry is extremely involved<br />
in the development of products directly catering<br />
to and encouraging young marijuana smoking (for example,<br />
grape-flavored cigars).<br />
Proceedings of the Community Epidemiology Work Group, Vol. II, January 2005 171
DAWN ME mentions for marijuana-involved deaths in<br />
the New York City metropolitan area numbered 55 in<br />
2002, which was the second highest among CEWG areas.<br />
This number represents an increase of 189 percent<br />
since 1999.<br />
Adult male arrestees in the ADAM samples for 2003<br />
were much more likely to test positive for marijuana<br />
than for any of the other drugs, including cocaine—a<br />
change from previous years. Approximately 43.1 percent<br />
of male arrestees tested positive for marijuana. Female<br />
arrestees were more likely to test positive for marijuana<br />
than for opiates, with 36.7 percent of females testing<br />
positive for marijuana.<br />
According to National Forensic Laboratory Information<br />
System data, 20 percent of the cases for New York City<br />
in 2003 (13,266) were related to cannabis.<br />
According to the DEA, marijuana prices can range from<br />
$1,000 to $2,000 per pound wholesale and from $3,000<br />
to $5,000 per pound for hydroponic marijuana.<br />
In spite of decriminalizing possession of small amounts<br />
of marijuana, the NYPD continues to make a large number<br />
of marijuana-related arrests in New York City. The<br />
number of arrests has stabilized, however (exhibit 5).<br />
Cannabis-involved arrests had reached a low of 4,762 in<br />
1991, but they increased more than 12 times in the next 9<br />
years to 60,455 in 2000. Arrests for 2002 (47,250) were<br />
at the same level as in 2001, which was the second largest<br />
yearly total. For arrests in 2002, approximately 98<br />
percent were for misdemeanors, and 32 percent involved<br />
persons age 20 or younger. Moreover, cannabis arrests<br />
accounted for 48 percent of all drug arrests in New York<br />
City in 2002, a dramatic change from earlier years and a<br />
continuation of the trend seen in the last 5 years.<br />
Stimulants<br />
Although methamphetamine is popular in other parts of<br />
the Nation, there were relatively few arrests, ED mentions,<br />
deaths, ADAM arrestee positives, or treatment<br />
admissions related to the drug in New York City. For<br />
example, in 2000, only three methamphetamine deaths<br />
were reported in the five boroughs of New York City.<br />
No adult arrestees in the 2003 ADAM sample tested<br />
positive for the drug. According to a November 2003<br />
report by the Drug Enforcement Administration, New<br />
York Field Division, “While methamphetamine trafficking<br />
and abuse are at relatively low levels in New York<br />
State and City when compared to cocaine and heroin,<br />
there are indications of increasing availability and use.”<br />
For example, while the total number of methamphetamine<br />
ED mentions in 2002 was small (63), it reflected a<br />
172<br />
<strong>EPIDEMIOLOGIC</strong> TRENDS IN <strong>DRUG</strong> <strong>ABUSE</strong>—New York City<br />
174-percent increase from 1995 (23 mentions). Similarly,<br />
although methamphetamine treatment admissions<br />
have typically represented less than 0.2 percent of all<br />
admissions to treatment in New York State, they increased<br />
from 336 statewide in 1995 to 807 in 2003.<br />
Moreover, the New York State Police reported an increase<br />
in clandestine lab incidents in the State, from 2<br />
in 1999 to 73 in 2003. Interestingly, an analysis of lab<br />
seizures and treatment admissions shows that there<br />
appears to be a strong relationship between methamphetamine<br />
treatment admissions and counties where the<br />
State Police have shut down methamphetamine labs.<br />
According to the SSU, numerous sources in the gay<br />
community are concerned that the use of this drug is<br />
spreading among young gay males who frequent clubs<br />
and that the drug facilitates the spread of HIV. A number<br />
of gay male users have reported experiencing<br />
crystal methamphetamine binges during which they<br />
have engaged in unsafe sexual activity. There are also<br />
indications that the use of methamphetamine has spread<br />
and is increasing among the “non gay” club-going<br />
crowd and college students. Methamphetamine is also<br />
known as Crystal, Tina, Christina, Crank, Ice, speed,<br />
and chalk.<br />
Depressants<br />
While some indicators of the nonmedical use of psychoactive<br />
prescription drugs (e.g., hospital<br />
emergencies, deaths, and treatment admissions) have<br />
not been increasing, the SSU continues to report a variety<br />
of drugs readily available on the street for $1 or<br />
more per pill.<br />
Alprazolam (Xanax) and clonazepam (Klonopin) ED<br />
mentions have been increasing since the mid-1990s,<br />
while diazepam (Valium) mentions have been declining.<br />
Alprazolam mentions increased 92 percent, from<br />
333 in 1995 to 638 in 2002. Clonazepam mentions increased<br />
182 percent, from 117 in 1995 to 330 in 2002.<br />
Moreover, clonazepam mentions increased 48 percent<br />
from 2000 to 2002 (from 223 to 330). Conversely, diazepam<br />
mentions decreased 58 percent, from 450 in<br />
1995 to 189 in 2002. Diazepam mentions also exhibited<br />
recent declines, falling 43 percent between 2000 and<br />
2002 and 32 percent between 2001 and 2002. Lorazepam<br />
mentions remained stable, with 143 mentions in<br />
2002. In addition to these specific benzodiazepines,<br />
mentions of benzodiazepines not otherwise specified<br />
(NOS) increased 620 percent from 73 in 1995 to 526 in<br />
2002. There continue to be few (about 1 percent) treatment<br />
admissions with a psychoactive prescription drug<br />
as a primary drug of abuse.<br />
Proceedings of the Community Epidemiology Work Group, Vol. II, January 2005
Among ME deaths reported by DAWN, benzodiazepine-involved<br />
deaths numbered 115 in 2002, a dramatic<br />
858-percent increase from the 12 reported in 1999.<br />
According to the SSU, the three most popular or commonly<br />
sold pharmaceuticals on the street in this<br />
category are Xanax, Elavil, and Catapres. Based on<br />
field observations, these pills are readily available<br />
throughout the city. Given the high number of sellers<br />
and the number of transactions observed, the use of<br />
these illicit medications is high and is not expected to<br />
decline in the near future.<br />
Since these drugs are manufactured by legitimate<br />
pharmaceutical companies, purity is not an issue. Most<br />
of these medications come in a variety of strengths, however,<br />
and not all strengths are found on the street.<br />
Observations indicate that the following pills are sold on<br />
the street: Xanax, 1-milligram ($3) and 2-milligram ($5)<br />
tablets; Elavil, 1-milligram ($1) tablets; and Catapres, 2milligram<br />
($1) and 3-milligram ($2) tablets.<br />
These medications usually come in their original package,<br />
typically bottles. The pill sellers generally obtain<br />
these drugs from pill-mill doctors, who write prescriptions<br />
indiscriminately. A visit to the doctor may cost<br />
the pill seller $100; the doctor will typically write three<br />
prescriptions. A pharmacy fills out the prescription and<br />
charges Medicaid. On the street, these pills are sold<br />
individually, and no packaging is necessary.<br />
Although brand names are not applicable in this drug<br />
category, sellers tend to use the pharmaceutical name of<br />
the product. Sellers may also use slang terms in “hawking”<br />
or marketing the availability of a given pill. These<br />
terms include “football” and “sticks” for Xanax, due to<br />
the oval or elongated shapes of the tablets.<br />
Pill street sellers and buyers appear to be a subpopulation<br />
of heroin and methadone users. The majority of the<br />
pill sellers operating near treatment facilities tend to be<br />
primarily Black or Hispanic; a substantial number of<br />
sellers and buyers are White. They are usually older<br />
(35–45 years old), and most appear to have a history of<br />
heroin abuse; some appear to currently be in treatment.<br />
Although most pill sellers are male, about one-third of<br />
the pill sellers, observed by field researchers, were female.<br />
Most pill sellers do not see themselves as drug<br />
dealers; instead, this activity is simply viewed as another<br />
“hustle,” used to generate money in order to<br />
support their drug habit.<br />
Most of the medications in this category are sold in pill<br />
form and taken orally.<br />
<strong>EPIDEMIOLOGIC</strong> TRENDS IN <strong>DRUG</strong> <strong>ABUSE</strong>—New York City<br />
Hallucinogens<br />
Overall, the number of PCP ED mentions declined insignificantly<br />
from 697 in 1995 to 341 in 2002. The<br />
number of mentions in 2001 was 203. Lysergic acid<br />
diethylamide (LSD) ED mentions declined significantly<br />
from 188 mentions in 1995 to 49 in 2002, a decrease of<br />
74 percent.<br />
In the past few years, PCP-involved deaths have averaged<br />
about 6 per year, except for 1995, when 16 such<br />
deaths were reported by DAWN. Between 1998 and<br />
1999, PCP-involved deaths increased from 2 to 11.<br />
With regard to ADAM data, 3.9 percent of male arrestees<br />
and no female arrestees in New York tested positive<br />
for PCP in 2003. The male figure was more than twice<br />
that reported for 2002 (1.6 percent).<br />
Some street sources claim that PCP is becoming more<br />
readily available in the city. Recently, one street observer<br />
was informed that a bodega in the Bronx was<br />
selling cocaine laced with PCP. PCP is available in<br />
liquid and powdered form. It is also known as angel<br />
dust, ozone, wack, and rocket fuel. A cigarette dipped<br />
in PCP costs between $5 and $20.<br />
Club Drugs<br />
Club drugs are a collection of various synthetic chemical<br />
compounds that are often abused by young people<br />
in festive social settings, such as dance clubs, afterhour<br />
clubs, “raves,” and other special events. Club<br />
drugs include methylenedioxymethamphetamine<br />
(MDMA), methamphetamine, gamma hydroxybutyrate<br />
(GHB), and ketamine. Raves and other all-night parties<br />
are about endurance and sensory overstimulation, and,<br />
not surprisingly, many of the club drugs have stimulant<br />
or hallucinogenic properties. Since many of club drugs<br />
are synthetic and manufactured, purity is not a real issue,<br />
but the quality of these products poses a serious<br />
concern. The chemical expertise of the producers, the<br />
ingredients used, and laboratory conditions used to<br />
manufacture these substances are uncertain and potentially<br />
dangerous.<br />
According to the SSU, street sources report that<br />
MDMA, a stimulant with hallucinogenic properties, is<br />
easy to obtain in many areas of the city. Given that ecstasy<br />
is beginning to be available to a limited extent in<br />
communities of color, the appeal of this drug may be<br />
expanding across racial, ethnic, and social class<br />
boundaries. MDMA is often called “ecstasy,” “XTC,”<br />
Adam, or X, although other substances are often sold as<br />
Proceedings of the Community Epidemiology Work Group, Vol. II, January 2005 173
ecstasy. MDMA ED mentions may be stabilizing. Although<br />
ED mentions totaled 24 in 1996 and 172 in<br />
2001, the number of mentions declined insignificantly<br />
to 143 in 2002. MDMA is available in tablet, capsule,<br />
and powdered form. A dose sells for about $13 wholesale<br />
and $30 retail.<br />
The number of DAWN deaths involving the category of<br />
club drugs (including MDMA, ketamine, GHB, gamma<br />
butyrolactone [GBL], and Rohypnol) totaled 19 in<br />
2002. Although this number is small, it shows a large<br />
increase from previous years: four in 1999 and five in<br />
2002.<br />
Available as a club drug in New York City, the veterinary<br />
anesthetic ketamine produces hallucinogenic<br />
effects similar to PCP and visual effects similar to LSD.<br />
On the street, the drug is called “Special K,” “K,” “Vitamin<br />
K,” and “Cat Valium,” and sells for approximately<br />
$25–$50 per dosage unit. It comes in liquid,<br />
powdered, or tablet form, and it may be administered<br />
intranasally or injected. While ketamine is not currently<br />
a controlled substance under Federal law, it is listed as<br />
a controlled substance in New York State. The number<br />
of ketamine ED mentions has remained relatively stable<br />
for the last few years, numbering 36 in 2002. It is available<br />
in club settings and has not been reported on the<br />
“street.”<br />
Another club drug of concern is GHB. GHB ED mentions<br />
in New York City remain very low. Although not<br />
generally available on the street, GHB and the analogs<br />
(GBL, BD, GHV, and GVL) can be easily obtained in<br />
many dance clubs. It is also known as liquid MDMA,<br />
“grievous bodily harm,” or “Georgia Homeboy.” It is<br />
usually available in liquid form, and in a club, GHB<br />
may cost $45–$65 for a bottle cap full. A single dose<br />
costs about $20.<br />
LSD is a strong hallucinogen that has not been a major<br />
problem in New York City since the late 1960s and<br />
early 1970s. It is also known as acid, boomer, and yellow<br />
sunshine.<br />
The club drug sellers and users have comparable demographics,<br />
since they tend to interact in special youthdriven<br />
situations. Both sellers and buyers tend to be<br />
young (early twenties or younger to thirties), White,<br />
and disproportionately male, and most are in college or<br />
associate with a college or club-going crowd.<br />
Although these drugs are part of the New York drug<br />
scene, their appeal at this point has been limited to a<br />
small minority of substance abusers. When field researchers<br />
asked their street sources with chronic<br />
histories of substance abuse about these drugs, most<br />
174<br />
<strong>EPIDEMIOLOGIC</strong> TRENDS IN <strong>DRUG</strong> <strong>ABUSE</strong>—New York City<br />
indicated that they never used these substances, and did<br />
not know anyone selling or using them.<br />
INFECTIOUS DISEASES RELATED TO <strong>DRUG</strong> <strong>ABUSE</strong><br />
The AIDS epidemic, with its impact on injection drug<br />
users (IDUs), has played a crucial role in shaping the<br />
New York City drug scene over the last two decades.<br />
HIV first entered New York City in the mid- to late-<br />
1970s. AIDS reporting was mandated in 1983, but reporting<br />
of HIV infection began in June 2000. Sixteen<br />
percent of AIDS cases nationwide have been diagnosed<br />
in New York City, and 17 percent of AIDS deaths in<br />
the United States have occurred in New York City.<br />
According to the New York City Department of Health,<br />
a cumulative total of 142,085 adult and pediatric AIDS<br />
cases were reported in New York City as of December<br />
31, 2003. Overall, reports show that 84,808 New Yorkers<br />
have died of AIDS, representing 60 percent of those<br />
who have contracted the disease.<br />
As of December 31, 2003, 88,479 New Yorkers were<br />
diagnosed with HIV or AIDS; 31,163 were living with<br />
HIV (non-AIDS), and 57,316 were living with AIDS.<br />
The true number of persons living with HIV/AIDS<br />
(PLWHA) is actually higher, since the New York City<br />
Department of Health and Mental Hygiene estimates<br />
that 25 percent of persons living with HIV have never<br />
been tested and do not know that they are infected.<br />
AIDS incidence in New York City peaked in 1993,<br />
with 12,649 cases. Mortality dropped sharply beginning<br />
in 1996, but New York City residents continue to die of<br />
HIV. In 2003, 2,394 people with HIV or AIDS died of<br />
all causes, and approximately 1,700 deaths were due to<br />
HIV/AIDS. In 2002, HIV/AIDS was the leading cause<br />
of death in New Yorkers aged 35–44 and the third leading<br />
cause in those aged 25–34.<br />
Of the 88,479 PLWHA in New York City as of December<br />
31, 2003, 65 percent were diagnosed with<br />
AIDS, and 35 percent were diagnosed with non-AIDS<br />
HIV. Sixty-nine percent were male, and 31 percent<br />
were female. In terms of race/ethnicity, 44 percent were<br />
Black, 32 percent were Hispanic, and 22 percent were<br />
White. For transmission risk factors, 27 percent<br />
(23,670) were men who have sex with men, 24 percent<br />
(21,453) had an injection drug use history, 18 percent<br />
reported a heterosexual transmission factor, 3 percent<br />
had a perinatal transmission risk factor, 1 percent had a<br />
transfusion history, and 28 percent had an unknown<br />
risk factor or were under investigation.<br />
In 2003, 4,086 New Yorkers were diagnosed with HIV;<br />
1,029 (25 percent) first learned they were HIV-positive<br />
at the time they learned they had already progressed to<br />
AIDS.<br />
Proceedings of the Community Epidemiology Work Group, Vol. II, January 2005
The New York City Department of Health and Mental<br />
Hygiene, Bureau of Communicable Diseases, also has a<br />
surveillance of hepatitis C data. As of December 2004,<br />
<strong>EPIDEMIOLOGIC</strong> TRENDS IN <strong>DRUG</strong> <strong>ABUSE</strong>—New York City<br />
there were 15,129 newly reported individuals with a<br />
diagnosis date (or specimen collection date) in 2003.<br />
For 2002, that figure was 13,940.<br />
For inquiries concerning this report, please contact Rozanne Marel, Ph.D., Chief of Epidemiology, New York State Office of Alcoholism and Substance<br />
Abuse Services, 501 7th Avenue, 9th Floor, New York, New York 10018, Phone: (646) 728-4605, Fax: (646) 728-4685, or E-mail: RozanneMarel@oasas.state.ny.us.<br />
Proceedings of the Community Epidemiology Work Group, Vol. II, January 2005 175
176<br />
<strong>EPIDEMIOLOGIC</strong> TRENDS IN <strong>DRUG</strong> <strong>ABUSE</strong>—New York City<br />
Exhibit 1. Semiannual Cocaine Trends for Selected Indicator Data in New York City: 1995–2004<br />
Year<br />
1995<br />
1996<br />
1997<br />
1998<br />
1999<br />
2000<br />
2001<br />
2002<br />
2003<br />
2004<br />
Semiannual/<br />
Annual<br />
Periods<br />
Deaths Involving<br />
Cocaine 1<br />
1H<br />
2H<br />
Total<br />
908<br />
1H<br />
2H<br />
Total<br />
659<br />
1H<br />
2H<br />
Total<br />
501<br />
1H<br />
2H<br />
Total<br />
438<br />
1H<br />
2H<br />
Total<br />
394<br />
1H<br />
2H<br />
Total<br />
492<br />
1H<br />
2H<br />
–<br />
Total<br />
1H<br />
2H<br />
Total 421<br />
1H<br />
2H<br />
Total<br />
1H<br />
2H<br />
Total<br />
Cocaine ED<br />
Mentions 2<br />
9,915<br />
9,808<br />
19,715<br />
11,070<br />
10,522<br />
21,592<br />
10,233<br />
9,969<br />
20,202<br />
9,989<br />
9,560<br />
19,549<br />
7,386<br />
7,413<br />
14,799<br />
6,883<br />
7,367<br />
14,250<br />
7,449<br />
6,450<br />
13,898<br />
6,679<br />
7,282<br />
13,961<br />
Treatment<br />
Admissions:<br />
Cocaine as<br />
Primary Drug<br />
of Abuse 3<br />
8,371<br />
7,836<br />
16,207<br />
8,561<br />
8,817<br />
17,378<br />
9,048<br />
8,401<br />
17,449<br />
8,999<br />
8,573<br />
17,572<br />
8,346<br />
7,567<br />
15,913<br />
7,337<br />
6,722<br />
14,059<br />
7,343<br />
7,032<br />
14,375<br />
7,736<br />
7,872<br />
Cocaine<br />
Arrests 4<br />
40,846<br />
38,813<br />
35,431<br />
35,577<br />
31,781<br />
31,919<br />
23,498<br />
15,608 13,574<br />
8,203<br />
7,911<br />
16,114<br />
8,208<br />
Births to<br />
Women<br />
Using<br />
Cocaine 5<br />
SOURCES: 1 DAWN, OAS, SAMHSA, including New York City, Long Island, and Putnam County through 1995; starting with 1996<br />
the data include New York City only<br />
2<br />
DAWN, OAS, SAMHSA, weighted data, based on a representative sample of hospitals for New York City and Westchester,<br />
Rockland, and Putnam Counties<br />
3 New York State Office of Alcoholism and Substance Abuse Services (OASAS)-funded and nonfunded treatment ad<br />
missions<br />
4<br />
New York City Police Department<br />
5<br />
New York City Department of Health<br />
1,059<br />
1,005<br />
864<br />
742<br />
626<br />
490<br />
438<br />
363<br />
354<br />
Proceedings of the Community Epidemiology Work Group, Vol. II, January 2005
<strong>EPIDEMIOLOGIC</strong> TRENDS IN <strong>DRUG</strong> <strong>ABUSE</strong>—New York City<br />
Exhibit 2. Characteristics of Primary Cocaine Admissions 1 to State-Funded 2 and Nonfunded 3 Treatment<br />
Programs in New York City, by Route of Administration and Percent: First Half of 2004<br />
Demographic<br />
Characteristic<br />
Gender<br />
Male<br />
Female<br />
Age at admission<br />
25 and younger<br />
26–35<br />
36 and older<br />
(Average age)<br />
Race<br />
Black<br />
Hispanic<br />
White<br />
Percent Total<br />
(N=8,208)<br />
68<br />
32<br />
6<br />
23<br />
71<br />
(39.3 years)<br />
58<br />
26<br />
14<br />
Percent Smoking<br />
Crack<br />
(n=4,997)<br />
Percent Using<br />
Cocaine Intranasally<br />
(n=2,914)<br />
Proceedings of the Community Epidemiology Work Group, Vol. II, January 2005 177<br />
63<br />
37<br />
4<br />
20<br />
76<br />
(40.0 years)<br />
68<br />
19<br />
11<br />
75<br />
25<br />
10<br />
27<br />
63<br />
(38.2 years)<br />
No Source of Income 4 31 34 26<br />
Some Criminal Justice Status 42 38 48<br />
Readmissions 77 81 70<br />
Age of First Use<br />
14 and younger<br />
15–19<br />
20–29<br />
30 and older<br />
Secondary Drug of Abuse<br />
Alcohol<br />
Marijuana<br />
Heroin<br />
6<br />
29<br />
43<br />
23<br />
40<br />
21<br />
6<br />
1<br />
Figures on this table may differ somewhat from figures cited on other tables, because computer runs may have been executed at<br />
different times and files are being updated continuously.<br />
2<br />
State-funded programs receive some or all funding through the New York State Office of Alcoholism and Substance Abuse Services<br />
(OASAS).<br />
3<br />
Nonfunded programs receive funding through sources other than OASAS.<br />
4<br />
Defined as not earning income, not receiving support from family or significant others, and not receiving any public assistance.<br />
SOURCE: New York State Office of Alcoholism and Substance Abuse Services<br />
4<br />
24<br />
46<br />
25<br />
42<br />
20<br />
6<br />
43<br />
36<br />
18<br />
8<br />
35<br />
38<br />
19<br />
38<br />
25<br />
5
178<br />
<strong>EPIDEMIOLOGIC</strong> TRENDS IN <strong>DRUG</strong> <strong>ABUSE</strong>—New York City<br />
Exhibit 3. Semiannual Heroin Trends for Selected Indicator Data in New York City: 1995–2004<br />
Year<br />
1995<br />
1996<br />
1997<br />
1998<br />
1999<br />
2000<br />
2001<br />
2002<br />
2003<br />
2004<br />
SOURCES:<br />
Semiannual/<br />
Annual<br />
Period<br />
Deaths<br />
Involving<br />
Heroin 1<br />
1H<br />
2H<br />
Total<br />
751<br />
1H<br />
2H<br />
Total<br />
192<br />
1H<br />
2H<br />
Total<br />
272<br />
1H<br />
2H<br />
Total<br />
230<br />
1H<br />
2H<br />
Total<br />
174<br />
1H<br />
2H<br />
Total 194<br />
1H<br />
2H<br />
–<br />
Total<br />
1H<br />
2H<br />
Total 224<br />
1H<br />
2H<br />
Total<br />
1H<br />
2H<br />
Total<br />
Heroin/<br />
Morphine<br />
ED Men-<br />
tions 2<br />
5,288<br />
5,440<br />
10,706<br />
5,654<br />
5,478<br />
11,132<br />
4,900<br />
4,581<br />
9,481<br />
4,613<br />
4,605<br />
9,218<br />
4,153<br />
5,150<br />
9,302<br />
5,378<br />
5,630<br />
11,009<br />
5,428<br />
5,216<br />
10,644<br />
4,954<br />
5,443<br />
10,397<br />
Treatment Admissions:<br />
Heroin as<br />
Primary Drug of<br />
Abuse 3<br />
9,286<br />
9,001<br />
18,287<br />
9,161<br />
9,617<br />
18,778<br />
10,276<br />
10,431<br />
20,707<br />
10,793<br />
10,203<br />
20,996<br />
10,690<br />
10,189<br />
20,879<br />
10,944<br />
10,672<br />
21,616<br />
11,324<br />
11,455<br />
22,779<br />
11,357<br />
11,157<br />
Heroin<br />
Arrests 4<br />
38,131<br />
37,901<br />
35,325<br />
37,483<br />
32,949<br />
33,665<br />
27,863<br />
Average<br />
Purity of<br />
Street Heroin<br />
(%) 5<br />
(69.4)<br />
(56.3)<br />
(62.5)<br />
(63.6)<br />
(61.8)<br />
(62.9)<br />
(56.0)<br />
22,514 34,098 (61.4)<br />
11,540<br />
12,023<br />
23,563<br />
11,878<br />
(53.5)<br />
1<br />
DAWN, OAS, SAMHSA, including New York City, Long Island, and Putnam County through 1995 (Starting with 1996,<br />
the data include New York City only. Prior to 1996, the data include heroin/morphine deaths as well as opiates not<br />
specified by type. Beginning with 1996, the data include only heroin/morphine deaths.)<br />
2<br />
DAWN, OAS, SAMHSA, weighted data, based on a representative sample of hospitals for New York City and Westchester,<br />
Rockland, and Putnam Counties<br />
3<br />
New York State Office of Alcoholism and Substance Abuse Services (OASAS)-funded and nonfunded treatment<br />
admissions<br />
4<br />
New York City Police Department<br />
5<br />
U.S. Drug Enforcement Administration<br />
Proceedings of the Community Epidemiology Work Group, Vol. II, January 2005
<strong>EPIDEMIOLOGIC</strong> TRENDS IN <strong>DRUG</strong> <strong>ABUSE</strong>—New York City<br />
Exhibit 4. Characteristics of Primary Heroin Admissions 1 to State-Funded 2 and Nonfunded 3 Treatment<br />
Programs in New York City, by Route of Administration and Percent: First Half of 2004<br />
Demographic<br />
Characteristic<br />
Gender<br />
Male<br />
Female<br />
Age at Admission<br />
25 and younger<br />
26–35<br />
36 and older<br />
(Average age)<br />
Race<br />
Black<br />
Hispanic<br />
White<br />
Percent Total<br />
(N=11,878)<br />
75<br />
25<br />
7<br />
22<br />
71<br />
(40.1 years)<br />
26<br />
53<br />
18<br />
Percent Using Heroin<br />
Intranasally<br />
(n=7,192)<br />
Percent Injecting<br />
Heroin<br />
(n=4,272)<br />
Proceedings of the Community Epidemiology Work Group, Vol. II, January 2005 179<br />
75<br />
25<br />
5<br />
21<br />
75<br />
(40.8 years)<br />
32<br />
55<br />
11<br />
75<br />
25<br />
10<br />
25<br />
65<br />
(39.1 years)<br />
No Source of Income 4 27 28 25<br />
Some Criminal Justice Status 33 36 26<br />
Readmissions 88 87 92<br />
Age of First Use<br />
14 and younger<br />
15–19<br />
20–29<br />
30 and older<br />
Secondary Drug of Abuse<br />
Alcohol<br />
Marijuana<br />
Cocaine<br />
1<br />
Figures on this table may differ somewhat from figures cited on other tables, because computer runs may have been executed at<br />
different times and files are being updated continuously.<br />
2<br />
State-funded programs receive some or all funding through the New York State Office of Alcoholism and Substance Abuse Services<br />
(OASAS).<br />
3<br />
Nonfunded programs receive funding through sources other than OASAS.<br />
4<br />
Defined as not earning income, not receiving support from family or significant others, and not receiving any public assistance.<br />
SOURCE: New York State Office of Alcoholism and Substance Abuse Services<br />
12<br />
34<br />
34<br />
19<br />
13<br />
8<br />
38<br />
10<br />
31<br />
36<br />
23<br />
13<br />
9<br />
35<br />
16<br />
51<br />
30<br />
16<br />
40<br />
32<br />
12<br />
12<br />
6<br />
45
180<br />
<strong>EPIDEMIOLOGIC</strong> TRENDS IN <strong>DRUG</strong> <strong>ABUSE</strong>—New York City<br />
Exhibit 5. Semiannual Marijuana Trends for Selected Indicator Data in New York City: 1995–2004<br />
Year<br />
1995<br />
1996<br />
1997<br />
1998<br />
1999<br />
2000<br />
2001<br />
2002<br />
2003<br />
2004<br />
Semiannual/<br />
Annual Period<br />
1H<br />
2H<br />
Total<br />
1H<br />
2H<br />
Total<br />
1H<br />
2H<br />
Total<br />
1H<br />
2H<br />
Total<br />
1H<br />
2H<br />
Total<br />
1H<br />
2H<br />
Total<br />
1H<br />
2H<br />
Total<br />
1H<br />
2H<br />
Total<br />
1H<br />
2H<br />
Total<br />
1H<br />
2H<br />
Total<br />
Marijuana<br />
ED<br />
Mentions 1<br />
1,516<br />
1,460<br />
2,974<br />
1,723<br />
1,848<br />
3,571<br />
1,939<br />
1,900<br />
3,839<br />
1,986<br />
1,696<br />
3,682<br />
1,799<br />
1,692<br />
3,491<br />
1,856<br />
1,688<br />
3,544<br />
1,904<br />
1,598<br />
3,502<br />
1,827<br />
2,097<br />
3,924<br />
Treatment Admissions: Marijuana<br />
as Primary Drug of<br />
Abuse 2<br />
Cannabis<br />
Arrests 3<br />
2,171<br />
2,159<br />
4,330<br />
12,357<br />
2,845<br />
3,185<br />
6,030<br />
18,991<br />
3,794<br />
3,657<br />
7,451<br />
27,531<br />
4,554<br />
4,473<br />
9,027<br />
42,030<br />
5,119<br />
5,100<br />
10,219<br />
43,122<br />
5,664<br />
5,487<br />
11,151<br />
60,455<br />
6,677<br />
6,593<br />
13,270<br />
47,651<br />
7,512<br />
6,798<br />
14,310 47,250<br />
6,844<br />
6,627<br />
13,471<br />
6,746<br />
SOURCES: 1 DAWN, OAS, SAMHSA, weighted data, based on a representative sample of hospitals for New York City and Westchester,<br />
Rockland, and Putnam Counties<br />
2<br />
New York State Office of Alcoholism and Substance Abuse Services (OASAS)-funded and nonfunded treatment<br />
admissions<br />
3<br />
New York City Police Department<br />
Proceedings of the Community Epidemiology Work Group, Vol. II, January 2005
<strong>EPIDEMIOLOGIC</strong> TRENDS IN <strong>DRUG</strong> <strong>ABUSE</strong>—New York City<br />
Exhibit 6. Characteristics of Primary Marijuana Admissions 1 to State-Funded 2 and Nonfunded 3 Treatment<br />
Programs in New York City, by Percent: 2003<br />
Demographic Characteristic<br />
Gender<br />
Male<br />
Female<br />
Age at Admission<br />
20 and younger<br />
21–25<br />
26–35<br />
36 and older<br />
(Average Age)<br />
Race<br />
Black<br />
Hispanic<br />
White<br />
Percent of Total<br />
(N=6,746)<br />
Proceedings of the Community Epidemiology Work Group, Vol. II, January 2005 181<br />
78<br />
22<br />
30<br />
26<br />
27<br />
17<br />
(26.5 years)<br />
No Source of Income 4 22<br />
Some Criminal Justice Status 64<br />
Readmissions 54<br />
Age of First Use<br />
14 and younger<br />
15–19<br />
20–29<br />
30 and older<br />
Secondary Drug of Abuse<br />
Alcohol<br />
Cocaine<br />
1<br />
Figures on this table may differ somewhat from figures cited on other tables, because computer runs may have been executed at<br />
different times and files are being updated continuously.<br />
2<br />
State-funded programs receive some or all funding through the New York State Office of Alcoholism and Substance Abuse Services<br />
(OASAS).<br />
3<br />
Nonfunded programs receive funding through sources other than OASAS.<br />
4<br />
Defined as not earning income, not receiving support from family or significant others, and not receiving any public assistance.<br />
SOURCE: New York State Office of Alcoholism and Substance Abuse Services<br />
56<br />
32<br />
9<br />
49<br />
41<br />
8<br />
2<br />
38<br />
13
<strong>EPIDEMIOLOGIC</strong> TRENDS IN <strong>DRUG</strong> <strong>ABUSE</strong>—Philadelphia<br />
Drug Use in Philadelphia, Pennsylvania<br />
Samuel J. Cutler and Marvin F. Levine, M.S.W. 1<br />
ABSTRACT<br />
Indicators remain high for the four major drugs of<br />
abuse—cocaine, heroin, alcohol, and marijuana. At<br />
the same time, there has been an increase in the<br />
number of drugs used in combination and an expansion<br />
in the number of different drugs being<br />
used. During 2002, 2003, and the first half of 2004,<br />
the average number of drugs detected in decedents<br />
increased from 2.68 to 3.18 to 3.72 per case. In the<br />
first half of 2004, 47 percent of decedents testing<br />
positive for heroin also tested positive for cocaine.<br />
Also during that period, 75 percent of male cocaine<br />
treatment admissions and 87 percent of female cocaine<br />
treatment admissions were crack smokers.<br />
From 2003 through the first half of 2004, heroin<br />
ranked first among primary drug of abuse at admission<br />
to treatment. The practice of smoking marijuana<br />
and PCP together in a blunt remained popular.<br />
PCP has been the fifth most frequently detected<br />
drug in decedents over the last 10½ years.<br />
INTRODUCTI<strong>ON</strong><br />
Area Description<br />
Philadelphia, the largest city in the State, is located in<br />
the southeastern corner of Pennsylvania. The 2000<br />
U.S. census count of 1,517,550 Philadelphia residents<br />
represents 12.4 percent of the State’s population and<br />
a 7-percent increase from the 1990 census count. The<br />
2000 Philadelphia population was 45.0 percent<br />
White, 43.2 percent African-American, 4.5 percent<br />
Asian, 0.3 percent American Indian and Alaska Native,<br />
4.8 percent other race, and 2.2 percent two or<br />
more races. Hispanics (of various races) accounted<br />
for an estimated 8.5 percent of the population, and<br />
persons age 18 and older accounted for 74.7 percent.<br />
The unemployment rate was 6.1 percent for persons<br />
age 16 or older, and 49.8 percent of the population<br />
was employed.<br />
1 The authors are affiliated with the City of Philadelphia, Office of Behavioral Health/Mental Retardation Services, Coordinating Office for Drug and Alcohol<br />
Abuse Programs (CODAAP), Philadelphia, Pennsylvania. John H. Gossard, Richard C. Jones, and Nelson E. Martin provided assistance in preparing<br />
this paper.<br />
182<br />
Data Sources<br />
This report focuses primarily on the city/county of<br />
Philadelphia and includes data from the sources<br />
shown below. For the purposes of this report, fiscal<br />
year (FY) refers to a year starting July 1 and ending<br />
the following June 30.<br />
• Emergency department (ED) drug data were<br />
accessed from the Drug Abuse Warning Network<br />
(DAWN) DAWN Live!, a restricted-access online<br />
query system administered by the Office of Applied<br />
Studies (OAS), Substance Abuse and Mental<br />
Health Services Administration (SAMHSA).<br />
The unweighted data are for the period January 1,<br />
2004, through June 30, 2004. Thirty-three of the<br />
56 eligible hospitals in the Philadelphia metropolitan<br />
area are in the DAWN sample. The number<br />
of emergency departments in the sample totals<br />
40. (Some hospitals have more than one ED.) The<br />
data are incomplete. Over the 6-month period, between<br />
25 and 27 EDs reported to DAWN each<br />
month. All DAWN cases are reviewed for quality<br />
control. Based on the review, cases may be corrected<br />
or deleted. Therefore, data presented in this<br />
paper are subject to change. The data were generated<br />
on January 14, 2005, and only include cases<br />
classified as Seeking Detox, Overmedication, or<br />
‘Other’ (which includes cases related to recreational<br />
use, drug abuse, drug dependence, withdrawal,<br />
and misuse). The data represent drug reports<br />
in drug-related ED visits. Drug reports exceed<br />
the number of visits since a patient may report<br />
use of multiple drugs (up to six drugs plus alcohol).<br />
The unweighted data cannot be used as estimates<br />
for the Philadelphia area. They cannot be<br />
compared with data from 2002 or before, nor can<br />
these preliminary data be used for comparison<br />
with future data. Only weighted data released by<br />
SAMHSA can be used for trend analysis. A full<br />
description of DAWN can be found at the DAWN<br />
Web site .<br />
Proceedings of the Community Epidemiology Work Group, Vol. II, January 2005
• Treatment admissions data for programs in<br />
Philadelphia County were provided by the Pennsylvania<br />
Department of Health, Client Information<br />
System, for January 1, 1998, through June 30,<br />
2004. Data for FY 2004 are preliminary and subject<br />
to revision because of the treatment-reporting<br />
schedule, which results in frequent delays between<br />
a treatment admission and the reporting of<br />
that event.<br />
• Mortality data were provided by the Philadelphia<br />
Medical Examiner’s (ME) Office. These<br />
data cover mortality cases with toxicology reports<br />
indicating the detection of drugs in decedents<br />
in Philadelphia. The time period is January<br />
1, 1994, through June 30, 2004. (The cases include<br />
persons who died from the adverse affects<br />
of one or multiple drugs, as well as persons who<br />
exhibited some substance presence but died from<br />
other causes. The Philadelphia ME also distinguishes<br />
between persons who appeared to have a<br />
lethal reaction to what might be considered a<br />
light or moderate amount of drugs and persons<br />
whose toxicology reports showed a high level of<br />
drugs in their systems.) Mortality cases with<br />
positive toxicology reports for alcohol are only<br />
reported in combination with one or more other<br />
drugs.<br />
• Arrestee urinalysis data for booked adults were<br />
derived from reports from the First Judicial District<br />
of Pennsylvania, Adult Probation/Parole Department,<br />
for the period January 1, 2004, through<br />
June 30, 2004.<br />
• Drug price information was provided by the<br />
National Drug Intelligence Center for the period<br />
January 1, 2004, through June 30, 2004.<br />
• Heroin purity data were provided by the Drug<br />
Enforcement Administration (DEA), Domestic<br />
Monitor Program (DMP), through the first half of<br />
2004.<br />
• Acquired immunodeficiency syndrome (AIDS)<br />
data were provided by the Philadelphia Department<br />
of Public Health’s AIDS Activities Coordinating<br />
Office on AIDS cases reported from November<br />
1, 1981, to June 30, 2004.<br />
• Population and demographic data describing<br />
the City of Philadelphia emanated from the U.S.<br />
Census Bureau.<br />
<strong>EPIDEMIOLOGIC</strong> TRENDS IN <strong>DRUG</strong> <strong>ABUSE</strong>—Philadelphia<br />
In addition to these sources, this report draws on focus<br />
group and key informant discussions with former<br />
drug users currently enrolled in treatment programs,<br />
as well as outreach workers assigned to homeless<br />
populations, substance abusers, persons with human<br />
immunodeficiency virus (HIV) infection, and law<br />
enforcement officials.<br />
<strong>DRUG</strong> <strong>ABUSE</strong> PATTERNS AND TRENDS<br />
The four major drugs of abuse in Philadelphia continue<br />
to be cocaine, heroin, marijuana, and alcohol.<br />
These are frequently used in combination with each<br />
other and with other supplemental drugs. In 2003 and<br />
in the first half of 2004, 92 percent of people entering<br />
treatment identified one of these drugs as their primary<br />
drug of abuse.<br />
Preliminary unweighted data accessed from DAWN<br />
Live! for the first half of 2004 showed 11,251 total<br />
drug reports and 6,538 total cases. Of these, 75 percent<br />
of drug reports (n=8,428) and 72 percent of the<br />
cases (n=4,675) were categorized as “seeking detox,”<br />
“overmedication,” or “other” as the reason for the<br />
hospital emergency department visit. Within these<br />
three case types, the average number of drug reports<br />
was 1.80 per hospital ED episode. Of the 8,428 drug<br />
reports, 66 percent (n=5,555) were classified as “major<br />
substances of abuse. A subset (n=5,270) included<br />
the total reports of the four major drugs of abuse in<br />
Philadelphia: cocaine (n=2,034), alcohol (n=1,468),<br />
heroin (n=1,030), and marijuana (n=738) (exhibit 1).<br />
In the first half of 2004, the average number of drugs<br />
detected in decedents by the ME (3.72) was the highest<br />
on record (exhibit 2). The average over the previous<br />
10-year period (1994 to 2003) was 2.43 drugs per<br />
case. The number of mortality cases with positive<br />
toxicology reports in 2003 (841) was the highest on<br />
record, going back to at least 1970. With the number<br />
of mortality cases totaling 469 in the first half of<br />
2004, the number of cases in 2004 might exceed the<br />
2003 record. Of the 469 deaths in the first half of<br />
2004, adverse reaction to drugs accounted for 32.4<br />
percent, overdose represented 8.5 percent, violence<br />
accounted for 24.1 percent, and “other causes” constituted<br />
35.0 percent (exhibit 3).<br />
In the first half of 2004, African-American male decedents<br />
(n=154) outnumbered White male decedents<br />
(149), while White females (63) outnumbered African-American<br />
females (61). The remaining 42 deaths<br />
were among Hispanics and Asian Americans. Overall,<br />
African-Americans accounted for 45.8 percent of<br />
Proceedings of the Community Epidemiology Work Group, Vol. II, January 2005 183
the deaths, while Whites constituted 45.2 percent,<br />
Hispanics represented 8.1 percent, and Asians accounted<br />
for 0.9 percent.<br />
Urinalysis data of booked arrestees from Philadelphia’s<br />
Adult Probation/Parole Department (APPD) in<br />
the first half of 2004 showed that 39.8 percent<br />
(n=10,025) of the 25,178 tested arrestees in the sample<br />
were positive for at least 1 drug.<br />
The Pennsylvania Client Information System is limited<br />
to the identification of a maximum of three substances<br />
as drugs of abuse at treatment intake. The highest average<br />
number of drugs of abuse identified at admission<br />
to treatment occurred in the first half of 1999 (2.06). In<br />
2002, the average was 1.45 drugs of abuse, compared<br />
with 1.74 in 2003 and 1.69 in the first half of 2004.<br />
Cocaine/Crack<br />
Cocaine/crack remains the major drug of abuse in<br />
Philadelphia. Cocaine mentions in hospital emergency<br />
departments ranked first among all drugs in cases categorized<br />
as “seeking detox,” “overmedication,” or<br />
“other” in the unweighted data accessed from DAWN<br />
Live! in the first half of 2004 (n=2,034) (exhibit 1).<br />
Among these patients, 65 percent were male, 58 percent<br />
were African-American, 35 percent were White, 5<br />
percent were Hispanic, and 2 percent were not specified.<br />
Thirty-five to 44-year-olds represented the plurality<br />
of patients at 38 percent. The second largest group<br />
was 45–54-year-olds, accounting for 18 percent. An<br />
aging cocaine-using population continues to appear in<br />
the consequence data.<br />
ME data show that the proportion of cases with cocaine<br />
present was 46 percent in 2002, 39 percent in<br />
2003, and 44 percent in the first half of 2004 (exhibit<br />
2). Cocaine was detected in 3,163 decedents from<br />
January 1994 through June 2004, more than any other<br />
drug appearing in the toxicology reports. The average<br />
age of mortality cases with positive toxicology reports<br />
for cocaine was 39 years.<br />
At least one other drug was detected in 83 percent of<br />
cocaine-positive cases in 2001 and 2002 and 85 percent<br />
in 2003 and in the first half of 2004.<br />
The preliminary treatment data for 2003 show that<br />
cocaine, as a primary drug, accounted for 25.8 percent<br />
of all treatment admissions, the same as in 2001<br />
(exhibit 4). In 2003, cocaine was mentioned by an<br />
additional 15.9 percent as a secondary drug and by<br />
2.8 percent as a tertiary drug. In the first half of 2004,<br />
cocaine accounted for 25.3 percent of all primary<br />
drug mentions and was mentioned by an additional<br />
13.8 percent as a secondary drug and 2.7 percent as a<br />
184<br />
<strong>EPIDEMIOLOGIC</strong> TRENDS IN <strong>DRUG</strong> <strong>ABUSE</strong>—Philadelphia<br />
tertiary drug. Cocaine treatment admissions peaked in<br />
1991, at 63 percent of all primary drugs mentioned at<br />
admission to treatment.<br />
In 2003 and in the first half of 2004, males accounted<br />
for 59 percent and 63 percent of primary cocaine<br />
drug treatment admissions, respectively (exhibit 5).<br />
During these time periods, African-Americans accounted<br />
for 79 and 80 percent of primary cocaine<br />
treatment admissions, respectively, followed by<br />
Whites (16 and 15 percent), Hispanics (4 and 4 percent),<br />
and Asians and others (1 and 1 percent).<br />
Among primary cocaine treatment admissions in<br />
2003, the average number of drugs of abuse noted<br />
upon entering treatment was 1.85; in the first half of<br />
2004, the average was 1.81.<br />
Since 2000, an average of 82 percent of the primary<br />
cocaine admissions reported smoking the drug, 15.1<br />
percent reported intranasal use, 1.5 percent reported<br />
injecting, and 1.2 percent reported administering the<br />
drug through other/unknown routes (exhibit 5). Since<br />
the first half of 1990, at least 79 percent of cocaine<br />
treatment admissions have reported smoking the<br />
drug. Of all male cocaine admissions in 2003 and the<br />
first half of 2004, 77 and 75 percent, respectively,<br />
reported smoking the drug; the comparable figures<br />
for females were 86 and 87 percent.<br />
Urinalysis data of booked arrestees from Philadelphia’s<br />
APPD in the first half of 2004 showed that 13.5<br />
percent (n=3,408) of the 25,178 tested arrestees in the<br />
sample were positive for cocaine or cocaine metabolites.<br />
Cocaine was the second most frequently detected<br />
drug behind marijuana.<br />
The predominant form of crack sold in Philadelphia<br />
is the “rock,” which costs $5. The $5 rock ranged in<br />
size from 6 to 9 millimeters from 1996 until 2002.<br />
Since then, the size of the $5 rock was reduced to 5–6<br />
millimeters. Treys ($3 rocks) ranged in size from 3 to<br />
5 millimeters since 1996, but they were reduced to 3<br />
to 4 millimeters from the latter half of 2002 through<br />
the autumn of 2004. Shapes of crack range from circular,<br />
to bumpy-circular, to pieces cut into the shape<br />
of a parallelogram. Powder cocaine is not as readily<br />
available in small ($5) quantities, but $10 and especially<br />
$20 bags are quite common. According to the<br />
National Drug Intelligence Center, the retail/streetlevel<br />
cocaine prices ranged from $3 to $20 per rock<br />
of crack and from $28 to $125 per gram of powdered<br />
cocaine in the first half of 2004.<br />
Focus group participants from the spring of 2003<br />
through the autumn of 2004 estimated that about 62<br />
percent of powder cocaine buys are for intranasal use,<br />
19 percent are injected straight, and 19 percent are<br />
Proceedings of the Community Epidemiology Work Group, Vol. II, January 2005
injected in a “speedball.” These estimates were very<br />
similar to the focus group responses throughout 2002.<br />
In the autumn of 2004, crack users continued to report<br />
frequent use in combination with 40-ounce bottles of<br />
malt liquor, beer, wine, or other drugs, including alprazolam<br />
(Xanax), marijuana, or heroin. Powder cocaine,<br />
cigarettes, and methamphetamine were less frequently<br />
mentioned as drugs used with crack.<br />
Heroin/Morphine<br />
According to the Drug Enforcement Administration’s<br />
Domestic Monitor Program, the average street-level<br />
purity of heroin in Philadelphia was 71.0 percent in<br />
2001, 66.3 percent in 2002, 59.6 percent in 2003, and<br />
53.0 percent in the first half of 2004 (based on only<br />
70 percent of the samples analyzed). The authors<br />
pose that a possible explanation for the aforementioned<br />
increase in the average number of drugs in<br />
mortality and hospital emergency departments since<br />
2001 is the decreasing potency of the heroin available<br />
at the retail/street level. With lower heroin purity,<br />
users may perceive a need for more drugs to achieve<br />
the desired effect.<br />
Unweighted data accessed from DAWN Live! show<br />
that heroin reports in hospital emergency departments<br />
ranked third (behind cocaine and alcohol) among all<br />
drugs in cases categorized as “seeking detox,” “overmedication,”<br />
or “other” in the first half of 2004<br />
(n=1,030) (exhibit 1). Among these patients, 65 percent<br />
were male, 65 percent were White, 23 percent<br />
were African-American, 9 percent were Hispanic, and<br />
3 percent were not specified. Thirty-five to 44-yearolds<br />
represented the plurality of these patients with 24<br />
percent. The second largest group was 25–29-yearolds,<br />
accounting for 19 percent.<br />
Heroin was detected in 2,947 decedents from 1994<br />
through June 2004, making it the second most commonly<br />
detected drug in decedents (exhibit 2). For the<br />
4-year period 1999 through 2002, positive heroin<br />
toxicology reports occurred in 47 percent of all<br />
deaths with the presence of drugs. In 2003 and the<br />
first half of 2004, heroin was detected in only 25 and<br />
27 percent, respectively, of all decedents with drugpositive<br />
toxicology reports.<br />
From 2000 through 2002, heroin alone was identified<br />
in 14, 11, and 10 percent of the respective heroin toxicology<br />
reports. In 2003 and the first half of 2004, heroin<br />
alone was identified in 7 and 2 percent, respectively,<br />
of the heroin toxicology reports. The combination<br />
of heroin and cocaine was detected in 20, 19, and<br />
17 percent of all decedents, respectively, from 2000<br />
<strong>EPIDEMIOLOGIC</strong> TRENDS IN <strong>DRUG</strong> <strong>ABUSE</strong>—Philadelphia<br />
through 2002, and only 10 percent of drug-positive<br />
toxicology reports in 2003. Cocaine was detected in 47<br />
percent of heroin toxicology reports in the first half of<br />
2004.<br />
In 2003 and the first half of 2004, heroin treatment<br />
admissions ranked highest of all drugs mentioned as a<br />
primary drug of abuse (exhibit 4). Heroin admissions<br />
accounted for 22 percent of all admissions in 2002, 27<br />
percent in 2003, and 28 percent in the first half of<br />
2004. During 2003, 66 percent of all treatment admissions<br />
for heroin, illegal methadone, and other opiates<br />
were male; in the first half of 2004, 65 percent were<br />
male (exhibit 6). In the first half of 2004, 62 percent<br />
were White, 25 percent were African-American, 11<br />
percent were Hispanic, and 2 percent were<br />
Asian/other. Individuals who identified heroin as the<br />
primary drug of abuse in 2003 used an average of 1.63<br />
drugs; in the first half of 2004, the average was 1.61.<br />
As depicted in exhibit 6, the preferred routes of administration<br />
for heroin, illegal methadone, and other<br />
opiates have been relatively stable among treatment<br />
admissions. Within the “swallowed” route, the increasing<br />
numbers that began in 2001 reveal that users<br />
of pharmaceutically produced synthetic opiates entered<br />
treatment.<br />
Heroin treatment admissions data from the second<br />
half of 1997 through the first half of 2004 revealed<br />
that there was a slow, but steady decline in the percent<br />
of heroin injectors entering treatment. It was<br />
determined that the injection percentages were influenced<br />
by an influx of relatively new users who entered<br />
treatment for the first time prior to converting to<br />
injection from intranasal use, which is characteristic<br />
of new users. However, most heroin users make the<br />
conversion to injecting prior to entering treatment for<br />
the first time.<br />
Urinalysis data of booked arrestees from Philadelphia’s<br />
APPD in the first half of 2004 showed that 6.6<br />
percent (n=1,655) of the 25,178 tested arrestees in the<br />
sample were positive for opiates. Opiates were the<br />
third most frequently detected drugs behind marijuana<br />
and cocaine.<br />
Key informants continued to report that the $10 bag of<br />
heroin remained the standard unit of purchase. The<br />
$10 bag usually yields one hit; $5 and $20 bags reportedly<br />
remain available. According to the National<br />
Drug Intelligence Center, the retail/street-level price<br />
for heroin was $10–$20 per bag, $180–$250 per bundle,<br />
and $65–$300 per gram in the first half of 2004.<br />
Focus group participants in 2004 reported that the average<br />
age of new users is 20. All groups since autumn<br />
Proceedings of the Community Epidemiology Work Group, Vol. II, January 2005 185
2000 reported that the average heroin user injects the<br />
drug four or five times per day.<br />
Narcotic Analgesics<br />
Oxycodone<br />
The use of oxycodone products, including OxyContin,<br />
Percocet/Percodan, Roxicet, and Tylox, continues<br />
to appear problematic in Philadelphia.<br />
Oxycodone reports in hospital emergency departments<br />
ranked first among all narcotic analgesics in the unweighted<br />
data accessed from DAWN Live! for the first<br />
half of 2004 (n=400). Among these cases, the plurality<br />
of cases were classified as “overmedication.”<br />
Oxycodone was detected in 369 decedents from 1994<br />
through the first half of 2004 (the ninth most frequently<br />
detected drug during that time period) (exhibit<br />
2). Detections of oxycodone have been rapidly<br />
increasing since 2000. In 2003, oxycodone was present<br />
in 9.6 percent of all drug-positive deaths; in the<br />
first half of 2004, oxycodone was present in 10.9<br />
percent of drug-positive mortality cases.<br />
Focus group participants since spring 2002 reported<br />
the spread of oxycodone use to all racial/ethnic<br />
groups, with an age range of mid-teens to 40, with<br />
the largest user group being people in their twenties.<br />
Hydrocodone<br />
In the unweighted data accessed from DAWN Live!,<br />
hydrocodone ED reports ranked second among all<br />
narcotic analgesics in the first half of 2004 (n=69).<br />
Among these cases, the plurality of cases were classified<br />
as “seeking detox.”<br />
The presence of hydrocodone in mortality cases has<br />
also increased. There were 40 positive toxicology<br />
ME reports for hydrocodone in 2003, 23 reports in<br />
the first half of 2004, and a total of 211 cases in the<br />
10½ -year period from 1994 through June 2004.<br />
Hydrocodone detections now rank 14th among all<br />
deaths with positive toxicology reports.<br />
Opioid Analgesics<br />
Fentanyl<br />
In the spring of 2004, the Pennsylvania State Attorney<br />
General’s Office issued information about the<br />
diversion and nonmedical use of fentanyl citrate. In<br />
particular, Actiq lozenges were cited as being sold on<br />
the streets of Philadelphia for $20 each. Actiq contains<br />
fentanyl citrate and is indicated for patients who<br />
186<br />
<strong>EPIDEMIOLOGIC</strong> TRENDS IN <strong>DRUG</strong> <strong>ABUSE</strong>—Philadelphia<br />
continue to experience pain while being treated with<br />
synthetic opiates. Actiq resembles a lollipop, as the<br />
medication lozenge is at the end of a small stick and<br />
it is used by rubbing against the inside soft tissue of<br />
the mouth. Locally, users call it “Perca-pop” or<br />
“Narco-pop.” From 1994 through 2003, the ME recorded<br />
35 deaths with the presence of fentanyl. Of<br />
these, seven occurred in the first half of 2003, and<br />
nine occurred in the second half of 2003. There were<br />
14 additional mortality cases with positive toxicology<br />
reports for fentanyl in the spring of 2004, the period<br />
of the State Attorney General’s announcement.<br />
Marijuana<br />
Marijuana continued to be readily available and<br />
widely used in Philadelphia in the first half of 2004.<br />
Unweighted data from DAWN Live! show that marijuana<br />
reports in hospital emergency departments<br />
ranked fourth (behind cocaine, alcohol, and heroin)<br />
among all drugs in cases categorized as “seeking detox,”<br />
“overmedication,” or “other” in the first half of<br />
2004 (n=738) (exhibit 1). Among these patients, 64<br />
percent were male, 47 percent were African-American,<br />
45 percent were White, 4 percent were Hispanic, and 4<br />
percent were not specified. Twenty-one to 24-yearolds<br />
accounted for the plurality of patients with 18<br />
percent. The second largest group was 35–44-yearolds,<br />
representing 17 percent.<br />
The proportion of clients who cited marijuana as the<br />
primary drug of abuse upon entering treatment was<br />
17 percent in 2003 and the first half of 2004 (exhibit<br />
4). Among all admissions in 2003 and the first half of<br />
2004, marijuana was mentioned by an additional 10<br />
percent as a secondary drug. During the same time<br />
periods, marijuana was mentioned as a tertiary drug<br />
by 7 percent and 6 percent, respectively. In 2003,<br />
among primary marijuana admissions, males accounted<br />
for 78 percent; African-Americans accounted<br />
for 63 percent, Whites accounted for 21 percent, Hispanics<br />
accounted for 13 percent, and Asians and others<br />
accounted for 3 percent. In the first half of 2004,<br />
the comparable figures were 78 percent male, 63 percent<br />
African-American, 24 percent White, 10 percent<br />
Hispanic, and 2 percent Asian and other. Among<br />
primary marijuana treatment admissions in 2003, the<br />
average number of drugs of abuse noted upon entering<br />
treatment was 1.63. The average in the first half<br />
of 2004 was 1.65.<br />
Urinalysis data of booked arrestees from Philadelphia’s<br />
APPD in the first half of 2004 showed that<br />
18.3 percent (n=4,610) of the 25,178 tested arrestees<br />
in the sample were positive for marijuana or marijuana<br />
metabolites. Marijuana was the most frequently<br />
detected drug by APPD.<br />
Proceedings of the Community Epidemiology Work Group, Vol. II, January 2005
Key informants continue to report the widespread and<br />
increasing use of blunts, especially utilizing flavored<br />
cigars. The combination of marijuana and PCP continues<br />
to be frequently reported. Blunts laced with<br />
crack (called “Turbo”) are still common, but less so<br />
than the marijuana/PCP combination. Blunt users<br />
commonly ingest beer, wine coolers, whiskey, alprazolam,<br />
or diazepam along with the blunt. Less commonly,<br />
blunt smokers use powder cocaine, vodka,<br />
barbiturates, clonazepam, oxycodone, cough syrup,<br />
and/or methamphetamine. These comments by users<br />
continue to underscore the common practice of multiple<br />
drug use, either simultaneously or sequentially.<br />
According to the National Drug Intelligence Center,<br />
the retail/street-level prices per bag of marijuana<br />
ranged from $5 to $35 in the first half of 2004.<br />
Phencyclidine (PCP)<br />
PCP began to gain popularity as an additive to blunts<br />
in 1994, and its use has increased since 2000. Users<br />
describe its effects as making them hallucinate and<br />
feel “invincible,” “crazy,” “numb,” or “violent.”<br />
In the unweighted data from DAWN Live!, there<br />
were 129 reports of PCP among cases categorized as<br />
“seeking detox” (n=14), “suicide attempt” (n=9), or<br />
“other” (n=115) in the first half of 2004 (exhibit 1).<br />
PCP was detected in 441 decedents from 1994 through<br />
the first half of 2004, making it the fifth most frequently<br />
detected drug during that time period, behind<br />
cocaine, heroin/morphine, alcohol-in-combination, and<br />
diazepam (exhibit 2).<br />
In 2003, PCP was mentioned as a primary, secondary,<br />
or tertiary drug by 4.3 percent of all treatment admissions.<br />
The average number of drugs of abuse mentioned<br />
by primary PCP treatment admissions was 1.92.<br />
In the first half of 2004, PCP was mentioned as primary,<br />
secondary, or tertiary drug in 4.6 percent of all<br />
adissions, and the average number of drugs of abuse<br />
mentioned by primary PCP treatment admissions was<br />
1.89.<br />
Urinalysis data of booked arrestees from Philadelphia’s<br />
APPD in the first half of 2004 showed that 4.1<br />
percent (n=1,023) of the 25,178 tested arrestees in the<br />
sample were positive for PCP, making this drug the<br />
sixth most frequently detected drug by APPD.<br />
PCP remains readily available. It is more commonly<br />
found on mint leaves for use in lacing blunts or for<br />
rolling and smoking. Additionally, some users prefer<br />
PCP in liquid form that is used by applying the drug<br />
<strong>EPIDEMIOLOGIC</strong> TRENDS IN <strong>DRUG</strong> <strong>ABUSE</strong>—Philadelphia<br />
to cigarettes. This method is referred to as “sherms”<br />
or “dip sticks.”<br />
Benzodiazepines<br />
Benzodiazepines, particularly alprazolam (Xanax)<br />
and diazepam (Valium), continue to be used in combination<br />
with other drugs.<br />
There were 1,015 reports of benzodiazepines in the<br />
unweighted data from DAWN Live! for the first half of<br />
2004. The leading case types for this class of drugs<br />
were “overmedication” (n=361), “other” (n=350), “suicide<br />
attempt” (n=138), and “seeking detox” (n=135).<br />
Diazepam, having been detected by the ME in 559<br />
decedents from 1994 through the first half of 2004,<br />
ranks fourth among drugs present in mortality cases<br />
in Philadelphia (exhibit 2). While users new to treatment<br />
report that diazepam has become less popular in<br />
recent years, alprazolam use has increased. Alprazolam<br />
tied for the 12th most frequently detected drug<br />
among decedents by the Philadelphia ME (n=244)<br />
from 1994 through the first half of 2004, including 31<br />
cases in the lattermost half-year.<br />
Treatment admission reports for 2003 and the first<br />
half of 2004 show benzodiazepines as primary drugs<br />
of abuse in 67 and 19 cases, respectively (exhibit 4);<br />
these drugs were reported as secondary or tertiary<br />
drugs of abuse in 382 additional cases in 2003 and<br />
172 additional cases in the first half of 2004. Most of<br />
the reports of benzodiazepines as secondary or tertiary<br />
drugs of choice indicated that heroin was the primary<br />
drug. Those who reported using benzodiazepines<br />
as their primary drugs of abuse used an average<br />
of 2.0 drugs in 2003 and 1.63 drugs in the first half of<br />
2004. Benzodiazepine abuse was reported by focus<br />
group participants as common among users of heroin,<br />
oxycodone, cocaine, marijuana, and cough syrup.<br />
Since spring 2000, all focus groups have reported that<br />
alprazolam has overtaken diazepam as the “most<br />
popular pill” on the street.<br />
Deaths with the presence of oxazepam (Serax) have<br />
been increasing. There were 16 positive toxicology<br />
reports for oxazepam in 2003 and 24 in the first half of<br />
2004 (exhibit 2). In the 10½-year period, 1994 through<br />
mid-2004, 153 mortality cases tested positive for this<br />
drug, making oxazepam the 19th most frequently detected<br />
drug.<br />
Deaths with the presence of olanzapine (Zyprexa)<br />
have been increasing. In 2003, there were 43 positive<br />
toxicology reports for olanzapine, and there were 18<br />
in the first half of 2004. In the 10½-year period, 1994<br />
through mid-2004, 137 mortality cases tested positive<br />
Proceedings of the Community Epidemiology Work Group, Vol. II, January 2005 187
for this drug, making olanzapine the 22nd most frequently<br />
detected drug.<br />
Urinalysis data of booked arrestees from Philadelphia’s<br />
APPD in the first half of 2004 showed that 6<br />
percent (n=1,507) of the 25,178 tested arrestees in the<br />
sample were positive for benzodiazepines, making<br />
this class of drugs the fourth most frequently detected<br />
drug by APPD.<br />
Other Prescription Drugs of Note<br />
Prescription drugs are most frequently detected<br />
among decedents in combination with other drugs of<br />
the same type and/or in combination with cocaine,<br />
heroin, or alcohol. ME mentions for the most frequently<br />
detected prescription drugs among decedents<br />
in the first half of 2004 (not already discussed) included<br />
diphenhydramine (n=74), codeine (n=62), and<br />
methadone (n=57) (exhibit 2). With 435 detections<br />
from 1994 through the first half of 2004, codeine<br />
ranked as the sixth most frequently detected drug<br />
during that period. Methadone ranked seventh<br />
(n=404) and diphenhydramine ranked eighth<br />
(n=392). Regarding codeine and diphenhydramine,<br />
each of which is an ingredient in numerous over-thecounter<br />
medications that are abused in Philadelphia,<br />
negative consequences appear most markedly among<br />
decedents in combination with other drugs.<br />
Deaths with the presence of fluoxetine (Prozac) began<br />
to increase in the late 1990s. With 171 positive<br />
toxicology reports for fluoxetine from 1994 through<br />
the first half of 2004, fluoxetine ranked as the 17th<br />
most frequently detected drug.<br />
Dextromethorphan is a common ingredient in numerous<br />
cough and cold medications. Key informants indicated<br />
that its use is increasing among people age 30–<br />
40, particularly in combination with alprazolam and<br />
diazepam. The Philadelphia ME detected dextromethorphan<br />
in 40 cases in 2003 and in an additional<br />
35 cases in the first half of 2004. There were a total of<br />
122 dextromethorphan-positive cases from 1994<br />
through mid-2004, thus ranking dextromethorphan as<br />
the 25th most frequently detected drug.<br />
Quetiapine (Seroquel), an antipsychotic, has only<br />
been on the market for 3–4 years. Twenty of the total<br />
46 quetiapine detections by the ME occurred in 2003,<br />
and an additional 13 detections were made in the first<br />
half of 2004.<br />
Methamphetamine/Amphetamines<br />
Methamphetamine and amphetamines remain a relatively<br />
minor problem in Philadelphia. The prelimi-<br />
188<br />
<strong>EPIDEMIOLOGIC</strong> TRENDS IN <strong>DRUG</strong> <strong>ABUSE</strong>—Philadelphia<br />
nary unweighted data accessed from DAWN Live!<br />
for the first half of 2004 reveal only 19 methamphetamine<br />
reports; 16 were categorized as “other”<br />
and 3 as “seeking detox” (exhibit 1). Amphetamine<br />
reports totaled 52, of which 38 were in the “other”<br />
category, 5 were “overmedication,” 4 each were “suicide<br />
attempt” and “seeking detox,” and one was in<br />
the “malicious poisoning” case type.<br />
There were 90 deaths with the presence of methamphetamine<br />
(ranked 31st) from 1994 through mid-<br />
2004 and 81 deaths with the presence of amphetamine<br />
(ranked 34th) during that same period.<br />
Annual treatment admissions for methamphetamine/<br />
amphetamines as the primary drug of abuse from 1998<br />
to 2003 were 31, 33, 27, 83, 67, and 33, respectively<br />
(exhibit 4). There were 33 such admissions in the first<br />
half of 2004. Methamphetamine/amphetamines are<br />
rarely identified as a secondary or tertiary drug of<br />
choice among treatment admissions in Philadelphia.<br />
Urinalysis data of booked arrestees from Philadelphia’s<br />
APPD in the first half of 2004 showed that 0.2<br />
percent (n=53) of the 25,178 tested arrestees in the<br />
sample were positive for methamphetamines or amphetamines.<br />
This was the lowest result in the APPD<br />
data.<br />
According to the National Drug Intelligence Center,<br />
the retail/street-level price of methamphetamine was<br />
$100 per gram in the first half of 2004.<br />
Key informants, for the first time, indicated a growing<br />
popularity of methamphetamine among men who have<br />
sex with men. Methamphetamine continues to be reported<br />
as difficult to obtain, not usually sold outdoors,<br />
and requiring a connection; reportedly, however, use<br />
has increased since 2001.<br />
Club Drugs<br />
There has been relatively little consequence data for<br />
methylenedioxymethamphetamine (MDMA). The<br />
preliminary unweighted DAWN Live! data for the first<br />
half of 2004 revealed only 40 reports for MDMA in<br />
cases categorized as “seeking detox,” “overmedication,”<br />
or “other.”<br />
MDMA was present in 6 mortality cases in 1999 (the<br />
first year this drug was detected by the ME) and in a<br />
total of 42 from 1999 through the first half of 2004.<br />
MDMA is reportedly used in combination with marijuana<br />
and lysergic acid diethylamide (LSD), which,<br />
along with its users generally ranging in age from<br />
Proceedings of the Community Epidemiology Work Group, Vol. II, January 2005
teens to persons in their early twenties, helps describe<br />
its use among club-goers.<br />
According to the National Drug Intelligence Center,<br />
the retail/street-level price per MDMA tablet ranged<br />
from $9 to $35 in the first half of 2004.<br />
The Philadelphia ME first detected methylenedioxyamphetamine<br />
(MDA) in the second half of 1999.<br />
There have been 30 positive toxicology reports for<br />
MDA through the first half of 2004, including 6 cases<br />
in the first half of 2004.<br />
Ketamine was first detected in decedents in Philadelphia<br />
in 1996; it was detected in four decedents in<br />
2000, four in 2001, two in 2002, three in 2003, and in<br />
only one decedent in the first half of 2004. It is not<br />
reported as widely available, and it is difficult to obtain.<br />
Gamma hydroxybutyrate (GHB) reports totaled only<br />
nine in the unweighted DAWN Live! data in the first<br />
half of 2004. There is almost no familiarity of GHB<br />
reported by focus group participants. The Philadelphia<br />
ME does not test for GHB because it is produced<br />
naturally as the body decomposes.<br />
<strong>EPIDEMIOLOGIC</strong> TRENDS IN <strong>DRUG</strong> <strong>ABUSE</strong>—Philadelphia<br />
INFECTIOUS DISEASES RELATED TO <strong>DRUG</strong> <strong>ABUSE</strong><br />
As of June 30, 2004, Philadelphia recorded 17,028<br />
cumulative AIDS cases among adults (exhibit 7).<br />
Among those cases, 6,121 involved injection drug<br />
users (IDUs) (needle-sharers). Another 885 were in<br />
the dual exposure category of IDUs who were also<br />
men who had (unprotected) sex with other men<br />
(MSM).<br />
Cases reported with (unprotected) heterosexual contact<br />
as a risk factor continued to exceed the historical<br />
average. Heterosexual contact was the identified exposure<br />
category in 19.3 percent of all AIDS cases<br />
reported through June 30, 2004. In the year ending<br />
June 30, 2004, heterosexual contact accounted for the<br />
plurality of cases (42.7 percent) for the fourth consecutive<br />
time.<br />
The mortality of AIDS cases as of June 30, 2004, was<br />
as follows:<br />
• United States—57.3 percent<br />
• Pennsylvania—51.4 percent<br />
• Philadelphia County—48.9 percent<br />
For inquiries concerning this report, please contact Samuel Cutler, City of Philadelphia, Office of Behavioral Health/Mental Retardation Services,<br />
Coordinating Office for Drug and Alcohol Abuse Programs (CODAAP), 1101 Market Street, Suite 800, Philadelphia, Pennsylvania<br />
19107-2908, Phone: (215) 685-5414, Fax: (215) 685-5427, E-mail: .<br />
Proceedings of the Community Epidemiology Work Group, Vol. II, January 2005 189
190<br />
<strong>EPIDEMIOLOGIC</strong> TRENDS IN <strong>DRUG</strong> <strong>ABUSE</strong>—Philadelphia<br />
Exhibit 1. DAWN Hospital Emergency Department Cases, Seeking Detox, Overmedication, or Other 1 (Unweighted<br />
2 ): January through June 2004<br />
Major Drugs of Abuse Jan. Feb. Mar. Apr. May June Total<br />
(N=) (887) (810) (1,015) (978) (1,059) (806) (5,555)<br />
Cocaine 323 284 375 327 409 316 2,034<br />
Alcohol 244 205 262 239 297 221 1,468<br />
Heroin 153 156 187 218 172 144 1,030<br />
Marijuana 121 116 121 136 137 107 738<br />
PCP 17 29 34 19 20 10 129<br />
Amphetamines 8 7 11 8 11 2 47<br />
MDMA 8 7 7 11 5 2 40<br />
Methamphetamine 4 3 8 3 1 0 19<br />
GHB 2 0 2 3 2 0 9<br />
LSD 2 0 2 2 1 0 7<br />
Miscellaneous Hallucinogens 2 1 0 8 1 1 13<br />
Inhalants 0 1 2 1 1 0 5<br />
Combinations NTA 3 3 1 4 3 2 3 16<br />
1<br />
Includes cases related to recreational use, abuse, dependence, withdrawal, and misuse. These data represent 74.9 percent of all<br />
cases.<br />
2<br />
The unweighted data are from 25–27 Philadelphia EDs reporting to DAWN. All DAWN cases are reviewed for quality control. Based<br />
on this review, cases may be corrected or deleted and, therefore, are subject to change.<br />
3<br />
NTA=Not tabulated above.<br />
SOURCE: DAWN LIVE!, OAS, SAMHSA, updated 1/14/2005<br />
Proceedings of the Community Epidemiology Work Group, Vol. II, January 2005
<strong>EPIDEMIOLOGIC</strong> TRENDS IN <strong>DRUG</strong> <strong>ABUSE</strong>—Philadelphia<br />
Exhibit 2. Annual Mortality Cases in Philadelphia with the Presence of the 20 Most Frequently Detected<br />
Drugs by the Medical Examiner: 1994–First Half 2004<br />
ME-Identified Drugs<br />
Proceedings of the Community Epidemiology Work Group, Vol. II, January 2005 191<br />
Year<br />
1994 1995 1996 1997 1998 1999 2000 2001 2002 2003<br />
1. Cocaine 368 336 277 304 218 238 321 300 270 326 205 3,163<br />
2. Heroin/Morphine 262 318 290 336 249 236 332 316 275 208 125 2,947<br />
3. Alcohol-in-Combination 253 254 182 214 157 179 197 185 153 290 88 2,152<br />
4. Diazepam 69 44 35 58 39 67 46 56 28 66 51 559<br />
5. Phencyclidine (PCP) 46 44 29 46 19 35 48 45 51 58 20 441<br />
6. Codeine 34 39 19 20 3 15 19 45 57 120 62 435<br />
7. Methadone 23 12 26 24 10 36 36 46 55 79 57 404<br />
8. Diphenhydramine 19 13 5 4 9 25 33 53 42 116 74 392<br />
9. Oxycodone 4 2 1 14 29 17 49 53 68 81 51 369<br />
10. Propoxyphene 30 30 27 32 21 22 40 43 31 41 17 334<br />
11. Nortriptylene 14 11 15 18 24 29 20 32 32 50 20 265<br />
(tie) 12. Alprazolam 24 8 17 18 19 8 16 31 27 45 31 244<br />
(tie) 12. Amitriptylene 11 14 13 16 21 23 20 24 35 48 19 244<br />
14. Hydrocodone 6 1 9 8 15 13 27 38 31 40 23 211<br />
15. Temazepam 10 4 21 30 20 18 18 23 11 30 22 207<br />
16. Doxepin 23 8 16 6 16 29 19 18 19 21 14 189<br />
17. Fluoxetine 4 7 9 10 24 14 23 27 13 28 12 171<br />
18. Phenobarbital 18 17 15 4 10 10 18 26 5 18 19 160<br />
19. Oxazepam 5 3 9 26 19 11 12 17 11 16 24 153<br />
20. Ibuprofen 2 1 0 2 1 7 8 18 10 53 41 143<br />
Total Drugs Mentioned 1,346 1,245 1,121 1,282 1,039 1,232 1,637 1,857 1,589 2,672 1,746 16,766<br />
Total Mortality Cases 617 632 565 592 484 533 675 660 593 841 469 6,661<br />
Average Number of<br />
Drugs Per Death<br />
SOURCE: Philadelphia Medical Examiner’s Office<br />
1H<br />
2004<br />
Total<br />
2.18 1.97 1.98 2.17 2.15 2.31 2.43 2.81 2.68 3.18 3.72 2.52<br />
Exhibit 3. Causes of Annual Mortality Cases in Philadelphia, as Determined by the Medical Examiner, by<br />
Percent: 1998–First Half 2004<br />
ME-Identified Cause 1998 1999 2000 2001 2002 2003 1H 2004<br />
Adverse Effect of Drugs 60.6 55.7 56.6 56.4 57.7 30.4 32.4<br />
Overdose 3.7 3.8 2.1 3.8 2.5 6.3 8.5<br />
Violence by Another Person 10.7 9.6 13.0 10.0 11.6 17.2 15.8<br />
Violence to Oneself 7.2 6.6 5.6 6.2 5.6 10.5 8.3<br />
Other Causes 1<br />
17.8 24.3 22.7 23.6 22.6 35.6 35.0<br />
1 Other Causes include deaths with the presence of drugs caused by accident, injury, drowning, or a health or physical malady.<br />
SOURCE: Philadelphia Medical Examiner’s Office
192<br />
<strong>EPIDEMIOLOGIC</strong> TRENDS IN <strong>DRUG</strong> <strong>ABUSE</strong>—Philadelphia<br />
Exhibit 4. Treatment Admissions by Primary Drug of Abuse in Philadelphia: 1998–First Half 2004<br />
Primary Drug 1998 1999 2000 2001 2002 2003 1 1H 2004 1<br />
Cocaine 1,942 2,232 2,497 2,996 3,649 2,223 980<br />
Alcohol 1,477 1,943 1,826 2,366 3,425 1,893 809<br />
Heroin 872 2,272 2,041 4,279 2,679 2,345 1,105<br />
Other Opiates 48 46 73 92 187 174 78<br />
Marijuana 791 862 910 1,428 2,025 1,445 663<br />
PCP 32 49 43 74 188 141 70<br />
Other Hallucinogens 9 9 7 12 12 7 5<br />
Methamphetamine/<br />
Amphetamines<br />
31 33 27 83 67 33 19<br />
Benzodiazepines 32 46 37 89 66 67 19<br />
Other Tranquilizers 6 4 8 1 3 3 2<br />
Barbiturates 13 8 3 8 23 13 11<br />
Other Sedatives/Hypnotics 13 18 16 36 19 20 6<br />
Inhalants 2 0 4 1 0 0 0<br />
Over-the-Counter 7 24 5 2 2 4 3<br />
Other (Not Listed) 17 1 60 154 111 253 110<br />
Total 5,292 7,547 7,557 11,621 12,456 8,621 3,880<br />
1 Data for these time periods are preliminary and subject to revision.<br />
SOURCE: Pennsylvania Department of Health, Client Information System<br />
Exhibit 5. Cocaine Treatment Admissions in Philadelphia by Route of Administration and Gender:<br />
2000–First Half 2004<br />
2000 2001 2002 2003 1 1H 2004 1<br />
Route of Administration<br />
and<br />
Gender<br />
Smoked<br />
No. (%) No. (%) No. (%) No. (%) No. (%)<br />
Male 1,112 (44.5) 1,377 (46.0) 1,802 (49.4) 1,014 (45.6) 459 (46.8)<br />
Female<br />
Intranasal<br />
1,002 (40.1) 1,039 (34.7) 1,212 (33.2) 785 (35.3) 321 (32.8)<br />
Male 198 (7.9) 371 (12.4) 384 (10.5) 256 (11.5) 135 (13.8)<br />
Female<br />
Injected<br />
104 (4.2) 140 (4.7) 139 (3.8) 105 (4.7) 37 (3.8)<br />
Male 38 (1.5) 30 (1.0) 28 (0.8) 37 (1.7) 12 (1.2)<br />
Female<br />
Other/Unknown<br />
12 (0.5) 14 (0.5) 8 (0.2) 8 (0.4) 4 (0.4)<br />
Male 16 (0.6) 18 (0.6) 71 (1.9) 8 (0.4) 7 (0.7)<br />
Female 15 (0.6) 7 (0.2) 5 (0.1) 10 (0.4) 5 (0.5)<br />
Total Male 1,364 (54.6) 1,796 (59.9) 2,285 (62.6) 1,316 (59.2) 613 (62.6)<br />
Total Female 1,133 (45.4) 1,200 (40.1) 1,364 (37.4) 908 (40.8) 367 (37.4)<br />
Total 2,497 2,996 3,649 2,223 980<br />
1 Data for these time periods are preliminary and subject to revision.<br />
SOURCE: Pennsylvania Department of Health, Client Information System<br />
Proceedings of the Community Epidemiology Work Group, Vol. II, January 2005
<strong>EPIDEMIOLOGIC</strong> TRENDS IN <strong>DRUG</strong> <strong>ABUSE</strong>—Philadelphia<br />
Exhibit 6. Heroin, Illegal Methadone, and Other Opiate Treatment Admissions in Philadelphia by Route of<br />
Administration and Gender: 2000–First Half 2004<br />
2000 2001 2002 2003 1 1H 2004 1<br />
Route of Administration<br />
and Gender No. (%) No. (%) No. No. No. (%) No. (%)<br />
Injected<br />
Male<br />
Female<br />
Intranasal<br />
Male<br />
Female<br />
Swallowed<br />
Male<br />
Female<br />
Smoked<br />
Male<br />
Female<br />
Other/Unknown<br />
Male<br />
Female<br />
Total Male<br />
Total Female<br />
870<br />
408<br />
411<br />
266<br />
45<br />
42<br />
37<br />
11<br />
(41.2)<br />
(19.3)<br />
(19.4)<br />
(12.6)<br />
(2.1)<br />
(2.0)<br />
(1.8)<br />
(0.5)<br />
1,917<br />
805<br />
733<br />
577<br />
99<br />
55<br />
63<br />
40<br />
(43.9)<br />
(18.4)<br />
(16.8)<br />
(13.2)<br />
(2.3)<br />
(1.3)<br />
(1.4)<br />
(0.9)<br />
1,219<br />
541<br />
(42.5)<br />
(18.9)<br />
Proceedings of the Community Epidemiology Work Group, Vol. II, January 2005 193<br />
564<br />
260<br />
114<br />
66<br />
44<br />
17<br />
(19.7)<br />
(9.1)<br />
(4.0)<br />
(2.3)<br />
(1.5)<br />
(0.6)<br />
974<br />
519<br />
479<br />
247<br />
113<br />
64<br />
35<br />
15<br />
(38.7)<br />
(20.6)<br />
(19.0)<br />
(9.8)<br />
(4.5)<br />
(2.5)<br />
(1.4)<br />
(0.6)<br />
431<br />
228<br />
225<br />
113<br />
40<br />
31<br />
12<br />
7<br />
(36.4)<br />
(19.3)<br />
(19.0)<br />
(9.6)<br />
13 (0.6) 49 (1.1) 32 (1.1) 48 (1.9) 59 (5.0)<br />
11 (0.5) 33 (0.8) 9 (0.3) 25 (1.0) 37 (3.1)<br />
1,376 (65.1) 2,861 (65.5) 1,973 (68.8) 1,649 (65.5) 767 (64.8)<br />
738 (34.9) 1,510 (34.5) 893 (31.2) 870 (34.5) 416 (35.2)<br />
Total 2,114 4,371 2,866 2,519 1,183<br />
1 Data for these time periods are preliminary and subject to revision.<br />
SOURCE: Pennsylvania Department of Health, Client Information System<br />
Exhibit 7. Adult AIDS Cases in Philadelphia by Exposure Category: Fiscal Year 2004 and Cumulative<br />
Totals Through June 30, 2004<br />
Exposure<br />
July 1, 2003, to June 30, 2004 November 1, 1981, to June 30, 2004<br />
Category Number Percent Number Percent<br />
IDU 294 (29.5) 6,121 (35.9)<br />
MSM and IDU 21 (2.1) 885 (5.2)<br />
MSM 252 (25.3) 6,435 (37.8)<br />
Heterosexual Contact<br />
426 (42.7) 3,282 (19.3)<br />
Blood Products 3 (0.3) 92 (0.5)<br />
No Identified Risk<br />
Factor<br />
1 (0.1) 213 (1.3)<br />
Total Adult Cases 997 (100.0) 17,028 (100.0)<br />
SOURCE: Philadelphia Department of Public Health, AIDS Activities Coordinating Office<br />
(3.4)<br />
(2.6)<br />
(1.0)<br />
(0.6)
<strong>EPIDEMIOLOGIC</strong> TRENDS IN <strong>DRUG</strong> <strong>ABUSE</strong>—Phoenix and Arizona<br />
Drug Abuse Trends in Phoenix and Arizona<br />
Ilene L. Dode, Ph.D. 1<br />
ABSTRACT<br />
During fiscal year 2004, 36,375 adults and children<br />
received treatment in the Arizona Department of<br />
Health Services behavioral health system for substance<br />
use, abuse, or dependence. Of this total, 66<br />
percent were served through the AHCCCS (Medicaid)<br />
program. Cocaine/crack cocaine continues to<br />
be readily available in Phoenix. A new strain of<br />
coca plant has reportedly been developed that will<br />
yield up to four times more cocaine. Law enforcement<br />
agencies report an increase in the demand for<br />
heroin the last two quarters. Heroin purity ranged<br />
from 42 to 85 percent. With higher purities, some<br />
users may now snort or smoke the purer form of<br />
heroin. Prices for most quantities of heroin decreased<br />
during the last two quarters. Law enforcement<br />
continues to investigate Internet pharmacies<br />
and physicians. Marijuana continues to be widely<br />
available throughout Arizona. In FY 2004, 21 percent<br />
of Arizona treatment admissions were for<br />
methamphetamine use/abuse, compared to 11 percent<br />
in FY 2002. ‘Quick Zip’ is unwashed, or not<br />
fully processed, methamphetamine.<br />
INTRODUCTI<strong>ON</strong><br />
Area Description<br />
The Valley of the Sun covers more than 400 square<br />
miles. The thriving Phoenix metropolitan area encompasses<br />
more than 20 communities, including Chandler,<br />
Gilbert, Glendale, Mesa, Phoenix, Scottsdale, and<br />
Tempe. The Census Bureau’s 2003 estimate shows<br />
that Maricopa County has 3.34 million people, compared<br />
to 2.86 million people in 1998. The population is<br />
78.6 White, 3.8 percent Black/African-American, 2.6<br />
percent Asian, 1.9 percent Native American, and 13.2<br />
percent “other.” Hispanic/Latinos represent 28.1 percent<br />
of the total for two or more races.<br />
Author Lawrence Clark Powell captured the essence<br />
of the Nation’s sixth-largest State when he said, “One<br />
has only to look down from above to see that Arizona<br />
is a deeply wrinkled old land of interminable mountains,<br />
river valleys and desert plains. The sight of<br />
running water is rare. Dryness is obvious.” In addition<br />
to its aridness, the land is also characterized by<br />
the dominance of public land ownership. Federal,<br />
1 1The The author is affiliated affiliated with with EMPACT–Suicide EMPACT–Suicide Prevention Prevention Center, Phoenix, Phoenix, Arizona.<br />
194<br />
State, and tribal governments own more than 80 percent<br />
of Arizona.<br />
Arizona ranks 18th in population (5,743,834) according<br />
to 2003 Census Bureau estimates. It is the eighthmost<br />
urban State. Arizona is sixth in the percentage of<br />
residents who speak a language other than English at<br />
home. Arizona is younger than the Nation as a whole,<br />
with a median age of 34.2, compared with 35.3 nationally.<br />
The median price for an existing home in 2003<br />
was $152,800, compared to $574,300 in San Francisco.<br />
The U.S. median price was $172,200. Arizona<br />
(54.3 percent) ranked second behind Nevada (75.1<br />
percent) for job growth for 1990–2003 according to<br />
the U.S. Bureau of Labor Statistics.<br />
Crime is a critical issue for metropolitan Phoenix and<br />
Tucson, compared with the other 300 U.S. metropolitan<br />
areas ranked by the Federal Bureau of Investigation<br />
(FBI). According to the FBI, Arizona had the<br />
highest rate of serious crime of any State. Tucson had<br />
a rate of 7,699.9 crimes per 100,000 population,<br />
ranking second in total crime in 2003.<br />
In 2003, Arizona ranked 10th among States in the<br />
percentage of residents without health insurance and<br />
4th in the number of low-income children without<br />
health insurance. Just over 17 percent of Arizonans<br />
lack insurance.<br />
Data Sources<br />
This report is based on the most recent available data<br />
obtained from the following sources:<br />
• Drug-induced and drug-related death data<br />
were provided by the Maricopa County Medical<br />
Examiner (ME) Office for January 1993–October<br />
2003. All 2003 data are estimated because ME<br />
data for July and August 2003 were not available.<br />
• Emergency department (ED) drug data were<br />
accessed from the Drug Abuse Warning Network<br />
(DAWN) Live!, a restricted-access online<br />
query system administered by the Office of Applied<br />
Studies (OAS), Substance Abuse and Mental<br />
Health Services Administration (SAMHSA), for<br />
2003 and 2004. The 2003 data were accessed on<br />
December 31, 2004; the 2004 data were accessed<br />
on January 18, 2005. In the Phoenix metropolitan<br />
Proceedings of the Community Epidemiology Work Group, Vol. II, January 2005
area, all 25 eligible hospitals are in the DAWN<br />
sample: 26 EDs are in the sample. (One hospital<br />
has more than one ED.) The data are incomplete.<br />
In 2004, between 11 and 14 EDs reported each<br />
month. All DAWN cases are reviewed for quality<br />
control, and, based on the review, cases may be<br />
corrected or deleted; therefore, the data reported in<br />
this paper are subject to change. The data are unweighted<br />
and are not estimates for the Phoenix<br />
area. Data are presented in exhibit 2 for ED cases,<br />
with both demographic and visit characteristics<br />
described. Most data presented focus on drug reports<br />
in 2004. Drug reports exceed the number of<br />
visits, since a patient may report use of multiple<br />
drugs (up to six drugs plus alcohol). These data<br />
cannot be compared with DAWN ED data for<br />
2002 and before, nor can they be used for comparison<br />
with future data accessed through<br />
DAWN Live!. Only weighted data released by<br />
SAMHSA can be used in trend analysis. A full<br />
description of DAWN can be found at<br />
.<br />
• Drug treatment data for the State overall were<br />
provided by the Arizona Department of Health<br />
Services (ADHS), Division of Behavioral Health<br />
Services (DBHS), Bureau of Substance Abuse<br />
Treatment and Prevention Services, through fiscal<br />
year (FY) 2004; treatment admissions of adults<br />
and juveniles to the Treatment and Assessment<br />
Screening Center (TASC) programs in Phoenix<br />
were derived from the Maricopa County Juvenile<br />
Probation Program’s report and the Adult Deferred<br />
Prosecution Program’s Cumulative Statistical<br />
Report through 2004; and data on admissions<br />
to detoxification treatment from July 2003 to December<br />
2004 were provided by Community<br />
Bridges—East Valley Addiction Council.<br />
• Law enforcement data were provided by the<br />
Drug Enforcement Administration (DEA), Phoenix<br />
Office, in their report “Trends in Traffic,”<br />
Fourth Quarter FY 2004. Additional information<br />
was obtained from the U.S. Customs Service; the<br />
Arizona High Intensity Drug Trafficking Area<br />
(HIDTA) Task Force; the FBI, Uniform Crime<br />
Reports, Crime in the United States, 2002; and the<br />
Maricopa County Methamphetamine Task Force.<br />
• Drug price and purity data were provided by<br />
the DEA Phoenix Division Offices; the U.S.<br />
Customs Service; Arizona Department of Public<br />
Safety; Phoenix Police Department; the Maricopa<br />
County Sheriff’s Department; and Narcotics<br />
Digest Weekly, Special Issue, Illicit Drug<br />
Prices January–June 2004, July 20, 2004.<br />
<strong>EPIDEMIOLOGIC</strong> TRENDS IN <strong>DRUG</strong> <strong>ABUSE</strong>—Phoenix and Arizona<br />
• Data on drug-endangered children were obtained<br />
from the Arizona Office of the Attorney<br />
General for 2004.<br />
• Human immunodeficiency virus (HIV) and<br />
acquired immunodeficiency syndrome (AIDS)<br />
data were obtained from the Arizona DHS, Division<br />
of Public Health Services, Bureau of Epidemiology<br />
and Disease Control, Office of HIV/STD<br />
Services, Annual Report, March 2004.<br />
• General information on the Phoenix area was<br />
obtained from the National Association of Realtors,<br />
Fourth Quarter Report for Existing Homes,<br />
2003, and the U.S. Census Bureau, Fact Sheet<br />
2003, American Community Survey.<br />
<strong>DRUG</strong> <strong>ABUSE</strong> PATTERNS AND TRENDS<br />
Special Considerations: DAWN ED Data<br />
Unweighted data accessed from DAWN Live! reveal<br />
drug cases by type, as follows: malicious poisoning<br />
(0.4 percent), overmedication (21.0 percent), underage<br />
drinking (4.0 percent), adverse reaction (20.0<br />
percent), accidental ingestion (2.0 percent), suicide<br />
attempt (6.0 percent), seeking detoxification (5.0 percent),<br />
and other (42.0 percent) (exhibit 1).<br />
The unweighted data from DAWN Live! presented<br />
patient and visit characteristics for 2003 and 2004. A<br />
comparison of cases for 2003 and 2004 revealed 43<br />
percent more identified cases for 2004—6,103 versus<br />
10,709 (exhibit 2).<br />
Special Considerations: Treatment Data<br />
During State FY 2004, 36,375 adults and children received<br />
treatment in the ADHS/DBHS behavioral<br />
health system for substance use, abuse, or dependence.<br />
The ADHS/DBHS behavioral health system reported<br />
that an increasing number of individuals who received<br />
substance abuse treatment were eligible for treatment<br />
services through Arizona’s Title XIX/XXI (AHCCCS<br />
– Arizona Health Care Cost Containment System –<br />
Medicaid) program. Eligibility was expanded in October<br />
2001. Since October 2001, the proportion of<br />
AHCCCS-eligible substance abuse treatment participants<br />
increased from 29 percent in FY 2001 to 66 percent<br />
in FY 2004 (exhibit 3).<br />
ADHS/DBHS data reveal 76.2 percent (27,619) of<br />
adults and 25.2 percent of youth in treatment were<br />
White in FY 2004. An additional 11.8 percent (4,289)<br />
of adults and 10.7 percent of youth were Hispanic/<br />
Latino in cases in which race/ethnicity was specified.<br />
Proceedings of the Community Epidemiology Work Group, Vol. II, January 2005 195
ADHS/DBHS reported that more than one-half (59<br />
percent) of all clients who received substance abuse<br />
treatment services were between the ages of 25 and<br />
44 (21,420) in FY 2004 (exhibit 4). Males continued<br />
to represent the largest gender group entering substance<br />
abuse treatment. Males accounted for 80.2<br />
percent of youth and 67.1 percent of adult treatment<br />
participants during FY 2004. DBHS reported that<br />
women with children represent a growing segment of<br />
the treatment caseload. In FY 2004, approximately 20<br />
percent of women who received substance abuse<br />
treatment had young children with them at admission.<br />
During State FY 2004, the ADHS/DBHS Bureau for<br />
Substance Abuse Treatment and Prevention treatment<br />
services reported that individual, family, and group<br />
counseling represented the largest category of expenditures<br />
for substance abuse services (29 percent),<br />
followed by expenditures for support services that<br />
include case management, peer support, and transportation<br />
(18 percent); crisis and detoxification services<br />
(17 percent); and medical pharmacy costs (17 percent)<br />
(exhibit 5).<br />
Self-referral was identified by 63 percent of treatment<br />
participants in the ADHS/DBHS public behavioral<br />
health system. Twelve percent were referred by a<br />
Federal agency, such as the Veterans Administration<br />
or Indian Health Service, and 11.5 percent were referred<br />
by a criminal justice agency. Criminal justice<br />
referrals accounted for a far larger proportion of total<br />
referrals to the Regional Behavioral Health Authorities<br />
serving rural regions of the State compared with<br />
the more urban areas.<br />
During FY 2004, more than one-half of individuals<br />
admitted to substance abuse treatment were identified<br />
with a primary diagnosis of drug or alcohol<br />
abuse/dependence (59.7 percent). Approximately 13<br />
percent of participants were identified with a cooccurring<br />
mental health issue in addition to a substance<br />
use disorder, including depression (7.7 percent),<br />
anxiety (2 percent), suicide risk (2 percent), or<br />
psychosis (1.2 percent) (exhibit 6).<br />
Cocaine/Crack<br />
The peak year for cocaine-related deaths was 1999<br />
(n=215), but deaths have declined each year to a projected<br />
low of 63 deaths for 2003.<br />
Unweighted data accessed from DAWN Live! reflect<br />
the major substances of abuse and misuse for 2004.<br />
There were 1,560 cocaine DAWN reports that year<br />
(exhibit 7).<br />
196<br />
<strong>EPIDEMIOLOGIC</strong> TRENDS IN <strong>DRUG</strong> <strong>ABUSE</strong>—Phoenix and Arizona<br />
Of those who presented for treatment to the<br />
ADHS/DBSH system in FY 2004, 9 percent reported<br />
cocaine as their primary drug (exhibit 8).<br />
During FY 2004, Community Bridges detoxification<br />
and recovery clinics served a total of 13,337 individuals.<br />
Of this total, 1 percent reported cocaine use<br />
and 4 percent reported crack use. Between July 1 and<br />
December 31, 2004, 6,586 clients were served, and<br />
cocaine and crack use combined represented 9.2 percent<br />
of this total. Crack use was twice as common as<br />
reported cocaine use.<br />
The TASC Adult Deferred Prosecution Program cumulative<br />
data do not reflect any change in the percentage<br />
of admissions for cocaine treatment. Through<br />
December 31, 2004, 28.7 percent (4,576) of admissions<br />
were for cocaine treatment (exhibit 9a). Six<br />
percent of juveniles tested positive for cocaine during<br />
October–December 2004 (exhibit 9b).<br />
During FY 2004, the DEA laboratory analyzed approximately<br />
75 samples from cocaine seizures. Purities<br />
ranged from 31 to 96 percent, with an average<br />
purity of 74 percent. Prices for an ounce of cocaine<br />
powder dropped slightly in FY 2004 from the previous<br />
reporting period (FY 2001). In Phoenix, the<br />
ounce price dropped from $500–$800 to $450–$650<br />
(exhibit 10). The price for a kilogram dipped slightly<br />
from $15,000–$17,000 to $13,500–$15,000.<br />
Crack cocaine continues to be readily available in the<br />
Phoenix metropolitan area. A rock continues to sell<br />
for $20. The National Drug Intelligence Center reported<br />
a wholesale price of $7,500 for a pound.<br />
The DEA reports the possibility of an increase in the<br />
availability and purity of cocaine in the next few<br />
months because of the introduction of a new strain of<br />
coca plant that has been reported to yield up to four<br />
times more cocaine. The Colombian drug cartels reportedly<br />
have spent approximately $106,000,000 in<br />
research and development to bring the new product to<br />
the market. Through crossbreeding strains from Peru<br />
with potent Colombian varieties and using genetic<br />
engineering, the new strain grows to more than 10<br />
feet tall and maintains a higher purity.<br />
Most of the crack cocaine in Phoenix is off-white to<br />
light yellowish color and has been “cooked” in a Tupperware-style<br />
bowl in a microwave. Once cooked, it is<br />
broken up into chunks, put into baggies, and sold in<br />
quantities ranging from “rocks” to ounces. In the African-American<br />
community, half-ounce quantities are<br />
referred to as “half birds,” and ounce quantities are<br />
called “full birds.”<br />
Proceedings of the Community Epidemiology Work Group, Vol. II, January 2005
Heroin and Morphine<br />
After 2 years of morphine-related deaths declining,<br />
an increase of 18.4 percent was projected for 2003.<br />
In DAWN Live! unweighted data, there were 732<br />
reports in which heroin was the major substance of<br />
abuse in 2004 (exhibit 7).<br />
Heroin and other opiates were identified by 11 percent<br />
of individuals in Arizona who sought treatment<br />
through the Division of Behavioral Health Services in<br />
2004 (exhibit 8). The Community Bridges data consistently<br />
show that 10 percent of individuals who<br />
seek services at the clinics report use of heroin and<br />
other opiates.<br />
Law enforcement agencies report an increase in the<br />
demand for heroin during the last two quarters. Black<br />
tar and Mexican brown powder heroin are readily<br />
available. Purity levels remained relatively constant<br />
throughout FY 2004. Purity levels ranged between 42<br />
and 85 percent, with an average purity of 55 to 58<br />
percent. It has been speculated that users may now<br />
snort or smoke the purer form of heroin.<br />
Phoenix and Tucson continue to serve as transshipment<br />
and distribution points for Mexicanproduced<br />
heroin smuggled into Arizona. According<br />
to the Phoenix DEA, raw opium gum is being purchased<br />
from ranchers in mountain areas of Mexico.<br />
The drug organizations are then processing the raw<br />
opium gum into a heroin base that is stored in jars.<br />
Reportedly, 1 kilogram of raw opium gum sells for<br />
$1,000–$1,500. It takes approximately 8 kilograms of<br />
opium gum to process into 1 kilogram of brown<br />
powder heroin.<br />
Between FY 2001 and FY 2004, prices for heroin in<br />
Phoenix decreased for all quantities, except for a<br />
“20” or “BB,” which sold for $20 in both periods.<br />
The Phoenix DEA, U.S. Customs, Arizona Department<br />
of Public Safety, Phoenix Police Department,<br />
and the Maricopa County Sheriff Department reported<br />
an ounce selling for $750–$900 during the<br />
fourth quarter of FY 2004 (exhibit 10). It had sold for<br />
$950–$1,000 in June 2003. Wholesale prices for a<br />
kilogram dropped from $42,000–$50,000 in June<br />
2003 to $28,000–$35,000.<br />
The Phoenix DEA office reported the cost of 1 kilogram<br />
of South American heroin to be $52,000.<br />
Other Opiates<br />
In the unweighted DAWN Live! data for 2004, there<br />
were 1,055 reports of drug misuse for opiates/opi-<br />
<strong>EPIDEMIOLOGIC</strong> TRENDS IN <strong>DRUG</strong> <strong>ABUSE</strong>—Phoenix and Arizona<br />
oids, 207 cases for hydrocodone, and 298 cases for<br />
oxycodone (exhibit 11).<br />
ADHS/DBHS reported 3 percent of Arizona admissions<br />
for primary substances abuse were for “all<br />
other” drugs during FY 2004 (exhibit 8). The TASC<br />
Adult Deferred Prosecution Program reported 5.1<br />
percent of admissions were for other opiates (exhibit<br />
9a). The Community Bridges program reported 4.8<br />
percent of admissions for the first half of FY 2005<br />
(July–December 2004) were for other opiates.<br />
Law enforcement continues to investigate Internet<br />
pharmacies and physicians. To date, one pharmacy<br />
and three physicians have been involved with seven<br />
Internet Web sites. Seizures of assets (mostly cash)<br />
total more than $1,200,000. Federal indictments are<br />
being sought against the Web site operators, owners<br />
of the participating pharmacies, and the physicians.<br />
A naturopathic physician was convicted on 185<br />
counts of illegal distribution of controlled substances.<br />
The physician was ordered to surrender his DEA<br />
Registration. The physician issued controlled substances<br />
without conducting physical examinations,<br />
diagnostic tests, or patient histories. The patients paid<br />
$60 per prescription for OxyContin, Dilaudid, morphine,<br />
and hydrocodone in quantities ranging from 80<br />
to 120 tablets for each prescription. The patients returned<br />
several times a week for additional prescriptions<br />
in the same quantities.<br />
Law enforcement agencies report OxyContin selling<br />
for $20–$25 per 40-milligram tablet and $20–$80 per<br />
80-milligram tablet. The price for one tablet of Percocet<br />
was $5, and one tablet of Vicodin ES sold for<br />
$5 (exhibit 10).<br />
Marijuana<br />
Unweighted data accessed from DAWN Live! show<br />
that there were 1,089 reports of marijuana in 2004<br />
(exhibit 7).<br />
ADHS/DBHS data revealed 12 percent of individuals<br />
who sought treatment during FY 2004 were for marijuana<br />
use/abuse (exhibit 8). The TASC Adult Deferred<br />
Prosecution Program reported 23.3 percent of<br />
admissions reported marijuana use/abuse from March<br />
1989 to December 2004 (exhibit 9a).<br />
The TASC Client Drug Test Results Summary for<br />
Maricopa County Juvenile Probation for October<br />
through December 2004 reported 73 percent (n=3,064<br />
of 4,214) tested positive for tetrahydrocannabinol<br />
(THC) (exhibit 9b).<br />
Proceedings of the Community Epidemiology Work Group, Vol. II, January 2005 197
Marijuana is widely available in Arizona in quantities<br />
up to hundreds of kilograms, unchanged from the previous<br />
reporting period. Prices were unchanged from<br />
the previous reporting period, as well, according to the<br />
Arizona HIDTA, the Arizona Department of Public<br />
Safety, Southwest Border Alliance, and the Arizona<br />
Drug Enforcement Administration (exhibit 10).<br />
Adolescent males, age 15–17, from the communities<br />
along the southern border of Arizona are recruited as<br />
drivers by trafficking organizations to move marijuana<br />
loads. Most are Hispanic males who are U.S.<br />
citizens with and without driver’s permits or licenses.<br />
Stimulants<br />
The drug-related death data revealed a 17-percent<br />
decrease in 2002 for methamphetamine-related<br />
deaths (n=132) over such deaths in 2001. The downward<br />
trend would appear to be continuing during<br />
2003. Methamphetamine/combination deaths totaled<br />
35 in 2001, rose to 44 in 2002, and were projected to<br />
increase to 71 for 2003 for a 103-percent increase<br />
over 2001.<br />
In the 2004 unweighted data from DAWN Live!, there<br />
were 1,293 reports of methamphetamine and 774 of<br />
amphetamines (exhibit 7).<br />
The ADHS/DBHS Bureau for Substance Abuse<br />
Treatment and Prevention data revealed 21 percent of<br />
Arizona treatment admissions were for methamphetamine<br />
use/abuse in FY 2004 (exhibit 8). The growth of<br />
methamphetamine as the presenting primary problem<br />
in the public behavioral health system is striking. During<br />
FY 2002, methamphetamine accounted for just 11<br />
percent of substances identified at admission to treatment,<br />
compared with 21 percent in FY 2004. Little<br />
variation exists between urban and rural areas, with the<br />
exception of Pima County (Tucson), where 11.1 percent<br />
of treatment admissions reported methamphetamine<br />
as the primary presenting problem.<br />
A statistical summary of the TASC Adult Deferred<br />
Prosecution Program revealed that 26.9 percent<br />
(n=4,298) of the March 1989 through December 2004<br />
treatment admissions were for methamphetamine<br />
use/abuse (exhibit 9a). During October–December<br />
2004, 19.5 percent of the juveniles (n=819) who submitted<br />
for drug testing at TASC tested positive for<br />
methamphetamine/amphetamine (exhibit 9b).<br />
Community Bridges detoxification and recovery centers<br />
serve the homeless, indigent, and working poor<br />
individuals and families in Maricopa County. Thirteen<br />
percent of admissions to Community Bridges<br />
198<br />
<strong>EPIDEMIOLOGIC</strong> TRENDS IN <strong>DRUG</strong> <strong>ABUSE</strong>—Phoenix and Arizona<br />
during FY 2004 reported methamphetamine as the<br />
drug of choice.<br />
The DEA reported two types of methamphetamine<br />
are available throughout Arizona. Mexican methamphetamine<br />
is most predominant. It is produced in<br />
large volume (kilogram and pound quantities) at super<br />
labs located in Mexico and is transported primarily<br />
through Sonora, Mexico, into Arizona. Mexico<br />
has surpassed California as the major source of<br />
methamphetamine moving into Arizona. While small<br />
independent labs generate gram and ounce quantities,<br />
they are considered a viable threat to Arizona.<br />
An Arizona HIDTA summary of methamphetamine<br />
and drug-endangered children statistics for calendar<br />
years 2000–2004 indicate 1,263 methamphetamine<br />
lab-related seizures and 793 methamphetamine lab<br />
seizures for reported disposal costs of $3,841,069.<br />
There were 250 children in Maricopa County and 362<br />
statewide who were removed from clandestine laboratory<br />
locations during the report years.<br />
The most significant change in price for methamphetamine<br />
was for a pound of crystal methamphetamine<br />
(ice) in Tucson. The previous price had been<br />
$13,000 for ice, compared to $7,000–$7,500 during<br />
FY 2004 (exhibit 10).<br />
The drug of choice in Yuma County (in the southwestern<br />
region of State, on the border with Mexico)<br />
is crystal methamphetamine. It is relatively low cost,<br />
and availability is plentiful. The Regional Behavioral<br />
Health Authority in this region of the State receives<br />
the greatest number of criminal justice referrals for<br />
treatment (58 percent).<br />
The Maricopa County Sheriff’s Office reports that<br />
the packaging of methamphetamine has changed<br />
dramatically the past year. Officers report it is nearly<br />
impossible to identify the type of methamphetamine<br />
that is seized. Laboratory analysis is needed to determine<br />
whether it is Mexican or U.S. made. Wrapping<br />
of Mexican methamphetamine previously was<br />
professional, with markings or insignias of ownership.<br />
It is now reported to be sloppily packaged in<br />
unmarked plastic bags. Conversely, the locally produced<br />
methamphetamine is now packaged using professional<br />
wrapping methods.<br />
A new slang name for methamphetamine surfaced in<br />
the DEA fourth quarter report. “Quick Zip” is unwashed,<br />
or not fully processed, methamphetamine. It<br />
was first identified by sources within the prison<br />
population. The drug allegedly causes increased psychosis<br />
when consumed.<br />
Proceedings of the Community Epidemiology Work Group, Vol. II, January 2005
Glotell, a new product in the agricultural market, can<br />
be added to tanks of anhydrous ammonia, a precursor<br />
chemical for methamphetamine production. Glotell is<br />
intended to deter thieves and methamphetamine cooks<br />
from stealing the ammonia because it produces a visible<br />
pink stain when mixed. When used to make<br />
methamphetamine, it produces a highly undesirable<br />
effect.<br />
Locally, an experienced methamphetamine cook became<br />
an entrepreneur and earned $25,000 to teach<br />
methamphetamine processing methods to interested<br />
traffickers. Additionally, the cook charged $10,000 for<br />
every 10 pounds of finished product manufactured.<br />
Other Drugs<br />
The DEA Diversion unit reported the most commonly<br />
abused drugs are Vicodin, Lortab, and other<br />
hydrocodone products; Percocet, OxyContin, and<br />
other oxycodone products; benzodiazepines; methadone;<br />
hydromorphone, morphine; Demerol; codeine<br />
products; and anabolic steroids. Soma in combination<br />
with other analgesic controlled substances, Ultram<br />
(Tramadol), and Nubain continue to be highly abused<br />
prescription-only substances. Soma sells for $2–$5<br />
per tablet.<br />
The unweighted data from DAWN Live! reflect 843<br />
benzodiazepine reports and 243 muscle relaxant reports<br />
for pharmaceutical drug misuse in 2004 (exhibit 11).<br />
Treatment programs that serve adolescents report<br />
anecdotally that gamma hydroxybutyrate (GHB),<br />
methylenedioxymethamphetamine (MDMA or ecstasy),<br />
lysergic acid diethylamide (LSD), Coricidin<br />
HBP, and Soma are still party drugs.<br />
INFECTIOUS DISEASES RELATED TO <strong>DRUG</strong> <strong>ABUSE</strong><br />
The Arizona Department of Health Services, Division<br />
of Public Health Services, Bureau of Epidemiology<br />
and Disease Control, Office of HIV/STD Services<br />
began to emphasize capacity building measures<br />
within the State HIV/AIDS epidemiology programs<br />
and to focus on incidence and prevalence estimates.<br />
The March 2004 Annual Report is the most recent<br />
report and was reported on in the June 2004 CEWG<br />
report (exhibits 12a and 12b).<br />
According to the March 2004 report, Arizona had<br />
9,652 persons known to be living with HIV disease,<br />
of whom 4,402 had a diagnosis of AIDS. The State<br />
has an HIV disease prevalence rate of 184.1 per<br />
<strong>EPIDEMIOLOGIC</strong> TRENDS IN <strong>DRUG</strong> <strong>ABUSE</strong>—Phoenix and Arizona<br />
100,000 persons. Pima County, the State’s second<br />
most populous urban county, has the highest prevalence<br />
rate of reported HIV disease (212 per 100,000).<br />
Pima County, with 16.4 percent of the State’s population,<br />
has 19.7 percent of known AIDS prevalence and<br />
18.1 percent of known HIV prevalence. Maricopa<br />
County, the State’s most populous urban county, has<br />
the second highest prevalence rate of reported HIV<br />
Disease (207 per 100,000). With 60 percent of the<br />
State’s population, it has 67.8 percent of known<br />
AIDS prevalence and 66.7 percent of known HIV<br />
prevalence.<br />
The predominant reported mode of transmission of<br />
HIV in Arizona continues to be men having sex with<br />
men, which accounted for 70.3 percent of reported<br />
new cases of HIV disease among males (HIV or<br />
AIDS) and 62.6 percent of all reported new cases of<br />
HIV disease in 2003. After male-to-male sex, injection<br />
drug use, with or without male-to-male sex, accounted<br />
for 20.1 percent, and heterosexual exposure<br />
accounted for 11.1 percent of reported new cases of<br />
HIV disease during 2003.<br />
SPECIAL REPORT<br />
The Correctional Officer/Offender Liaison (COOL)<br />
program was established in 1998 to better serve the<br />
substance abuse and behavioral health service needs<br />
of high-risk offenders on parole. Funding is provided<br />
through an Interagency Services Agreement between<br />
the Arizona Department of Corrections (ADOC) and<br />
Arizona Department of Health Services to ensure<br />
rapid access to treatment and recovery support services.<br />
In FY 2004, the COOL report revealed referrals<br />
and intakes approached but did not surpass FY<br />
2003 figures (exhibit 13).<br />
The COOL Program expedites eligibility screening<br />
for AHCCCS and provides rapid connections to<br />
treatment and other re-entry services. During FY<br />
2004, parole officers referred 5,953 persons leaving<br />
prison to the COOL program through 1 of the 5 Regional<br />
Behavioral Health Authorities. Seventy-three<br />
percent (n= 4,330) of those referred were subsequently<br />
enrolled in substance abuse treatment. The<br />
ADOC/ADHS collaboration also operates 20 transitional<br />
housing beds for homeless offenders in the<br />
COOL program in Maricopa County. The housing<br />
program also coordinates community services, employment<br />
support, substance abuse treatment, and<br />
temporary housing to assist in the reintegration of<br />
offenders.<br />
For inquiries concerning this report, please contact Ilene L. Dode, Ph.D., EMPACT–Suicide Prevention Center, Inc., 1232 East Broadway, Suite<br />
120, Tempe, Arizona 85282, Phone (480) 784-1514, Fax: (480) 967-3528, E-mail: idode@aol.com.<br />
Proceedings of the Community Epidemiology Work Group, Vol. II, January 2005 199
<strong>EPIDEMIOLOGIC</strong> TRENDS IN <strong>DRUG</strong> <strong>ABUSE</strong>—Phoenix and Arizona<br />
Exhibit 1. Percentages 1 of DAWN ED Cases in Phoenix, by Type (Unweighted 2 ): 2004<br />
200<br />
Seeking detox, 5.0%<br />
Accidental ingestion,<br />
2.0%<br />
Suicide attempt, 6.0%<br />
Other, 42.0%<br />
Adverse reaction, 20.0%<br />
Underage drinking ,<br />
4.0%<br />
Overmedication , 21.0%<br />
Malicious poisoning,<br />
0.4%<br />
1 Percentages rounded.<br />
2 The unweighted data are from 11–14 Phoenix EDs reporting to DAWN in 2004. All DAWN cases are reviewed for quality control.<br />
Based on this review, cases may be corrected or deleted and, therefore, are subject to change.<br />
SOURCE: DAWN Live!, OAS, SAMHSA, updated January 18, 2005<br />
Proceedings of the Community Epidemiology Work Group, Vol. II, January 2005
<strong>EPIDEMIOLOGIC</strong> TRENDS IN <strong>DRUG</strong> <strong>ABUSE</strong>—Phoenix and Arizona<br />
Exhibit 2. DAWN ED Cases in Phoenix, by Patient and Visit Characteristics (Unweighted 1 ): 2003 and 2004<br />
Characteristic 2003 2004<br />
Gender<br />
Male 3,167 5,394<br />
Female 2,933 5,313<br />
Not Documented 3 2<br />
Total: 6,103 10,709<br />
Race/Ethnicity<br />
White 3,657 5,824<br />
Black 364 638<br />
Hispanic 1,083 1,963<br />
NTA 2 116 250<br />
Not Documented 883 2,034<br />
Total: 6,103 10,709<br />
Chief Complaint<br />
Overdose 2,438 3,129<br />
Intoxication 813 1,001<br />
Seizures 107 197<br />
Altered mental status 1,135 1,666<br />
Psychiatric condition 340 1,020<br />
Withdrawal 219 391<br />
Seeking detox 313 480<br />
Accident/injury/assault 85 230<br />
Abscess/cellulitis/skin/tissue 522 1,448<br />
Chest pain 336 861<br />
Respiratory problems 171 529<br />
Digestive problems 237 983<br />
Other 1,151 3,552<br />
Total: 7,867 15,487<br />
Total Cases: 6,103 10,709<br />
Age Group<br />
5 and younger 176 424<br />
6–11 43 88<br />
12–17 713 992<br />
18–20 662 1,011<br />
21–24 649 1,110<br />
25–29 648 1,255<br />
30–34 732 1,168<br />
35–44 1,352 2,299<br />
45–54 786 1,447<br />
55–64 190 489<br />
65 and older 147 420<br />
Not documented 5 6<br />
Total 6,103 10,709<br />
1 The unweighted data in 2004 are from 11–14 Phoenix EDs reporting to DAWN. All DAWN cases are reviewed for quality control.<br />
Based on this review, cases may be corrected or deleted and, therefore, are subject to change.<br />
2 NTA=Not tabulated above.<br />
SOURCE: DAWN Live!, OAS, SAMHSA, updated December 31, 2004 (2003 data) and January 18, 2005 (2004 data)<br />
Proceedings of the Community Epidemiology Work Group, Vol. II, January 2005 201
<strong>EPIDEMIOLOGIC</strong> TRENDS IN <strong>DRUG</strong> <strong>ABUSE</strong>—Phoenix and Arizona<br />
Exhibit 3. Proportions of AHCCCS (Medicaid)-Eligible Substance Abuse Treatment Participants in Arizona:<br />
FY 2001–FY 2004<br />
SOURCE: Arizona Department of Health Services, Division of Behavioral Health Services, Bureau for Substance Abuse Treatment<br />
and Prevention<br />
Exhibit 4. Substance Abuse Treatment Admissions in Arizona, by Age Group: FY 2004<br />
202<br />
80%<br />
70%<br />
60%<br />
50%<br />
40%<br />
30%<br />
20%<br />
10%<br />
0%<br />
80%<br />
70%<br />
60%<br />
50%<br />
40%<br />
30%<br />
20%<br />
10%<br />
0%<br />
1%<br />
29%<br />
38%<br />
FY 2001 FY 2002 FY 2003 FY 2004<br />
17%<br />
59%<br />
< 18 Years 18-24 Years 25-44 Years 45-64 Years > 65 Years<br />
SOURCE: Arizona Department of Health Services, Division of Behavioral Health Services, Bureau for Substance Abuse Treatment<br />
and Prevention<br />
52%<br />
22%<br />
66%<br />
Proceedings of the Community Epidemiology Work Group, Vol. II, January 2005<br />
1%
<strong>EPIDEMIOLOGIC</strong> TRENDS IN <strong>DRUG</strong> <strong>ABUSE</strong>—Phoenix and Arizona<br />
Exhibit 5. Substance Abuse Treatment Expenditures in Arizona, by Percent: FY 2004<br />
SOURCE: Arizona Department of Health Services, Division of Behavioral Health Services, Bureau for Substance Abuse Treatment<br />
and Prevention<br />
Exhibit 6. Co-Occurring Presenting Problems in Substance Abuse Treatment Admissions in Arizona:<br />
FY 2004<br />
Depression<br />
Anxiety<br />
Suicide<br />
Psychotic<br />
Crisis Detox, 17%<br />
Other<br />
Residential, 16%<br />
Support Services, 18%<br />
1%<br />
2%<br />
2%<br />
HIV Services, 2%<br />
Day Programs, 5%<br />
Treatment, 29%<br />
Rehabilitation, 1%<br />
Medical Pharmacy, 17%<br />
0% 2% 4% 6% 8% 10%<br />
SOURCE: Arizona Department of Health Services, Division of Behavioral Health Services, Bureau for Substance Abuse Treatment<br />
and Prevention<br />
Proceedings of the Community Epidemiology Work Group, Vol. II, January 2005 203<br />
8%<br />
9%
<strong>EPIDEMIOLOGIC</strong> TRENDS IN <strong>DRUG</strong> <strong>ABUSE</strong>—Phoenix and Arizona<br />
Exhibit 7. Numbers of DAWN ED Reports of Major Substances of Abuse in Phoenix (Unweighted 1 ) : 2004<br />
204<br />
Alcohol<br />
Cocaine<br />
Methamphetamine<br />
Marijuana<br />
Amphetamine<br />
Heroin<br />
1 The unweighted data are from 11–14 Phoenix EDs reporting to DAWN. All DAWN cases are reviewed for quality control. Based on<br />
this review, cases may be corrected or deleted and, therefore, are subject to change.<br />
SOURCE: DAWN Live!, OAS, SAMHSA, updated January 18, 2005<br />
Exhibit 8. Primary Substances Used Among Treatment Admissions in Arizona, by Percent:<br />
FY 2004<br />
774<br />
732<br />
SOURCE: Arizona Department of Health Services, Division of Behavioral Health Services, Bureau for Substance Abuse Treatment<br />
and Prevention<br />
1,089<br />
1,293<br />
1,560<br />
2,272<br />
0 500 1,000 1,500 2,000 2,500<br />
Cocaine, 9%<br />
Marijuana, 12%<br />
Heroin, 11%<br />
Methamphetamine,<br />
21%<br />
All Other, 3%<br />
Alcohol, 44%<br />
Proceedings of the Community Epidemiology Work Group, Vol. II, January 2005
<strong>EPIDEMIOLOGIC</strong> TRENDS IN <strong>DRUG</strong> <strong>ABUSE</strong>—Phoenix and Arizona<br />
Exhibit 9a. Adult Deferred Prosecution Program Admissions for Selected Drugs in Phoenix, by<br />
Characteristic and Percent: March 1, 1989–December 31, 2004<br />
Characteristic Percent Number<br />
Primary Drug Problem<br />
(May include more than one drug)<br />
Cocaine 28.7 4,576<br />
Methamphetamine 26.9 4,298<br />
Marijuana 23.3 3,722<br />
Polydrug 11.5 1,830<br />
Opiate 5.1 818<br />
Denies Drug Problem 4.5 715<br />
Total (N=) 15,959<br />
Gender<br />
Male 70.4 7,004<br />
Female 29.6 2,950<br />
Total (N=) 9,954<br />
Ethnicity<br />
Caucasian 61.4 6,110<br />
Hispanic 29.3 2,915<br />
African American 6.1 608<br />
Native American 2.1 207<br />
Other 1.1 114<br />
Total (N=) 9,954<br />
Employment<br />
Unemployed 31.2 3,103<br />
Part-Time 11.6 1,158<br />
Full-Time 53.4 5,314<br />
Disabled 3.8 379<br />
Total (N=) 9,954<br />
Marital Status<br />
Single 53.9 5,369<br />
Married 23.9 2,376<br />
Divorced 7.4 735<br />
Separated 14.8 1,474<br />
Total (N=) 9,954<br />
SOURCE: Adult Treatment and Assessment Screening Center (TASC)—Deferred Prosecution Program Cumulative Statistical<br />
Report<br />
Exhibit 9b. TASC Juvenile Client Drug Test Positive Results by Drug and Percent in Phoenix: October 1–<br />
December 31, 2004<br />
THC (n=3,064) 72.8%<br />
Total=4,214<br />
Alcohol (n=10) 0.24%<br />
Opiates (n=57) 1.35%<br />
Cocaine (n=261) 6.2%<br />
Amphetamine (n=819)<br />
19.5%<br />
SOURCE: Treatment and Assessment Screening Center (TASC) Client Drug Test Results Summary, Maricopa County Juvenile<br />
Probation<br />
Proceedings of the Community Epidemiology Work Group, Vol. II, January 2005 205
206<br />
<strong>EPIDEMIOLOGIC</strong> TRENDS IN <strong>DRUG</strong> <strong>ABUSE</strong>—Phoenix and Arizona<br />
Exhibit 10. Drug Prices in Phoenix and Tucson: FYs 2001 vs. 2004<br />
Drug<br />
Marijuana<br />
2001 2004<br />
Phoenix Tucson Phoenix Tucson<br />
Grams $10–$25 $5–$10<br />
Ounce $75–$150 $65–$105 $75–$150 $65–$105<br />
Pound $500–$750 $400–$600 $500–$750 $400–$600<br />
Methamphetamine<br />
1/8 ounce $150 (ice)<br />
$120–$150<br />
$120–$220<br />
1/2 teener N/A N/A $40 $80–$135<br />
1/4 ounce $125 $275 $250 (ice) $120–$300<br />
Ounce $300–$600 $500–$900 $500–$600 Not reported<br />
Pound $3,500–$12,000 $3,800–$6,000 $5,000–$8,600 $7,000–$7,500<br />
(higher price for ice) $13,000 (ice)<br />
(ice)<br />
Cocaine<br />
Rock—1/3 gram crack N/A N/A $20 $20<br />
Eightball $100–$140 $80–$130 $80–$100 $80–$130<br />
Ounce $500–$800 $500–$650 $450–$650 $500–$650<br />
Ounce crack N/A N/A $540–$600 $550–$700<br />
Kilogram $15,000–$17,000 $15,000–$18,000 $13,500–$15,000 $15,000–$16,000<br />
Heroin<br />
A "20" "bb"<br />
(80–100 milligrams)<br />
$20 $20–$25 $20 $20–$25<br />
A "paper" (.25 gram) $20–$30 $20–$25 $10–$15 $20–$25<br />
Gram $70–$100 $60–$110 $40–$47 $60–$110<br />
Ounce ("piece," 28 grams) $1,100–$1,500 $1,075–$1,300 $750–$900 $1,075–$1,300<br />
Kilogram $32,000–$40,000 N/A $28,000–$35,000 $43,000<br />
Other Drugs Dosage Price<br />
MDMA 1 tablet $20–$30<br />
OxyContin 80-mg tablet $20–$80<br />
Percocet 1 tablet $5<br />
Vicodin ES 1 tablet $5<br />
Valium 10-mg tablet $4<br />
Lortab 10-mg tablet $5–$6<br />
Soma 1 tablet $2–$5<br />
SOURCES: DEA Phoenix Division Offices, U.S. Customs, Arizona Department of Public Safety, Phoenix Police Department, Maricopa<br />
County Sheriff Department<br />
Proceedings of the Community Epidemiology Work Group, Vol. II, January 2005
<strong>EPIDEMIOLOGIC</strong> TRENDS IN <strong>DRUG</strong> <strong>ABUSE</strong>—Phoenix and Arizona<br />
Exhibit 11. Numbers of DAWN ED Prescription Drug Misuse Reports in Phoenix, by Case Type<br />
(Unweighted 1 ): 2004<br />
Opiates/Opioids<br />
Total 1,055<br />
Overmedication 426<br />
Seeking Detox 143<br />
Other 486<br />
Benzodiazepines<br />
Total 843<br />
Overmedication 479<br />
Seeking Detox 41<br />
Other 323<br />
Oxycodone<br />
Total 298<br />
Overmedication 140<br />
Seeking Detox 58<br />
Other 100<br />
Muscle Relaxants<br />
Total 243<br />
Overmedication 180<br />
Seeking Detox 7<br />
Other 56<br />
Hydrocodone<br />
Total 207<br />
Overmedication 138<br />
Seeking Detox 21<br />
Other 48<br />
Overmedication<br />
Seeking Detox<br />
Other<br />
0 200 400 600 800 1,000 1,200<br />
1 The unweighted data are from 11–14 Phoenix EDs reporting to DAWN. All DAWN cases are reviewed for quality control. Based on<br />
this review, cases may be corrected or deleted and, therefore, are subject to change.<br />
SOURCE: DAWN Live!, OAS, SAMHSA, updated January 18, 2005<br />
Proceedings of the Community Epidemiology Work Group, Vol. II, January 2005 207
208<br />
<strong>EPIDEMIOLOGIC</strong> TRENDS IN <strong>DRUG</strong> <strong>ABUSE</strong>—Phoenix and Arizona<br />
Exhibit 12a. Current Estimated Prevalence of HIV/AIDS in Arizona as Reported in March 2004<br />
Gender<br />
Cases<br />
CURRENT HIV CURRENT AIDS TOTAL CURRENT HIV/AIDS<br />
%<br />
State<br />
Total<br />
Rate<br />
Per<br />
100,000 Cases<br />
%<br />
State<br />
Total<br />
Rate<br />
Per<br />
100,000 Cases<br />
%<br />
State<br />
Total<br />
Rate<br />
Per<br />
100,000<br />
Male 4,547 85.8% 166.81 3,897 88.3% 142.96 844 40.0% 309.77<br />
Female 752 14.2% 27.54 514 11.7% 18.82 1,266 60.0% 46.36<br />
Age Group<br />
Total 5,299 100.0% 97.11 4,411 100.0% 80.84 2,110 100.0% 177.95<br />
12 and younger 67 1.3% 6.20 5 0.1% 0.46 72 0.7% 6.66<br />
13–19 30 0.6% 5.50 15 0.3% 2.75 45 0.5% 8.24<br />
20–24 123 2.3% 31.51 25 0.6% 6.40 148 1.5% 37.92<br />
25–29 346 6.5% 90.57 138 3.1% 36.12 484 5.0% 126.69<br />
30–34 625 11.8% 158.33 403 9.1% 102.09 1,028 10.6% 260.42<br />
34–39 1,018 19.2% 262.62 860 19.5% 221.86 1,878 19.3% 484.49<br />
40–44 1,263 23.8% 316.04 1,140 25.8% 285.26 2,403 24.7% 601.30<br />
45–49 852 16.1% 235.88 838 19.0% 232.01 1,690 17.4% 467.89<br />
50–54 485 9.2% 150.45 499 11.3% 154.79 984 10.1% 305.25<br />
55–59 272 5.1% 101.66 260 5.9% 97.17 532 5.5% 198.83<br />
60 and older 218 4.1% 23.58 228 5.2% 24.66 446 4.6% 48.25<br />
Total 5,299 100% 97.11 4,411 100% 80.84 9,710 100% 177.95<br />
Race/Ethnicity<br />
White Non-<br />
Hispanic<br />
Black Non-<br />
3,339 63.0% 97.53 2,813 63.8% 82.16 6,152 63.4% 179.69<br />
Hispanic 567 10.7% 324.27 439 10.0% 251.07 1,006 10.4% 575.34<br />
Hispanic<br />
A/PI/H<br />
1,048 19.8% 70.97 965 21.9% 65.35 2,013 20.7% 136.31<br />
1 Non-<br />
Hispanic<br />
AI/AN<br />
41 0.8% 34.63 32 0.7% 27.02 73 0.8% 61.65<br />
2 Non-<br />
Hispanic<br />
MR<br />
164 3.1% 62.41 157 3.6% 59.75 321 3.3% 122.16<br />
3 /Non-Hispanic<br />
Other 140 2.6% N/A 5 0.1% N/A 145 1.5% N/A<br />
Total<br />
Mode of Transmission<br />
5,299 100.0% 97.11 4,411 100.0% 485.35 9,710 100.0% 177.95<br />
MSM 4 2,885 54.4% N/A 2,694 61.1% N/A 5,579 57.5% N/A<br />
IDU 5 683 12.9% N/A 593 13.4% N/A 1,276 13.1% N/A<br />
MSM/IDU 411 7.8% N/A 469 10.6% N/A 880 9.1% N/A<br />
Heterosexual 525 9.9% N/A 412 9.3% N/A 937 9.6% N/A<br />
O/H/TF/TPR 6 99 1.9% N/A 85 1.9% N/A 184 1.9% N/A<br />
NRR/UR 7 696 13.1% N/A 158 3.6% N/A 854 8.8% N/A<br />
Total 5,299 100.0% 97.11 4,411 100.0% 80.84 9,710 100% 177.95<br />
1<br />
Asian/Pacific Islander/Hawaiian<br />
2<br />
American Indian/Alaskan Native<br />
3<br />
Multiple race<br />
4<br />
Men having sex with men<br />
5<br />
Injection drug use<br />
6<br />
Other/hemophilia/transfusion and blood products/transplant recipient<br />
7<br />
No reported risk/unknown risk<br />
SOURCE: Arizona Department of Health Services, Division of Public Health Services, Bureau of Epidemiology and Disease Control,<br />
Office of HIV/STD Services<br />
Proceedings of the Community Epidemiology Work Group, Vol. II, January 2005
<strong>EPIDEMIOLOGIC</strong> TRENDS IN <strong>DRUG</strong> <strong>ABUSE</strong>—Phoenix and Arizona<br />
Exhibit 12b. HIV/AIDS Annual Report of Arizona Incidence: 1998–2002<br />
Gender<br />
Cases<br />
NEW HIV NEW AIDS TOTAL NEW HIV/AIDS<br />
%<br />
State<br />
Total<br />
Rate<br />
Per<br />
100,000 Cases<br />
%<br />
State<br />
Total<br />
Rate<br />
Per<br />
100,000 Cases<br />
%<br />
State<br />
Total<br />
Rate<br />
Per<br />
100,000<br />
Male 1,738 84.4% 13.48 1,204 87.7% 9.34 2,942 85.7% 22.82<br />
Female 321 15.6% 2.48 169 12.3% 1.31 490 14.3% 3.79<br />
Age Group<br />
Total 2,059 100.0% 7.97 1,373 100.0% 5.31 3,432 100.0% 13.28<br />
12 and younger 14 0.7% 0.27 7 0.5% 0.14 21 0.6% 0.41<br />
13–19 45 2.2% 1.73 7 0.5% 0.27 52 1.5% 2.00<br />
20–24 212 10.3% 11.67 41 3.0% 2.26 253 7.4% 13.93<br />
25–29 338 16.4% 18.11 128 9.3% 6.86 466 13.6% 24.97<br />
30–34 415 20.2% 22.06 255 18.6% 13.56 670 19.5% 35.62<br />
34–39 420 20.4% 21.57 314 22.9% 16.13 734 21.4% 37.69<br />
40–44 288 14.0% 15.26 264 19.2% 13.98 552 16.1% 29.24<br />
45–49 170 8.3% 10.16 163 11.9% 9.75 333 9.7% 16.91<br />
50–54 86 4.2% 5.81 104 7.6% 7.03 190 5.5% 12.84<br />
55–59 37 1.8% 3.07 55 4.0% 4.57 92 2.7% 7.64<br />
60 and older 34 1.7% 0.77 35 2.5% 0.80 69 2.0% 1.57<br />
Total 2,059 100% 7.97 1,373 100% 5.31 3,432 100% 13.28<br />
Race/Ethnicity<br />
White Non-<br />
Hispanic<br />
Black Non-<br />
1,204 58.5% 7.23 735 53.5% 4.41 1,939 56.5% 11.64<br />
Hispanic 236 11.5% 28.64 150 10.9% 18.20 386 11.2% 46.84<br />
Hispanic<br />
A/PI/H<br />
514 25.0% 7.80 399 29.1% 6.06 913 26.6% 13.86<br />
1 Non-<br />
Hispanic<br />
AI/AN<br />
18 0.9% 3.39 11 0.8% 2.07 29 0.8% 5.46<br />
2 Non-<br />
Hispanic<br />
MR<br />
81 3.9% 6.50 77 5.6% 6.18 158 4.6% 12.69<br />
3 /Non-Hispanic<br />
Other 6 0.3% N/A 1 0.1% N/A 7 0.2% N/A<br />
Total<br />
Mode of Transmission<br />
2,059 100.0% 7.97 1,373 100.0% 5.31 3,432 100.0% 13.28<br />
MSM 4 1,151 55.9% N/A 827 60.2% N/A 1,978 57.6% N/A<br />
IDU 5 291 14.1% N/A 209 15.2% N/A 500 14.6% N/A<br />
MSM/IDU 172 8.4% N/A 87 6.3% N/A 259 7.5% N/A<br />
Heterosexual 275 13.4% N/A 171 12.5% N/A 446 13.0% N/A<br />
O/H/TF/TPR 6 28 1.4% N/A 29 2.1% N/A 57 1.7% N/A<br />
NRR/UR 7 142 6.9% N/A 50 3.6% N/A 192 5.6% N/A<br />
Total 2,059 100.0% 7.97 1,373 100.0% 5.31 3,432 100% 13.28<br />
1<br />
Asian/Pacific Islander/Hawaiian<br />
2<br />
American Indian/Alaskan Native<br />
3<br />
Multiple race<br />
4<br />
Men having sex with men<br />
5<br />
Injection drug use<br />
6<br />
Other/hemophilia/transfusion and blood products/transplant recipient<br />
7<br />
No reported risk/unknown risk<br />
SOURCE: Arizona Department of Health Services, Division of Public Health Services, Bureau of Epidemiology and Disease Control,<br />
Office of HIV/STD Services<br />
Proceedings of the Community Epidemiology Work Group, Vol. II, January 2005 209
<strong>EPIDEMIOLOGIC</strong> TRENDS IN <strong>DRUG</strong> <strong>ABUSE</strong>—Phoenix and Arizona<br />
Exhibit 13. Correctional Officer Offender Liaison (COOL) Program Referrals in Phoenix: FY 2001–FY 2004<br />
210<br />
8,000<br />
6,000<br />
4,000<br />
2,000<br />
0<br />
5,458<br />
Referrals<br />
Intakes<br />
5,530<br />
4,119 4,140<br />
SOURCE: Arizona Department of Health Services, Division of Behavioral Health Services, Bureau for Substance Abuse Treatment<br />
and Prevention<br />
6,467<br />
4,560<br />
5,953<br />
FY 2001 FY 2002 FY 2003 FY 2004<br />
4,330<br />
Proceedings of the Community Epidemiology Work Group, Vol. II, January 2005
<strong>EPIDEMIOLOGIC</strong> TRENDS IN <strong>DRUG</strong> <strong>ABUSE</strong>—St. Louis<br />
Patterns and Trends in Drug Abuse in St. Louis<br />
Heidi Israel, Ph.D., R.N., L.C.S.W., 1 and Jim Topolski, Ph.D. 2<br />
ABSTRACT<br />
Heroin and cocaine indicators remained mixed,<br />
while methamphetamine has increased in St. Louis<br />
indicators. St. Louis and St. Louis County law enforcement<br />
personnel continue to devote many resources<br />
to methamphetamine, and labs in rural areas<br />
continued to be a problem. Club drug use/abuse<br />
continued to be sparse and decreasing. Marijuana<br />
indicators have been trending up in St. Louis for<br />
some time. Primary marijuana treatment admissions<br />
more than doubled between 1997 and 2001<br />
and remained at this elevated level. In the St. Louis<br />
area, 5 percent of HIV cases had a risk factor of<br />
injection drug use, and another 5 percent were<br />
among men who have sex with men and also inject<br />
drugs.<br />
INTRODUCTI<strong>ON</strong><br />
Area Description<br />
The St. Louis metropolitan statistical area (MSA)<br />
includes approximately 2.6 million people living in<br />
the city of St. Louis; St. Louis County; the surrounding<br />
rural Missouri counties of Franklin, Jefferson,<br />
Lincoln, St. Charles, and Warren; in Illinois, East St.<br />
Louis; and St. Clair County. St. Louis City’s population<br />
has continued to decrease to approximately<br />
350,000, many of whom are indigent and minorities.<br />
Although violent crime has generally decreased, it<br />
remains high in drug-trafficking areas. St. Louis<br />
County, which surrounds St. Louis City, has more<br />
than 1 million residents, many of whom fled the inner<br />
city. The county is a mix of established affluent<br />
neighborhoods and middle and lower class housing<br />
areas on the north and south sides of the city. The<br />
most rapidly expanding population areas are in St.<br />
Charles and Jefferson Counties in Missouri and St.<br />
Clair and Madison Counties in southern Illinois,<br />
which have a mixture of classes and both small towns<br />
and farming areas. The populations in these rural<br />
counties total more than 800,000. The living conditions<br />
and cultural differences have resulted in contrasting<br />
drug use patterns.<br />
Much of the information included in this report is<br />
specific to St. Louis City and County, with caveats<br />
that apply to the total MSA. Anecdotal information<br />
and some treatment data are provided for rural areas<br />
and for the State. Limited data are also available for<br />
other parts of Missouri and offer a contrast to the St.<br />
Louis drug use picture.<br />
Policy Issues<br />
Methamphetamine production and use is a major<br />
concern for both law enforcement and the legislature.<br />
Small labs continue to place a hardship on law enforcement<br />
in terms of personnel and resources. The<br />
legislature has taken bold moves to require precursor<br />
drugs, such as pseudoephedrine, that are sold in local<br />
retail stores to be locked up or placed behind pharmacy<br />
counters. While this policy may now slow<br />
down local producers, it does not address the major<br />
source of methamphetamine in the Midwest—a fact<br />
that gets lost in the local problem of small “mom and<br />
pop” lab seizures.<br />
Missouri has been in a budget crisis for years, and St.<br />
Louis County has more recently reported budget<br />
deficits and resulting cuts in services. The areas that<br />
suffer first are psychiatric services and treatment services.<br />
Limited treatment continues to be available for<br />
drug abusers. The addiction model as understood<br />
through experience and research has shown that<br />
treatment services are cost effective to both society<br />
and the individual, yet the trend is to not offer these<br />
services. The result is that some of these indicators<br />
cannot fully reflect the degree of use or abuse of the<br />
substances tracked.<br />
Data Sources<br />
The sources used in this report are indicated below:<br />
Emergency department (ED) data were accessed<br />
from the Drug Abuse Warning Network<br />
(DAWN) Live!, a restricted-access online system<br />
administered by the Office of Applied Studies<br />
(OAS), Substance Abuse and Mental Health<br />
Services Administration (SAMHSA). The unweighted<br />
data are for 2004, updated in December<br />
1 Dr. Israel is affiliated with the Division of Infectious Diseases, Saint Louis University Medical School, St. Louis, Missouri.<br />
2 Dr. Topolski is affiliated with the Division of Evaluation, Policy, and Ethics, Missouri Institute of Mental Health, St. Louis, Missouri.<br />
Proceedings of the Community Epidemiology Work Group, Vol. II, January 2005 211
212<br />
2004. Data from 2000–2002 DAWN are also reported.<br />
The data accessed from DAWN Live!<br />
cannot be compared with the DAWN data from<br />
2002 and before because of changes in the<br />
DAWN system. In the “new” DAWN system, 36<br />
of the 37 eligible hospitals in the St. Louis area<br />
are in the DAWN sample. There are 38 EDs int<br />
eh sample, since some hospitals have more than<br />
1 emergency department. The unweighted data<br />
for 2004 are incomplete. Over the 12-month period,<br />
between 15 and 18 hospitals reported each<br />
month, with most or all of these EDs reporting<br />
data that were 90–100 percent complete. All<br />
DAWN cases are reviewed for quality control.<br />
Based on the review, cases may be corrected or<br />
deleted. Therefore, the data reported in this paper<br />
are subject to change. Data from DAWN Live!<br />
represent drug reports in drug-related ED visits.<br />
Drug reports exceed the number of visits, since a<br />
patient may report use of multiple drugs (up to<br />
six drugs plus alcohol). Since the DAWN Live!<br />
data are unweighted, they are not estimates for<br />
the St. Louis area, nor can they be used for comparison<br />
with future data. Only weighted data released<br />
by SAMHSA can be used for trend analysis<br />
(as in the 2000–2002 data cited in this paper).<br />
A full description of DAWN can be found at<br />
.<br />
Drug treatment data were derived from the<br />
Treatment Episode Data Set (TEDS) database<br />
through the first half of 2004. Private treatment<br />
programs in St. Louis County provided anecdotal<br />
information.<br />
Heroin price and purity information was provided<br />
by the Drug Enforcement Administration<br />
(DEA), Domestic Monitor Program (DMP),<br />
through 2004.<br />
Drug-related mortality data were provided by<br />
the St. Louis City Medical Examiner’s Office<br />
through 2003.<br />
Intelligence data were provided by the Missouri<br />
Highway Patrol and the DEA.<br />
Human immunodeficiency virus (HIV), acquired<br />
immunodeficiency syndrome (AIDS),<br />
and sexually transmitted disease (STD) data<br />
were derived from the HIV Vaccine Trials Unit<br />
at Saint Louis University and the St. Louis Metropolitan<br />
Health Department and AIDS Program.<br />
Linda Cottler, Ph.D., of Washington University, who<br />
has multiple behavioral research grants, provided<br />
additional data.<br />
<strong>EPIDEMIOLOGIC</strong> TRENDS IN <strong>DRUG</strong> <strong>ABUSE</strong>—St. Louis<br />
<strong>DRUG</strong> <strong>ABUSE</strong> PATTERNS AND TRENDS<br />
Cocaine indicators are stable in St. Louis. While<br />
methamphetamine has become a prominent drug of<br />
abuse in other cities and in the rural areas of Missouri,<br />
cocaine has retained its dominance in the St. Louis<br />
urban area. Possible reasons for this situation include<br />
racial differences, with Caucasians using methamphetamine<br />
and African-Americans using cocaine, and<br />
the strong influence of the distribution networks. The<br />
distribution of cocaine and heroin is primarily by African-Americans.<br />
Methamphetamine is imported into St.<br />
Louis from Mexico or produced locally in the rural<br />
areas of the county and State.<br />
Two types of heroin have continued to be available,<br />
but the heroin is not as pure and is more expensive<br />
when compared with other cities. This Midwestern city<br />
is a destination market, with small entrepreneurial<br />
groups marketing the drug. Heroin is available in the<br />
suburbs and is now reported in some of the surrounding<br />
rural areas, thus illustrating that this drug is not<br />
confined to the lower socioeconomic strata in the city.<br />
Drug education and prevention activities have continued<br />
at the community level through programs such<br />
as Drug Abuse Resistance Education (DARE) and<br />
collaborative arrangements between communities and<br />
the police. The National Council on Alcoholism and<br />
Drug Abuse (NCADA) and other local education<br />
programs target prevention of drug use in the area.<br />
These groups are particularly active in the surrounding<br />
counties of St. Louis. The poor city economy<br />
continues to foster drug abuse and distribution. Marijuana<br />
continues to be a very popular drug of abuse<br />
among younger adults, and increased treatment admissions<br />
may be a reflection of a high number of<br />
court referrals. Gangs continue to be involved in the<br />
drug trade and related violence, with Latino, African-<br />
American, and Asian youth and young adults involved<br />
in these groups. Interdiction programs include<br />
Operation Jetway and Operation Pipeline.<br />
Cocaine/Crack<br />
The St. Louis City/County Medical Examiner (ME)<br />
reported that cocaine-related deaths trended downward<br />
from 128 in 1994 to 78 in 2003 (exhibit 1a).<br />
Many of the recent deaths involved alcohol and other<br />
drugs.<br />
According to DAWN, the number of cocaine mentions<br />
increased significantly between 2000 (n=2,403)<br />
and 2002 (3,536). The numbers of mentions among<br />
those age 45–54 and 55 and older increased significantly.<br />
According to unweighted data accessed from<br />
DAWN Live! for 2004, ED reports for cocaine had<br />
Proceedings of the Community Epidemiology Work Group, Vol. II, January 2005
the following characteristics: more than one-half of<br />
the patients were Caucasian, and nearly 60 percent of<br />
the patients were older than 35. The top two reasons<br />
for the ED visit were seeking detox or psychiatric<br />
condition. The dispositions for most of the cases included<br />
referral to treatment, admission to the psychiatric<br />
unit, or discharge to home. Only three of the<br />
cases reported resulted in immediate death.<br />
Among treatment admissions for illicit drug abuse in<br />
the first half of 2004, the proportion for primary cocaine<br />
abuse reflected a slight decrease compared with<br />
all of 2003 (exhibit 1a). Cocaine remained the most<br />
common primary drug of abuse among all admissions<br />
(33.6 percent), followed by marijuana (29.6 percent)<br />
and heroin (10.8 percent). In the first half of 2004,<br />
the typical cocaine admission was an African-<br />
American male age 35 or older who smoked the drug.<br />
Although the DEA’s emphasis has shifted from cocaine<br />
to methamphetamine and heroin, law enforcement<br />
sources, the DEA, and street informants continued<br />
to report high quality, wide availability, and low<br />
prices for cocaine. Cocaine is used and most available<br />
in the urban areas. Powder cocaine grams sold<br />
for $100–$125; purity averaged 70 percent (exhibit<br />
1b). Crack prices remain at $20 per rock on the street<br />
corner. All cocaine in St. Louis is initially in the<br />
powder form and is converted to crack for distribution.<br />
Cocaine was readily available on the street corner<br />
in rocks or grams. The price of a gram of crack in<br />
Kansas City was lower than in St. Louis at $100–<br />
$120. The “rock” price is the same in smaller cities<br />
outside St. Louis when it is available, but the gram<br />
price is higher.<br />
The continued use of cocaine has potentially severe<br />
long-term consequences by contributing to the spread<br />
of sexually transmitted diseases (STDs) through multiple<br />
partners. Drug and alcohol use continues to contribute<br />
to unsafe sex and multiple partners. Crack<br />
cocaine is considered to be a primary risk for HIV in<br />
many research trials.<br />
Most cocaine users smoke crack cocaine, though<br />
some use powder cocaine. Only injection drug users<br />
(IDUs) who combine cocaine and heroin (“speedball”)<br />
use cocaine intravenously. Younger users tend<br />
to smoke cocaine. Polydrug use is also evident in the<br />
treatment data. The reported use of marijuana, heroin,<br />
and alcohol in addition to cocaine suggests this trend<br />
will likely continue.<br />
Heroin<br />
Heroin-related deaths reported by the St. Louis<br />
City/County ME leveled off in recent years. In 2003,<br />
<strong>EPIDEMIOLOGIC</strong> TRENDS IN <strong>DRUG</strong> <strong>ABUSE</strong>—St. Louis<br />
there were 61 heroin-related deaths (exhibit 1a).<br />
Statewide heroin deaths caused by overdose alone<br />
were not much higher, because heroin purity is higher<br />
in the St. Louis area than in other cities in Missouri<br />
and heroin is available primarily in the St. Louis and<br />
Kansas City areas. More heroin deaths occurred in St.<br />
Louis County than in the inner city in 2000–2002;<br />
these deaths support other reports that heroin use is<br />
increasing in the suburbs.<br />
Heroin consistently appears in all indicators. In the<br />
unweighted data accessed from DAWN Live!, heroin<br />
ED reports for 2004 indicated that almost 61 percent of<br />
the patients were Caucasian, 22.5 percent were between<br />
the ages of 18 and 24, and 50 percent of the 560<br />
ED reports were for detoxification or withdrawal. Heroin<br />
ED mentions had risen steadily from 1995 to 2002,<br />
when mentions totaled 1,167. The increase in heroin<br />
mentions among many age groups over the 7 yearperiod<br />
(1995–2002) indicates the wide availability of<br />
this drug in this MSA. Among those who made ED<br />
mentions of heroin in 2002, the three top reasons for<br />
seeking medical intervention were overdose, withdrawal,<br />
and seeking detoxification.<br />
While heroin treatment admissions increased dramatically<br />
as a proportion of all admissions between<br />
1996 and 2000, they leveled off in 2001–2003. In the<br />
first half of 2004, this trend appeared to continue.<br />
There are limited slots for admissions to State-funded<br />
methadone or modified medical detoxification in<br />
Missouri, which may influence these data. While<br />
heroin availability increased throughout the region,<br />
the decrease in admissions may in fact be a result of<br />
lack of adequate treatment resources; alternatively,<br />
the new users of heroin have not yet been driven to<br />
treatment. When queried, private treatment programs<br />
stated that 25 percent of their admission screens were<br />
for heroin abuse, but admission depended on “ability<br />
to pay.” Some heroin abusers in need of treatment<br />
utilize “private pay” methadone programs. Rapid<br />
detoxification, using naltrexone, is still a treatment<br />
option at private hospitals, but it is expensive. About<br />
37 percent of heroin admissions were younger than<br />
25 in the first half of 2004. Of all heroin admissions,<br />
intravenous use was the primary method of administration<br />
in St. Louis County, but inhalation was more<br />
popular among admissions in St. Louis City. The<br />
increased availability of higher purity heroin has led<br />
to a wider acceptance of the drug in social circles.<br />
One of the reasons for its acceptance is that it does<br />
not have to be injected to get the desired effects.<br />
A steady supply of Mexican heroin remains available.<br />
The DEA has made buys of heroin in the region in<br />
addition to buys through the DMP. Mexican black tar<br />
heroin showed a peak of 24.0 percent purity in 1998;<br />
Proceedings of the Community Epidemiology Work Group, Vol. II, January 2005 213
purity dropped to 14.4 percent in 2003 and averaged<br />
10–14 percent in 2004. South American (Colombian)<br />
heroin, which is also white, is of poorer quality. Most<br />
heroin is purchased in aluminum foil or the number-5<br />
gel capsule (one-tenth-gram packages of heroin in<br />
plastic wrap and aluminum foil) for $10 (exhibit 1b).<br />
Heroin costs range from $1.00 per milligram to $1.93<br />
per milligram for Mexican heroin in the recent DMP<br />
analysis. The city is an end-user market and is dependent<br />
on transportation of the heroin from points of<br />
entry into the Midwest. The wholesale price remains<br />
at $250–$600 per gram. On street corners, heroin<br />
sells for $250 per gram. Most business is handled by<br />
cellular phone, which has decreased the seller’s need<br />
to have a regular location. Thus, the risk of being<br />
arrested has declined. In St. Louis and other smaller<br />
urban areas, small distribution networks sell heroin.<br />
Kansas City’s heroin supply differs from that of St.<br />
Louis. Most heroin in Kansas City is black tar and is<br />
typically of poorer quality. The supply is consistent,<br />
and a $10 bag of heroin is available. Heroin has also<br />
become available in the smaller, more rural cities of<br />
Springfield and Joplin, each of which has a small IDU<br />
population that uses heroin and methamphetamine.<br />
Other Opiates/Narcotics<br />
OxyContin (a long-lasting, time-release version of<br />
oxycodone) abuse remained a concern for treatment<br />
providers and law enforcement officials. Prescription<br />
practices are closely monitored for abuse, and isolated<br />
deaths have been reported, but no consistent<br />
reports are available on the magnitude of this potential<br />
problem. OxyContin costs $40 for an 80-milligram<br />
tablet on the street (exhibit 1b).<br />
Other opiates continue to represent less than 1 percent<br />
of all treatment admissions. Methadone remains available,<br />
which is probably a result of prescription abuse<br />
as well as patient diversion.<br />
The use of hydromorphone (Dilaudid) remained<br />
common among a small population of White chronic<br />
addicts. The drug costs $30–$75 per 4-milligram pill.<br />
Abuse of oxycodone (Percocet and Percodan) by prescription<br />
has been noted anecdotally.<br />
Marijuana<br />
In the unweighted data from DAWN Live!, marijuana<br />
ED reports in 2004 represented 23 percent of the total<br />
ED reports for drugs of abuse. In 2002, ED marijuana<br />
mentions were high at 2,866 (exhibit 1a), a significant<br />
62.6-percent increase over 2000. More than 44<br />
percent of the patients in 2004 were younger than 25.<br />
214<br />
<strong>EPIDEMIOLOGIC</strong> TRENDS IN <strong>DRUG</strong> <strong>ABUSE</strong>—St. Louis<br />
Marijuana treatment admissions more than doubled<br />
from 1997 (1,573 admissions) to 2001 (3,210 admissions)<br />
and remained stable in 2003 and the first half<br />
of 2004, when they represented 27.2 percent and 29.6<br />
percent of all admissions, respectively (exhibit 1a).<br />
Marijuana, viewed by young adults as acceptable to<br />
use, is often combined with alcohol. The 25-andyounger<br />
age group accounted for 65.6 percent of<br />
primary marijuana treatment admissions in the first<br />
half of 2004. Some of the prevention organizations<br />
report a resurgence in marijuana popularity and a<br />
belief by users that it is not harmful.<br />
Because of the heroin, cocaine, and methamphetamine<br />
abuse problems and the recent “club drug”<br />
scare in St. Louis, law enforcement officials have<br />
focused less attention on marijuana abuse. Limited<br />
resources require establishing enforcement priorities.<br />
Often, probation for marijuana offenders requires<br />
participation in treatment for younger users who do<br />
not identify themselves as drug dependent. In focus<br />
groups with African-American adults from various<br />
social groups, more than one-half identified regular<br />
use of marijuana but did not identify this use as problematic.<br />
This ethnographic information supports the<br />
idea of cultural acceptance of marijuana use.<br />
Marijuana is available from Mexico or domestic indoor<br />
growing operations. Indoor production makes it<br />
possible to produce marijuana throughout the year. In<br />
addition to the Highway Patrol Pipeline program,<br />
which monitors the transportation of all types of<br />
drugs on interstate highways, Operations Green Merchant<br />
and Cash Crop identify and eradicate crops.<br />
Much of the marijuana grown in Missouri is shipped<br />
out of the State.<br />
In 2004, 1 pound of sinsemilla sold for $700–$1,800<br />
in St. Louis (exhibit 1b).<br />
Stimulants<br />
Methamphetamine, along with alcohol, remained a<br />
primary drug of abuse in both the outlying rural areas<br />
and statewide. (Most of Missouri, outside of St. Louis<br />
and Kansas City, is rural.) Methamphetamine continued<br />
to be identified as a huge problem in rural communities.<br />
In the unweighted 2004 DAWN Live! data, methamphetamine<br />
ED reports totaled 150. Ninety-one percent<br />
were Caucasian, with no predominant age group. ED<br />
methamphetamine mentions in St. Louis increased in<br />
the late 1990s and totaled 150 in 2002 (exhibit 1a).<br />
Methamphetamine (“crystal” or “speed”) was found at<br />
very low levels in city indicators in 1995, but reported<br />
Proceedings of the Community Epidemiology Work Group, Vol. II, January 2005
use has slowly increased over the last 8 years. In rural<br />
areas, methamphetamine appeared regularly in the<br />
treatment data, but methamphetamine has been identified<br />
as a problem in all parts of the State. The urban,<br />
street-level distributors in St. Louis deal in cocaine, so<br />
amphetamine use is not as widespread in the St. Louis<br />
area; this could indicate differences in dealing networks<br />
and access to locally produced drugs (“mom and pop”<br />
local production). However, an increase in availability<br />
and purity of Mexican methamphetamine and a growth<br />
in Hispanic groups in the St. Louis metropolitan area<br />
may change this trend. An increase in treatment admissions<br />
may signal this change. Cocaine and methamphetamine<br />
use have been split along racial lines in<br />
the State. While the number of methamphetamine<br />
treatment admissions was still relatively low in St.<br />
Louis (752 in 2003), in rural treatment programs,<br />
methamphetamine was the drug of choice after alcohol.<br />
The Midwest Field Division of the DEA decreased its<br />
cleanup of clandestine methamphetamine labs after<br />
training local enforcement groups; 2,860 labs were<br />
reported for 2003. The intensity of these law enforcement<br />
efforts is based on the availability of funds<br />
for local police departments to clean up box labs under<br />
Community Oriented Policing Service (COPS)<br />
funding. Thefts of anhydrous ammonia continued to<br />
be identified as an issue in rural areas.<br />
In the new methamphetamine scene, Hispanic traffickers,<br />
rather than the old network of motorcycle<br />
gangs, are the predominant distributors. Shipments<br />
from “super labs” in the Southwest are trucked in via<br />
the interstate highway system. This network is in<br />
contrast to the local “mom and pop” labs that produce<br />
personal quantities for family and friends. These local<br />
labs tend to use the Nazi method of production,<br />
with an output of 60 percent of the quantity of the<br />
starting products. Purity of the drugs produced by<br />
these labs and percent of finished product depends on<br />
the experience/attentiveness of the “cooker.” Most of<br />
the available methamphetamine is produced in Mexico<br />
and trafficked through these Hispanic traffickers.<br />
While much of the resources and personnel are directed<br />
at the local production, the actual quantity of<br />
methamphetamine that is available is through these<br />
Hispanic organizations. As the purity increases<br />
through these groups, less priority may be placed on<br />
local production. Some crystallized methamphetamine<br />
has been noted in the local market, usually indicating<br />
increased purity in the product.<br />
Locally produced methamphetamine purity fluctuated<br />
between 70 and 80 percent, while methamphetamine<br />
from Mexico has historically been only 20–30 percent<br />
pure (exhibit 1b). Increased crystalline product indicates<br />
higher purity, and the term “ice” has been applied<br />
<strong>EPIDEMIOLOGIC</strong> TRENDS IN <strong>DRUG</strong> <strong>ABUSE</strong>—St. Louis<br />
to all methamphetamine with this crystalline appearance.<br />
Methamphetamine sold for $700–$1,300 per<br />
ounce in St. Louis and for as little as $100–$120 per<br />
gram in some areas, reflecting a slight increase in price<br />
over the past year.<br />
Use of methamphetamine and its derivatives has become<br />
more widespread among high school and college<br />
students, who do not consider these drugs as<br />
dangerous as others. Because methamphetamine is so<br />
inexpensive and appeals to a wide audience, it is<br />
likely that its use will continue to spread.<br />
Depressants<br />
The remaining few private treatment programs often<br />
provide treatment for benzodiazepine, antidepressant,<br />
and alcohol abusers. Social setting detoxification has<br />
become the treatment of choice for individuals who<br />
abuse these substances. Since many of the private<br />
treatment admissions are polysubstance abusers, particular<br />
drug problems are not clearly identified.<br />
Hallucinogens<br />
Over the years, lysergic acid diethylamide (LSD) has<br />
sporadically reappeared in local high schools and<br />
rural areas. Blotters sell for $5–$7 per 35-microgram<br />
dose (exhibit 1b). Much of this LSD is imported from<br />
the Pacific coast. DAWN data in 2004 showed a<br />
small number of cases: 19.<br />
Phencyclidine (PCP) has been available in limited<br />
quantities in the inner city and has generally been<br />
used as a dip on marijuana joints. While PCP is not<br />
seen in quantity, it remains in most indicator data,<br />
including ED mentions, police exhibits, and as a secondary<br />
drug in ME data. Most of the users of this<br />
drug in the inner city are African-American. The unweighted<br />
PCP ED reports in 2004 totaled 23.<br />
Club Drugs<br />
Unweighted DAWN ED data for 2004 show few reports<br />
of methylenedioxymethamphetamine (MDMA)<br />
—only 24. Reports of other club drugs were almost<br />
non-existent; two ketamine and two gamma hydroxybutyrate<br />
(GHB) reports were cited in 2004.<br />
While MDMA remained available at dance parties<br />
and cost $20–$30 per tablet, the popularity of the<br />
drug seems to be declining. Most of the reports about<br />
MDMA abuse are anecdotal or are part of a polydrug<br />
user’s history. Public treatment programs reported no<br />
admissions for MDMA. The private treatment programs<br />
that were queried reported MDMA as part of a<br />
polydrug abuser’s history in less than 10 percent of<br />
their treatment admissions.<br />
Proceedings of the Community Epidemiology Work Group, Vol. II, January 2005 215
No recent GHB incidents or deaths were reported.<br />
GHB education efforts are directed towards ED personnel,<br />
who often see the users initially. Ketamine<br />
(“Special K”), a veterinary anesthetic, is known for<br />
its hallucinogenic effects. Use of ketamine has been<br />
not been seen recently.<br />
INFECTIOUS DISEASES RELATED TO <strong>DRUG</strong> <strong>ABUSE</strong><br />
HIV<br />
HIV seropositivity among IDUs remained low in St.<br />
Louis. While the predominant number of cases is<br />
among men who have sex with men (MSM), the largest<br />
increase was found among young African-<br />
American females, who were infected through heterosexual<br />
or bisexual contact, and young homosexual African-American<br />
males. As a result, increased specialized<br />
minority prevention efforts have been initiated.<br />
Of the total 6,646 persons living with HIV disease<br />
identified through May 2004, 5 percent were IDUs<br />
and 5 percent involved men who have sex with men<br />
and are also IDUs (MSM/IDUs) (exhibit 2). The<br />
number of infected African-Americans was increasing<br />
disproportionately among males and females.<br />
HIV Research<br />
Saint Louis University has continued research on<br />
HIV prevention vaccines. Most of the prevention<br />
vaccine trials have been Phase I trials in low-risk<br />
individuals, and new DNA vaccines and adjuvants<br />
are being studied.<br />
216<br />
<strong>EPIDEMIOLOGIC</strong> TRENDS IN <strong>DRUG</strong> <strong>ABUSE</strong>—St. Louis<br />
Two Phase II trials are being implemented within the<br />
next year.<br />
STDs and Hepatitis C<br />
A resurgence of syphilis among MSM has led to increased<br />
surveillance and targeted prevention programs<br />
to this population. Rates of gonorrhea and<br />
chlamydia remain stable and high in the urban STD<br />
clinics. St. Louis ranks third in the country for gonorrhea,<br />
with cases remaining at approximately 1,000<br />
per year, and second for chlamydia. The increase in<br />
heterosexual transmission is a concern for public<br />
health officials. Further research is needed on ways to<br />
effect sustained behavior change.<br />
HIV and syphilis/gonorrhea rates are high in neighborhoods<br />
known to have high levels of drug abuse,<br />
underscoring the concept of assortative mixing in<br />
cohorts. This may limit the cross-spread of these illnesses<br />
within a neighborhood or Zip Code. Hepatitis<br />
C is a concern in these populations, but inconsistent<br />
reporting has made estimation of the problem and<br />
tracking of hepatitis C cases difficult<br />
REFERENCES<br />
Herlig, C. Strategic Intelligence, St. Louis Office of<br />
the Drug Enforcement Administration. Personal<br />
communication.<br />
Cottler, L.; et al. St. Louis, Missouri: Washington University.<br />
Personal communication.<br />
For inquires concerning this report, please contact Heidi Israel, Ph.D., R.N., L.C.S.W., Saint Louis University School of Medicine, 3691 Rutger –<br />
Suite 103, St. Louis, MO 63110, Phone: (314) 977-9644, Fax: (314) 977-1781, E-mail: Israelha@slu.edu.<br />
Proceedings of the Community Epidemiology Work Group, Vol. II, January 2005
<strong>EPIDEMIOLOGIC</strong> TRENDS IN <strong>DRUG</strong> <strong>ABUSE</strong>—St. Louis<br />
Exhibit 1a. Combined Indicators for Cocaine, Heroin, Marijuana, and Methamphetamine in St. Louis:<br />
1996−June 2004<br />
Indicator<br />
Number of Deaths by Year<br />
Cocaine Heroin Marijuana<br />
Methamphetamine<br />
1996 93 51 NA 1 9<br />
1997 43 67 NA 11<br />
1998 47 56 NA 9<br />
1999 51 44 NA 4<br />
2000 66 47 NA 9<br />
2001 75 20 NA 3<br />
2002 76 50 NA –<br />
2003 78 61 NA --- 2<br />
DAWN ED Data—Weighted Data<br />
Number of Mentions (2002) 3,536 1,167 2,866 150<br />
Number of Mentions (2001) 3,080 1,309 2,311 115<br />
Rate per 100,000 Population (2002) 153 51 124 7<br />
Gender of Mentions (%) (2002)<br />
Male<br />
Female<br />
Age (%) (2002)<br />
12–17<br />
18–34<br />
35 and older<br />
Race (%) (2002)<br />
White<br />
African-American<br />
Hispanic<br />
Other/unknown<br />
Route of Administration (%) (Last update-2000)<br />
Smoking<br />
Intranasal<br />
Injection<br />
Unknown/other<br />
DAWN Live! ED Data—Unweighted Data 4<br />
63.3<br />
36.1<br />
1.5<br />
36.9<br />
61.5<br />
39.1<br />
56.3<br />
0.6<br />
2.9<br />
62.3<br />
25.9<br />
7.0<br />
4.8<br />
Number of Reports (2004) 1,551 560 2,866 150<br />
Gender of Reports (%) (2004)<br />
Male<br />
Female<br />
Age (%) (2004)<br />
12–17<br />
18–34<br />
35 and older<br />
Race (%) (2004)<br />
White<br />
African-American<br />
Hispanic<br />
Other/unknown<br />
Route of Administration (%) (1H 2004)<br />
Smoking<br />
Intranasal<br />
Injection<br />
Unknown/other<br />
64.0<br />
36.0<br />
1.5<br />
40.0<br />
58.5<br />
51.5<br />
49.5<br />
0.0<br />
0.0<br />
93.0<br />
4.0<br />
1.5<br />
1.1<br />
1 NA=Not applicable.<br />
2 Dashes (---) indicate than an estimate has been suppressed because of incomplete data.<br />
3 Dots (…) indicate that an estimate with a relative standard error greater than 50 percent has been suppressed.<br />
4 The unweighted data are from 15 to 18 St. Louis EDs reporting to DAWN. All DAWN cases are reviewed for quality control. Based<br />
on this review, cases may be corrected or deleted and, therefore, are subject to change.<br />
Proceedings of the Community Epidemiology Work Group, Vol. II, January 2005 217<br />
63.8<br />
36.2<br />
1.4<br />
56.0<br />
42.4<br />
55.6<br />
39.9<br />
… 3<br />
3.1<br />
6.4<br />
22.2<br />
71.5<br />
–<br />
69.2<br />
30.8<br />
218<br />
<strong>EPIDEMIOLOGIC</strong> TRENDS IN <strong>DRUG</strong> <strong>ABUSE</strong>—St. Louis<br />
Exhibit 1a. Combined Indicators for Cocaine, Heroin, Marijuana, and Methamphetamine in St. Louis:<br />
1996−June 2004 (Cont’d)<br />
Indicator Cocaine Heroin Marijuana<br />
Treatment Admissions Data<br />
Methamphetamine<br />
Illicit Drug Admissions (%) (2003) 34.6 10.1 27.2 4.7<br />
Illicit Drug Admissions (%) (1H2004) 33.6 10.8 29.6 4.2<br />
Gender (%) (1H2004)<br />
Male<br />
Female<br />
Age (%) (1H2004)<br />
12–17<br />
18–25<br />
26–34<br />
35 and older<br />
Race/Ethnicity (%) (1H2004)<br />
White<br />
African-American<br />
Hispanic<br />
Route of Administration (%) (1H2004)<br />
Smoking<br />
Intranasal<br />
Injecting<br />
Oral<br />
54.9<br />
45.1<br />
0.6<br />
8.0<br />
24.0<br />
67.4<br />
26.1<br />
73.3<br />
1.1<br />
90.7<br />
5.1<br />
1.7<br />
1.6<br />
62.5<br />
37.5<br />
0.8<br />
34.9<br />
25.6<br />
38.6<br />
40.1<br />
59.0<br />
0.9<br />
4.1<br />
37.3<br />
52.9<br />
1.0<br />
SOURCES: DAWN, OAS, SAMHSA; DAWN Live!, OAS, SAMHSA, updated 12/2004; TEDS database<br />
Exhibit 1b. Other Combined Indicators for Cocaine, Heroin, Marijuana, and Methamphetamine in St. Louis:<br />
2002–2004<br />
Indicator Cocaine Heroin Marijuana<br />
Methamphetamine<br />
and Other Drugs<br />
Multisubstance<br />
Older users com- Older users com- alcohol Marijuana com-<br />
Combinations<br />
bine with heroin, bine with cocaine,<br />
monly used in<br />
alcohol<br />
alcohol<br />
combination<br />
Market Data (2002–2003) Powder $100– $20/cap or foil; $10 Sinsemilla $700– Methamphetamine<br />
$125/g, 70% pure; per number-5 gel $1,800/lb, 20% $100–$120/g,<br />
Crack $20/rock, capsule; $1.00– THC; Imported Mexican (20–30%)<br />
50–90% pure; $1.93/mg pure— $2,000−$4,000/lb and local (70–80%<br />
eightball $300 depending if MBT,<br />
pure); hydromor-<br />
SA, SWA, $250–<br />
phone$30–$75/4- $600/g, 13.9–<br />
mg pill; LSD blot-<br />
23.2% pure<br />
ters $2–$7/35 microgram,OxyContin<br />
$40/80 mg<br />
Qualitative Data Readily available, Younger users, 1/3 Readily available, Rural/suburban<br />
urban choice younger than 25 2/3 in treatment users of ampheta-<br />
younger than 25 mine<br />
Other Data of Note N/R 1 Primarily Mexican N/R Methamphetamine<br />
black tar; young<br />
lab seizures pla-<br />
users smoke/snort<br />
teaued; major producers<br />
are superlabs–controlled<br />
by<br />
Hispanic groups<br />
1 N/R=Not reported.<br />
SOURCES: DEA; client ethnographic information<br />
74.0<br />
26.0<br />
25.5<br />
40.1<br />
20.3<br />
14.1<br />
41.1<br />
57.9<br />
1.0<br />
95.8<br />
0.3<br />
0.1<br />
1.6<br />
54.2<br />
45.8<br />
4.4<br />
32.6<br />
36.5<br />
26.5<br />
98.9<br />
0.2<br />
0.0<br />
47.0<br />
14.9<br />
33.3<br />
4.0<br />
Proceedings of the Community Epidemiology Work Group, Vol. II, January 2005
<strong>EPIDEMIOLOGIC</strong> TRENDS IN <strong>DRUG</strong> <strong>ABUSE</strong>—St. Louis<br />
Exhibit 2. Persons Living with HIV Disease in St. Louis Metropolitan Area by Exposure Category, Gender,<br />
Race/Ethnicity, and Age: Year-to-Date and Cumulative Totals Reported Through May 2004<br />
HIV-Positive Test Results<br />
Category<br />
Jan 2004–May 2004<br />
Cumulative<br />
Through May 2004<br />
Number (Percent) Number (Percent)<br />
Exposure Category<br />
MSM 61 (50.0) 4,583 (70.0)<br />
IDU 6 (5.0) 301 (5.0)<br />
IDU/MSM 3 (2.0) 319 (5.0)<br />
Hemophilia 0 (0.0) 58 (1.0)<br />
Heterosexual 12 (10.0) 920 (14.0)<br />
Blood transfusion 0 (0.0) 34 (0.2)<br />
Perinatal 0 (0.0) 41 (1.0)<br />
Unknown 41 (33.0) 267 (4.0)<br />
Total<br />
Gender and Race/Ethnicity<br />
Male<br />
123 6,523<br />
White 40 (33.0) 2,914 (45.0)<br />
African-American 62 (51.0) 2,582 (40.0)<br />
Hispanic 1 (0.0) 79 (1.0)<br />
Other 1 (0.0) 19 (0.0)<br />
Unknown<br />
Female<br />
0 (0) 59 (1.0)<br />
White 4 (3.0) 170 (3.0)<br />
African-American 14 (12.0) 671 (10.0)<br />
Hispanic 2 (0.0) 15 (0.0)<br />
Other<br />
Age<br />
0 (0.0) 13 (0.0)<br />
12 and younger 0 (0.0) 53 (1.0)<br />
13−19 5 (4.0) 160 (2.4)<br />
20−29 39 (32.0) 1,644 (25.2)<br />
30−39 30 (24.0) 2,799 (43.0)<br />
40−49 41 (33.0) 1332 (20.4)<br />
50 and older 8 (7.0) 522 (8.0)<br />
Unknown 0 (0) 13 (0.0)<br />
Total 123 6,523<br />
SOURCE: St. Louis Metropolitan AIDS Program<br />
Proceedings of the Community Epidemiology Work Group, Vol. II, January 2005 219
<strong>EPIDEMIOLOGIC</strong> TRENDS IN <strong>DRUG</strong> <strong>ABUSE</strong>—San Diego County, California<br />
Drug Abuse Patterns and Trends in San Diego County,<br />
California<br />
Michael Ann Haight, M.A. 1<br />
ABSTRACT<br />
San Diego continues to be one of the epicenters for<br />
methamphetamine abuse in the Nation. Fifty-one<br />
percent of the 2004 treatment admissions (excluding<br />
alcohol) were for primary methamphetamine abuse,<br />
up from 47 percent in 2001. Male methamphetamine<br />
admissions have increased with the passage of<br />
Proposition 36, which mandates treatment for persons<br />
arrested on drug charges. Cocaine/crack indicators<br />
remained relatively stable in 2004 over the<br />
prior 9 years; however, this stimulant remains a<br />
serious problem in San Diego. Marijuana also continues<br />
to be a serious problem, accounting for<br />
nearly 51 percent of drug items analyzed by forensic<br />
labs in FY 2004 and for nearly one-quarter of the<br />
primary illicit drug admissions in 2004.<br />
INTRODUCTI<strong>ON</strong><br />
Area Description<br />
In 2000, more than 2.8 million persons resided in San<br />
Diego County (exhibit 1). More than one-half (55<br />
percent) were White and 27 percent were Hispanic.<br />
Projections in 2004 show an increase in the county<br />
population to slightly more than 3.0 million, a decrease<br />
in the White population (to 52 percent) and a<br />
slight increase (1 percent) in the Asian and Hispanic/Latino<br />
populations. Median household income<br />
was nearly $46,000 in 2000 and was projected at<br />
$50,543 in 2004.<br />
A major drug problem in the area is methamphetamine.<br />
There are several geographic and social factors<br />
that foster the manufacture, trafficking, and abuse of<br />
methamphetamine in San Diego County. Geographically,<br />
the county is isolated from the rest of California.<br />
There are 80 miles of border to the south, 70<br />
miles of ocean to the west, mountain ranges to the<br />
east and northeast, and a military base to the north.<br />
There are three border crossings, including the Tijuana<br />
crossing, which is one of the busiest in the<br />
world. The border and the coastline represent a particular<br />
challenge in attempting to control the import<br />
of methamphetamine. In addition, isolated rural areas<br />
1 The author author is affiliated affiliated with The Silvergate Group, San San Diego, California.<br />
220<br />
are ideal for the establishment of small methamphetamine<br />
clandestine labs. Issues related to<br />
methamphetamine are discussed in greater detail in<br />
the section on Drug Abuse Patterns and Trends.<br />
Data Sources<br />
Data for this paper were provided by the following<br />
sources:<br />
• Treatment data were provided by the San<br />
Diego County Alcohol and Drug Data System<br />
for 1987–2004. The 2004 data are annualized,<br />
based on the first 9 months of 2004.<br />
• Drug Abuse Warning Network (DAWN)<br />
emergency department (ED) data are from the<br />
DAWN Live! System, Office of Applied Studies<br />
(OAS), Substance Abuse and Mental Health<br />
Services Administration (SAMHSA). The unweighted<br />
data are for the first 6 months of 2004<br />
and represent between 6 and 9 of the 17 eligible<br />
hospitals reporting during that period. All<br />
DAWN cases are reviewed for quality control,<br />
and, based on the review, cases may be corrected<br />
or deleted; therefore, the data reported in this paper<br />
are subject to change. The data are unweighted<br />
and are not estimates for the San Diego area.<br />
These data cannot be compared with DAWN ED<br />
data for 2002 and before, nor can they be used<br />
for comparison with future data accessed through<br />
DAWN Live!. Only weighted data released by<br />
SAMHSA can be used in trend analysis. A full<br />
description of DAWN can be found at<br />
.<br />
• Forensic laboratory data were provided by the<br />
National Forensic Laboratory Information System<br />
(NFLIS), Drug Enforcement Administration<br />
(DEA), for fiscal year (FY) 2004 (October 2003–<br />
September 2004).<br />
• Drug price information is from the National<br />
Drug Intelligence Center (NDIC) for July<br />
through December 2004.<br />
• Seizure data on methamphetamine were provided<br />
by the DEA.<br />
Proceedings of the Community Epidemiology Work Group, Vol. II, January 2005
• Acquired immunodeficiency syndrome (AIDS)<br />
data were taken from the San Diego County<br />
Health and Human Services Agency, “Human<br />
Immunodeficiency Virus (HIV) Surveillance Report.”<br />
In addition, findings from the 2003 Arrestee Drug<br />
Abuse Monitoring (ADAM) program and the 2002<br />
DAWN medical examiner/coroner system are presented<br />
in the discussion below on methamphetamine.<br />
<strong>DRUG</strong> <strong>ABUSE</strong> PATTERNS AND TRENDS<br />
At the January 2005 CEWG meeting, members focused<br />
on the abuse of stimulants, primarily methamphetamine<br />
and cocaine. The primary focus of this<br />
paper is methamphetamine abuse, a major problem in<br />
San Diego County.<br />
Methamphetamine<br />
San Diego continues to be one of the epicenters for<br />
methamphetamine abuse in the United States. While<br />
abuse indicators are mixed, they clearly show that<br />
methamphetamine is a major problem in the county.<br />
As noted earlier, the manufacture of methamphetamine<br />
continues to be a problem.<br />
Prior to 1989, there were many small methamphetamine<br />
labs in San Diego, operated by local “cookers”<br />
and outlaw motorcycle clubs. Over the years, however,<br />
the production and abuse of methamphetamine<br />
“waxed and waned.” The Chemical Diversion and<br />
Trafficking Act of 1988 and the Chemical Control<br />
Diversion Act of 1993 helped to curtail access to the<br />
precursors used to make methamphetamine. In addition,<br />
a DEA sting effort, Operation Triple Neck, resulted<br />
in arrests and the closing of stores that supplied<br />
equipment and chemicals to the methamphetamine<br />
cookers. Most methamphetamine indicators<br />
declined for a time, but new sources and distribution<br />
networks emerged so that…<br />
• Mexican nationals and Mexican-Americans, operating<br />
on both sides of the border, began to produce<br />
large quantities of high-purity methamphetamine.<br />
• The already established networks used to distribute<br />
other illicit drugs were used to distribute<br />
methamphetamine.<br />
• The profits from these operations were large.<br />
<strong>EPIDEMIOLOGIC</strong> TRENDS IN <strong>DRUG</strong> <strong>ABUSE</strong>—San Diego County, California<br />
In FY 2004, methamphetamine accounted for 26.7 percent<br />
of all drug items reported by NFLIS; amphetamines<br />
accounted for less than 1 percent (exhibit 2).<br />
Slightly more than one-half (51 percent) of primary<br />
illicit drug admissions in 2004 were for primary<br />
abuse of methamphetamine (exhibit 3). Trend data<br />
from 1987 through 2004 show that methamphetamine<br />
treatment admissions (n=6,973) and total treatment<br />
admissions (18,009) peaked in San Diego in 2002.<br />
The 2003 data provide more detailed information on<br />
primary methamphetamine treatment admissions.<br />
Also, as shown below, major changes have occurred<br />
in the referral patterns and in the demographic composition<br />
of methamphetamine treatment admissions…<br />
• Nearly three-fourths (72.3 percent) of the 6,365<br />
primary methamphetamine abuse treatment admissions<br />
in San Diego County were referred by<br />
the criminal justice system, compared with only<br />
14 percent in 1987.<br />
• The proportion of male methamphetamine treatment<br />
admissions increased, reaching 58 percent<br />
in 2003.<br />
• The median age of methamphetamine admissions<br />
increased, reaching 33 in 2003.<br />
• The percentage of Hispanic methamphetamine<br />
admissions increased from 12 percent in 1991 to<br />
28 percent in 2003. At the same time, White admissions<br />
decreased from 79 percent in 1991 to<br />
55 percent in 2003.<br />
Over the years, a number of factors were associated<br />
with increases in total admissions and those for<br />
methamphetamine, including the following:<br />
• Law enforcement actions in the late 1980s and<br />
early 1990s, such as Operation Triple Neck<br />
• The establishment of the Methamphetamine<br />
Strike Force (MSF)<br />
• The establishment of and increase in the number<br />
of drug courts<br />
• The passage of Proposition 36 in 2000, which<br />
mandated treatment of drug users involved in the<br />
criminal justice system.<br />
Some of these external factors are graphically depicted<br />
in exhibit 4, together with treatment admissions<br />
data. Note that “budget problems” in the State<br />
Proceedings of the Community Epidemiology Work Group, Vol. II, January 2005 221
correspond to decreases in total admissions, including<br />
primary methamphetamine admissions in 2003.<br />
DAWN unweighted emergency department (ED)<br />
reports of methamphetamine totaled 335 in the first<br />
half of 2004, representing 61 percent of the 549<br />
“Stimulant” reports (which also include amphetamines)<br />
(exhibit 5).<br />
Price data from NDIC show that methamphetamine<br />
cost $60 per gram in the last half of 2004 (exhibit 6).<br />
Other indicator data in San Diego County show the<br />
following patterns and trends in methamphetamine<br />
abuse:<br />
• Methamphetamine overdose deaths peaked in<br />
1997 (62), decreased in 1999 (37), increased<br />
again in 2001 (61), and declined in 2003 (48).<br />
• Methamphetamine-positive toxicology tests<br />
among adult male arrestees increased from 32 to<br />
36 percent from 2002 to 2003. Methamphetamine-positive<br />
tests among adult female arrestees<br />
increased from 37 to 47 percent over the same<br />
time period, while those among juvenile arrestees<br />
increased from 9 to 15 percent.<br />
Over many years, San Diego County has had considerable<br />
experience in assessing and addressing problems<br />
associated with methamphetamine production<br />
and abuse. One of the first questions that had to be<br />
addressed was, “What are we going to do about the<br />
problem?” In response, the County Board of Supervisors<br />
established the Methamphetamine Strike Force<br />
in March 1996, a collaborative “assessment and action”<br />
effort involving more than 60 members. The<br />
MSF makes use of 10 data sources to guide the Force<br />
in assessing the problem at the community level, determining<br />
what actions to take, and evaluating results.<br />
It was recognized from the beginning that addressing<br />
the problems associated with methamphetamine required<br />
a long-term commitment; thus, attention was<br />
focused on many different aspects of the problem,<br />
including the following:<br />
• Developing effective plans and policies<br />
• Controlling the availability of precursor chemicals<br />
• Taking steps to protect endangered children<br />
• Making effective use of the media<br />
• Developing and making use of training at all levels<br />
The two newest initiatives include a focus on women<br />
and the border.<br />
222<br />
<strong>EPIDEMIOLOGIC</strong> TRENDS IN <strong>DRUG</strong> <strong>ABUSE</strong>—San Diego County, California<br />
The Strike Force Web site is: .<br />
Cocaine/Crack<br />
Cocaine indicators remained relatively stable over the<br />
past 9 years. This stimulant is still a serious problem<br />
in San Diego. Cocaine hydrochloride (HCl) and crack<br />
are readily available in San Diego.<br />
Nearly 14 percent of the drug items analyzed by forensic<br />
labs in FY 2004 were cocaine items (exhibit 2).<br />
Treatment admissions for primary cocaine abuse,<br />
excluding alcohol, accounted for 10.4 percent of admissions<br />
in 2004, down slightly from 2001 (exhibit<br />
3). Eighty-two percent of the cocaine admissions in<br />
2004 were for crack abuse.<br />
Unweighted ED reports of cocaine totaled 245 in the<br />
first half of 2004 and accounted for 17.3 percent of<br />
the illicit drug reports (excluding Alcohol Only for<br />
persons younger than 21).<br />
Heroin<br />
A small percentage (1.5 percent) of the 15,018 drug<br />
items analyzed in FY 2004 was heroin items (exhibit 2).<br />
Treatment admissions for primary heroin abuse (excluding<br />
alcohol) represented 10.4 percent of the illicit<br />
drug admissions in 2004.<br />
NDIC reports that Mexican brown powder costs $60–<br />
$100 per gram while Mexican black tar costs $50–<br />
$100 per gram.<br />
Other Opiates<br />
Opiates other than heroin accounted for 2.6 percent<br />
(n=389) of the drug items analyzed by forensic labs<br />
in FY 2004 (exhibit 2). Of the other opiate items,<br />
39.3 percent were hydrocodone items, 9.5 percent<br />
were oxycodone, and 8.7 percent were codeine items.<br />
During the first half of 2004, there were 297 unweighted<br />
ED reports of opiates/opioids. These accounted<br />
for 45 percent of the “Drugs of Misuse” reports.<br />
Of the 297 opiate/opioid reports, 110 (37 percent)<br />
were hydrocodone reports and 42 (14 percent)<br />
were oxycodone reports.<br />
Marijuana<br />
Marijuana continues to be a serious problem in San<br />
Diego. Slightly more than one-half (50.8 percent) of<br />
the items analyzed by forensic labs in FY 2004 were<br />
Proceedings of the Community Epidemiology Work Group, Vol. II, January 2005
cannabis, nearly double the proportion of methamphetamine<br />
items (exhibit 2).<br />
Primary marijuana abuse accounted for nearly onefourth<br />
(23.8 percent) of treatment admissions (excluding<br />
alcohol) in 2004, changing only slightly from<br />
the previous 3 years (exhibit 2).<br />
In the DAWN Live! System, there were 313 unweighted<br />
marijuana reports in the first half of 2004;<br />
these represented 22.1 percent of the illicit drug reports.<br />
In the last 6 months of 2004, an ounce of marijuana<br />
cost $60–$100 retail (exhibit 6).<br />
Club Drugs<br />
There were few indicators of club drugs in recent<br />
data sources. In FY 2004, 61 methylenedioxymethamphetamine<br />
(MDMA) and methylenedioxyamphetamine<br />
(MDA) items were reported by police forensic<br />
labs, accounting for 0.4 percent of all drug<br />
items analyzed (exhibit 2). Twenty phencyclidine<br />
(PCP) items were reported, representing 0.1 percent<br />
of the total items. The retail price of MDMA per tablet<br />
was $15–$30 in the last half of 2004 (exhibit 6).<br />
Benzodiazepines<br />
Benzodiazepine-type drugs accounted for 1.6 percent<br />
(n=249) of the drug items analyzed by forensic labs<br />
in 2004 (exhibit 2). Of the 249 items, 36.5 percent<br />
were diazepam items, 20.1 percent were alprazolam,<br />
and 8.8 percent were lorazepam.<br />
Forty-one percent of the drugs of misuse in ED unweighted<br />
reports in the first half of 2004 were benzodiazepine<br />
reports.<br />
INFECTIOUS DISEASES RELATED TO <strong>DRUG</strong> <strong>ABUSE</strong><br />
HIV/AIDS<br />
Since 1981 when the first AIDS cases in San Diego<br />
County were diagnosed, there have been 12,034<br />
AIDS cases reported for the county. Since 1999, the<br />
number of annual AIDS cases reported in San Diego<br />
has been in the mid-400 range. There were 538 cases<br />
<strong>EPIDEMIOLOGIC</strong> TRENDS IN <strong>DRUG</strong> <strong>ABUSE</strong>—San Diego County, California<br />
reported in 2003. In 2003, AIDS cases were 43 percent<br />
White, 17 percent were African-American, and<br />
37 percent were Hispanic. Eighty percent of male San<br />
Diego AIDS cases were infected through male-tomale<br />
sex. For San Diego females, heterosexual contact<br />
was the most common mode of transmission.<br />
From July 1, 2002, to December 31, 2003, a total of<br />
4,155 HIV cases were reported for San Diego County.<br />
Of these, 89 percent were male, 62 percent were<br />
White, 43 percent were age 30–39, and 72 percent<br />
were infected by male-to-male sex.<br />
Hepatitis B and C Virus<br />
In San Diego, 849 cases of chronic hepatitis B and 18<br />
cases of acute hepatitis B (HBV) were reported in<br />
2003. The rates per 100,000 population for chronic<br />
and acute HBV were 28.7 and 0.6, respectively,<br />
down significantly from the respective 1995 rates of<br />
35.9 and 2.1.<br />
Hepatitis C virus (HCV), however, has shown different<br />
trends in San Diego. In 2003, there were 2,725<br />
reported HCV cases in San Diego, more than double<br />
the 1,101 cases reported in 1995. The respective rates<br />
per 100,000 were 92.0 in 2003 as compared with 40.5<br />
in 1995.<br />
Other Sexually Transmitted Diseases<br />
In 2003, there were 109 infectious syphilis cases and<br />
8 congenital syphilis cases, compared with 106 and<br />
36, respectively in 1993. Forty-four percent of the<br />
2003 syphilis cases were age 35–44, 96 percent were<br />
male, 69 percent were White, and 72 percent resided<br />
in the central region of San Diego County.<br />
The number of cases of gonorrhea declined from<br />
3,579 in 1993 to 1,972 in 2003, while the number of<br />
chlamydia cases increased from 1993 to 2001 (from<br />
7,720 to 10,249 cases). Twenty-six percent of the<br />
gonorrhea cases were age 20–24, 63 percent were<br />
male, 40 percent were White, and 41 percent lived in<br />
the central region of San Diego County. Of the 2003<br />
chlamydia cases, 39 percent were age 20–24, 74 percent<br />
were female, 44 percent were Hispanic, and 28<br />
percent lived in the central region of San Diego<br />
County.<br />
For inquiries concerning this report, please contact Michael Ann Haight, Silvergate Group (for the County of San Diego, Alcohol and Drug<br />
Services), Phone: 619-920-6311, E-mail: michaelhaight@cox.net.<br />
Proceedings of the Community Epidemiology Work Group, Vol. II, January 2005 223
224<br />
<strong>EPIDEMIOLOGIC</strong> TRENDS IN <strong>DRUG</strong> <strong>ABUSE</strong>—San Diego County, California<br />
Exhibit 1. Total Population and Population by Race/Ethnicity for San Diego County, by Percent:<br />
2000, 2004<br />
Race/Ethnicity<br />
2000<br />
(N=2,813,833)<br />
2004<br />
(N=3,017,204)<br />
White 55 52<br />
Black or African-American 5 5<br />
Asian 9 10<br />
Other Race 4 4<br />
Hispanic/Latino (of Any Race) 27 28<br />
Median Household Income $45,871 $50,543<br />
Single Family Home Median Price $525,000<br />
SOURCE: San Diego Association of Governments Census Publications<br />
Exhibit 2. Number and Percentage of Selected Items Analyzed by Forensic Laboratories in San Diego:<br />
FY 2004<br />
Drug Number Percent<br />
Methamphetamine 4,054 26.7<br />
Amphetamine 14 0.1<br />
Cocaine 2,118 13.9<br />
Heroin 233 1.5<br />
Cannabis 7,716 50.8<br />
Other Opiates 389 2.6<br />
Benzodiazepines 249 1.6<br />
MDMA/MDA 61 0.4<br />
PCP 20 0.1<br />
N=15,018 items analyzed.<br />
SOURCE: NFLIS, DEA<br />
Exhibit 3. Percentages of Primary Treatment Admissions (Excluding Alcohol) for Selected Drugs in San<br />
Diego County: 2001–2004<br />
Drug 2001 2002 2003 2004 1<br />
Methamphetamine 47.3 49.7 52.8 50.6<br />
Amphetamine 0.6 0.6 0.5 NR 2<br />
Cocaine 12.1 10.2 9.6 10.4<br />
Heroin 12.3 11.7 10.9 10.4<br />
Marijuana 25.9 25.4 24.5 23.8<br />
1<br />
Data are annualized based on the first 9 months of 2004.<br />
2<br />
NR=Not reported.<br />
SOURCE: San Diego County Alcohol and Drug Data System<br />
Proceedings of the Community Epidemiology Work Group, Vol. II, January 2005
<strong>EPIDEMIOLOGIC</strong> TRENDS IN <strong>DRUG</strong> <strong>ABUSE</strong>—San Diego County, California<br />
Exhibit 4. Changes in Treatment Admissions in Relation to Law Enforcement and Other Societal Changes:<br />
1987–2004<br />
20,000<br />
18,000<br />
16,000<br />
14,000<br />
12,000<br />
10,000<br />
8,000<br />
6,000<br />
4,000<br />
2,000<br />
0<br />
5,666<br />
839<br />
Methamphetamine<br />
Admissions<br />
Total Admissions<br />
7,261<br />
1,208<br />
Operation Triple<br />
Neck takes out<br />
major suppliers<br />
Meth<br />
surpasses<br />
alcohol in<br />
treatment<br />
10,602<br />
3,591<br />
SOURCES: San Diego County Alcohol and Drug Data System and other archival data<br />
Exhibit 5. Numbers and Percentages 1 of ED Reports for Selected Illicit Drugs of Abuse (Unweighted 2 ):<br />
January–June 2004<br />
Drug Number Percent<br />
Cocaine 245 17.3<br />
Heroin 243 17.2<br />
Marijuana 313 22.1<br />
Stimulants 549 38.8<br />
MDMA 12 0.8<br />
PCP 12 0.8<br />
GHB 10 0.8<br />
MSF<br />
starts<br />
1 Represents the percentage of all illicit drugs, excluding Alcohol Only cases for persons younger than 21.<br />
2 The unweighted data are from 6–9 San Diego EDs reporting to DAWN. All DAWN cases are reviewed for quality control. Based on<br />
this review, cases may be corrected or deleted and, therefore, are subject to change.<br />
SOURCE: DAWN Live!, OAS, SAMHSA, updated January 18, 2005<br />
Proceedings of the Community Epidemiology Work Group, Vol. II, January 2005 225<br />
4,418<br />
12,099<br />
Prop. 36<br />
voted in<br />
6,973<br />
18,009<br />
Budget<br />
Problems<br />
15,491<br />
1987 1988 1989 1990 1991 1992 1993 1994 1995 1996 1997 1998 1999 2000 2001 2002 2003 2004<br />
6,692
<strong>EPIDEMIOLOGIC</strong> TRENDS IN <strong>DRUG</strong> <strong>ABUSE</strong>—San Diego County, California<br />
Exhibit 6. Retail Prices for Selected Drugs in San Diego: July–December 2004<br />
Drug Price Unit and Type<br />
Powdered Cocaine $60–$80 Gram<br />
$25–$35 One-quarter gram<br />
Crack $10–$20 Rock<br />
Heroin $60–$100 Gram (Mexican brown powder)<br />
$10–$15 One-tenth gram (Mexican brown powder)<br />
$50–$100 Gram (Mexican black tar)<br />
Marijuana $60–$100 Ounce<br />
Methamphetamine $60 Gram<br />
$20–$25 One-quarter gram<br />
$150–$300 One-quarter ounce<br />
MDMA $15–$30 Tablet<br />
SOURCE: NDIC<br />
226<br />
Proceedings of the Community Epidemiology Work Group, Vol. II, January 2005
<strong>EPIDEMIOLOGIC</strong> TRENDS IN <strong>DRUG</strong> <strong>ABUSE</strong>—San Francisco Bay Area<br />
Patterns and Trends of Drug Use in the San Francisco Bay Area<br />
John A. Newmeyer, Ph.D. 1<br />
ABSTRACT<br />
In January 2005, the author conducted a comprehensive<br />
review of indicators of use of illicit substances<br />
in the San Francisco Bay area. Cocaine use<br />
remains low compared with use in the rest of the<br />
United States. Indicators show no clear upward or<br />
downward trend over the past 3 years. Heroin use<br />
indicators consistently point to a decline in use from<br />
the 1999 peak. Injection remains by far the predominant<br />
mode of usage. There are strong indications<br />
of an upsurge in use of oxycodone and hydrocodone.<br />
Methamphetamine use in the bay area is<br />
high compared to use in other metropolitan areas;<br />
most indicators point to a further increase in usage<br />
levels during the past 3 years. Indicators of use of<br />
‘club drugs’ reached peaks in 2001 and then declined<br />
in 2002; ED reports and medical examiner<br />
mentions remain few compared to those for cocaine,<br />
heroin, or ‘speed.’ The prevalence of HIV among<br />
heterosexual drug injectors appears to have stabilized<br />
at a low level (6 to 10 percent), but HCV appears<br />
to be close to full saturation among that population.<br />
A recent legislative bill (SB 1159) enables<br />
California pharmacies to sell hypodermic equipment<br />
without prescriptions. This may have a significant<br />
impact upon disease transmission. A recently<br />
approved initiative (Oakland’s Measure Z) directs<br />
local authorities to create systems for the regulation<br />
and taxation of adult marijuana use.<br />
INTRODUCTI<strong>ON</strong><br />
Area Description<br />
The San Francisco Bay area consists of the following<br />
counties: San Francisco, San Mateo, Alameda, Contra<br />
Costa, and Marin. The population was 4,160,000<br />
as of July 2003. The population is among the most<br />
multicultural of any urban region of the United<br />
States, with a particularly large, varied, and longestablished<br />
Asian-American representation (19 percent<br />
of the total). The Hispanic population represents<br />
a wide cross-section of persons of Latin American<br />
origin. Blacks account for some 11 percent of bay<br />
area residents. San Francisco County has long been a<br />
mecca for gays: gay men constitute more than 15<br />
percent of the adult male population.<br />
The bay area experienced its initial growth during the<br />
California gold rush. In the succeeding century and a<br />
half, it expanded greatly as a center for shipping,<br />
manufacturing, finance, and tourism. In recent years,<br />
Pacific Basin trade and high technology such as software<br />
and biotechnology development have led to further<br />
expansion and to a highly diversified economy.<br />
Since 1994, there has been a steep rise in the cost of<br />
rental housing in the bay area, especially in San<br />
Francisco, Marin, and San Mateo Counties. This has<br />
caused significant out-migration of lower income<br />
people, which may be exerting downward pressure<br />
on local drug-use prevalence. Reverses in hightechnology<br />
industries mitigated this pressure during<br />
2001–2003, with unemployment rising from 2 to 6<br />
percent and the overall population slightly declining.<br />
In the past year, unemployment rates have decreased<br />
and population is once again slowly increasing.<br />
Data Sources<br />
1 The author is affiliated with Haight-Ashbury Free Clinics, Inc., San Francisco, California.<br />
The sources of data for the drug abuse indicators<br />
within this report are described below:<br />
• Emergency department (ED) drug data were<br />
accessed from the Drug Abuse Warning Network<br />
(DAWN) Live!, a restricted-access online query<br />
system administered by the Office of Applied<br />
Studies (OAS), Substance Abuse and Mental<br />
Health Services Administration (SAMHSA). The<br />
unweighted data are for three counties of the San<br />
Francisco Bay area (San Francisco, Marin, and<br />
San Mateo) for 2004. Seventeen of the 18 eligible<br />
hospitals in the area are in the DAWN sample.<br />
There are 19 emergency departments in the<br />
sample. (Some hospitals have more than one<br />
ED.) The data for 2004 were incomplete. Over<br />
the 12-month period, between 8 and 11 EDs reported<br />
data each month, with most reporting data<br />
that were basically complete (90 percent or<br />
greater). Data are preliminary and are not estimates<br />
for the San Francisco area. The DAWN<br />
Live! data were accessed 1/10/2005. Since all<br />
DAWN cases are reviewed for quality control,<br />
and may be corrected or deleted, the data reported<br />
here are subject to change. The information<br />
derived from DAWN Live! represent drug<br />
Proceedings of the Community Epidemiology Work Group, Vol. II, January 2005 227
228<br />
reports in drug-related visits; reports exceed the<br />
number of ED visits because a patient may report<br />
use of multiple drugs (up to six drugs and alcohol<br />
may be presented in DAWN). This paper focuses<br />
on demographic characteristics of different<br />
drugs in drug-related visits. These data cannot be<br />
compared with DAWN data from 2002 and before,<br />
nor can these preliminary data be used for<br />
comparison with future data. Only weighted ED<br />
data released by SAMHSA can be used for trend<br />
analysis. A full description of the DAWN system<br />
can be found at the DAWN Web site<br />
.<br />
• Treatment admissions data were available for<br />
all five bay area counties for 1999 through the<br />
first half of 2004. These data were compiled by<br />
the California Department of Alcohol and Drug<br />
Programs (DADP). In addition, admissions data<br />
for San Francisco County were provided by the<br />
San Francisco Department of Public Health for<br />
fiscal years (FYs) 2000 through 2004.<br />
• Medical examiner (ME) data on drug mentions<br />
in decedents in three counties (San Francisco,<br />
Marin, and San Mateo) were provided by<br />
the DAWN mortality system for 2002, along with<br />
comparable data for 1997–2001. The DAWN system<br />
covered 100 percent of the metropolitan statistical<br />
area (MSA) jurisdiction and 100 percent of<br />
the MSA population in 2002.<br />
• Reports of arrests for drug law violations and<br />
counts of reported burglaries were provided by<br />
the San Francisco Police Department (SFPD) for<br />
2001 through 2004.<br />
• Arrestee drug testing data are from the Arrestee<br />
Drug Abuse Monitoring (ADAM) program, National<br />
Institute of Justice, for San Jose and Sacramento<br />
for 2003 for adult males and for San Jose<br />
for adult females.<br />
• Price and purity data came from the Drug Enforcement<br />
Administration (DEA), Domestic<br />
Monitor Program (DMP), and referenced heroin<br />
“buys,” mostly made in San Francisco County.<br />
Preliminary data for 2003 were compared with<br />
those for 1994–2002. Data on trafficking in heroin<br />
and other drugs were available from the National<br />
Drug Intelligence Center’s (NDIC) report, Narcotics<br />
Digest Weekly, December 28, 2004. Additional<br />
data on trafficking and production were provided<br />
by the National Drug Threat Assessment 2004<br />
publication of the NDIC.<br />
<strong>EPIDEMIOLOGIC</strong> TRENDS IN <strong>DRUG</strong> <strong>ABUSE</strong>—San Francisco Bay Area<br />
• Ethnographic information was obtained through<br />
interviews with treatment program staff and outreach<br />
workers in January 2005. Their observations<br />
were compared with those they made in December<br />
2003 and May 2004 and pertained mostly to<br />
San Francisco County.<br />
• Acquired immunodeficiency syndrome (AIDS)<br />
surveillance data were provided by the San Francisco<br />
Department of Public Health (SFDPH) and<br />
covered the period through September 30, 2004.<br />
• Hepatitis B (HBV) data for San Francisco<br />
County were available for 1996 through the first<br />
half of 2004 and were provided by the SFDPH.<br />
• Hepatitis C (HBC) virus prevalence estimates<br />
were provided by the Urban Health Study (UHS)<br />
for 2003.<br />
<strong>DRUG</strong> <strong>ABUSE</strong> PATTERNS AND TRENDS<br />
Cocaine/Crack<br />
Local observers note two interesting developments:<br />
youths are injecting crack which they “break down”<br />
with vitamin C powder and African-Americans have<br />
shifted somewhat away from smoking crack and toward<br />
snorting powder.<br />
Unweighted data accessed from DAWN Live! show<br />
that reports of cocaine in 2004 represented patient<br />
who were predominantly Black; 65 percent were<br />
male. There were twice as many reports involving<br />
those older than 45 (36 percent) than younger than 30<br />
(18 percent). Smoking was the preferred route of use<br />
for three-fifths of these patients.<br />
In the five-county bay area, the overall number of admissions<br />
for drug treatment, other than alcohol, declined<br />
steadily between 1999 and 2002 and then rose<br />
slightly to a new level in 2003 and 2004 (exhibit 1).<br />
The proportion of cocaine/crack admissions among<br />
these admissions rose from 24 to 26 percent between<br />
2001 and 2003. Among these admissions, more than<br />
87 percent cited smoking—presumably of crack—as<br />
the preferred route of use. During FYs 2000 to 2004,<br />
San Francisco County cocaine admissions fluctuated<br />
narrowly, with no particular trend, in the range of<br />
2,250 to 2,600 (exhibit 2).<br />
According to DAWN data, ME death mentions involving<br />
cocaine in three bay area counties fluctuated<br />
within a narrow range, with no particular trend, between<br />
1997 and 2000 (exhibit 3). In 2002, however,<br />
total mentions were 39 percent below the 1997–2000<br />
average.<br />
Proceedings of the Community Epidemiology Work Group, Vol. II, January 2005
Cocaine-positive tests among arrestees in San Jose<br />
and Sacramento, nearby metropolises which are<br />
ADAM sites, may give some indication of cocaine<br />
use prevalence in San Francisco. During 2003, 13<br />
percent of adult male arrestees in San Jose and 22<br />
percent of those in Sacramento tested positive for<br />
cocaine. The two areas had, respectively, the fourth<br />
and ninth lowest proportions of cocaine-positive arrestees<br />
among all 39 ADAM sites. For adult female<br />
arrestees in San Jose, 10 percent tested positive—the<br />
second lowest proportion among 25 ADAM sites.<br />
There were nearly 3,800 arrests on cocaine-related<br />
charges in San Francisco in 2004.<br />
According to the NDIC, local prices for powder cocaine<br />
in 2004 were $16,000–$21,000 per kilogram,<br />
$530–$800 per ounce, and as low as $10 per quarter<br />
gram. Crack prices were around $600 per ounce and<br />
$20–$50 per “rock.” These prices were up slightly<br />
from 2002.<br />
To summarize, cocaine use in the bay area is low<br />
compared with use in the rest of the United States.<br />
The indicators do not reflect any consistent upward<br />
or downward trend in the past 3 years.<br />
Heroin<br />
According to the unweighted DAWN Live! data, reports<br />
of heroin during 2004 involved patients who<br />
were two-thirds male and nearly two-thirds White.<br />
Thirty-nine percent were older than 45, and only 19<br />
percent were younger than 30. Injection is the overwhelming<br />
preference (93 percent) as the route of use.<br />
The number of treatment admissions for primary heroin<br />
problems in the five-county bay area fell by more<br />
than half between 1999 and 2004 (exhibit 1). As a<br />
proportion of all primary drug admissions excluding<br />
alcohol, heroin constituted 64 percent in 1994, 55<br />
percent in 1999, and only 36 percent in 2003. Injection<br />
remains by far the predominant route of use: 80<br />
percent reported that route, as compared with 14 percent<br />
who reported inhalation as the preferred route.<br />
San Francisco County heroin admissions fell by 9<br />
percent between FYs 2002 and 2004 (exhibit 2).<br />
ME death mentions involving heroin in 2002 were at<br />
their lowest level in 6 years (exhibit 3). The count for<br />
2002 was 43 percent below the average for 1997–<br />
2000. Males accounted for 87 percent of the heroinrelated<br />
death mentions in 2000. The median age of<br />
the decedents was 40.<br />
In the ADAM program in 2003, 3.1 percent of adult<br />
male arrestees in San Jose and 6.9 percent of those in<br />
<strong>EPIDEMIOLOGIC</strong> TRENDS IN <strong>DRUG</strong> <strong>ABUSE</strong>—San Francisco Bay Area<br />
Sacramento tested opiate positive; the median across<br />
the 39 ADAM sites was 5.8 percent. Of female arrestees<br />
in San Jose, 3.4 percent tested positive, well<br />
below the 25-city median of 6.6 percent.<br />
Arrests for heroin-related offenses totaled 6,136 in<br />
2002, 16 percent higher than in 2001 and 3 percent<br />
higher than in 2000. However, in 2003 such arrests<br />
were about 30 percent below, and in 2004 about 55<br />
percent below, the 2002 level.<br />
Because many heroin users support their habits<br />
through property crimes, reported burglaries may be<br />
a good indicator of use. The number of such reports<br />
in San Francisco fell by 49 percent between 1993 and<br />
1999 (11,164 to 5,704). After that low point, the<br />
count rose to 6,706 in 2001, fell to 5,507 in 2003, and<br />
rose again to nearly the 2001 level in 2004. These<br />
changes may reflect the price of heroin more than the<br />
prevalence of users; it is noteworthy that reported<br />
burglaries and the local price of heroin are both<br />
barely one-quarter of what they were 20 years ago.<br />
The DEA’s DMP tested heroin street buys in the San<br />
Francisco area during 2003. The 27 buys were all of<br />
Mexican origin. The 2003 samples averaged 11 percent<br />
pure and $0.98 per pure milligram (exhibit 4).<br />
Of the last 10 years, 2001, 2002, and 2003 were the 3<br />
with the highest average price and lowest average<br />
purity.<br />
Prices of Mexican black tar heroin ranged from<br />
$9,200 to $30,000 per kilogram and from $230 to<br />
$850 per ounce in 2004. Gram prices ranged from<br />
$50 to $75. In 2002, prices were $16,000–$30,000<br />
per kilogram, $450–$850 per ounce, and around $60<br />
per gram.<br />
In summary, most indicators point to a decline in<br />
heroin use in the period from 2000 to 2004.<br />
Other Opiates<br />
Local observers note a significant increase in oxycodone<br />
availability and usage. ME death mentions in<br />
the overall “narcotic analgesics” category fluctuated<br />
within a narrow range in 1997–2000, but then they<br />
dropped in 2001 and 2002 to a level 29 percent below<br />
the 1997–2000 average (exhibit 3). The combined<br />
count of hydrocodone and oxycodone in the unweighted<br />
DAWN Live! ED reports in 2004 was less<br />
than 8 percent that of heroin. For hydrocodone, whose<br />
count was more than twice that of oxycodone, 57 percent<br />
of the reports represented male patients, 71 percent<br />
represented Whites, and 63 percent represented<br />
patients older than 35.<br />
Proceedings of the Community Epidemiology Work Group, Vol. II, January 2005 229
Marijuana<br />
Arrests for marijuana-related offenses in San Francisco<br />
County numbered 1,736 in 2000. The count of<br />
arrests ranged between 1,300 and 1,450 in the next 3<br />
years before returning to the 2000 level in 2004.<br />
Among adult male arrestees in the ADAM program<br />
in 2003, 35 percent of those in San Jose and 49 percent<br />
of those in Sacramento tested positive for marijuana.<br />
The median across the 39 ADAM sites was 44<br />
percent. Among female arrestees in San Jose, 29 percent<br />
tested positive, near the 25-site median of 32<br />
percent.<br />
Marijuana treatment admissions in San Francisco<br />
County reached a peak in FY 2003; they then<br />
dropped by 14 percent in FY 2004 (exhibit 2).<br />
In 2004, sinsemilla marijuana sold for $3,000–$6,000<br />
per pound, and domestic marijuana sold for $4,000–<br />
$5,000 per pound. Domestic marijuana sold for about<br />
$200 per ounce. A large, and increasing, quantity of<br />
marijuana is sold legally from medical marijuana<br />
outlets to certified purchasers. There appears to be<br />
effective regulation of price and quality in that new<br />
“market.”<br />
In November 2004, Oakland voters passed Measure<br />
Z by a margin of 65 to 35 percent. This may portend<br />
an important development in American policy on<br />
marijuana, in that Measure Z explicitly instructs the<br />
city of Oakland to create systems for the regulation<br />
and taxation of adult use of marijuana.<br />
According to the NDIC, California remains a leading<br />
producer of domestic marijuana. The State accounted<br />
for more than one-third of outdoor plants eradicated<br />
in 2001 and 2002 and more than two-thirds of those<br />
eradicated from National Forest Service lands. Several<br />
bay area counties (Alameda, Contra Costa, Lake,<br />
Mendocino, Monterey, Napa, Santa Cruz, and Sonoma)<br />
were cited as areas where considerable cultivation<br />
has occurred in recent years.<br />
The overall indications are that marijuana use peaked<br />
in 2001 and has declined significantly since then.<br />
Stimulants<br />
Ethnographic observations suggest an increase in<br />
“speed” use by youth, but no major changes of use<br />
patterns among older adults were reported. Gay<br />
males remain a very prominent portion of the user<br />
population.<br />
230<br />
<strong>EPIDEMIOLOGIC</strong> TRENDS IN <strong>DRUG</strong> <strong>ABUSE</strong>—San Francisco Bay Area<br />
Nearly as many methamphetamine reports as heroin<br />
reports appear in the unweighted DAWN Live! data<br />
for the San Francisco area in 2004. About four-fifths<br />
of the ED reports in 2004 involved patients who were<br />
male, about three-fourths involved Whites, and twothirds<br />
involved those older than 30.<br />
The number of treatment admissions for primary<br />
speed problems in the five-county bay area increased<br />
steadily between 1999 and 2004 (exhibit 1). The proportion<br />
of primary speed users among all nonalcohol<br />
drug admissions rose from 13 percent in 1999 to 23<br />
percent in 2003. It was noteworthy that fully 64 percent<br />
of speed users claimed smoking as the preferred<br />
route; the proportions reporting injection or inhalation<br />
as preferred routes were each about one in six.<br />
Amphetamine treatment admissions in San Francisco<br />
County rose steadily from FY 2001 to FY 2004, with<br />
the later year’s count 25 percent higher than the earlier<br />
year’s.<br />
In the three-county bay area, ME death mentions involving<br />
methamphetamine fell from 58 in 1999 to 32<br />
in 2001 and 38 in 2002 (exhibit 3). Of the methamphetamine-related<br />
death mentions in 2000, males<br />
accounted for 93 percent, and the median age was 40.<br />
Two nearby metropolises that are ADAM sites may<br />
give some indication of the methamphetamine situation<br />
in San Francisco. In Sacramento and San Jose,<br />
respectively, 38 and 37 percent of male adult arrestees<br />
tested positive for methamphetamine in 2003.<br />
These were the third and fourth highest proportions<br />
of methamphetamine-positives among male adults in<br />
all the 39 ADAM sites. Among the female arrestees,<br />
45 percent tested positive, the fourth highest among<br />
25 ADAM sites.<br />
According to the NDIC, in 2004 pounds of “crystal”<br />
methamphetamine sold in the $10,000–$13,000<br />
range, ounces in the $600–$1,500 range, and grams<br />
in the $80–$100 range. In 1999, comparable price<br />
ranges were $3,500 to $10,000 for pounds and $500<br />
to $1,000 for ounces. The DEA San Francisco Field<br />
Division reports that Mexican criminal groups control<br />
the local wholesale and midlevel distribution.<br />
Several counties near the bay area (Alameda, San<br />
Mateo, Santa Clara, Sacramento, San Joaquin, and<br />
Stanislaus) have been sites of “superlabs,” capable of<br />
producing 10 pounds or more of methamphetamine<br />
per production cycle.<br />
Methamphetamine use in the bay area is high as<br />
compared to other metropolitan areas of the United<br />
States. Most indicators point to an increase in usage<br />
during the past 3 years.<br />
Proceedings of the Community Epidemiology Work Group, Vol. II, January 2005
Depressants<br />
The unweighted ED reports of benzodiazepines in<br />
2004 involved mostly patients who were White (77<br />
percent), male (63 percent), and older than 35 (69<br />
percent). ME mentions dropped from a 1999–2001<br />
average of 54 to 34 in 2002 (exhibit 3).<br />
Hallucinogens<br />
The unweighted data accessed from DAWN Live!<br />
show that ED reports for lysergic acid diethylamide<br />
(LSD) were rare during 2004. Reports of phencyclidine<br />
(PCP) were about five times more common. Of<br />
these PCP reports, most patients were male and most<br />
were Hispanic; two-thirds were older than 35.<br />
Club Drugs<br />
The NDIC reports that in 2004, street prices of methylenedioxymethamphetamine<br />
(MDMA or “X”)<br />
were in the range of $15–$40 per “tab.” Unweighted<br />
data accessed from DAWN Live! show that the ED<br />
reports of this drug were predominantly (69 percent)<br />
among people younger than 30. ED reports of gamma<br />
hydroxybutyrate (GHB) were on average older, with<br />
64 percent older than 30. Ketamine ED reports were<br />
very rare. The actual number of club drug reports<br />
remains small compared with ED reports for cocaine<br />
or methamphetamine. The same is the case for ME<br />
mentions (exhibit 3).<br />
INFECTIOUS DISEASES RELATED TO <strong>DRUG</strong> <strong>ABUSE</strong><br />
AIDS<br />
San Francisco County had a cumulative total of<br />
29,508 AIDS cases through September 30, 2004, an<br />
increase of 678 (2.4 percent) from the total reported<br />
through September 30, 2003. Of these cases, 2,108<br />
(7.1 percent) were heterosexual injection drug users<br />
(IDUs), an increase of 83 (4.1 percent) in a year. Another<br />
3,725 AIDS cases (12.6 percent) were men who<br />
had sex with other men (MSM) and also injected<br />
drugs (MSM/IDUs); this number increased by 79 or<br />
2.2 percent in a year. There were just 47 reported<br />
cases among lesbian IDUs, barely one-hundredth the<br />
number among MSM/IDUs. The rates of case reporting<br />
among all of these groups had been decelerating<br />
during the early 2000s, but during the past year those<br />
rates have begun to accelerate. A total of 330 AIDS<br />
cases have been reported for transgender San Franciscans,<br />
an increase of 9.6 percent in the past year.<br />
Among San Franciscans diagnosed in 2003 and 2004,<br />
heterosexual IDUs accounted for 17 percent, up from<br />
10 percent among those diagnosed in 1994–1996, 14<br />
<strong>EPIDEMIOLOGIC</strong> TRENDS IN <strong>DRUG</strong> <strong>ABUSE</strong>—San Francisco Bay Area<br />
percent of those diagnosed in 1997–1999, and 14<br />
percent of those diagnosed in 2000–2002. However,<br />
the overall case numbers in 2003–2004 were far<br />
lower than those of the late 1980s and early 1990s.<br />
As a result, the percentage of heterosexual IDUs<br />
among the cumulative AIDS caseload will probably<br />
not increase significantly from the current level of 7<br />
percent.<br />
The demography of the cumulative heterosexual IDU<br />
caseload with AIDS has changed very little in the<br />
past 14 years. This caseload is 69 percent male, 50<br />
percent Black, 35 percent White, 11 percent Hispanic,<br />
and 2 percent Asian/Pacific Islander. By contrast,<br />
the gay/bisexual IDU caseload is 72 percent<br />
White, 16 percent Black, 10 percent Hispanic, and<br />
1.6 percent Asian/Pacific Islander.<br />
The heterosexual IDU demography is like that of<br />
heroin users except for over-representation of Blacks,<br />
while the gay male IDU demography is similar to that<br />
for male speed users.<br />
Data from the Urban Health Study, which conducts<br />
semiannual surveys, indicate that in 2004 seroprevalence<br />
of heterosexual IDUs in San Francisco remained<br />
within the same 6–10 percent range that has<br />
prevailed for the past 16 years. By contrast, HIV<br />
prevalence among MSM/IDUs had ranged around 40<br />
percent in the late 1980s, dropped to around 25 percent<br />
in the late 1990s, and rose again to the 30–35<br />
percent range in 2004. Recent UHS data show extensive<br />
self-reported past-month injection of cocaine (21<br />
percent) and amphetamines (30 percent) as well as<br />
heroin (68 percent). A surprisingly low proportion (c.<br />
15 percent) of heterosexual HIV-positive IDUs reported<br />
being on drug treatment for their condition.<br />
Passage of SB1159, which enables California pharmacies<br />
to sell hypodermic equipment without prescriptions,<br />
has the potential for significant effects<br />
upon disease transmission. Early in 2005, decisions<br />
will be made as to which pharmacies will opt into<br />
this activity.<br />
Hepatitis B<br />
From 1996 through 2001, reported cases of HBV in<br />
San Francisco County rarely deviated from a pace of<br />
about one per week. The pace dropped in 2002 and<br />
2003 to about one every 9 days, then dropped further<br />
in 2004 to about one every 16 days.<br />
Hepatitis C<br />
UHS data from 2003 disclosed that fully two-thirds<br />
of all IDUs in the sample self-reported HCV sero-<br />
Proceedings of the Community Epidemiology Work Group, Vol. II, January 2005 231
positivity. UHS staff believe, on the basis of earlier<br />
HCV antibody testing, that true prevalence is between<br />
90 and 95 percent. This has enormous implications<br />
for the long-term health of San Francisco’s IDU<br />
population—not only the current user population<br />
estimated at 18,700, but also the possibly much larger<br />
232<br />
<strong>EPIDEMIOLOGIC</strong> TRENDS IN <strong>DRUG</strong> <strong>ABUSE</strong>—San Francisco Bay Area<br />
number with past (or future) injection drug use.<br />
“Coinfection” is also a serious problem; a 2003 study<br />
by the University of California at San Francisco<br />
found that 73 percent of homeless and marginally<br />
housed people with HIV were also infected with<br />
hepatitis C.<br />
For inquiries concerning this report, please contact John A. Newmeyer, Ph.D., Epidemiologist, Haight-Ashbury Free Clinics, Inc., 612 Clayton<br />
Street, 2nd Floor, San Francisco, CA 94117, Phone: 415-931-5420, Fax: 415-776-8823, E-mail: jnewmeyer@aol.com.<br />
Proceedings of the Community Epidemiology Work Group, Vol. II, January 2005
<strong>EPIDEMIOLOGIC</strong> TRENDS IN <strong>DRUG</strong> <strong>ABUSE</strong>—San Francisco Bay Area<br />
Exhibit 1. Admissions to Drug Treatment Programs in the San Francisco Bay Area by Primary Drug of<br />
Abuse: 1999–2004<br />
Drug 1999 2000 2001 2002 2003 2004 1<br />
Cocaine 8,727 7,718 7,428 6,746 7,111 7,126<br />
Heroin 19,763 17,416 14,673 11,461 9,893 9,628<br />
Amphetamine 4,595 4,469 5,073 5,636 6,435 6,882<br />
All Drugs 36,069 32,034 30,920 28,329 27,607 27,748<br />
1 Figures for 2004 are projected from data for the first half of the year.<br />
SOURCE: California Department of Alcohol and Drug Programs (DADP)<br />
Exhibit 2. Admissions to Drug Treatment Programs in San Francisco County by Primary Drug of Abuse:<br />
FYs 2000–2004<br />
Drug FY 2000 FY 2001 FY 2002 FY 2003 FY 2004<br />
Cocaine 2,600 2,306 2,440 2,274 2,527<br />
Heroin 4,030 3,867 4,002 3,700 3,646<br />
Amphetamine 1,008 991 1,053 1,144 1,235<br />
Marijuana 915 867 1,067 1,110 950<br />
Alcohol 3,987 3,581 3,147 3,153 2,680<br />
All Drugs 8,690 8,191 8,764 8,406 8,520<br />
All Drugs and Alcohol 12,677 11,772 11,911 11,559 11,200<br />
SOURCE: San Francisco Department of Public Health<br />
Exhibit 3. Medical Examiner Drug Mentions in Three Counties (Including San Francisco): 1997–2002<br />
Drug 1997 1998 1999 2000 2001 2002<br />
Cocaine 127 158 158 146 106 90<br />
Heroin/Morphine 159 164 192 148 117 95<br />
Methamphetamine 49 45 58 45 32 38<br />
Narcotic Analgesics 156 185 198 164 124 125<br />
Benzodiazepines 71 62 50 55 56 34<br />
Club Drugs 1 6 6 5 4<br />
1 Includes MDMA, ketamine, GHB, GBL, and Rohypnol.<br />
SOURCE: DAWN, OAS, SAMHSA<br />
Proceedings of the Community Epidemiology Work Group, Vol. II, January 2005 233
234<br />
<strong>EPIDEMIOLOGIC</strong> TRENDS IN <strong>DRUG</strong> <strong>ABUSE</strong>—San Francisco Bay Area<br />
Exhibit 4. Price and Purity of Heroin Samples: 1994–2003<br />
SOURCE: DEA<br />
Year Price per Pure Milligram Purity (Percent)<br />
1994 $0.95 29<br />
1995 $0.83 35<br />
1996 $0.83 24<br />
1997 $0.63 26<br />
1998 $0.33 26<br />
1999 $0.47 20<br />
2000 $0.70 15<br />
2001 $1.40 10<br />
2002 $0.99 12<br />
2003 $0.98 11<br />
Proceedings of the Community Epidemiology Work Group, Vol. II, January 2005
<strong>EPIDEMIOLOGIC</strong> TRENDS IN <strong>DRUG</strong> <strong>ABUSE</strong>—Seattle-King County Area<br />
Recent Drug Abuse Trends in the Seattle-King County Area<br />
Caleb Banta-Green, 1 T. Ron Jackson, 2 Susan Kingston, 3 Michael Hanrahan, 4 Steve Freng, 5<br />
David H. Albert, 6 Ann Forbes, 7 and Kris Nyrop 8<br />
ABSTRACT<br />
Cocaine continues to be a major drug of abuse with<br />
high levels of mortality and treatment admissions,<br />
particularly among African-Americans. The number<br />
of heroin deaths continues to decline, as does<br />
the proportion of heroin deaths involving no other<br />
drugs. Deaths and treatment admissions for prescription<br />
opiates continue to rise. Methamphetamine<br />
indicators appear to be plateauing in King<br />
County; users are disproportionately Caucasian.<br />
Marijuana is widely used, particularly by youth.<br />
Prescription depressant medications are mostly used<br />
in combination with other drugs, often with deadly<br />
effects. MDMA (‘ecstasy’) indicators have declined<br />
in the past few years; adulteration continues and<br />
may be increasing. Hepatitis B and C infect the majority<br />
of IDUs. HIV among IDUs is generally low,<br />
with the exception of methamphetamine-injecting<br />
men who have sex with men.<br />
INTRODUCTI<strong>ON</strong><br />
Area Description<br />
Located on Puget Sound in western Washington,<br />
King County spans 2,130 square miles, of which the<br />
city of Seattle occupies 84 square miles. The combined<br />
ports of Seattle and nearby Tacoma make<br />
Puget Sound the second largest combined loading<br />
center in the United States. Seattle-Tacoma International<br />
Airport, located in King County, is the largest<br />
airport in the Pacific Northwest. The Interstate 5 corridor<br />
runs from Tijuana, Mexico, in the south, passes<br />
through King County, and continues northward to<br />
Canada. Interstate 90’s western terminus is in Seattle;<br />
it runs east over the Cascade Mountain range,<br />
through Spokane, and across Idaho and Montana.<br />
According to the 2000 census, the population of King<br />
County is 1,737,034. King County’s population is the<br />
The authors’ affiliations are as follows:<br />
1 Alcohol and Drug Abuse Institute, University of Washington<br />
2 Evergreen Treatment Services<br />
3 Project NE<strong>ON</strong>, Public Health – Seattle & King County<br />
4 HIV/AIDS Program, Public Health – Seattle & King County<br />
5 Northwest High Intensity Drug Trafficking Area<br />
6 Division of Alcohol and Substance Abuse, Washington State Department of Social and Health Services<br />
7 Washington State Alcohol and Drug Help Line<br />
8 Street Outreach Services<br />
12th largest in the United States. Of Washington’s<br />
5.9 million residents, 29 percent live in King County.<br />
The city of Seattle’s population is 563,374; the suburban<br />
population of King County is growing at a<br />
faster rate than Seattle itself.<br />
The county’s population is 75.7 percent White, 10.8<br />
percent Asian/Pacific Islander, 5.5 percent Hispanic,<br />
5.4 percent African-American, 0.9 percent Native<br />
American or Alaska Native, 0.5 percent Native Hawaiian<br />
and Other Pacific Islander, and 2.6 percent<br />
“some other race.” Those reporting two or more races<br />
constitute 4.1 percent of the population. Income statistics<br />
show that 8.0 percent of adults and 12.3 percent<br />
of children in the county live below the Federal<br />
poverty level, lower than the State averages of 10.2<br />
percent and 15.2 percent, respectively.<br />
Data Sources<br />
Information for this report was obtained from the<br />
sources described below:<br />
• Emergency department (ED) drug reports data<br />
were obtained from DAWN Live!, a restrictedaccess<br />
online system administered by the Drug<br />
Abuse Warning Network (DAWN), Office of Applied<br />
Studies (OAS), Substance Abuse and Mental<br />
Health Services Administration (SAMHSA). Preliminary<br />
data for the first half of 2004 are presented,<br />
and these data were accessed on January<br />
14, 2005. All 22 eligible hospitals in the area are<br />
in the DAWN sample. There are 23 emergency<br />
departments in the sample, since one hospital has<br />
two EDs. During the 6-month period, between 10<br />
and 13 EDs reported data each month. Data were<br />
incomplete, with less than 50 percent complete<br />
data for 1–4 of these EDs in 8 of the 12 months.<br />
These data are preliminary. All DAWN cases are<br />
reviewed for quality control and, based on the review,<br />
may be corrected or deleted. Therefore, the<br />
data may change. Data represent drug reports and<br />
Proceedings of the Community Epidemiology Work Group, Vol. II, January 2005 235
236<br />
are not estimates for the reporting area. Data are<br />
utilized for descriptive purposes only. Drug reports<br />
exceed the number of ED visits, since a patient<br />
may report use of multiple drugs (up to six<br />
drugs plus alcohol). Data cannot be compared to<br />
DAWN data from 2002 and before, nor can preliminary<br />
data be used for comparison with future<br />
data. Only weighted data released by OAS may<br />
be used for trend analyses. The first year of<br />
weighted data will be 2004, so reasonable trend<br />
analyses will not be possible for several years.<br />
Available data are for King and neighboring<br />
Snohomish Counties combined. ED race/ethnicity<br />
is not reported because 63 percent of drug<br />
abuse/other cases do not have race/ethnicity<br />
documented. There are new case types in<br />
DAWN, with the primary one presented here being<br />
the “other” case type, which includes “all ED<br />
visits related to recreational use, drug abuse,<br />
drug dependence, withdrawal, and any misuse”<br />
not classified in other categories, such as overmedication<br />
and seeking detox/treatment. For the<br />
sake of clarity, “other” will be referred to as<br />
“drug abuse/other” in this report. Unless specifically<br />
stated, data presented are for the drug<br />
abuse/other case type. Much of the discussion<br />
focuses on abuse of “illegal” drugs (e.g., cocaine,<br />
heroin, marijuana) as distinct from nonmedical<br />
use of prescription-type drugs and use of overthe-counter<br />
drugs and alcohol. A full description<br />
of the DAWN system can be found at the<br />
DAWN Web site .<br />
• Treatment data were extracted from the Washington<br />
State Department of Social and Health<br />
Services, Division of Alcohol and Substance<br />
Abuse’s Treatment and Assessment Report Generation<br />
Tool (TARGET) via the Treatment Analyzer<br />
system. TARGET is the department’s<br />
statewide alcohol/drug treatment activity database<br />
system. Data were compiled for King<br />
County residents from January 1, 1999, through<br />
June 30, 2004. Data are included for all treatment<br />
admissions that had any public funding.<br />
Department of corrections and private pay clients<br />
(primarily methadone) are also included, though<br />
they contribute only a small number of cases.<br />
Methadone waiting list data for those seen at syringe<br />
exchange sites are administered and provided<br />
by Public Health–Seattle & King County<br />
(PHSKC).<br />
• Drug-related mortality data were provided by<br />
the King County Medical Examiner (ME). Data<br />
for the first half of 2004 are preliminary. The<br />
data include deaths directly caused by licit or illicit<br />
drug overdose and exclude deaths caused by<br />
<strong>EPIDEMIOLOGIC</strong> TRENDS IN <strong>DRUG</strong> <strong>ABUSE</strong>—Seattle-King County Area<br />
antidepressants in isolation and by poisons. Totals<br />
may differ slightly from drug death reports<br />
published by the King County ME’s office,<br />
which include fatal poisonings. Testing is not<br />
done for marijuana. Because more than one drug<br />
is often identified per individual drug overdose<br />
death, the total number of drugs identified exceeds<br />
the number of actual deaths.<br />
• School drug use survey data are available from<br />
the Seattle Public School’s Communities That<br />
Care Survey for 2002 and 2004. Response rates<br />
were 50 percent in 2002 and 60 percent in 2004.<br />
Trends cannot be determined from these data.<br />
• Syringe exchange data on the number of syringes<br />
exchanged and the number of encounters<br />
with clients are provided by PHSKC’s<br />
HIV/AIDS program.<br />
• Prescription drug sales data are extracted from<br />
the Drug Enforcement Administration’s Automation<br />
of Reports and Consolidated Orders System<br />
(ARCOS) reports. The data provide retail drug<br />
distribution data by Zip Code, covering primarily<br />
sales to hospitals and pharmacies. Data are unavailable<br />
for most drugs for year 2000. ARCOS<br />
data presented here are for the 3-digit Zip Code<br />
areas of 980 and 981, which roughly correspond<br />
with King County boundaries. The population in<br />
these two Zip Code areas is 1,969,348, compared<br />
with 1,737,034 for King County in 2000.<br />
• Illegal drug seizures data from the U.S. Customs<br />
Service relating to the seizures for all illegal<br />
drugs are included for January 2001 to June<br />
2004.<br />
• Methamphetamine production data are from<br />
the Washington State Department of Ecology<br />
(DOE), which is mandated to respond to and<br />
document all “Methamphetamine Incidents,” including<br />
operating labs, dump sites, and other<br />
sites associated with the manufacture of methamphetamine.<br />
• Forensic drug analysis data are from the National<br />
Forensic Laboratory Information System<br />
(NFLIS), which distributes data from the Washington<br />
State Patrol’s Toxicology Laboratory on<br />
drug test results on local law enforcement seizures.<br />
These data include the top 25 drugs identified<br />
in fiscal year (FY) 2003 and FY 2004. Data<br />
are presented for the Seattle-area lab in comparison<br />
to the rest of the State.<br />
Proceedings of the Community Epidemiology Work Group, Vol. II, January 2005
• Data on infectious diseases related to drug<br />
use, including the human immunodeficiency virus<br />
(HIV), acquired immunodeficiency syndrome<br />
(AIDS), and hepatitis, were provided by two<br />
sources. One source is “HIV/AIDS Epidemiology<br />
Report.” Data on HIV and AIDS cases (including<br />
exposure related to injection drug use) in<br />
Seattle-King County, other Washington counties,<br />
Washington State (2001 through 2003), and the<br />
United States (2000 through 2002) are provided<br />
by PHSKC, the Washington State Department of<br />
Health, and the Federal Centers for Disease Control<br />
and Prevention (CDC). HIV cases were reported<br />
to PHSKC or the Washington Department<br />
of Health between 2000 and 2004. The Sexually<br />
Transmitted Disease (STD) Clinic, PHSKC, provided<br />
data on clients’ drug use, health status, and<br />
health behaviors for October 2001 to September<br />
2002.<br />
• Drug-related helpline data are from the Washington<br />
State Alcohol/Drug Help Line (ADHL),<br />
which provides confidential 24-hour telephonebased<br />
treatment referral and assistance for Washington<br />
State. Data are presented for January 2001<br />
to June 2004 for calls originating within King<br />
County. Data presented are for drugs mentioned. A<br />
caller may refer to multiple drugs; therefore, there<br />
are more drug mentions than there are calls. The<br />
data exclude information on alcohol and nicotine,<br />
which account for more than one-half of the calls.<br />
Data are presented primarily for illicit drugs only;<br />
prescription drugs have not been coded consistently<br />
over time, thus trend analyses are limited.<br />
The large number of unknown drugs in 2001 and<br />
2002 may obscure some trends as well.<br />
• Key informant interview data are obtained from<br />
discussions with treatment center staff, street outreach<br />
workers, and drug users.<br />
<strong>DRUG</strong> <strong>ABUSE</strong> PATTERNS AND TRENDS<br />
Cocaine/Crack<br />
The proportion of treatment admissions involving cocaine<br />
(i.e., cocaine was mentioned as the primary, secondary,<br />
or tertiary drug of abuse at the time of entry<br />
into treatment) has declined slowly but steadily, from<br />
45 percent of all admissions in 1999 to 37 percent in<br />
the first half of 2004 (exhibit 1). Cocaine use was uncommon<br />
among youth, accounting for approximately 3<br />
percent of cocaine-involved treatment admissions from<br />
1999 through the first half of 2004. Cocaine users appear<br />
to be an aging group, with the proportion of those<br />
age 45–54 increasing from 15 percent in 1999 to 24<br />
percent in the first half of 2004. At the same time, the<br />
<strong>EPIDEMIOLOGIC</strong> TRENDS IN <strong>DRUG</strong> <strong>ABUSE</strong>—Seattle-King County Area<br />
age group with the greatest proportion of admissions,<br />
30–44-year-olds, declined from 64 to 52 percent of<br />
admissions. For treatment admissions in which cocaine<br />
was not the primary, secondary, or tertiary drug of<br />
abuse, 29 percent were female, while cocaine-involved<br />
admissions were 39 percent female on average over this<br />
timeframe. No changes in the proportion of female<br />
cocaine admissions were seen over time.<br />
African-Americans are disproportionately represented<br />
in the treatment data relative to their representation in<br />
the county, due largely to the fact that these data are<br />
almost entirely based upon publicly funded treatment<br />
admissions and African-Americans have a lower annual<br />
income on average in King County than Caucasians.<br />
Even accounting for this demographic fact, African-Americans<br />
entering treatment use cocaine at much<br />
higher levels than Caucasians. In the first half of 2004,<br />
33 percent of cocaine-involved treatment admissions<br />
were African-American, compared to 15 percent<br />
among those admitted to treatment who did not use<br />
cocaine. The county is 5 percent African-American.<br />
Unweighted data accessed from DAWN Live! show<br />
that cocaine emergency department drug reports for<br />
drug abuse/other case types represented the largest proportion<br />
of illegal drugs: 36 percent (n=1,082) in the<br />
first half of 2004 (exhibit 2). Additionally, there were<br />
124 drug reports for cocaine for those seeking detoxification/treatment.<br />
Demographics for drug abuse/other<br />
case types were as follows. A similar proportion of<br />
cocaine drug reports were female, 35 percent, as for all<br />
drugs including alcohol, prescription, and over-thecounter<br />
drugs, 37 percent. Cocaine drug reports involved<br />
patients who were generally older than those<br />
seen for any drug. Only 4 percent of cocaine drug reports<br />
were for those age 12–20, compared to 10 percent<br />
for all drugs. For cocaine drug reports, 38 percent were<br />
35–44, compared with 30 percent for all drugs.<br />
DAWN unweighted data for presenting complaints are<br />
newly available. On average, for each person there<br />
were 1.47 complaints. Most common for cocaine were<br />
altered mental status (20 percent), identical to “all<br />
drugs” (exhibit 2), and psychiatric condition (24 percent),<br />
higher than the 18 percent for all drugs. Cocaine<br />
drug reports were less likely to involve abscess/cellulitis<br />
problems (7 percent) compared to all<br />
drugs (12 percent). Those with cocaine drug reports<br />
were more likely to be admitted to the psychiatric unit,<br />
7 percent, than those with any other illicit drug type<br />
reported.<br />
Information on the route of administration was not<br />
documented for 72 percent of the unweighted cocaine<br />
ED drug reports, much higher than the 52 percent of all<br />
drug types for DAWN ED data. Still, some differences<br />
Proceedings of the Community Epidemiology Work Group, Vol. II, January 2005 237
were evident. Excluding missing data, 41 percent of<br />
cocaine drug reports involved smoking, compared with<br />
15 percent for all drugs. Injection was the second most<br />
common route among cocaine drug reports, accounting<br />
for 36 percent, less than the 41 percent for all drugs.<br />
Cocaine was the most common drug mentioned by<br />
adults calling the ADHL between 2001 and June 2004<br />
(exhibit 3). Between 27 and 37 percent of calls by<br />
adults were about cocaine; any changes over time were<br />
obscured by the high number of calls about unknown<br />
drugs in 2001 and 2002. For youth, cocaine was the<br />
third most commonly mentioned drug, representing<br />
between 8 and 14 percent of calls in each timeframe;<br />
again, the large number of unknown drug type calls<br />
obscured any trends.<br />
Survey data showed that cocaine was not commonly<br />
used by high school seniors in the past 30 days (exhibit<br />
4). Use levels were 1.7 percent in 2002 and 2.5<br />
percent in 2004 (not significantly different).<br />
Cocaine was the most common substance identified<br />
in the Seattle area according to NFLIS data on local<br />
law enforcement drug seizure testing (exhibit 5). Cocaine<br />
was the second most common drug detected in<br />
the laboratories for the rest of the State, with about<br />
one-half of the level found in the Seattle-area lab.<br />
Minimal change occurred in the proportion of cocaine-positive<br />
tests from FY 2003 to FY 2004.<br />
Cocaine-involved deaths in the first half of 2004 represented<br />
37 percent of deaths (exhibit 6a). The total<br />
number of cocaine-involved deaths (n=43) is the<br />
third highest number in a half-year period since 1997.<br />
African-Americans are involved in cocaine-related<br />
deaths at levels disproportionate to their representation<br />
in the local population. Over this 7½-year period,<br />
20 percent of cocaine-involved decedents were African-Americans<br />
(exhibit 6c), compared to the 5 percent<br />
of the King County population that is African-<br />
American. Caucasians were involved in 73 percent of<br />
cocaine-related deaths, slightly lower than the 76<br />
percent of the county population they represent. Females<br />
made up 21 percent of cocaine-involved<br />
deaths, compared to 29 percent for all drug-involved<br />
deaths. The median age for decedents with cocaine<br />
identified was 41, similar to the median age for all<br />
decedents (42). On average, one in five deaths involving<br />
cocaine involved no other drugs (exhibit 6b).<br />
The number of cocaine seizures by the U.S. Customs<br />
Service remained steady, with 14 in the first half of<br />
2004 totaling 199 pounds (exhibit 7). Cocaine is seized<br />
relatively infrequently by the U.S. Customs Service. In<br />
the first half of 2004, there were four fairly large seizures<br />
that ranged from 17 to 88 pounds.<br />
238<br />
<strong>EPIDEMIOLOGIC</strong> TRENDS IN <strong>DRUG</strong> <strong>ABUSE</strong>—Seattle-King County Area<br />
Heroin<br />
The proportion of treatment admissions involving<br />
any use of heroin declined from 26 to 20 percent<br />
from 1999 to June 2004 (exhibit 1). Heroin use was<br />
rare among youth entering treatment, with only 1<br />
percent of youth mentioning heroin as a current drug<br />
of abuse. Similar to cocaine users, heroin users entering<br />
treatment appear to be an aging group, with the<br />
proportion of those age 45–54 increasing from 26 to<br />
33 percent. At the same time, those age 30–44 declined<br />
from 54 to 45 percent.<br />
Women represented approximately 39 percent of<br />
heroin-involved admissions, higher than the 31 percent<br />
for admissions not involving heroin. African-<br />
Americans represented about 17 percent of admissions<br />
involving heroin, lower than the proportion<br />
using other substances (23 percent) but still about<br />
three times the proportion living in the county. Four<br />
percent of people admitted to treatment who were<br />
using heroin were Native American, less than the 6<br />
percent for other drugs, but much higher than the 1<br />
percent of all county residents who are Native<br />
American.<br />
Among those entering opiate substitution treatment,<br />
the proportion reporting heroin as their primary drug<br />
decreased from 95 to 84 percent from January 1999<br />
to June 2004 (exhibit 8). Both treatment admissions<br />
and discharges peaked in 2000 and have steadily declined<br />
since. At the same time, the waiting list for<br />
methadone has remained long (exhibit 9). The volume<br />
of syringes exchanged increased in both 2003<br />
and 2004 (exhibit 10). Together, these data point to a<br />
continued high level of treatment need and demand.<br />
It may be that treatment admissions and discharges<br />
have declined as lengths of stay have increased.<br />
The proportion of all deaths involving heroin in the<br />
first half of 2004 was lower than anytime in the prior<br />
7 years, 29 percent compared to 49 percent overall<br />
and a peak of 73 percent in the second half of 1998<br />
(exhibit 6a). The proportion of heroin-involved<br />
deaths due solely to heroin plummeted to 9 percent in<br />
the first half of 2004, down from 52 percent in the<br />
first half of 1997 (exhibit 6b). Heroin-involved decedents<br />
had a median age of 41, similar to the age seen<br />
for all decedents, 42 (exhibit 6c). Females made up<br />
just 18.5 percent of deaths, the lowest proportion for<br />
any drug. Three percent of heroin-involved deaths<br />
were among Native Americans, higher than the 1<br />
percent of the county population that is Native<br />
American.<br />
The precipitous drop in heroin-involved deaths seen<br />
in the second half of 2000 and largely maintained<br />
Proceedings of the Community Epidemiology Work Group, Vol. II, January 2005
through the first half of 2004 coincides with an increase<br />
in local methadone treatment capacity. Purity<br />
of heroin locally decreased around this same general<br />
time as well. In 1998, the average purity of heroin<br />
purchased was 21 percent, according to the DEA<br />
Domestic Monitoring Program. In 2000, the purity<br />
was 13 percent, and it has since declined a bit further<br />
to 10 percent in 2003. In order to obtain a high from<br />
such low purity heroin, most users inject.<br />
The primary form of heroin on the streets is Mexican<br />
black tar. All DEA DMP buys of heroin that have<br />
been positively identified were found to be Mexican<br />
in origin. China white, a common form in Vancouver,<br />
British Columbia, and on the east coast of the United<br />
States, is uncommon in the local area, according to<br />
regional HIDTA and DEA information.<br />
The unweighted heroin drug reports, accessed<br />
through DAWN Live!, represented 31 percent of illegal<br />
drug abuse/other drug reports in the first half of<br />
2004, second only to cocaine at 36 percent (exhibit<br />
2). The number of drug abuse/other drug reports for<br />
heroin totaled 933, with another 91 drug reports for<br />
individuals seeking detox/treatment. A relatively<br />
large proportion of heroin drug abuse/other reports<br />
involved women, 43 percent, compared with 37 percent<br />
for all drug types.<br />
Only 3 percent of heroin ED drug reports were for<br />
patients age 12–20, compared with 10 percent for all<br />
drugs. For heroin drug reports, 32 percent were 35–<br />
44, similar to the 30 percent for all drugs. The most<br />
common complaint among patients represented in the<br />
heroin drug abuse/other reports was abscess/cellulitis<br />
(42 percent), much higher than for any other substance<br />
and for all substances combined (12 percent).<br />
In the unweighted DAWN data, admissions to any hospital<br />
unit were shown to be higher for heroin-involved<br />
drug abuse/other reports, 25 percent, than for any other<br />
major substance. Route of administration data were<br />
most complete for heroin, with only 31 percent of reports<br />
not documenting the route, compared with 52<br />
percent overall. Injection was far more common among<br />
heroin-involved patients, 96 percent among reports<br />
with data, compared with 20 percent for all substances.<br />
Between 2001 and June 2004, heroin mentions in calls<br />
to the ADHL represented 13–18 percent of adult calls<br />
and 2–3 percent of youth calls (exhibit 3). Trends over<br />
time are not measurable because of the large number of<br />
calls about “unknown” drugs.<br />
NFLIS results for FY 2003 and FY 2004 show similar<br />
levels of law enforcement seizures for heroin in the<br />
Seattle area (5 percent) and the rest of the State (5–7<br />
<strong>EPIDEMIOLOGIC</strong> TRENDS IN <strong>DRUG</strong> <strong>ABUSE</strong>—Seattle-King County Area<br />
percent). Heroin was the fourth most common substance<br />
detected in each of these regions (exhibit 5).<br />
Heroin seizures by the U.S. Customs Service are generally<br />
infrequent, with no seizures reported in the first<br />
half of 2004 (exhibit 7). The major trafficking route<br />
is believed to involve the interstate highway system<br />
from the southwestern United States once the product<br />
has crossed the Mexican border. It is believed there is<br />
not much heroin trafficking across the Washington-<br />
Canadian border in either direction.<br />
Data for King County from the Northwest HIDTA<br />
for 2003 for Mexican black tar heroin indicate the<br />
following prices: $30–$150 per gram, $400–$900 per<br />
ounce, $8,000–$10,000 per pound, and $16,000–<br />
$25,000 per kilogram.<br />
Other Opiates/Prescription Opiates<br />
For the purposes of this report, “other opiates/prescription<br />
opiates” include codeine, dihydrocodeine,<br />
fentanyl, hydrocodone (e.g., Vicodin), methadone,<br />
oxycodone (e.g., Percocet and OxyContin), propoxyphene<br />
(e.g., Darvon), sufentanil, tramadol (e.g.,<br />
Ultram), hydromorphone (e.g., Dilaudid), meperidine<br />
(e.g., Demerol), pharmaceutical morphine, acetylmethadol,<br />
and the “narcotic analgesics/combinations”<br />
reported in the DAWN ED data.<br />
Treatment admissions for other opiates as the primary<br />
drug have increased from 0.8 to 2.3 percent of admissions<br />
to all treatment modalities from 1999 to the first<br />
half of 2004. Over this same timeframe, the proportion<br />
of 18–29-year-olds increased from 16 to 42 percent.<br />
More than one-half (55 percent) of the admissions<br />
were female, much higher than the 33 percent<br />
seen for all substances. Other opiate users were much<br />
more likely to be White (77 percent), compared to<br />
users of all substances (58 percent). The proportion<br />
of primary other opiate users who reported ever injecting<br />
drugs was nearly identical to all drug users,<br />
35 vs. 34 percent, respectively.<br />
Among those entering opiate substitution treatment,<br />
the proportion of prescription opiate users increased<br />
from 3 percent in 1999 to 14 percent in the first half<br />
of 2004 (exhibit 8).<br />
Unweighted data accessed from DAWN Live! on<br />
drug abuse/other case type reports for other opiates in<br />
the first half of 2004 totaled 353, with 81 seeking<br />
detox/treatment and 246 reporting overmedication<br />
(exhibit 2). The total of 838 drug reports for other<br />
opiates for all 8 DAWN case types represented 10<br />
percent of all substances.<br />
Proceedings of the Community Epidemiology Work Group, Vol. II, January 2005 239
The characteristics of other opiate ED drug reports<br />
for drug abuse/other include a much higher proportion<br />
of females (48 percent) than for all substances<br />
combined (37 percent). Use was more frequent<br />
among older groups, with 37 percent age 45 and<br />
older having drug reports involving other opiates,<br />
compared with 23 percent overall. The proportion<br />
presenting with a chief complaint of withdrawal was<br />
much higher (26 percent) than for all other drugs (5<br />
percent). A slightly larger proportion of other opiate<br />
drug patients (10 percent) were referred to detox/treatment<br />
than for all substances (7 percent).<br />
Route of administration data were missing for 52<br />
percent of other opiate ED drug reports; among those<br />
with data, 91 percent used orally, compared with 41<br />
percent for all drugs.<br />
In the unweighted ED data, specific types of other opiates<br />
were documented in 260 of the 353 drug reports<br />
for drug abuse/other reports. The most common types<br />
were methadone (n=109), oxycodone single drug formulation<br />
(n=53), hydrocodone-acetaminophen (n=28),<br />
morphine (n=21), and oxycodone-acetaminophen<br />
(n=20).<br />
Calls to the ADHL about methadone represented 2<br />
percent of calls in 2001 and 2002, 3 percent in 2003,<br />
and 5 percent in the first half of 2004. Other prescription<br />
opiates were common, but categorization of<br />
these substances changed over time, precluding trend<br />
comparisons. In the first half of 2004, there were 98<br />
calls specifically about OxyContin and 198 about<br />
“prescription pain pills.” Combined, these calls for<br />
OxyContin and prescription pain pills represented 14<br />
percent of all adult calls for illicit, over-the-counter,<br />
and prescription drugs. For youth, there were many<br />
fewer such calls, with eight total for methadone over<br />
the 3½-year period. There were 7 youth calls about<br />
OxyContin and 10 for prescription pain medications,<br />
representing just 5 percent of youth calls combined.<br />
Three types of prescription opiates are among the top<br />
25 substances reported in the NFLIS data: oxycodone,<br />
hydrocodone, and methadone (exhibit 5). For<br />
the Seattle area, these three substances totaled 2 percent<br />
in FY 2003 and 3 percent in FY 2004. For the<br />
rest of the State, about 3 percent of seizures tested<br />
positive for these substances in both years.<br />
The number of deaths involving prescription opiates<br />
was at an all-time high (48) in the first half of 2004,<br />
up from 13 in the first half of 1997 (exhibit 6a). Decedents<br />
were more likely to be female (42 percent)<br />
than the average for all drugs (29 percent) (exhibit<br />
6c). They were also slightly more likely to be Caucasian,<br />
87 percent, compared to 84 percent for all<br />
240<br />
<strong>EPIDEMIOLOGIC</strong> TRENDS IN <strong>DRUG</strong> <strong>ABUSE</strong>—Seattle-King County Area<br />
drugs. Additionally, the median age was older, 43<br />
years, compared to 42 for all drugs.<br />
Prescription opiates are infrequently the sole drug<br />
found in drug-involved deaths, with 13 percent of<br />
deaths involving prescription opiates ruled as single<br />
drug only deaths (exhibit 6b). From 1998 to 2000,<br />
other opiate only deaths were at higher levels, ranging<br />
from 17 to 33 percent of all deaths involving prescription<br />
opiates. Since 2002, the proportion of single-drug<br />
deaths involving prescription opiates has not<br />
exceeded 8 percent.<br />
What constitutes a prescription opiate-related death is<br />
unclear, however, particularly among opiate-tolerant<br />
individuals. Issues of tolerance, potentiation with<br />
other drugs, and overlapping therapeutic and lethal<br />
dose levels complicate assigning causation in prescription<br />
opiate-involved fatalities. The source and<br />
form of prescription opiates involved in deaths are<br />
often undetermined.<br />
DEA data on sales of prescription opiates to hospitals<br />
and pharmacies indicate that methadone sales have<br />
steadily increased each year, with a total increase of<br />
480 percent from January 1997 to June 2004 (exhibit<br />
11). Note that these data for methadone only include<br />
prescriptions for pain written by physicians; they do<br />
not include methadone provided in opiate treatment<br />
programs. Oxycodone sales have continued to increase<br />
in recent years, though the rate of increase<br />
slowed in the first half of 2004. Hydromorphone (80<br />
percent), hydrocodone (99 percent), morphine (129<br />
percent), and fentanyl (162 percent) sales have all<br />
increased as well. Codeine and meperidine sales have<br />
both steadily declined, decreasing 31 percent and 39<br />
percent, respectively.<br />
Several diverse factors may impact these prescribing<br />
patterns: (1) increased advertising and promotion of<br />
pharmaceuticals generally, (2) guidelines promoting<br />
adequate use of opiates for management of pain released<br />
in 1996 by the Washington State Medical<br />
Quality Assurance Commission, and (3) recent efforts<br />
to shift to methadone and morphine as less expensive<br />
alternatives to other opiates by Washington<br />
State agencies.<br />
Marijuana<br />
One-half of all people admitted to treatment reported<br />
current marijuana use from 1999 to June 2004 (exhibit<br />
1). Among those entering treatment who reported<br />
current marijuana use, youth constituted 28<br />
percent of admissions. However, youth only represented<br />
2 percent of those entering treatment who did<br />
not report current marijuana use. A larger proportion<br />
Proceedings of the Community Epidemiology Work Group, Vol. II, January 2005
of marijuana users are male (71 percent) than nonusers<br />
(63 percent).<br />
Unweighted data accessed from DAWN Live! show<br />
that marijuana ED drug abuse/other reports represented<br />
11 percent (n=429) of illicit drugs reported<br />
(exhibit 2). An additional 25 patients who were using<br />
marijuana (perhaps in combination with other drugs)<br />
sought detox/treatment. Marijuana drug abuse/other<br />
reports were much more common among those age<br />
12–20 (30 percent) than for all substances (10 percent).<br />
Chief complaints for marijuana most commonly<br />
were for altered mental status (24 percent) and<br />
psychiatric condition (26 percent), higher than the<br />
averages for all drugs (20 and 18 percent, respectively).<br />
Calls to the ADHL for marijuana constituted 20–24<br />
percent of adult calls and 45–57 percent of youth<br />
calls between 2001 and June 2004 (exhibit 3). Marijuana<br />
was the most common substance identified by<br />
youth and the second most common for adults, tied<br />
with methamphetamine.<br />
Marijuana was the most commonly identified illegal<br />
drug among high school seniors. Use in the prior 30<br />
days was reported by 27.0 percent in 2002 and 25.4<br />
percent in 2004 (exhibit 4).<br />
Cannabis was the third most commonly identified substance<br />
in NFLIS data for both the Seattle area and the<br />
rest of Washington State in FYs 2003 and 2004 (exhibit<br />
5). In the Seattle area, 17 and 15 percent of seizures<br />
tested positive for cannabis in FY 2003 and FY<br />
2004, respectively. Similar levels were seen in the rest<br />
of the State (almost 16 percent for both years).<br />
Marijuana seizures by the U.S. Customs Service continue<br />
to exceed seizures for all other substances, with<br />
248 seizures totaling 9,750 pounds in the first half of<br />
2004 (exhibit 7). In the second half of 2003, the greatest<br />
seizures in terms of weight occurred, though the<br />
number of seizures was very similar to the most recent<br />
time period. The average weight per seizure is up since<br />
increased scrutiny following the September 11, 2001,<br />
attacks.<br />
HIDTA data collected from King County law enforcement<br />
in 2003 show the following prices for marijuana:<br />
$10–$40 per gram, $250–$500 per ounce, and<br />
$2,200–$4,000 per pound. Price depends on the quality<br />
and a variety of other factors, but “BC Bud” from British<br />
Columbia, Canada, is widely available and is the<br />
most expensive of the marijuana varieties available in<br />
King County.<br />
<strong>EPIDEMIOLOGIC</strong> TRENDS IN <strong>DRUG</strong> <strong>ABUSE</strong>—Seattle-King County Area<br />
Stimulants<br />
The proportion of ADHL calls related to methamphetamine<br />
remained steady from January 2001 through<br />
June 2004 (exhibit 3). Approximately 20 percent of<br />
adult and 18 percent of youth calls about illicit drugs<br />
involved methamphetamine. Among youth, methamphetamine<br />
is the second most frequently mentioned<br />
illicit drug, following marijuana. Among adults,<br />
methamphetamine calls are less frequent than those for<br />
cocaine, similar to those for marijuana, and slightly<br />
more frequent than calls for heroin.<br />
The proportion of treatment admissions for King<br />
County residents involving methamphetamine increased<br />
slightly in the first half of 2004 to 15 percent,<br />
similar to the 14 percent in each of the 3 years prior and<br />
a sizeable increase from 9 percent in 1999 (exhibit 1).<br />
The characteristics of those entering treatment for<br />
methamphetamine use indicate that they are disproportionately<br />
White compared to the county as a<br />
whole and compared to those admitted to publicly<br />
funded drug treatment. Caucasians represented 76<br />
percent of King County residents in the 2000 census,<br />
but they represented 82 percent of methamphetamine-related<br />
treatment admissions in the first half of<br />
2004. This is a lower proportion of Caucasians entering<br />
treatment for methamphetamine than in 1999. An<br />
increasing number of people are being identified as<br />
“multiple race,” however, which makes the detection<br />
of trends difficult.<br />
Treatment data indicate that methamphetamine users<br />
are much younger than other drug users, with 37 percent<br />
being between the ages of 18 and 29 and 48 percent<br />
being 30–44 in the first half of 2004. This compares<br />
with those who did not use methamphetamine,<br />
23 percent of whom were between 18 and 29, and 40<br />
percent of whom were age 30–44. The age at treatment<br />
admission has stayed fairly steady for methamphetamine<br />
users, with no discernable trend, since 1999.<br />
A larger proportion of methamphetamine treatment<br />
admissions were female—39 percent of admissions<br />
between January and June 2004—than admissions for<br />
using other drugs (32 percent).<br />
Deaths involving amphetamines appear to have leveled<br />
off (exhibit 6a). Almost all amphetamine deaths involved<br />
methamphetamine specifically. There were<br />
seven deaths in which methamphetamine was identified<br />
in the first half of 2004, compared to nine in each<br />
of the preceding three 6-month periods. Decedents<br />
with methamphetamine identified tend to be substantially<br />
younger than those with other drugs, with a median<br />
age 36.5 compared to 42.0 from January 1997 to<br />
Proceedings of the Community Epidemiology Work Group, Vol. II, January 2005 241
June 2004 (exhibit 6c). A minority of decedents were<br />
female, 22 percent over this timeframe, compared to<br />
29 percent for all drugs. Caucasians were overrepresented,<br />
with involvement in 88 percent of methamphetamine-involved<br />
deaths, compared to 84 percent of<br />
all deaths through June 2004. On average, 31 percent<br />
of amphetamine deaths involved no other drugs; this is<br />
the second highest proportion for any of the drugs,<br />
following heroin (exhibit 6b).<br />
Unweighted data from DAWN Live! for the first half<br />
of 2004 indicate amphetamine reports totaled 68 drug<br />
abuse/other, 5 seeking detox/treatment, and 8 overmedication.<br />
Among patients seen for drug<br />
abuse/other, 62 percent were male, 31 percent were<br />
age 18–29, 22 percent were 30–34, and 25 percent<br />
were 35–44. The most common chief complaints<br />
were altered mental status and psychiatric condition.<br />
Route of administration was documented for a minority<br />
of patients, with 8 of the 68 taking amphetamine<br />
orally and 11 injecting; for 48 people, route was not<br />
documented. The number of reports involving injecting<br />
amphetamines, not methamphetamine which is a<br />
separate category, seems high and may represent miscoding.<br />
The most common specific form of amphetamine<br />
was amphetamine-dextroamphetamine<br />
(e.g., Adderall).<br />
In the unweighted ED data for the first half of 2004<br />
for methamphetamine, there were 331 drug abuse/<br />
other reports and 33 seeking detox/treatment (exhibit<br />
2). These drug abuse/other reports for methamphetamine<br />
represented slightly less than 10 percent of all<br />
illicit drug reports. Among those seen for other/drug<br />
abuse, 69 percent were male. One-half were age 18–<br />
29, a much larger proportion than the 28 percent for<br />
all drugs combined.<br />
In the unweighted data, presenting complaints for<br />
methamphetamine ED drug reports included altered<br />
mental status (28 percent), psychiatric condition (22<br />
percent), and abscess/cellulitis (10 percent); all were<br />
more frequent for methamphetamine than for other<br />
drugs. Data for route of administration were missing<br />
for two-thirds of methamphetamine drug reports. For<br />
the drug reports with route data, 63 percent injected,<br />
second only to heroin, and 21 percent ingested by<br />
smoking.<br />
In 2004, PHSKC undertook a comprehensive review<br />
of local behavioral research studies and HIV/STD<br />
testing and reporting data to (1) determine the current<br />
prevalence of methamphetamine use among men who<br />
have sex with men (MSM), (2) identify associations<br />
between MSM methamphetamine use and HIV, and<br />
(3) assess findings specific to methamphetamine injection.<br />
242<br />
<strong>EPIDEMIOLOGIC</strong> TRENDS IN <strong>DRUG</strong> <strong>ABUSE</strong>—Seattle-King County Area<br />
Findings regarding methamphetamine use include the<br />
following: roughly 1 out of 10 MSM has used<br />
methamphetamine at least once in the past year; recent<br />
use of methamphetamine may be up to two times<br />
higher (20 percent) among MSM younger than 30<br />
than among older MSM; methamphetamine use is up<br />
to three times higher (about 30 percent) in MSM with<br />
HIV; and methamphetamine use is more prevalent<br />
among White MSM than MSM of color.<br />
Only about 2 percent (n=660–990) of all MSM have<br />
injected methamphetamine at least once in the past<br />
year, and injectors make up an estimated 11 percent<br />
of current MSM methamphetamine users. The risk<br />
profile of MSM is distinct from other injecting populations<br />
in terms of HIV prevalence, with almost 30<br />
percent HIV infection among MSM amphetamine<br />
injectors, 10 percent among MSM heroin injectors,<br />
and 2 percent among non-MSM male heroin injectors<br />
(exhibit 12). PHSKC believes that the high HIV<br />
prevalence in MSM amphetamine injectors is probably<br />
due to sexual transmission, rather than transmission<br />
via sharing of syringes or other drug injection<br />
equipment. (Note that “amphetamine” was the term<br />
used in some data collection, but it is believed that<br />
the findings relate specifically to methamphetamine.)<br />
Data from PHSKC’s STD clinic indicate that among<br />
MSM, methamphetamine use is significantly associated<br />
with increased numbers of sexual partners, contracting<br />
gonorrhea, having a new HIV diagnosis, and<br />
having preexisting HIV. A significantly larger proportion<br />
of MSM methamphetamine users were potential<br />
HIV transmitters (67 percent) than non-methamphetamine<br />
users (38 percent); potential transmitters<br />
are defined as HIV-positive MSM with unprotected<br />
anal sex partners who are HIV negative or of unknown<br />
HIV status. MSM who used methamphetamine<br />
were also much more likely to be at risk for<br />
acquiring HIV (47 percent) compared to nonmethamphetamine<br />
users (25 percent); risk of acquiring<br />
HIV is defined as having unprotected anal sex<br />
with a partner who is HIV positive or whose serostatus<br />
is unknown. Overall, lifetime methamphetamine<br />
use among those seen at the clinic was reported<br />
by 8.7 percent of MSM, compared with 1.7 percent<br />
of heterosexual men (p
in supply from Mexico or Mexican groups in California.<br />
The DEA reports that crystal methamphetamine is<br />
increasingly available and that prices are slowly declining.<br />
Regarding purity, the DEA reports “The<br />
overall purity of exhibits collected in Washington for<br />
the first six months of FY 2004 has averaged 50 percent,<br />
up from the average purity of 45 percent seen<br />
during FY 2003 and surpassing the 30 percent seen<br />
during FY 2001 and FY 2002. Of the DEA offices in<br />
Washington, Seattle…exhibits have currently yielded<br />
the highest purity at nearly 66 percent.”<br />
Methamphetamine incidents, a combination of active<br />
labs used for manufacturing and dump sites of lab<br />
equipment or inactive labs, decreased for Washington<br />
State as a whole in 2004 (exhibit 13). The peak in<br />
incidents for the State and the two most populated<br />
counties was in 2001. In King County, the number of<br />
incidents remained flat in 2003 and 2004, while<br />
Pierce County to the south experienced increases,<br />
Snohomish County to the north had a slight increase,<br />
and Kitsap County to the west experienced a bit of a<br />
decline. The rate of methamphetamine incidents per<br />
100,000 population was 11 in King County, 77 in<br />
Pierce County, 17 in Snohomish County, 19 in Kitsap<br />
County, and 23 for Washington State in 2004.<br />
It is important to note that these data do not indicate<br />
the manufacturing methods or the quantities manufactured<br />
at the site of individual incidents. Anecdotal<br />
reports from law enforcement indicate that “super”<br />
labs, those capable of producing large amounts of<br />
methamphetamine quickly, represent a small minority<br />
of manufacturing labs in the State.<br />
The total number of methamphetamine seizures by<br />
the U.S. Customs Service has remained low and<br />
fairly steady (exhibit 7). Pseudoephedrine, an important<br />
precursor chemical, has been illegally imported<br />
from Canada. The supply from large pharmaceutical<br />
companies in Canada has apparently been dramatically<br />
reduced in the past year, however, with a concomitant<br />
decline in importation into the United<br />
States, according to the NW HIDTA.<br />
NFLIS data indicate that methamphetamine is found in<br />
law enforcement seizures at a much lower level in the<br />
Seattle area compared with the rest of the State (exhibit<br />
5). In FY 2004, 29 percent of Seattle-area drug<br />
tests and 52 percent of those in the rest of Washington<br />
were positive for methamphetamine. These data represent<br />
slight proportional increases from FY 2003.<br />
Another stimulant is cathinone, the active ingredient in<br />
the botanical khat grown primarily in East Africa and<br />
<strong>EPIDEMIOLOGIC</strong> TRENDS IN <strong>DRUG</strong> <strong>ABUSE</strong>—Seattle-King County Area<br />
the Middle East. Cathinone is a DEA schedule 1 substance.<br />
Fresh khat leaves are chewed or brewed into a<br />
tea for their stimulating effect. Because it needs to be<br />
fresh to be potent, khat is commonly trafficked by air;<br />
occasional khat seizures at Seattle-Tacoma International<br />
Airport are reported by the NW HIDTA. Indicator<br />
data rarely reveal khat, but NFLIS data in FY 2003<br />
did show 11 pieces of evidence tested positive for<br />
cathinone at the Seattle-area lab; none was seen in the<br />
rest of Washington State nor in 2004. Law enforcement<br />
reports that khat use is most common among<br />
East African immigrants. This pattern is similar to that<br />
seen in the Twin Cities, Minnesota, area.<br />
Depressants<br />
Barbiturates, benzodiazepines, and other sedative/depressant<br />
drugs in this analysis include alprazolam<br />
(Xanax), butalbital (Fioricet), chlordiazepoxide (Librium),<br />
diphenhydramine (Benadryl), diazepam (Valium),<br />
hydroxyzine pamoate (Vistaril), lorazepam (Ativan),<br />
meprobamate (Equanil), oxazepam (Serax), phenobarbital,<br />
promethazine (Phenergan), secobarbital<br />
(Seconal), temazepam (Restoril), triazolam (Halcion),<br />
and zolpidem (Ambien).<br />
Depressants are rarely mentioned as a primary drug<br />
at intake to drug treatment. Less than 1 percent of<br />
admissions during the period of January 1999 to June<br />
2004 were for depressants.<br />
Unweighted data accessed from DAWN Live! on ED<br />
drug reports for depressants (barbiturates, benzodiazepines,<br />
and anxiolytics/sedatives/ hypnotics) totaled<br />
145 for drug abuse/other case type reports, 21<br />
for seeking detox/treatment, and 244 for overmedication<br />
(exhibit 2). The 145 drug abuse/other reports<br />
represented just 4 percent of all drug types in the<br />
DAWN data. Females represented a larger proportion<br />
of depressant drug reports (44 percent) than for all<br />
drugs combined (37 percent). The ages of those with<br />
drug reports for depressants tended to be older than<br />
those with reports for all drugs.<br />
In the unweighted data, depressant drug reports in<br />
emergency departments were much more likely to<br />
have overdose as a complaint (17 percent) than reports<br />
for all other drugs (9 percent). Withdrawal was<br />
also a more common complaint, representing 12 percent<br />
of depressant drug reports, compared to 5 percent<br />
for all other drugs.<br />
NFLIS data showed that less than 1 percent of exhibits<br />
from the Seattle-area lab and the rest of the State<br />
were benzodiazepines (i.e., diazepam and clonazepam),<br />
with no change between FY 2003 and FY 2004<br />
(exhibit 5).<br />
Proceedings of the Community Epidemiology Work Group, Vol. II, January 2005 243
Deaths involving depressants were at the highest<br />
level in the year from July 2003 to June 2004, with<br />
79 deaths, compared to 45 in 1997 (exhibit 6a).<br />
Those dying depressant-involved deaths were older<br />
(43 compared to 42), more likely to be Caucasian (89<br />
compared to 84 percent), and more likely to be female<br />
(43 compared to 29 percent) than those involved<br />
in all drug-involved deaths (exhibit 6c). Few<br />
depressant-involved deaths were due solely to depressants,<br />
7 percent overall, the second lowest proportion<br />
next to muscle relaxants (exhibit 6b).<br />
Hallucinogens, Club Drugs, and<br />
Dextromethorphan<br />
Hallucinogens include lysergic acid diethylamide<br />
(LSD), mescaline, peyote, psilocybin (mushrooms),<br />
phencyclidine (PCP), and inhalants. “Club drugs” is a<br />
general term used for drugs that are popular at nightclubs<br />
and raves, including the hallucinogens, methylenedioxymethamphetamine<br />
(MDMA) (ecstasy), gamma<br />
hydroxybutyrate (GHB), gamma butyrolactone<br />
(GBL), ketamine, and nitrous oxide. Dextromethorphan<br />
(DXM), commonly found in over-the-counter<br />
cough medicines, can have dissociative effects at<br />
high dosages.<br />
Treatment admissions in which hallucinogens or PCP<br />
are mentioned as primary are infrequent, representing<br />
well under 1 percent of admissions from 1999 to June<br />
2004.<br />
Unweighted data from DAWN Live! on ED drug<br />
abuse/other reports for these classes of drugs varied<br />
in frequency, with 51 PCP, 47 MDMA, 16 miscellaneous<br />
hallucinogens, 8 LSD, and 5 GHB (exhibit 2).<br />
Together these substances represented 4 percent of<br />
illicit drug reports. Because of the small numbers,<br />
detailed data are presented just for PCP and MDMA.<br />
In these unweighted ED data, PCP drug abuse/other<br />
reports were overwhelmingly male, 96 percent, versus<br />
63 percent for all drugs. PCP-involved patients<br />
were much younger than the average for all drugs; 62<br />
percent were 18–29, compared with 28 percent for all<br />
drugs. Chief complaints also represented a unique<br />
pattern, with 43 percent altered mental status and 9<br />
percent accident/injury/assault, compared with 20<br />
percent and 3 percent for all drugs, in that order.<br />
Route of administration data were missing in the unweighted<br />
ED data for 69 percent of PCP drug reports.<br />
Among the reports with data, 88 percent indicated<br />
smoking as the route. Of the 51 PCP drug abuse/other<br />
case types, 28 were specifically documented to be<br />
“sherm.” Sherm is generally accepted to be street terminology<br />
for a marijuana cigarette laced with PCP.<br />
244<br />
<strong>EPIDEMIOLOGIC</strong> TRENDS IN <strong>DRUG</strong> <strong>ABUSE</strong>—Seattle-King County Area<br />
Some on the street believe it to be a marijuana cigarette<br />
dipped in embalming fluid, and while that may be<br />
the case, discussions with pharmacologists indicate<br />
that embalming fluid/formaldehyde is unlikely to have<br />
psychoactive effect. There are specific case reports<br />
from key informants of embalming fluid being used<br />
simply as the liquid in which PCP was dissolved, perhaps<br />
to give it a unique look and odor.<br />
Of the 49 MDMA total drug reports in the unweighted<br />
emergency department data, 47 were of the<br />
drug abuse/other case type. The majority were male,<br />
70 percent, and young; 68 percent were age 18–30<br />
and 15 percent were younger than 18. The most<br />
common complaint was altered mental status, 25 percent,<br />
a bit higher than the average of 20 percent for<br />
all drugs. Intoxication was twice as prevalent as a<br />
complaint, 12 percent for MDMA compared with 6<br />
percent overall. Conversely, psychiatric condition<br />
was less commonly listed as a chief complaint (9<br />
percent compared with 18 percent overall). Route of<br />
administration data were absent for two-thirds of the<br />
drug reports; among the reports with data, 93 percent<br />
were via the oral route.<br />
ADHL calls regarding PCP and LSD were infrequent,<br />
representing less than 1 percent of both youth<br />
and adult calls (exhibit 3). Calls involving MDMA<br />
have apparently declined in terms of number and<br />
proportion since 2001 for both adults and youth,<br />
though the large number of calls for unknown substances<br />
limits trend analysis. In 2001, there were 117<br />
adult calls about MDMA (3 percent of illicit drug<br />
calls); such calls declined to 27 in the first half of<br />
2004 (2 percent). A similar decline was seen for<br />
youth, from 101 calls in 2001 (9 percent) to 16 calls<br />
from January to June 2004 (6 percent). The more<br />
general term “hallucinogens” has remained small, but<br />
consistent, for adults, representing about 1 percent of<br />
calls over time. For youth, hallucinogen-related calls<br />
appear to have declined from 4 percent to 1 percent<br />
of calls from 2001 through June 2004.<br />
School survey data show that hallucinogens and<br />
MDMA are the second most common illicit substances<br />
used in the past month, following marijuana<br />
(exhibit 4). Reported use of hallucinogens, broadly<br />
defined, decreased from 3.6 to 2.5 percent, and use of<br />
MDMA decreased from 3.4 to 2.8 percent from 2002<br />
to 2004.<br />
There was one MDMA-involved death in the first<br />
half of 2004. Since July 2002, there have been a total<br />
of eight MDMA-involved deaths; there were no<br />
MDMA-involved deaths from January 1997 to June<br />
2002. GHB/GBL deaths totaled three in 2002; none<br />
have been seen since, and none were noted prior.<br />
Proceedings of the Community Epidemiology Work Group, Vol. II, January 2005
There was one dextromethorphan-involved death in<br />
the first half of 2004, a large decrease from the 10<br />
seen in 2003. Between 1997 (when detailed data were<br />
first available) and 2002, DXM-involved deaths<br />
ranged from 0 to 4 per year.<br />
According to the NFLIS, MDMA was detected at<br />
slightly higher levels in the Seattle-area lab than the<br />
rest of the State in FYs 2003 and 2004 (exhibit 5).<br />
The Seattle-area lab reported that 1.4 and 1.0 percent<br />
of evidence tested positive for MDMA in FY 2003<br />
and FY 2004, respectively, while for the rest of the<br />
State, the levels were 0.5 percent in each year. Psilocin,<br />
the active ingredient in psychedelic mushrooms,<br />
was seen at similar levels for each region and<br />
in each year, between 0.5 and 0.7 percent. PCP was<br />
not among the top 25 drugs detected in Washington,<br />
not including Seattle, while in Seattle it represented a<br />
bit less than 1 percent of evidence in each year.<br />
The U.S. Customs Service first provided data indicating<br />
seizures of MDMA in the first half of 2002 (exhibit<br />
7). The number of seizures and amount of product<br />
seized has generally been low. However, the<br />
highest number of seizures (25) and the second highest<br />
total weight of those seizures (99 pounds) occurred<br />
in the first half of 2004. The data refer primarily<br />
to ecstasy tablets and pills, though data for one<br />
seizure specifically noted one-half pound of ecstasy<br />
powder.<br />
A recent report from British Columbia, Canada,<br />
noted that about one-half of the MDMA had<br />
methamphetamine in it. Unfortunately, data on testing<br />
of Washington State law enforcement seizures do<br />
not capture what the drug was sold as, so these data<br />
cannot be used directly. However, State toxicology<br />
laboratory staff report that methamphetamine is increasingly<br />
seen in addition to MDMA in tablets.<br />
Another source of data, www.ecstasydata.org, represents<br />
a convenience sample of drug tests on tablets<br />
purported to be MDMA. These data are based upon<br />
samples submitted by the general public that are suspected<br />
of being adulterated. The location of the purchase<br />
is noted. Data from 65 samples submitted from<br />
2000 to 2003 for Seattle indicate that 52 percent of<br />
the pills contained MDMA, 24 percent contained<br />
caffeine, 21 percent contained methylenedioxyamphetamine<br />
(MDA), and 19 percent contained<br />
methamphetamine (exhibit 14). No trend is discernable<br />
due to the small numbers in each year.<br />
According to sources “Adulterants are…there to fool<br />
naive users and make a quick buck.” The increase in<br />
methamphetamine in MDMA may simply be a matter<br />
of profit, with a bit of MDMA in each tablet to get<br />
<strong>EPIDEMIOLOGIC</strong> TRENDS IN <strong>DRUG</strong> <strong>ABUSE</strong>—Seattle-King County Area<br />
past the test kits and methamphetamine (which is<br />
much cheaper) to make sure the pill still has a kick.<br />
Pill presses, necessary for tableting ecstasy, are still<br />
occasionally seized according to Federal law enforcement<br />
sources.<br />
Other Drugs of Note—Muscle Relaxants and<br />
Tricyclic Antidepressants<br />
Muscle Relaxants<br />
Only 19 drug reports in the unweighted data accessed<br />
through DAWN Live! for muscle relaxants were classified<br />
as drug abuse/other out of the total 93 reports<br />
for all case types.<br />
Carisoprodol was infrequently identified in NFLIS<br />
data for any region of the State in FYs 2003 and<br />
2004, accounting for only 0.0–0.3 percent of evidence<br />
tested (exhibit 5). NW HIDTA reports that<br />
carisoprodol is the sixth most common substance<br />
identified in impaired drivers, according to the State<br />
Toxicology Lab in 2003.<br />
Muscle relaxants are a category of drug that is often<br />
overlooked in the investigation of drug abuse trends.<br />
In past reports, these medications were categorized as<br />
“other drugs” and not discussed. These drugs can<br />
have potent sedating effects in addition to their impact<br />
on muscle tissue. Use of muscle relaxants in<br />
combination with other depressants such as alcohol<br />
or benzodiazepines is contraindicated.<br />
Key informants continue to note that cyclobenzaprine<br />
(e.g., Flexeril) and carisoprodol (e.g., Soma) are purchased<br />
on the street with the intent of using them to<br />
get high.<br />
Deaths involving muscle relaxants totaled four in the<br />
first half of 2004, similar to the prior 18 months, and<br />
slightly higher than the level seen in the previous 5½<br />
years (exhibit 6a). Muscle relaxants were the only<br />
substance for which no deaths were due to a single<br />
drug (exhibit 6b). The demographics were equally<br />
striking, with all users being Caucasian and 62 percent<br />
being female (exhibit 6c).<br />
Antidepressants<br />
The term “antidepressant” indicates the original indication<br />
for prescribing the medication when it was<br />
introduced on the market, but current indications for<br />
use often are very different. Antidepressants are very<br />
diverse drugs in terms of their effects, ranging from<br />
heavily sedating to mildly stimulating. Tricyclic antidepressants<br />
(e.g., amitriptyline, doxepin, nortrityline,<br />
Proceedings of the Community Epidemiology Work Group, Vol. II, January 2005 245
imipramine) are an older class of medications that are<br />
now most commonly used for treating insomnia or<br />
pain.<br />
There were 11 tricyclic antidepressant-involved drug<br />
deaths in the first half of 2004. Tricyclics identified<br />
in polydrug deaths peaked in 2003 at 32 mentions,<br />
with an average of 18 per year in the preceding 6<br />
years. All analyses for this report exclude deaths due<br />
only to antidepressants, the majority of which involve<br />
tricyclics, because the local work group determined<br />
these medications are rarely used exclusively as<br />
drugs of abuse.<br />
The unweighted data accessed through DAWN Live!<br />
show a total of 58 drug reports for tricyclic antidepressants,<br />
with just 19 of the drug abuse/other case<br />
type.<br />
INFECTIOUS DISEASES RELATED TO <strong>DRUG</strong> <strong>ABUSE</strong><br />
Available data are for people diagnosed with HIV infection<br />
between July 2001 and June 2004 and reported<br />
to PHSKC or the Washington Department of Health as<br />
of November 30, 2004. Injecting drug users (IDUs)<br />
make up 6 percent (n=54) of King County HIV cases<br />
and 14 percent (n=74) of HIV cases in the rest of the<br />
State. These levels are much lower than the national<br />
average of 26 percent. MSM who are also IDUs make<br />
up 7 percent (n=64) of the HIV cases in the county and<br />
6 percent (n=29) in the rest of the State, higher than<br />
the national average of 5 percent.<br />
246<br />
<strong>EPIDEMIOLOGIC</strong> TRENDS IN <strong>DRUG</strong> <strong>ABUSE</strong>—Seattle-King County Area<br />
Excepting male drug injectors who also have sex<br />
with men, the rate of HIV infection among the<br />
15,000–18,000 IDUs who reside in King County has<br />
remained low and stable over the past 14 years. Various<br />
serosurveys conducted in methadone treatment<br />
centers and correctional facilities and through street<br />
and community-targeted sampling strategies over this<br />
period indicate that 4 percent or fewer of IDUs who<br />
are not MSM in King County are infected with HIV.<br />
Data from a CDC-funded HIV Incidence Study<br />
(HIVIS 1996-2001) suggest that the rate of new infections<br />
among non-MSM/non-IDUs in King County<br />
is less than 0.5 percent per year.<br />
See the stimulant section of this report for findings<br />
related to methamphetamine use and HIV infection<br />
from local prevalence estimates and STD clinic patients.<br />
Hepatitis B and C are endemic among Seattle-area<br />
injectors. Epidemiologic studies conducted among<br />
more than 4,000 IDUs by PHSKC’s HIV-AIDS Epidemiology<br />
Program since 1994 reveal that 85 percent<br />
of King County IDUs may be infected with hepatitis<br />
C (HCV), and 70 percent show markers of prior infection<br />
with hepatitis B (HBV). Local incidence studies<br />
indicate that 21 percent of non-infected IDUs acquire<br />
HCV each year and 10 percent of IDUs who<br />
have not had hepatitis B acquire HBV.<br />
For inquiries concerning this report, please contact Caleb Banta-Green, MPH, MSW, Alcohol and Drug Abuse Institute, University of Washington,<br />
1107 NE 45th St, Suite 120, Seattle, WA 98105, Phone: (206) 685-3919, Fax: (206) 543-5473, E-mail: , Web:<br />
http://adai.washington.edu or Ron Jackson, MSW, Evergreen Treatment Services, Phone (206) 223-3644, E-mail: ronjack@u.washington.edu.<br />
Proceedings of the Community Epidemiology Work Group, Vol. II, January 2005
<strong>EPIDEMIOLOGIC</strong> TRENDS IN <strong>DRUG</strong> <strong>ABUSE</strong>—Seattle-King County Area<br />
Exhibit 1. Drug Treatment 1 Admissions for Primary, Secondary, or Tertiary Use of Selected Drugs by Youth<br />
and Adults Combined in King County, Washington: January 1999–June 2004<br />
Drug<br />
1999 2000 2001 2002 2003 1H 2004<br />
(N) % (N) % (N) % (N) % (N) % (N) %<br />
Any Alcohol Use 7,867 79.93 8,180 78.06 7,557 77.36 6,733 75.8 6,538 74.38 3,448 75.15<br />
Any Methamphetamine<br />
Use<br />
Any Cocaine<br />
Use<br />
Any Marijuana<br />
Use<br />
898 9.12 1,194 11.39 1,372 14.05 1,231 13.86 1,218 13.86 697 15.19<br />
4,382 44.52 4,667 44.54 4,105 42.02 3,535 39.8 3,406 38.75 1,703 37.12<br />
4,975 50.55 5,377 51.31 5,120 52.42 4,403 49.57 4,435 50.46 2,159 47.06<br />
Any Heroin Use 2,533 25.74 2,719 25.95 2,190 22.42 1,944 21.89 1,735 19.74 928 20.23<br />
IDU 2 (Ever) 3,558 36.15 3,865 36.88 3,361 34.41 3,015 33.95 2,652 30.17 1,432 31.21<br />
Total 9,842 10,479 9,768 8,882 8,790 4,588<br />
Percent<br />
100<br />
80<br />
60<br />
40<br />
20<br />
0<br />
Alcohol<br />
Marijuana<br />
Cocaine<br />
IDU- Ever<br />
Heroin<br />
Meth<br />
Treatment Admissions for King County Residents, Any Use of Drug<br />
1999 2000 2001 2002 2003 1H 2004<br />
1<br />
Data include all ages, all treatment modalities, department of corrections and private pay clients at opiate substitution treatment<br />
clinics.<br />
2<br />
Injection drug use (ever).<br />
SOURCE: Washington State TARGET data system—Structured Ad Hoc Reporting System<br />
Proceedings of the Community Epidemiology Work Group, Vol. II, January 2005 247
248<br />
<strong>EPIDEMIOLOGIC</strong> TRENDS IN <strong>DRUG</strong> <strong>ABUSE</strong>—Seattle-King County Area<br />
Exhibit 2. Characteristics of ED Drug Reports for Selected Drug Abuse/Other Case Types in King and<br />
Snohomish Counties, by Percent (Unweighted 1 ): January–June 2004<br />
Characteristic All Drugs Cocaine Methamphetamine<br />
Other<br />
Opiates<br />
Heroin Marijuana Depressants<br />
MDMA PCP<br />
Number of Drug Reports 4,450 1,082 331 353 933 429 145 47 51<br />
Gender<br />
Age<br />
Male 63% 65% 69% 52% 57% 68% 56% 70% 96%<br />
11 years and younger 0% 0% 0% 0% 0% 0% 0% 0% 0%<br />
12–17 years 3% 1% 1% 0% 0% 12% 4% 15% 2%<br />
18–20 years 7% 3% 16% 4% 3% 18% 3% 23% 20%<br />
21–24 years 9% 7% 17% 7% 6% 12% 10% 34% 24%<br />
25–29 years 12% 11% 16% 11% 13% 13% 8% 11% 18%<br />
30–34 years 15% 15% 14% 12% 17% 15% 13% 9% 25%<br />
35–44 years 30% 38% 24% 30% 32% 19% 34% 6% 8%<br />
45–54 years 20% 22% 9% 29% 27% 10% 21% 2% 4%<br />
55–64 years 3% 4% 1% 7% 3% 1% 6% 0% 0%<br />
65 years and older 0% 0% 0% 1% 0% 0% 1% 0% 0%<br />
Complaint<br />
Overdose 9% 7% 4% 10% 12% 5% 17% 6% 4%<br />
Intoxication 6% 5% 5% 3% 2% 8% 6% 12% 10%<br />
Seizures 1% 2% 0% 1% 1% 1% 2% 1% 1%<br />
Altered mental status 20% 20% 28% 17% 12% 24% 17% 25% 43%<br />
Psychiatric condition 18% 24% 22% 13% 7% 26% 17% 9% 16%<br />
Withdrawal 5% 2% 1% 26% 3% 2% 12% 1% 0%<br />
Seeking detox 0% 0% 0% 0% 0% 0% 0% 0% 0%<br />
Accident/injury/assault 3% 3% 3% 1% 2% 4% 1% 1% 9%<br />
Abscess/cellulitis/skin/<br />
tissue 12% 7% 10% 3% 42% 2% 2% 0% 1%<br />
Chest pain 4% 7% 5% 2% 2% 3% 3% 7% 0%<br />
Respiratory problems 4% 5% 3% 3% 3% 3% 0% 9% 6%<br />
Digestive problems 4% 3% 2% 6% 4% 3% 5% 8% 2%<br />
Other 15% 16% 17% 15% 10% 19% 18% 20% 9%<br />
Total Complaints (N) 6,522 1,582 493 387 1,242 630 220 85 82<br />
Patient Disposition<br />
Discharged home 58% 56% 56% 63% 59% 64% 54% 62% 55%<br />
Released to police/jail<br />
Referred to detox/<br />
3% 3% 5% 2% 3% 3% 6% 4% 2%<br />
treatment<br />
Admitted to ICU/Critical<br />
7% 8% 9% 10% 4% 8% 8% 4% 10%<br />
care 3% 3% 4% 4% 2% 2% 6% 2% 2%<br />
Transferred<br />
Left against medical<br />
3% 3% 3% 2% 1% 3% 5% 0% 2%<br />
advice 2% 1% 2% 1% 3% 1% 1% 2% 2%<br />
Died 0% 0% 0% 0% 0% 0% 0% 0% 0%<br />
Other 1% 2% 2% 1% 1% 3% 2% 2% 0%<br />
Not documented 3% 4% 3% 2% 3% 3% 3% 2% 6%<br />
Admitted to surgery<br />
Admitted to chemical<br />
2% 1% 2% 1% 7% 0% 0% 0% 0%<br />
dependency/detox 1% 1% 2% 3% 2% 1% 1% 0% 0%<br />
Admitted to psych. unit<br />
Admitted to other<br />
5% 7% 6% 3% 2% 5% 6% 2% 8%<br />
inpatient unit 10% 11% 7% 8% 12% 7% 9% 19% 14%<br />
Admitted to any unit 22% 23% 20% 18% 25% 15% 22% 23% 24%<br />
Proceedings of the Community Epidemiology Work Group, Vol. II, January 2005
<strong>EPIDEMIOLOGIC</strong> TRENDS IN <strong>DRUG</strong> <strong>ABUSE</strong>—Seattle-King County Area<br />
Exhibit 2. Characteristics of ED Drug Reports for Selected Drug Abuse/Other Case Types in King and<br />
Snohomish Counties (Unweighted 1 ): January–June 2004 (Continued)<br />
Characteristic All Drugs Cocaine Methamphetamine<br />
Route of Administration as Proportion of Documented Reports<br />
Other<br />
Opiates<br />
Heroin Marijuana Depressants<br />
MDMA PCP<br />
Oral 41% 10% 10% 91% 2% 7% 95% 93% 13%<br />
Injected 41% 36% 63% 7% 96% 2% 5% 0% 0%<br />
Inhaled, sniffed, snorted 3% 12% 4% 0% 1% 1% 0% 0% 0%<br />
Smoked 15% 41% 21% 0% 1% 88% 0% 7% 88%<br />
Other 1% 1% 3% 2% 0% 1% 0% 0% 0%<br />
Not documented 52% 72% 66% 52% 31% 64% 54% 68% 69%<br />
1 The unweighted data are from 10–13 Seattle area EDs reporting to DAWN. All DAWN cases are reviewed for quality control. Based<br />
on this review, cases may be corrected or deleted and, therefore, are subject to change.<br />
SOURCE: DAWN Live!, OAS, SAMHSA, updated 1/14/2005<br />
Proceedings of the Community Epidemiology Work Group, Vol. II, January 2005 249
250<br />
<strong>EPIDEMIOLOGIC</strong> TRENDS IN <strong>DRUG</strong> <strong>ABUSE</strong>—Seattle-King County Area<br />
Exhibit 3. Illicit Drug Helpline Calls, King County Residents, by Drug and Percent: 2001–June 2004<br />
Methamphetamine<br />
PCP<br />
Hallucinogens<br />
Ecstasy<br />
Cocaine<br />
Heroin<br />
Unknow n<br />
Marijuana<br />
LSD<br />
Adult Illicit Drug Helpline Calls<br />
2001<br />
2002<br />
2003<br />
1H 2004<br />
Adult Youth<br />
Substance<br />
2001 2002 2003 1H 2004 2001 2002 2003 1H 2004<br />
No. % No. % No. % No. % No. % No. % No. % No. %<br />
LSD 22 0.5% 4 0.1% 4 0.1% 2 0.1% - 0.0% 0 0.0% 0 0.0% 2 0.7%<br />
Marijuana 972 24.2% 967 23.8% 637 20.4% 332 20.0% 491 45.5% 353 53.2% 302 57.3% 157 53.8%<br />
Unknown 424 10.5% 531 13.1% 89 2.9% 45 2.7% 131 12.2% 78 11.7% 21 4.0% 11 3.8%<br />
Heroin 521 13.0% 584 14.4% 561 18.0% 287 17.3% 22 2.0% 12 1.8% 14 2.7% 7 2.4%<br />
Cocaine 1,088 27.1% 1,124 27.7% 1,142 36.6% 617 37.1% 91 8.4% 69 10.4% 56 10.6% 42 14.4%<br />
Ecstasy 117 2.9% 69 1.7% 34 1.1% 27 1.6% 101 9.4% 35 5.3% 19 3.6% 16 5.5%<br />
Hallucinogens 29 0.7% 30 0.7% 21 0.7% 12 0.7% 44 4.1% 7 1.1% 14 2.7% 3 1.0%<br />
PCP 5 0.1% 5 0.1% 3 0.1% 5 0.3% - 0.0% 0 0.0% 2 0.4% 1 0.3%<br />
Metham-phetamine 842 20.9% 743 18.3% 627 20.1% 335 20.2% 198 18.4% 110 16.6% 99 18.8% 53 18.2%<br />
Total 4,020 4,057 3,118 1,662 1,078 664 527 292<br />
SOURCE: Washington State 24-Hour Alcohol and Drug Helpline<br />
Methamphetamine<br />
PCP<br />
Hallucinogens<br />
Ecstasy<br />
Cocaine<br />
Heroin<br />
Unknow n<br />
Marijuana<br />
LSD<br />
Youth Illicit Drug Helpline Calls<br />
2001<br />
2002<br />
2003<br />
1H 2004<br />
Proceedings of the Community Epidemiology Work Group, Vol. II, January 2005
<strong>EPIDEMIOLOGIC</strong> TRENDS IN <strong>DRUG</strong> <strong>ABUSE</strong>—Seattle-King County Area<br />
Exhibit 4. Drug Use in Prior 30 Days by 12th Graders in the Seattle Public School’s Communities That Care<br />
Survey: 2002 and 2004<br />
Substance<br />
Prevalence<br />
2002<br />
Response Rate<br />
2004<br />
2002 2004 % N % N<br />
Alcohol 47.9% 51.1% 51.3% 1,287 61.0% 1,475<br />
Cigarettes 22.8% 16.1% 52.0% 1,305 61.3% 1,481<br />
Chewing Tobacco 3.9% 3.2% 51.8% 1,301 61.3% 1,481<br />
Inhalants 2.1% 1.4% 50.0% 1,256 60.0% 1,451<br />
Marijuana 27.0% 25.4% 50.7% 1,273 60.6% 1,464<br />
Hallucinogens 3.6% 2.5% 50.4% 1,265 60.5% 1,462<br />
Cocaine 1.7% 2.5% 50.4% 1,266 60.3% 1,457<br />
MDMA (Ecstasy) 3.4% 2.8% 50.3% 1,263 60.4% 1,461<br />
Stimulants (Amphetamines,<br />
Methamphetamine)<br />
1.1% 2.0% 49.8% 1,250 59.8% 1,445<br />
Alcohol 47.9% 51.1% 51.3% 1,287 61.0% 1,475<br />
SOURCE: Communities That Care Survey, http://www.seattleschools.org/area/ctc/survey/survey.xml<br />
Proceedings of the Community Epidemiology Work Group, Vol. II, January 2005 251
252<br />
<strong>EPIDEMIOLOGIC</strong> TRENDS IN <strong>DRUG</strong> <strong>ABUSE</strong>—Seattle-King County Area<br />
Exhibit 5. National Forensic Lab Information System, Drug Test Results for Law Enforcement in Seizures in<br />
Seattle and the State of Washington: FY 2003–FY 2004<br />
Substance<br />
Seattle-Area Lab<br />
Washington State<br />
(Without Seattle-Area Lab)<br />
FY 2003 FY 2004 FY 2003 FY 2004<br />
Acetaminophen 0.3 0.2 0.2 0.1<br />
Alprazolam 0.3 0.1 0.2 0.2<br />
Amphetamine 0.3 0.2 0.3 0.4<br />
Caffeine 0.3 0.2 0.2 0.2<br />
Cannabinol 0.2<br />
Cannabis 17.2 15.3 15.5 15.6<br />
Carisoprodol 0.3 0.2 0.1<br />
Cathinone 0.3<br />
Clonazepam 0.5 0.3 0.3 0.3<br />
Cocaine 40.5 40.4 20.6 18.2<br />
Codeine 0.2 0.2 0.1<br />
Diazepam 0.4 0.3 0.4 0.3<br />
Heroin 5.0 4.7 6.5 4.8<br />
Hydrocodone 0.7 0.9 1.1 1.3<br />
Hydromorphone 0.1<br />
Ibuprofen 0.1<br />
Ketamine 0.1<br />
Lorazepam 0.1<br />
MDA 0.3 0.3 0.1<br />
MDMA 1.4 1.0 0.5 0.5<br />
Methadone 0.4 0.7 0.4 0.6<br />
Methamphetamine 27.2 29.4 47.8 51.7<br />
Methandrostenolone (Methandienone) 0.1<br />
Methylphenidate 0.3 0.1 0.1<br />
Morphine 0.2 0.3 0.3 0.4<br />
Non-Controlled Non-Narcotic Drug 0.3 0.3 0.5 0.7<br />
Oxycodone 0.9 1.4 1.2 1.1<br />
PCP 0.9 0.6<br />
Propoxyphene 0.1 0.1<br />
Pseudoephedrine 0.7 0.4 0.8 0.7<br />
Psilocin 0.7 0.6 0.5 0.7<br />
Psilocybine 0.3 0.3 0.2<br />
Sodium Bicarbonate 0.2 0.2<br />
Total of Top 25 (#) 99.3 98.8 98.6 98.6<br />
Subtotals<br />
Other opiates 2.4 3.6 3.3 3.5<br />
Benzodiazepines 1.2 0.9 0.9 0.8<br />
Cannabis<br />
Clonazepam<br />
Cocaine<br />
Diazepam<br />
Heroin<br />
Hy drocodone<br />
MDMA<br />
Methamphetamine<br />
Methadone<br />
Ox y codone<br />
PCP<br />
Pseudoephedrine<br />
SOURCE: NFLIS, DEA<br />
Seattle-Area Lab<br />
Law Enforcement Seizure Drug Test Results<br />
FY 2003<br />
FY 2004<br />
Cannabis<br />
Clonazepam<br />
Cocaine<br />
Diazepam<br />
Hy drocodone<br />
Methamphetamine<br />
Methadone<br />
Ox y codone<br />
Pseudoephedrine<br />
Washington State (Without Seattle-Area) Lab<br />
Heroin<br />
MDMA<br />
PCP<br />
FY 2003<br />
FY 2004<br />
Proceedings of the Community Epidemiology Work Group, Vol. II, January 2005
<strong>EPIDEMIOLOGIC</strong> TRENDS IN <strong>DRUG</strong> <strong>ABUSE</strong>—Seattle-King County Area<br />
Exhibit 6a. Drug-Involved Deaths in King County, Washington, Related to Illicit and Prescription Drugs:<br />
1997–June 2004<br />
Number of Drugs Identified<br />
100<br />
90<br />
80<br />
70<br />
60<br />
50<br />
40<br />
30<br />
20<br />
10<br />
0<br />
1997<br />
1998<br />
1999<br />
2000<br />
2001<br />
2002<br />
2003<br />
2004<br />
1997<br />
1998<br />
1999<br />
2000<br />
2001<br />
2002<br />
2003<br />
2004<br />
1997 1997 1997 1997<br />
1998<br />
1999<br />
2000<br />
2001<br />
2002<br />
2003<br />
2004<br />
1997<br />
1998<br />
1999<br />
2000<br />
2001<br />
2002<br />
2003<br />
2004<br />
1997<br />
1998<br />
1999<br />
2000<br />
2001<br />
2002<br />
2003 2003 2003 2003<br />
2004 2004 2004 2004<br />
1997 1997 1997 1997<br />
1998 1998 1998 1998<br />
1999<br />
2000 2000 2000 2000<br />
2001 2001 2001 2001<br />
2002 2002 2002 2002<br />
2003 2003 2003 2003<br />
2004 2004 2004 2004<br />
Drugs<br />
Identified (#)<br />
Cocaine Heroin/Opiate Other Opiate Amphetamine Depressant Muscle Relaxant<br />
Cocaine<br />
Heroin/<br />
Opiate<br />
Other<br />
Opiate<br />
Amphetamine Depressant<br />
Muscle<br />
Relaxant<br />
Total Deaths<br />
1997 H1 37 60 13 1 20 2 103<br />
1997 H2 29 51 14 4 25 0 76<br />
1998 H1 27 56 25 1 25 2 102<br />
1998 H2 42 88 19 2 26 2 120<br />
1999 H1 42 61 23 2 15 0 103<br />
1999 H2 34 56 9 12 13 0 102<br />
2000 H1 51 66 26 7 19 3 130<br />
2000 H2 38 36 24 4 14 1 90<br />
2001 H1 29 34 28 3 26 2 85<br />
2001 H2 20 27 25 2 14 1 67<br />
2002 H1 49 48 26 5 25 2 102<br />
2002 H2 30 39 40 9 29 4 93<br />
2003 H1 23 28 38 9 31 5 82<br />
2003 H2 29 34 46 9 40 6 104<br />
2004 H1 43 34 48 7 39 4 116<br />
Total Deaths 523 718 404 77 361 34 1,475<br />
Note: Data are duplicated; most deaths involve multiple drugs.<br />
SOURCE: Medical Examiners Office, Public Health Seattle-King County<br />
Proceedings of the Community Epidemiology Work Group, Vol. II, January 2005 253
254<br />
<strong>EPIDEMIOLOGIC</strong> TRENDS IN <strong>DRUG</strong> <strong>ABUSE</strong>—Seattle-King County Area<br />
Exhibit 6b. Proportion of Drug-Involved Deaths Due to a Single Drug in King County, Washington, Related<br />
to Illicit and Prescription Drugs: 1997–June 2004<br />
Single Drug Identified<br />
Cocaine<br />
Heroin/<br />
Opiate<br />
Other<br />
Opiate<br />
Amphetamine Depressant<br />
Muscle<br />
Relaxant<br />
1997 H1 19 52 0 0 20 0<br />
1997 H2 17 43 7 50 12 0<br />
1998 H1 19 48 32 100 8 0<br />
1998 H2 7 43 21 0 12 0<br />
1999 H1 17 44 17 0 13 0<br />
1999 H2 18 41 33 50 23 0<br />
2000 H1 33 39 23 0 16 0<br />
2000 H2 37 42 17 50 7 0<br />
2001 H1 14 21 11 33 4 0<br />
2001 H2 20 33 20 0 0 0<br />
2002 H1 27 27 8 0 0 0<br />
2002 H2 10 15 8 33 0 0<br />
2003 H1 22 14 8 33 6 0<br />
2003 H2 14 9 4 44 3 0<br />
2004 H1 21 9 8 29 5 0<br />
Average 20 35 13 31 7 0<br />
Range (Min, Max) (7, 37) (9, 52) (0, 33) (0, 100) (0, 23) (0, 0)<br />
SOURCE: Medical Examiners Office, Public Health – Seattle & King County<br />
Exhibit 6c. Demographics of Drug-Involved Deaths in King County, Washington, Related to Illicit and<br />
Prescription Drugs, by Percent: 1997–June 2004<br />
Demographic Cocaine<br />
Heroin/<br />
Opiate<br />
Other<br />
Opiate<br />
Amphetamine<br />
Depressant<br />
Muscle<br />
Relaxant<br />
All<br />
Drugs<br />
Median Age (in Years) (41) (41) (43) (36.5) (43) (42) (42)<br />
% Female<br />
Race<br />
20.7 18.5 42.2 22.4 43.1 61.8 28.7<br />
Caucasian 73.2 84.0 87.4 88.3 88.9 100.0 83.6<br />
African-American 20.1 9.5 8.7 3.9 6.4 0.0 10.2<br />
Asian/Pacific Islander 1.1 0.4 1.0 2.6 1.4 0.0 1.4<br />
Native American 2.1 2.9 2.0 2.6 1.9 0.0 2.5<br />
Hispanic 1.5 1.7 0.5 0 0.6 0.0 1.2<br />
Other/Mixed 1.9 1.5 0.5 2.6 0.8 0.0 1.2<br />
Note: Data are duplicated; most deaths involve multiple drugs.<br />
SOURCE: Medical Examiners Office, Public Health Seattle & King County.<br />
Proceedings of the Community Epidemiology Work Group, Vol. II, January 2005
Log Scale<br />
100,000<br />
10,000<br />
1,000<br />
100<br />
10<br />
1<br />
0<br />
<strong>EPIDEMIOLOGIC</strong> TRENDS IN <strong>DRUG</strong> <strong>ABUSE</strong>—Seattle-King County Area<br />
Exhibit 7. Drug Seizures by U.S. Customs, Washington State Ports of Entry: 2001–June 2004<br />
Seizures Pounds Seizures Pounds Seizures Pounds Seizures Pounds Seizures Pounds Seizures Pounds<br />
Cocaine Methamphetamine Heroin Marijuana Ecstasy Hashish<br />
1H 2001 19 5,378 10 1 7 2 268 3,433<br />
2H 2001 16 153 7 2 5 5 301 7,519<br />
1H 2002 13 37 10 8 408 9,812 11 132<br />
2H 2002 14 109 8 0 2 36 388 4,127 10 83<br />
1H 2003 16 414 0 3 9 230 9,225 4 32 5 1<br />
2H 2003 18 359 4 1 2 0 257 13,171 13 1 8 2<br />
1H 2004 14 199 5 18 248 9,750 25 99 16 15<br />
SOURCE: U.S. Customs Service<br />
Exhibit 8. Opiate Substitution Treatment Among King County Residents: 1999–June 2004<br />
1999 2000 1 2001 2002 2003<br />
Jan–June<br />
2004<br />
Admissions(N) 632 924 890 794 633 291<br />
Discharges (N) 1,333 1,560 1,238 1,175 1,084 671<br />
Primary Drug at Entry (%)<br />
Heroin 94.6 93.3 92.8 90.4 87.7 83.9<br />
Prescription Opiate 3.0 6.1 6.5 8.8 11.4 14.0<br />
1 Treatment capacity increased by 350 in 2000<br />
SOURCE: Washington State TARGET data system—Structured Ad Hoc Reporting System<br />
Exhibit 9. Methadone Waiting List, Managed by Syringe Exchange Program, King County: 1997–2004 1<br />
Number on<br />
Waiting List<br />
1997 1998 1999 2000 1 2001 2002 2003 2004<br />
198 307 548 624 495 663 638 487<br />
1 Figures are for the close of each year.<br />
SOURCE: Public Health – Seattle & King County, HIV/AIDS Program<br />
Proceedings of the Community Epidemiology Work Group, Vol. II, January 2005 255
256<br />
<strong>EPIDEMIOLOGIC</strong> TRENDS IN <strong>DRUG</strong> <strong>ABUSE</strong>—Seattle-King County Area<br />
Exhibit 10. Syringes Exchanged and Number of Encounters for King County Syringe Exchanges:<br />
2002–2004<br />
2002 2003 2004<br />
Syringes Exchanged 1,801,151 1,969,522 2,183,150<br />
Encounters 1 73,752 65,593 63,898<br />
Avg. Number of Syringes Per Encounter 24 30 34<br />
1 Encounters are duplicated.<br />
SOURCE: Public Health – Seattle & King County, HIV/AIDS Program<br />
Exhibit 11. Prescription Opiates Sold to Hospitals and Pharmacies, King County Area 1 (Grams of Active<br />
Ingredient Per 100,000 Population Per Year): 1997–June 2004<br />
Active Ingredient 1997 1998 1999 2000 2001 2002 2003 1H 2004<br />
Percent<br />
Change 2<br />
Codeine 9,311 8,651 8,318 … 7,190 … 6,789 6,384 -31%<br />
Oxycodone 3,328 4,662 6,032 7,615 10,012 11,133 13,702 14,237 328%<br />
Hydromorphone 179 158 175 … 244 252 322 … 80%<br />
Hydrocodone 2,868 3,103 3,542 3,772 4,212 5,127 5,530 5,713 99%<br />
Meperidine 2,346 2,214 2,085 … 1,931 … 1,641 1,424 -39%<br />
Methadone 561 682 839 … 1,442 1,843 2,575 3,252 480%<br />
Morphine 3,071 3,314 3,404 … 4,170 … 5,781 7,022 129%<br />
Fentanyl 40 45 48 … 72 … 109 105 162%<br />
1<br />
Data are for Zip Codes 980xx and 981xx, which approximate King County boundaries. Data not adjusted for widely varying potencies<br />
(morphine equivalencies) of these substances.<br />
2<br />
1997 through last year of available data.<br />
SOURCE: ARCOS/DEA http://www.deadiversion.usdoj.gov/arcos/retail_drug_summary/index.html<br />
Proceedings of the Community Epidemiology Work Group, Vol. II, January 2005
<strong>EPIDEMIOLOGIC</strong> TRENDS IN <strong>DRUG</strong> <strong>ABUSE</strong>—Seattle-King County Area<br />
Exhibit 12. Comparison of HIV and HCV Seroprevalence by Primary Injection Drug and MSM 1 Status in<br />
Recently Arrested Male Injectors, Seattle-King County, Kiwi Study: 1998–2002<br />
MSM Status and Primary<br />
HIV Hepatitis C<br />
Injection Drug N Percent HIV+ N Percent HCV+<br />
Never-MSM heroin injectors 553 2.0 364 78.3<br />
Never-MSM amphetamine 2 injectors 343 1.1 307 38.1<br />
MSM heroin injectors 32 9.7 16 75.0<br />
MSM amphetamine injectors 41 29.3 32 37.5<br />
1<br />
MSM=male-male sex in the past year.<br />
2<br />
’Amphetamine’ was the term used in some data collection, but it is believed that the findings related directly to methamphetamine<br />
specifically.<br />
SOURCE: Public Health – Seattle & King County<br />
Exhibit 13. Number of Methamphetamine Labs and Dump Sites Reported in King and Neighboring Counties:<br />
1990–2004<br />
Number of Methamphetamine Incidents, Labs, and Dump Sites<br />
2,000<br />
1,800<br />
1,600<br />
1,400<br />
1,200<br />
1,000<br />
800<br />
600<br />
400<br />
200<br />
0<br />
SOURCE: Washington State Department of Ecology<br />
1990 1991 1992 1993 1994 1995 1996 1997 1998 1999 2000 2001 2002 2003 2004<br />
King 6 10 2 7 7 10 23 17 48 107 231 271 241 202 199<br />
Kitsap 1 1 2 1 3 1 21 45 54 60 50 44<br />
Pierce 10 18 18 12 17 17 53 42 129 318 545 589 438 466 541<br />
Snohomish 2 2 2 7 6 5 13 37 69 83 98 101<br />
WA State TOTAL 38 43 40 42 36 54 153 203 349 789 1,454 1,890 1,693 1,480 1337<br />
Proceedings of the Community Epidemiology Work Group, Vol. II, January 2005 257
258<br />
<strong>EPIDEMIOLOGIC</strong> TRENDS IN <strong>DRUG</strong> <strong>ABUSE</strong>—Seattle-King County Area<br />
Exhibit 14. MDMA Pill Testing Results for Seattle, by Substance Detected and Year: 2000–2003<br />
Substance Detected 2000 2001 2002 2003 Total<br />
% of Total<br />
Drugs Detected<br />
% of Pills<br />
Tested<br />
MDMA 3 8 8 3 22 35% 52%<br />
Caffeine 5 5 10 16% 24%<br />
MDA 1 1 5 2 9 14% 21%<br />
Meth 1 3 4 8 13% 19%<br />
Pseudoephedrine 2 3 2 7 11% 17%<br />
PCP 2 2 3% 5%<br />
Foxy-methoxy 2 2 3% 5%<br />
MDE 1 1 2% 2%<br />
DXM 1 1 2% 2%<br />
Other 1 1 1 2% 2%<br />
Nothing 2 2 N.A. 5%<br />
Total Drugs 9 11 26 17 63 100%<br />
Total Pills Tested 6 10 18 8 42 100%<br />
Note: The data are based upon pills submitted for testing that were suspected of being adulterated. The data do not represent<br />
estimates or rates for the Seattle area.<br />
SOURCE: www.ecstasydata.org<br />
Proceedings of the Community Epidemiology Work Group, Vol. II, January 2005
<strong>EPIDEMIOLOGIC</strong> TRENDS IN <strong>DRUG</strong> <strong>ABUSE</strong>—Seattle-King County Area<br />
Exhibit 15. Persons Diagnosed with HIV Infection, Including Those With AIDS: 2001–June 2004<br />
King County Other WA Counties Washington State United States 3<br />
HIV including AIDS HIV including AIDS HIV including AIDS AIDS only<br />
Cumulative Diagnoses of HIV, including AIDS 1 8,934 4,761 13,695 886,575<br />
Cumulative HIV or AIDS Deaths 3,901 2,045 5,946 501,669<br />
Number currently living with HIV, including AIDS 5,033 2,716 7,749 384,906<br />
King County 2 Other WA Counties 2 Washington State 2 United States 3<br />
Case Demographics<br />
HIV including AIDS<br />
01/2001–12/2003<br />
HIV including AIDS<br />
01/2001–12/2003<br />
HIV including AIDS<br />
01/2000–12/2003<br />
AIDS only<br />
01/2000–12/2002<br />
Number Percent Number Percent Number Percent Number Percent<br />
Gender:<br />
Male 844 90% 403 77% 1,247 85% 92,057 73.88%<br />
Female<br />
Age:<br />
92 10% 122 23% 214 15% 32,546 26.12%<br />
12 and younger 1 0% 1 < 1% 2 0% ---<br />
13–19 7 1% 6 1% 13 1% ---<br />
20–29 199 21% 118 22% 317 22% ---<br />
30–39 429 46% 188 36% 617 42% ---<br />
40–49 228 24% 137 26% 365 25% ---<br />
50–59 59 6% 53 10% 112 8% ---<br />
60 and older<br />
Race/Ethnicity:<br />
13 1% 22 4% 35 2% ---<br />
White 585 63% 349 66% 934 64% 35,688 28.64%<br />
Black 185 20% 78 15% 263 18% 62,116 49.85%<br />
Hispanic 101 11% 57 11% 158 11% 24,694 19.82%<br />
Asian/Pacific Islander 32 3% 20 4% 52 4% 1,307 1.05%<br />
Native American 18 2% 18 3% 36 2% 579 0.46%<br />
Multi-Race 12 1% 0 0% 12 1% N/A<br />
Unknown<br />
Exposure Category:<br />
3 0% 3 1% 6 0% 219 0.18%<br />
Male-male sex 634 68% 244 46% 878 60% 49,316 39.58%<br />
Injecting drug user 54 6% 74 14% 128 9% 31,849 25.56%<br />
IDU & male-male sex 64 7% 29 6% 93 6% 5,914 4.75%<br />
Heterosexual contact 95 10% 105 20% 200 14% 35,239 28.28%<br />
Blood product exposure 3 0% 0 0% 3 0% 877 0.70%<br />
Mother at risk/has AIDS 0 0% 1 0% 1 0% 311 0.25%<br />
Undetermined/other 87 9% 72 14% 159 11% 1,097 0.88%<br />
Total HIV Cases diagnosed in last 3 years 936 100% 525 100% 1,461 100% 124,603 100.00%<br />
1 The HIV/AIDS data through 10/31/2004 show substantially fewer reported AIDS cases than in previous months. This is because<br />
Washington and King County completed a national AIDS case de-duplication project in October. AIDS cases have always been<br />
counted for the geographic area where they were first diagnosed with AIDS. If a PWA is reported as a new diagnosis in King<br />
County but is known to have moved from another State, we confirm with that State where the AIDS diagnosis FIRST occurred.<br />
However, if we are unaware of the prior residence, we have no routine way to confirm with another State and would count the case<br />
as King County. This is how duplicates are created in the national data set. During the past year, we have participated in a national<br />
project to identify duplicates. CDC (which does not have names) provided us with a list of potential matches to cases in other<br />
States. We then consulted with each State to determine which were duplicates, and which State should appropriately count the<br />
case. Nationally, about 5% of all cases were found to be duplicated in more than one State. We discovered that 405 Washington<br />
State Cases (225 in King County) were previously diagnosed while residing in other States. Therefore, we have removed those<br />
cases from our counts. All the data are accurate according to the revised tallies.<br />
2 These cases were diagnosed with HIV infection between July 2001 and June 2004, and reported to Public Health–Seattle & King<br />
County or the Washington Department of Health as of 11/30/2004.<br />
3 United States HIV data are not currently available in a format consistent with the Washington data. In addition, U.S. AIDS data do<br />
not include age distributions by year of diagnosis. The most current available national AIDS data are through December 2002.<br />
TECHNICAL NOTE: The U.S. data do not show specific incidence estimates for hemophilia or transfusion cases for 2000–2002;<br />
these numbers were interpolated from earlier incidence data.<br />
SOURCE: Public Health – Seattle & King County, the Washington State Department of Health, and the Federal Centers for Disease<br />
Control and Prevention<br />
Proceedings of the Community Epidemiology Work Group, Vol. II, January 2005 259
<strong>EPIDEMIOLOGIC</strong> TRENDS IN <strong>DRUG</strong> <strong>ABUSE</strong>—Texas<br />
Substance Abuse Trends in Texas, January 2005<br />
Jane Carlisle Maxwell, Ph.D. 1<br />
ABSTRACT<br />
Cocaine continues to be readily available, and the<br />
price for a kilogram has decreased. It is the primary<br />
illicit drug for which Texans enter treatment. It remains<br />
a problem on the border with Mexico, as<br />
documented in the school survey. Use of crack cocaine,<br />
which is at an endemic level, continues to<br />
move beyond Black users to White and Hispanic users.<br />
Alcohol is the primary drug of abuse in Texas in<br />
terms of dependence, deaths, and treatment admissions.<br />
Heroin addicts entering treatment are primarily<br />
injectors. In Texas, hydrocodone is a much larger<br />
problem than oxycodone or methadone. Codeine<br />
cough syrup, ‘Lean,’ continues to be abused. Treatment<br />
data show that marijuana clients admitted with<br />
criminal justice problems are less impaired than<br />
those who are not referred from the criminal justice<br />
system. ‘Ice,’ which is smoked methamphetamine, is<br />
a growing problem and the price has dropped dramatically.<br />
Xanax and Soma continue as widely<br />
abused pharmaceutical drugs. Club drug users differ<br />
in their sociodemographic characteristics, just as the<br />
properties of these drugs differ. Ecstasy use is moving<br />
out of the White club scene. Ketamine continues as a<br />
problem. GHB, GBL, and similar precursor drugs<br />
remain a problem, particularly in the Dallas/Fort<br />
Worth Metroplex area. Although indicators are<br />
down, Rohypnol remains a problem along the Texas-<br />
Mexico border. PCP indicators are continuing to rise<br />
and dextromethorphan is a problem with adolescents.<br />
Inhalants remain a problem with different types of<br />
users. The number of AIDS cases of females and<br />
persons of color is growing. The proportion of cases<br />
due to the heterosexual mode of transmission now<br />
exceeds the proportion of cases due to injecting drug<br />
use. Forty-one percent of persons testing positive for<br />
hepatitis C were exposed through injecting drug use.<br />
INTRODUCTI<strong>ON</strong><br />
Area Description<br />
The population of Texas in 2004 is 22,158,126, with<br />
51 percent White, 12 percent Black, 34 percent Hispanic,<br />
and 3 percent “Other.” Illicit drugs continue to<br />
enter from Mexico through cities such as El Paso,<br />
Laredo, McAllen, and Brownsville, as well as through<br />
260<br />
smaller towns along the border. The drugs then move<br />
northward for distribution through Dallas/Fort Worth<br />
and Houston. In addition, drugs move eastward from<br />
San Diego through Lubbock and from El Paso to<br />
Amarillo and Dallas/Fort Worth.<br />
A major problem is that Mexican pharmacies sell<br />
many controlled substances to U.S. citizens who then<br />
bring them into the States. Both private and express<br />
mail companies are used to traffic narcotics and<br />
smuggle money. Seaports are used to import heroin<br />
and cocaine via commercial cargo vessels. The international<br />
airports in Houston and Dallas/Fort Worth<br />
are major ports for the distribution of drugs into and<br />
out of the State.<br />
Data Sources<br />
Substance Abuse Trends in Texas is an ongoing series<br />
which is published every 6 months as a report<br />
for the Community Epidemiology Work Group<br />
meetings sponsored by the National Institute on<br />
Drug Abuse (NIDA). This report updates the June<br />
2004 report. Complete 2004 data will be published in<br />
the June 2005 report. To compare the January 2005<br />
report with earlier periods, please access<br />
http://www.utexas.edu/research/cswr/gcattc/drugtren<br />
ds.html.<br />
The information on each drug is discussed in the<br />
following order of sources:<br />
• Student substance use data came from the<br />
Texas School Survey of Substance Abuse:<br />
Grades 7-12, 2004 and the Texas School Survey<br />
of Substance Abuse: Grades 4-6, 2004, which<br />
are published by the Texas Department of State<br />
Health Services (TDSHS), formerly the Texas<br />
Commission on Alcohol and Drug Abuse.<br />
• Adult substance use data came from TDSHS’s<br />
2000 Texas Survey of Substance Use Among<br />
Adults.<br />
• Use by Texans ages 12 and older data came<br />
from the Substance Abuse and Mental Health<br />
Services Administration (SAMHSA) State Estimates<br />
of Substance Use from the 2002 National<br />
Survey on Drug Use and Health.<br />
1 The author is affiliated with The University of Texas at Austin, Center for Social Work Research, Austin, Texas.<br />
Proceedings of the Community Epidemiology Work Group, Vol. II, January 2005
• Poison Control Center data came from the<br />
Texas Poison Center Network, TDSHS, for 1998<br />
through June 2004. Analysis was provided by<br />
Mathias Forrester, epidemiologist with the Texas<br />
Poison Center Network, and by the author. In<br />
addition, findings from three papers authored by<br />
Forester, “Carisoprodol Abuse in Texas, 1998-<br />
2003,” “Flunitrazepam Abuse and Malicious Use<br />
in Texas, 1998-2003,” and “Oxycodone Abuse in<br />
Texas, 1998-2003,” were used in this report.<br />
• Treatment data were provided by TDSHS’s client<br />
data system provided information on clients at<br />
admission to treatment in TDSHS-funded facilities<br />
from the first quarter of 1983 through June 30,<br />
2004. For most drugs, the characteristics of clients<br />
entering with a primary problem with the drug are<br />
discussed, but in the case of emerging club drugs,<br />
information is provided on any client with a primary,<br />
secondary, or tertiary problem with that<br />
drug. Analysis was by the author.<br />
• Overdose death data on statewide on drug<br />
overdose deaths came from death certificates<br />
from the Bureau of Vital Statistics, TDSHS;<br />
analysis was by the author. Findings are also<br />
presented from Maxwell, J. C.; Pullum, T.W.;<br />
and Tannert, K. “Deaths of Clients in Methadone<br />
Treatment in Texas: 1994-2002,” Drug and Alcohol<br />
Dependence, 78(1); 73-82, 2005.<br />
• Drug and alcohol arrests data come from the<br />
Uniform Crime Reports of the Texas Department<br />
of Public Safety (DPS).<br />
• Information on drugs identified by laboratory<br />
tests are from the Texas Department of Public<br />
Safety, which submitted results from toxicological<br />
analyses of substances submitted in law enforcement<br />
operations for 1998 through June 30,<br />
2004, to the National Forensic Laboratory Information<br />
System (NFLIS) of the Drug Enforcement<br />
Administration (DEA). Analysis was<br />
by the author.<br />
• Price, purity, trafficking, distribution, and<br />
supply information was provided by fourth quarter<br />
2004 reports on trends in trafficking from the<br />
Dallas, El Paso, and Houston Field Divisions of<br />
the DEA.<br />
• Reports by users and street outreach workers<br />
drug trends for September through November<br />
2004 were reported to TDSHS by street outreach<br />
workers.<br />
<strong>EPIDEMIOLOGIC</strong> TRENDS IN <strong>DRUG</strong> <strong>ABUSE</strong>—Texas<br />
• Acquired immunodeficiency syndrome (AIDS)<br />
data were provided by TDSHS for annual and<br />
year-to-date periods through June 2004.<br />
• Hepatitis C (HCV) data were provided by<br />
TDSHS on HCV counseling and testing for the<br />
period January 2003 to December 31, 2003.<br />
<strong>DRUG</strong> <strong>ABUSE</strong> TRENDS<br />
Cocaine/Crack<br />
The Texas School Survey of Substance Abuse:<br />
Grades 7-12, 2004 reported that lifetime use of powder<br />
and crack cocaine had dropped from a high of<br />
9.3 percent in 1998 to 7.9 percent in 2004, while<br />
past-month use dropped from 3.5 percent in 1998 to<br />
3.2 percent in 2004. Some 7.0 percent of students in<br />
nonborder counties had ever used powder or crack<br />
cocaine, and 2.5 had used it in the past month. In<br />
comparison, students in schools on the Texas border<br />
reported higher levels of cocaine use: 13.3 percent<br />
lifetime and 5.8 percent past-month use (exhibit 1).<br />
The 2000 Texas Survey of Substance Use Among<br />
Adults reported 11.8 percent of Texas adults had ever<br />
used powder cocaine. Some 1.9 percent had used it<br />
in the past year. In 2002, the National Survey on<br />
Drug Use and Health estimated that 2.4 percent of<br />
Texans ages 12 and older had used cocaine in the<br />
past year. Estimates by age group were 2.6 percent<br />
of those age 12–17, 6.7 percent of those 18–25, and<br />
1.5 percent of those 26 and older.<br />
Texas Poison Control Center calls involving the use<br />
of cocaine increased from 503 in 1998 to a high of<br />
1,194 in 2002 before dropping to 979 in 2003. This<br />
trend is changing in 2004, where in the first half of<br />
the year, 720 cases had already been reported.<br />
Cocaine (crack and powder) represented 26 percent<br />
of all admissions to TDSHS-funded treatment programs<br />
in the first half of 2004. With 18 percent of all<br />
admissions, crack cocaine is the primary illicit drug<br />
abused by clients admitted to publicly funded treatment<br />
programs in Texas (exhibit 29).<br />
Abusers of powder cocaine were 8 percent of all<br />
admissions to treatment. Cocaine inhalers were the<br />
youngest and most likely to be Hispanic and involved<br />
in the criminal justice or legal systems. Cocaine<br />
injectors were older than inhalers but younger<br />
than crack smokers and were most likely to be White<br />
(exhibit 2).<br />
Proceedings of the Community Epidemiology Work Group, Vol. II, January 2005 261
The term “lag” refers to the period from first consistent<br />
or regular use of a drug to the date of admission<br />
to treatment. Powder cocaine inhalers average 10<br />
years between first regular use and entrance to treatment,<br />
while injectors average 14 years of use before<br />
they enter treatment.<br />
Between 1987 and 2004, the percentage of Hispanic<br />
treatment admissions using powder cocaine has increased<br />
from 23 percent to 47 percent, while for<br />
Whites and Blacks, the percent has dropped (from 48<br />
percent to 38 percent, and from 28 percent to 12 percent,<br />
respectively). Exhibit 3 shows these changes by<br />
route of administration. It also shows the proportion<br />
of Black crack cocaine admissions fell from 75 percent<br />
in 1993 to 50 percent in 2004, while the proportion<br />
of Whites increased from 20 percent in 1993 to<br />
33 percent in 2004. Hispanic admissions rose from 5<br />
percent to 15 percent in the same time period.<br />
The number of deaths statewide in which cocaine<br />
was mentioned has increased over the years, from<br />
223 in 1992 to 541 in 2002, but decreased to 477<br />
deaths in 2003 (exhibit 4). The average age of the<br />
decedents was 39.3 years in 2003, and 43 percent<br />
were White, 25 percent were Hispanic, and 31 percent<br />
were Black. Eighty percent were male.<br />
Exhibit 5 shows the proportion of substances identified<br />
as cocaine by the DPS labs is decreasing. In<br />
1998, cocaine accounted for 40 percent of all items<br />
examined, as compared to 30 percent in the first half<br />
of 2004.<br />
In the fourth quarter of 2004, powder cocaine was<br />
reported by the Dallas DEA Field Division as being<br />
available in ounce to gram quantities. It is readily<br />
available in Lubbock and in small towns and rural<br />
communities in north Texas. Crack cocaine is also<br />
readily available, and while concentrated in urban<br />
areas, it is also available in small towns and rural<br />
areas. In Dallas, it is particularly popular in the predominantly<br />
Black and Hispanic neighborhoods and it<br />
is the most visible drug trafficked in Tyler. In Midland,<br />
an area referred to as “The Flats” is known as<br />
an area with street corner and crack house dealers.<br />
Cocaine availability has remained constant in the<br />
Houston Field Division, except availability is up in<br />
Houston and there has been a large increase in cocaine<br />
seizures in the Laredo area. Crack cocaine is<br />
also readily available in the division, with availability<br />
increasing in the rural areas around Austin. Use<br />
of crack in the Laredo district remains minimal.<br />
In addition to continuing to be readily available, the<br />
price for a kilogram has dropped from $11,000–<br />
$22,500 in the first half of 2004 to $10,000–$22,500<br />
262<br />
<strong>EPIDEMIOLOGIC</strong> TRENDS IN <strong>DRUG</strong> <strong>ABUSE</strong>—Texas<br />
in the last half of 2004 (exhibit 6). A gram of powder<br />
cocaine costs $50–$80 in Dallas, $50–$60 in El<br />
Paso, and $100 in Amarillo and Lubbock. Cocaine is<br />
less expensive at the border. An ounce costs $400–<br />
$500 in Laredo, $700–$900 in Midland, $500–$600<br />
in El Paso, $400–$650 in Houston, $650–$950 in<br />
Dallas, $600 in Alpine, $400–$600 in McAllen,<br />
$500–$700 in San Antonio, $500–$600 in Austin,<br />
$500–$900 in Waco, $650–$850 in Amarillo, $500–<br />
$850 in Lubbock, $300–$750 in Tyler, and $600–<br />
$750 in Fort Worth.<br />
Across the State, a rock of crack costs $10–$50, with<br />
$10–$20 being the most common price. An ounce of<br />
crack cocaine costs $325–$450 in Houston, $500 in<br />
Galveston, $500–$600 in Austin, $500–$700 in<br />
Waco, $700–$1,100 in Dallas, $450–$550 in Tyler,<br />
$500–$800 in Beaumont, $450–$850 in Amarillo<br />
and Lubbock, $400–$600 in San Antonio, $830 in El<br />
Paso, $700–$900 in Midland, $500 in McAllen, and<br />
$650–$750 in Fort Worth.<br />
In Austin, street outreach workers report crack continues<br />
to be abundant and is sold in quantities of<br />
three rocks for $30 as a “Friday Night Special.” A<br />
“Big Slug,” which sells for $20, is a larger piece of<br />
crack which is considered to be a “higher” grade of<br />
cocaine and is reported to make users’ ears “ring”<br />
when smoking it. Crack smokers are now using hollowed-out<br />
tire gauges to smoke crack, since these do<br />
not break like glass pipes. Rubber covers from spark<br />
plug wires are used to prevent burned lips (to decrease<br />
the risk of human immunodeficiency virus<br />
[HIV] infection). The larger rubber tips are used on<br />
the tire gauges, while the small tips are used on glass<br />
pipes and radio antennae.<br />
In the Galveston-Brazoria area, crack cocaine continues<br />
to be the most visible drug on the street. Prostitution<br />
continues to be a primary source of income<br />
for drug purchasing, and younger women are now on<br />
the street.<br />
Alcohol<br />
Alcohol is the primary drug of abuse in Texas. The<br />
1998 secondary school survey found that 72 percent<br />
of students had ever drunk alcohol and 38 percent<br />
had drunk alcohol in the last month. In 2004, 68 percent<br />
had ever used alcohol and 33 percent had drunk<br />
alcohol in the last month: an important drop in alcohol<br />
use.<br />
Of particular concern is heavy consumption of alcohol,<br />
or binge drinking, defined as drinking five or more<br />
drinks at one time. In 2004, 15 percent of all secondary<br />
students said that when they drank, they usually drank<br />
Proceedings of the Community Epidemiology Work Group, Vol. II, January 2005
five or more beers at one time, and 13 percent reported<br />
binge drinking of liquor. Binge drinking increased<br />
with grade level. Among seniors, 27 percent binged on<br />
beer and 21 percent on liquor. The percentage of students<br />
who normally drank five or more beers has decreased<br />
since 1988. While the percentage of binge<br />
drinking of wine or wine coolers has fallen from its<br />
peak in 1994, it is still higher than in 1988 (exhibit 7).<br />
The percentage of binge drinking of hard liquor has<br />
remained relatively stable since 1994.<br />
Among students in grades 4–6 in 2004, 26 percent<br />
had ever drunk alcohol and 16 percent had drunk<br />
alcohol in the past school year.<br />
The 2000 Texas adult survey found that 50.3 percent<br />
of Texas adults reported drinking alcohol in the past<br />
month. Some 17 percent reported binge drinking, 6<br />
percent reported heavy drinking in the past month,<br />
and 5.1 percent of all adults met the criteria for being<br />
dependent on alcohol. This estimate was based on<br />
the Diagnostic and Statistical Manual of Mental Disorders,<br />
III-R (DSM III-R).<br />
The 2002 National Survey on Drug Use and Health<br />
estimated that 47.9 percent of Texans ages 12 and<br />
over had drunk alcohol in the past month (17.6 percent<br />
of those age 12–17, 59.3 percent of those 18–25,<br />
and 50.5 percent of those 26 and older). Some 23.5<br />
percent had drunk five or more drinks on at least 1<br />
day (binge drinking) in the past month (10 percent of<br />
those 12–17, 41.3 percent of those 18–24, and 22.2<br />
percent of those ages 26 and older). Some 7.9 percent<br />
met the criteria for alcohol dependence based on<br />
the Diagnostic and Statistical Manual of Mental Disorders-IV<br />
(DSM-IV). The level of alcohol dependence<br />
was estimated at 5.4 percent of those 12–17,<br />
17.3 percent for those 18–25, and 6.4 percent of<br />
those 26 and older.<br />
In 2004, 28 percent of all clients admitted to publicly<br />
funded treatment programs had a primary problem<br />
with alcohol (exhibit 29). They were the oldest of the<br />
clients (average age of 38), and 68 percent were<br />
male. Some 58 percent were White, 24 percent were<br />
Hispanic, and 15 percent were Black.<br />
More Texans are arrested for public intoxication (PI)<br />
than for any other substance abuse offense, although<br />
the arrest rate for PI per 100,000 population is decreasing.<br />
The rates for the other substance abuse<br />
offenses are fairly level (exhibit 8).<br />
Heroin<br />
The proportion of Texas secondary students reporting<br />
lifetime use of heroin dropped from 2.4 percent<br />
<strong>EPIDEMIOLOGIC</strong> TRENDS IN <strong>DRUG</strong> <strong>ABUSE</strong>—Texas<br />
in 1998 to 1.6 percent in 2004. Past-month use<br />
dropped from 0.7 percent in 1998 to 0.5 percent in<br />
2004.<br />
The 2000 Texas adult survey found that 1.2 percent<br />
of adults reported lifetime use of heroin and 0.1 percent<br />
reported past-month use.<br />
Calls to Texas Poison Control Centers involving<br />
confirmed exposures to heroin ranged from 181 in<br />
1998 to a high of 296 in 2000 and dropped to 208 in<br />
2003 and 79 in the first half of 2004. In 2004, the<br />
average age was 33, and 59 percent were male. Thirteen<br />
percent of heroin exposures involved inhalation<br />
(snorting or smoking).<br />
Heroin is the primary drug of abuse for 10 percent of<br />
clients admitted to treatment. The characteristics of<br />
these addicts vary by route of administration, as exhibit<br />
9 illustrates. Most heroin addicts entering treatment<br />
inject heroin. While the number of individuals<br />
who inhale heroin is small, it is important to note<br />
that the lag period from first use and seeking treatment<br />
is 8 years rather than 16 years for injectors.<br />
This shorter lag period means that contrary to street<br />
rumors that “sniffing or inhaling is not addictive,”<br />
inhalers can become addicted. They will either enter<br />
treatment sooner while still inhaling or they will shift<br />
to injecting, increase their risk of hepatitis C and<br />
HIV infection, become more impaired, and enter<br />
treatment later.<br />
Exhibit 10 shows that the proportion of clients who<br />
are Hispanic has increased since 1996, but there has<br />
been little change since 2002.<br />
Data report that there were 278 deaths statewide with<br />
a mention of heroin or narcotics in 2003 (exhibit 11).<br />
Some 56 percent were White, 33 percent were Hispanic,<br />
and 9 percent were Black; 72 percent were<br />
male. The average age was 39 years.<br />
Exhibit 5 shows that the proportion of items identified<br />
as heroin by DPS labs has remained constant at<br />
1–2 percent over the years.<br />
The predominant form of heroin in Texas is black<br />
tar, which has a dark gummy, oily texture that can be<br />
diluted with water and injected. Exhibit 12 shows the<br />
decline in price over the years. Depending on the<br />
location, black tar heroin sells on the street for $10–<br />
$20 per capsule, $100–$350 per gram, $800–$4,500<br />
per ounce, and $35,000–$50,000 per kilogram. An<br />
ounce costs $800–$2,000 in Dallas, $1,200–$1,700<br />
in Fort Worth, $1,000–$1,500 in El Paso, $2,100–<br />
$2,200 in Alpine, $3,500–$4,000 in Midland, and<br />
$3,500–$4,500 in Lubbock. In Houston, an ounce<br />
Proceedings of the Community Epidemiology Work Group, Vol. II, January 2005 263
costs $1,200–$1,500, compared with $1,300 in<br />
Laredo, $400–$1,500 in McAllen, $1,400–$1,600 in<br />
Austin, and $1,600–$2,800 in San Antonio.<br />
Mexican brown heroin, which is black tar that has<br />
been cut with lactose or another substance and then<br />
turned into a powder to inject or snort, costs $10 per<br />
cap and $50–$350 per gram. An ounce costs $500–<br />
$600 in San Antonio, $1,100 in McAllen, $800–<br />
$1,600 in Dallas, and $2,200–$3,000 in Lubbock.<br />
Colombian heroin sells for $10 per cap, $2,000 per<br />
ounce, and $70,000 per kilogram in Dallas. Asian<br />
heroin costs $200–$350 per gram, $2,000–$4,000<br />
per ounce, and $70,000 per kilogram in Dallas.<br />
The DEA Houston Field Division reports the supply<br />
of brown and black tar heroin is stable, with an increase<br />
in activity in Austin. White heroin is available<br />
in isolated instances in the large metropolitan areas.<br />
In the Dallas area, black tar is readily available and<br />
Colombian is available in multikilogram quantities.<br />
Sources report white and beige-colored heroin are<br />
now being produced in Mexico using Colombian<br />
production methods.<br />
Street outreach workers in Austin report that supplies<br />
are so plentiful that the price of a balloon of heroin<br />
has dropped from $20 to $15 and quality is “strong.”<br />
Other Opiates<br />
This group excludes heroin but includes opiates such<br />
as methadone, codeine, hydrocodone (Vicodin, Tussionex),<br />
oxycodone (OxyContin, Percodan, Percocet-<br />
5, Tylox), d-propoxyphene (Darvon), hydromorphone<br />
(Dilaudid), morphine, meperidine (Demerol),<br />
and opium.<br />
The 2004 Texas secondary school survey found that<br />
8.3 percent reported ever having drunk codeine<br />
cough syrup to get high. Some 8.7 percent of Black<br />
and White students reported lifetime use, as did 8.5<br />
percent of Native American students and 5 percent of<br />
Hispanic students. There was no difference by gender,<br />
but lifetime use increased from 2.7 percent of<br />
seventh graders to 10.5 percent of twelfth graders.<br />
The 2000 Texas adult survey found that lifetime use<br />
of other opiates was 4.4 percent, and past-month use<br />
was 0.5 percent in 2000. In comparison, use was<br />
lower in 1996, with lifetime use at 3 percent and<br />
past-month use at 0.2 percent. Some 2.3 percent of<br />
Texas adults in 2000 reported ever having used codeine,<br />
and 0.7 percent used in the past year. Lifetime<br />
use of hydrocodone was 0.7 percent, and past-year<br />
use was 0.4 percent.<br />
264<br />
<strong>EPIDEMIOLOGIC</strong> TRENDS IN <strong>DRUG</strong> <strong>ABUSE</strong>—Texas<br />
Hydrocodone is a larger problem in Texas than is<br />
oxycodone, but use of oxycodone is growing faster,<br />
as exhibit 13 shows. A study of oxycodone cases<br />
reported through the Texas Poison Center Network<br />
found that the proportion of calls that involved abuse<br />
of the drug more than doubled from 1998 to 2003.<br />
Oxycodone abuse involved males, adolescents, exposures<br />
at other residences and public areas, referral by<br />
the poison center to a health care facility, and some<br />
sort of clinical effect; one-half involved no other substance<br />
(Forrester, 2004).<br />
Cases involving methadone are increasing. Methadone<br />
is not only used in liquid and 50-milligram<br />
diskette forms in narcotic treatment programs, but 5-<br />
and 10-milligram pills are used for pain management.<br />
The poison control center, death certificates, and forensic<br />
laboratory data usually do not report the form<br />
of methadone being abused. The form of the drug<br />
could be an overdose by new patients in narcotic<br />
treatment programs, liquid methadone which has<br />
been diverted from treatment, pain pills diverted from<br />
patients, or overdoses by pain patients who took too<br />
many of the pills or took other drugs in combination<br />
with the methadone pills. The number of poison control<br />
center cases involving misuse or abuse of methadone<br />
increased from 17 in 1998 to 53 in 2002 and<br />
dropped to 41 in 2003, with 39 cases in the first half<br />
of 2004.<br />
Some 5.5 percent of all clients who entered publicly<br />
funded treatment during the first half of 2004 used<br />
opiates other than heroin. Of these, 29 used illegal<br />
methadone and 1,344 used other opiates (exhibit 29).<br />
Those who reported a primary problem with illicit<br />
methadone or other opiates were different from those<br />
who reported a problem with heroin. They were<br />
much more likely to be female, to be White, to have<br />
recently visited an emergency room and to report<br />
more sickness and health problems in the month<br />
prior to entering treatment.<br />
Of the hydrocodone deaths, 49 percent were male, 90<br />
percent were White, and average age was 41.5 years.<br />
Of the oxycodone deaths, 67 percent were male, 88<br />
percent were White, and average age was 3.3<br />
years—younger than the hydrocodone decedents. Of<br />
the methadone deaths, 66 percent were male, 84 percent<br />
were White, and average age was 35. There<br />
were 10 deaths with a mention of fentanyl in 2003.<br />
Narcotic treatment programs are required to report<br />
deaths of their clients. Between 1994 and 2002, 776<br />
deaths were reported. Twenty percent died of liver<br />
disease, 18 percent of cardiovascular disease, and 14<br />
percent of drug overdose. Compared to the standardized<br />
Texas population, narcotic treatment patients<br />
Proceedings of the Community Epidemiology Work Group, Vol. II, January 2005
were 4.6 times more likely to die of a drug overdose,<br />
3.4 times more likely to die of liver disease, 1.7<br />
times more likely to die of a respiratory disease, 1.5<br />
times more likely to die of a homicide, and 1.4 times<br />
more likely to die of AIDS (Maxwell et al., 2005).<br />
In the Dallas DEA Field Division, there has been an<br />
increase in seizures of codeine cough syrup and in<br />
Tyler, OxyContin has surpassed hydrocodone as the<br />
drug of choice among abusers of pharmaceuticals.<br />
Dilaudid sells for $20–$80 per tablet, and hydrocodone<br />
(Vicodin) sells for $2–$10 per tablet. Oxy-<br />
Contin sells for $1 per milligram. Methadone sells for<br />
$10 per 10-milligram tablet, and promethazine syrup<br />
with codeine sells for $200–$325 per pint in Dallas<br />
and Fort Worth and $20 per ounce. In the Houston<br />
Field Division, hydrocodone, promethazine with codeine,<br />
and other codeine cough syrups are the most<br />
commonly abused pharmaceutical drugs. In Houston,<br />
promethazine or phenergan cough syrup with codeine<br />
sells for $75–$100 for 4 ounces, $125 for 8 ounces,<br />
and $1,600 for a gallon. In San Antonio, hydrocodone<br />
sells for $1–$3 per pill and OxyContin costs<br />
$1 per milligram; one OxyContin pill costs $25 in<br />
McAllen. Dilaudid sells for $10–$15 per dose in<br />
McAllen.<br />
DPS labs report increases in the number of exhibits<br />
of hydrocodone, oxycodone, and methadone each<br />
year from 1998 through the first half of 2004 (exhibit<br />
13). There were two fentanyl exhibits in 2003 and<br />
six in the first half of 2004.<br />
Outreach workers in Houston report increases in the<br />
sale and use of OxyContin in areas where injecting<br />
drug users gather.<br />
Marijuana<br />
The proportion of Texas students in grades 4–6 who<br />
have ever used marijuana dropped from 2.8 percent<br />
in 2000 to 2.5 percent in 2004, and use in the past<br />
school year dropped from 2.1 percent to 1.7 percent.<br />
Among Texas secondary students (grades 7–12), 30<br />
percent have ever tried marijuana and 13 percent had<br />
used in the past month, levels lower than in 2000.<br />
Use by students in seventh and eighth grades continued<br />
to drop, while use by students in grade 12 remained<br />
stable (exhibit 14).<br />
In comparison, the 2000 Texas adult survey found<br />
that 37 percent of adults reported lifetime and 4 percent<br />
past-month marijuana use, as compared to 34<br />
percent lifetime and 3 percent past-month use in<br />
1996. The prevalence was much higher among<br />
younger adults. Thirteen percent of those aged 18–24<br />
reported past-month use, as compared to 6 percent of<br />
<strong>EPIDEMIOLOGIC</strong> TRENDS IN <strong>DRUG</strong> <strong>ABUSE</strong>—Texas<br />
those aged 25–34 and 2 percent of those aged 35 and<br />
older. The increase in past-year use between 1996<br />
and 2000 (6 percent to 7 percent) is statistically significant.<br />
The 2002 National Survey on Drug Use and Health<br />
estimated that 4.9 percent of Texans ages 12 and<br />
older had used marijuana in the past month, with 5.9<br />
percent of those ages 12–17, 13.2 percent of those<br />
ages 18–25, and 3.1 percent of those ages 26 and<br />
older reporting past-month use.<br />
The Texas Poison Control Centers reported there<br />
were 135 calls confirming exposure to marijuana in<br />
1998, as compared to 406 in 2003. There have been<br />
240 in the first half of 2004.<br />
Marijuana was the primary problem for 19 percent of<br />
admissions to treatment programs in the first half of<br />
2004 (exhibit 29). The average age was 22. Some 43<br />
percent were Hispanic, 32 percent were White, and<br />
22 percent were Black. Seventy-six percent had legal<br />
problems or had been referred from the criminal justice<br />
system, and these clients were less frequent users<br />
of marijuana than those who came to treatment<br />
for other reasons. The criminal justice-referred clients<br />
reported using marijuana on 7 days in the month<br />
prior to admission, as compared to 12 days for the<br />
non-criminal justice referrals. The same differences<br />
were reported for number of days in the past month<br />
that the second problem drug was used (3.2 days vs.<br />
5.9 days) and the number of days a third problem<br />
drug was used (2.6 days vs. 5.2 days).<br />
The Addiction Severity Index scores were lower for<br />
justice referrals: 33 percent of the criminal justice<br />
referrals reported employment problems vs. 45 percent<br />
non-criminal justice referred clients; for sickness<br />
or health problems, 14 percent vs. 19 percent;<br />
for family problems, 27 percent vs. 45 percent; for<br />
social problems with peers, 22 percent vs. 33 percent;<br />
for emotional problems, 19 percent vs. 36 percent;<br />
and for substance abuse problems, 40 percent<br />
vs. 58 percent. These differences, all of which were<br />
significant at p
ties. In the DFW area, Mexican marijuana is readily<br />
available, but there are continuing seizures of domestically<br />
grown marijuana (both indoor and outdoor<br />
grows). Mexican “sinsemilla” is also plentiful. Marijuana<br />
is reported as more available in the El Paso<br />
Division.<br />
High quality sinsemilla sells for $900–$1,200 a<br />
pound in the Dallas/Fort Worth area, $800 per pound<br />
in Lubbock, and $600 per pound in Houston. Canadian<br />
BC Bud sells for $3,300 and hydroponic sells<br />
for $3,500 in Houston, as compared to $3,000 in<br />
Austin and $4,600 in McAllen. The average price for<br />
a pound of commercial grade marijuana is $140–<br />
$160 in Laredo, $125–$425 in McAllen, $350–$450<br />
in San Antonio, $350–$375 in Austin, $280–$350 in<br />
Houston, $500 in El Paso, $500–$700 in Alpine,<br />
$300–$400 in Midland, $350–$600 in the Dallas/Fort<br />
Worth areas, $500–$600 in Lubbock, and<br />
$340–$500 in Tyler. Locally grown indoor marijuana<br />
sells for $3,800 per pound in Dallas. Exhibit<br />
15 shows the decline in prices since 1992.<br />
Stimulants<br />
Amphetamine-type substances come in different<br />
forms and with different names. “Speed” (“meth,”<br />
“crank,”) is a powdered methamphetamine of relatively<br />
low purity and sold in grams or ounces. It can<br />
be snorted or injected. “Pills” can be pharmaceutical<br />
grade stimulants such as dextroamphetamine, Dexedrine,<br />
Adderall, or Ritalin (methylphenidate), or they<br />
can be methamphetamine powder that has been<br />
pressed into tablets and sold as amphetamines or ecstasy.<br />
Pills can be taken orally, crushed for inhalation,<br />
or dissolved in water for injection. There is also<br />
a damp, sticky powder of higher purity than Speed<br />
that is known as “Base” in Australia and “Peanut<br />
Butter” in parts of the United States. “Ice,” also<br />
known as “Crystal” or “Tina,” is methamphetamine<br />
that has been “washed” in a solvent to remove impurities;<br />
it has longer-lasting physical effects and purity<br />
levels above 80 percent. Ice can be smoked in a glass<br />
pipe, “chased” on aluminum foil, mixed with marijuana<br />
and smoked through a bong, or injected.<br />
The 2004 secondary school survey reported that lifetime<br />
use of uppers was 8.1 percent in 1998 and 6.0<br />
percent in 2004. Past-month use was 3.1 percent in<br />
1998 and 2.5 percent in 2002.<br />
Among Texas adults, 12 percent reported lifetime<br />
use of uppers and 1 percent reported past-month use<br />
in 2000. In comparison, lifetime use was 10 percent<br />
and past-month use was 1 percent in 1996. The difference<br />
in past-year use from 1996 to 2000 (1.1 percent<br />
to 1.9 percent) was statistically significant.<br />
266<br />
<strong>EPIDEMIOLOGIC</strong> TRENDS IN <strong>DRUG</strong> <strong>ABUSE</strong>—Texas<br />
There were 144 calls to Texas poison control centers<br />
involving exposure to methamphetamines in 1998,<br />
183 in 1999, 264 in 2000, 321 in 2001, 382 in 2002,<br />
389 in 2003 and 109 in the first half of 2004. Of<br />
these 2004 calls, there were 38 mentions of “Ice” or<br />
“Crystal.” There were also 100 calls involving abuse<br />
or misuse of amphetamine pills, phentermine, or<br />
Adderall, and another 13 calls involving abuse or<br />
misuse of Ritalin.<br />
Methamphetamine/amphetamine admissions to treatment<br />
programs have increased from 5 percent of all<br />
admissions in 2000 to 10 percent in 2004, and the<br />
average age of clients admitted for a primary problem<br />
with stimulants is increasing. In 1985, the average age<br />
was 26; in 2004, it was 30. The proportion of White<br />
clients has risen from 80 percent in 1985 to 90 percent<br />
in 2004, while the proportion of Hispanics has<br />
dropped from 11 percent to 7 percent and the proportion<br />
of Blacks has dropped from 9 percent to 1 percent.<br />
Unlike the other drug categories, more than onehalf<br />
of these clients entering treatment are women (54<br />
percent) (exhibit 29). The proportion smoking Ice has<br />
also increased from less than 1 percent in 1988 to 35<br />
percent in 2004. The percent of clients injecting<br />
methamphetamine has dropped from 84 percent in<br />
1988 to 50 percent in 2004 (exhibit 16).<br />
In addition, users of amphetamines or methamphetamines<br />
tend to differ depending on their route of<br />
administration, as exhibit 17 shows. Those who took<br />
the substance orally tended to be users of pills.<br />
Methamphetamine injectors were more likely to have<br />
been in treatment before (58 percent readmissions)<br />
as compared to amphetamine pill takers (50 percent),<br />
Ice smokers (40 percent), or inhalers (34 percent).<br />
There were 17 deaths where amphetamines or<br />
methamphetamines were mentioned in 1997, 20 in<br />
1998, 21 in 1999, 39 in 2000, 51 in 2001, 69 in 2002,<br />
and 80 in 2003. Of the decedents in 2003, 70 percent<br />
were male, 84 percent were White, and average age<br />
was 35.<br />
To make methamphetamine, local labs are using the<br />
“Nazi method,” which includes ephedrine or pseudoephedrine,<br />
lithium, and anhydrous ammonia, and<br />
the “cold method,” which uses ephedrine, red phosphorus,<br />
and iodine crystals. The “Nazi method” is<br />
the most common method used in North Texas. Before<br />
these methods became common, most illicit labs<br />
used the “P2P method,” which is based on 1-phenyl-<br />
2-propanone. The most commonly diverted chemicals<br />
are 60-milligram pseudoephedrine tablets such<br />
as Xtreme Relief, Mini-Thins, Zolzina, Two-Way,<br />
and Ephedrine Release.<br />
Proceedings of the Community Epidemiology Work Group, Vol. II, January 2005
Methamphetamine and amphetamine together represented<br />
16 percent of all items examined by DPS<br />
laboratories in 2000, but the percentage had increased<br />
to 24 percent in the first half of 2004 (exhibit<br />
5). Twenty-three percent of the exhibits were<br />
methamphetamine and less than 1 percent were amphetamine.<br />
Methamphetamine is more of a problem in the northern<br />
half of the State, as exhibit 18 shows. In Abilene,<br />
58 percent of all of the drug items examined by the<br />
DPS laboratory were methamphetamine, while in<br />
McAllen and Laredo, only 1 percent were. Labs in<br />
the northern part of the State were also more likely to<br />
report analyzing substances that turned out to be<br />
ammonia or pseudoephedrine, chemicals used in the<br />
manufacture of methamphetamine. Methamphetamine<br />
is also more of a problem in the western United<br />
States than in the Midwest or east: 31 percent of all<br />
treatment admissions in California are for methamphetamine<br />
or amphetamine, as compared to 10 percent<br />
in Texas.<br />
According to the El Paso Field Division, methamphetamine<br />
is primarily trafficked by Mexican organizations<br />
operating in Arizona and Southern California.<br />
The Houston Field Division reports that the<br />
availability of both Mexican and locally produced<br />
methamphetamine is increasing. Ice is more expensive<br />
than powdered methamphetamine; it is trafficked<br />
by White and Asian males. Most of the<br />
methamphetamine in the Division is produced in<br />
Mexico, although domestically produced methamphetamine<br />
is made by motorcycle gangs and small<br />
home producers. There are also numerous laboratories<br />
operating in East Texas and in the Corpus<br />
Christi, Austin, and Waco areas.<br />
The Dallas Field Division reports that the availability<br />
of methamphetamine, especially Ice, is steady or<br />
rising at the retail level and has emerged as the primary<br />
problem in the Lubbock/Amarillo area. Mexican<br />
methamphetamine dominates this market and it<br />
is available for purchase in multipound quantities.<br />
Ice is produced in Michochan, Monterrey, and<br />
Nuevo Leon for distribution in Dallas. Methamphetamine<br />
is primarily distributed by Mexican nationals,<br />
but Asian gangs are also involved.<br />
The purity for 1–10 grams has risen from 46 percent<br />
pure in the Dallas area in 2000 to 65 percent pure in<br />
2004, according to NFLIS data. At the same time,<br />
the number of labs seized has risen from 1,707 to<br />
3,908, yet prices are dropping. The price for a pound<br />
of methamphetamine was $8,000 in Houston 6<br />
months ago; now it is $7,000, and in Laredo it has<br />
dropped from $4,500–$5,500 to $2,500. It sells for<br />
<strong>EPIDEMIOLOGIC</strong> TRENDS IN <strong>DRUG</strong> <strong>ABUSE</strong>—Texas<br />
$6,000–$8,000 in San Antonio, $8,000 in Midland,<br />
$4,000–$9,000 in Dallas, $5,000–$10,000 in Fort<br />
Worth, and $8,000–$9,000 in Lubbock. An ounce of<br />
domestic methamphetamine sells for $600–$800 in<br />
Dallas (it was $700–$1,000 6 months ago), while an<br />
ounce of Mexican sells for $400. An ounce of<br />
methamphetamine sells for $600 in Fort Worth,<br />
$600–$1,200 in Tyler, $400–$1,200 in Lubbock,<br />
$960 in El Paso, $600 in Alpine, $700 in Midland,<br />
$500–$850 in Houston, $700–$1,000 in San Antonio,<br />
and $900–$1,250 in Waco. The price of Ice has<br />
dropped even more, from $13,000–$17,000 down to<br />
$8,000–$12,000 in Houston. It now costs $8,500–<br />
$16,000 in Dallas, $9,000–$10,000 in Fort Worth,<br />
and $10,000–$18,000 in Tyler. An ounce of Ice sells<br />
for $1,000–$2,000 in Dallas, $800–$1,000 in Fort<br />
Worth, $1,400 in Tyler, $700–$1,200 in Houston,<br />
and $1,000–$1,500 in San Antonio.<br />
Street outreach workers in Amarillo report increases<br />
in the use of methamphetamine. Users are shifting to<br />
smoking to reduce their risk of HIV from injecting,<br />
but as their decision-making processes deteriorate<br />
with the effects of smoking Ice, they are at risk from<br />
unprotected sex. Use of “Crystal” by young men<br />
having sex with men is increasing in Corpus Christi<br />
and surrounding counties. In Austin, it has been reported<br />
that good quality methamphetamine is on the<br />
streets and more laboratories are being established.<br />
Users are smoking methamphetamine with glass<br />
pipes or inhaling it on tinfoil. Ice is either being injected<br />
or smoked. In Fort Worth, there is an increase<br />
both in the use of methamphetamine and in users<br />
seeking treatment. An ambulatory detoxification<br />
program has been established as an interim program<br />
for those needing residential treatment, and an outpatient<br />
program geared specifically to methamphetamine<br />
users has been established. In Dallas, methamphetamine<br />
is called “Ice” or “Tina,” and drug treatment<br />
programs are reporting increasing admissions<br />
of methamphetamine users as well as more users<br />
testing positive for hepatitis C.<br />
Depressants<br />
This “downer” category includes three groups of<br />
drugs: barbiturates, such as phenobarbital and secobarbital<br />
(Seconal); nonbarbiturate sedatives, such as<br />
methaqualone, over-the-counter sleeping aids, chloral<br />
hydrate, and tranquilizers; and benzodiazepines, such<br />
as diazepam (Valium), alprazolam (Xanax), flunitrazepam<br />
(Rohypnol), clonazepam (Klonopin or<br />
Rivotril), flurazepam (Dalmane), lorazepam (Ativan),<br />
and chlordiazepoxide (Librium and Librax). Rohypnol<br />
is discussed separately in the Club Drugs section of<br />
this report.<br />
Proceedings of the Community Epidemiology Work Group, Vol. II, January 2005 267
The 2004 secondary school survey reported lifetime<br />
use of downers decreased from 7.1 percent in 2002<br />
to 5.9 percent in 2004. Past-year use decreased from<br />
3.4 percent in 2002 to 2.6 percent in 2004.<br />
The 2000 adult survey reported lifetime use of<br />
downers at 6.9 percent and past-month use at 0.6<br />
percent; in 1996, lifetime use was 6.2 percent and<br />
past-month use was 0.3 percent. The difference in<br />
past-year use between 1996 and 2000 (1 percent to<br />
1.8 percent) was statistically significant.<br />
About 1 percent of the clients entering treatment in<br />
20043 had a primary problem with barbiturates,<br />
sedatives, or tranquilizers. These clients were the<br />
most likely to be female; only 36 percent were male.<br />
They were also likely to be highly impaired, based<br />
on their ASI scores (see exhibit 29).<br />
Alprazolam, clonazepam, and diazepam are among<br />
the 15 most commonly identified substances according<br />
to DPS lab reports, although none of them represent<br />
more than 3 percent of all items examined in a<br />
year. The proportion of cases that are alprazolam<br />
(Xanax) continues to increase (exhibit 19).<br />
Alprazolam sells for $3–$5 in Dallas, Fort Worth,<br />
and Houston, and for $5–$10 in Tyler. Depending on<br />
the dosage unit, diazepam sells for $1–$10 in Dallas,<br />
Fort Worth, and Tyler.<br />
Club Drugs and Hallucinogens<br />
Exhibit 20 shows the demographic characteristics of<br />
clients entering TDSHS-funded treatment programs<br />
statewide with a problem with a club drug. The row<br />
“Primary Drug” shows the percentage of clients citing<br />
a primary problem with the club drug shown at<br />
the top of the column. The rows under the heading<br />
“Other Primary Drug” show the percent of clients<br />
who had a primary problem with another drug, such<br />
as marijuana, but who had a secondary or tertiary<br />
problem with the club drug shown at the top of the<br />
column. Note that the treatment data uses a broader<br />
category, “Hallucinogens,” that includes lysergic acid<br />
diethylamide (LSD), dimethyltryptamine (DMT),<br />
STP, mescaline, psilocybin, and peyote.<br />
Based on exhibit 20, hallucinogen admissions are the<br />
most likely to be male, gamma hydroxybutyrate<br />
(GHB) clients are the most likely to be White, phencyclidine<br />
(PCP) clients are the most likely to be<br />
Black, Rohypnol clients are the youngest, and GHB<br />
clients are the oldest. While users of PCP are the<br />
most likely to have a primary problem with PCP,<br />
users of Rohypnol, ecstasy, and hallucinogens are<br />
268<br />
<strong>EPIDEMIOLOGIC</strong> TRENDS IN <strong>DRUG</strong> <strong>ABUSE</strong>—Texas<br />
more likely to have a primary problem with marijuana,<br />
rather than with a club drug.<br />
Exhibit 21 shows the percent of exhibits identified<br />
by DPS laboratories that contained various club<br />
drugs. Only the proportion of PCP exhibits has not<br />
decreased over time.<br />
Dextromethorphan<br />
The most popular dextromethorphan (DXM) products<br />
are Robitussin-DM, Tussin, and Coricidin<br />
Cough and Cold Tablets HBP, which can be purchased<br />
over the counter and can produce hallucinogenic<br />
effects if taken in large quantities. Coricidin<br />
HBP pills are known as “Triple C’s” or “Skittles.”<br />
The 2004 Texas school survey reported that 4.3 percent<br />
of secondary students indicated they had used<br />
DXM. Use increased from 2.5 percent in 7th grade to<br />
5.8 percent in 12th grade. There was no difference<br />
by gender, but Whites reported higher lifetime use<br />
(6.1 percent) than Native Americans (5.8 percent),<br />
Hispanics (3.6 percent), or Blacks (2.4 percent).<br />
Poison control centers reported the number of abuse<br />
and misuse cases involving dextromethorphan rose<br />
from 99 in 1998 to a high of 432 in 2002, and then<br />
dropped to 365 in 2003 and 91 in the first half of<br />
2004. Average age was 23.8. The number of cases<br />
involving abuse or misuse of Coricidin HBP was 7 in<br />
1998 and rose to 268 in 2002 and then decreased to<br />
189 in 2003. There have been 175 cases in the first<br />
half of 2004. Average age in 2004 was 16.2 years,<br />
which shows that youths can easily access and misuse<br />
this substance.<br />
DPS labs examined 2 substances in 1998 that were<br />
dextromethorphan, 13 in 1999, 36 in 2000, 18 in<br />
2001, 42 in 2002, 10 in 2003, and 8 in the first half<br />
of 2004.<br />
Ecstasy (Methylenedioxymethamphetamine or<br />
MDMA)<br />
The 2004 secondary school survey reported that lifetime<br />
ecstasy use dropped from a high of 8.6 percent<br />
in 2002 to 5.5 percent in 2004, while past-year use<br />
dropped from 3.1 percent to 1.8 percent.<br />
The 2000 adult survey reported that 3.1 percent had<br />
ever used ecstasy and 1.0 percent had used in the<br />
past year.<br />
Texas Poison Control Centers reported 23 calls involving<br />
misuse or abuse of ecstasy in 1998, 46 in<br />
1999, 119 in 2000, 155 in 2001, 172 in 2002, 284 in<br />
Proceedings of the Community Epidemiology Work Group, Vol. II, January 2005
2003, and 169 in the first half of 2004. In 2004, 48<br />
percent were male, and the average age was 20.8.<br />
There were 63 admissions for a primary, secondary,<br />
or tertiary problem with ecstasy in 1998, 114 in<br />
1999, 199 in 2000, 349 in 2001, 521 in 2002, 502 in<br />
2003, and 289 in the first half of 2004. Approximately<br />
36 percent reported marijuana as their primary<br />
problem drug, as compared to 12 percent who<br />
reported ecstasy as their primary problem drug. Exhibit<br />
22 shows that ecstasy has spread outside the<br />
White club scene and into the Hispanic and Black<br />
communities as evidenced by the declining proportion<br />
of White clients.<br />
In 1999, there were two deaths that involved ecstasy<br />
in Texas. There was one death in 2000, five in 2001,<br />
five in 2002, and two in 2003.<br />
Exhibit 21 shows the substances identified by DPS<br />
labs. The labs identified MDMA in 107 exhibits in<br />
1999, 387 in 2000, 814 in 2001, 503 in 2002, 484 in<br />
2003, and 325 in the first half of 2004. Methylenedioxyamphetamine<br />
(MDA) was identified in 31 exhibits<br />
in 1999, 27 in 2000, 48 in 2001, 90 in 2002, 94 in<br />
2003, and 29 in the first half of 2004.<br />
According to the Houston DEA Field Division, ecstasy<br />
is more available at clubs, raves, and gyms, and<br />
use is increasing in the Galveston, Beaumont, and<br />
Fort Hood areas. Logos on the tablets include A&E,<br />
Blue Dolphins, Bear, Music Notes, Crescent Moon,<br />
Yellow Dolphins, Aladdin Lamp, Yellow Alligator,<br />
Yellow Trumpets, Omega, X-5 (aka BMW), JJ,<br />
Spade, and Footprints. While most tablets contain<br />
MDMA, some have high concentrations of caffeine<br />
or methamphetamine. Asian gangs and White males<br />
continue to be involved in MDMA distribution.<br />
The Dallas DEA Field Division reports that MDMA,<br />
which is brought into the Division from Mexico, is<br />
heavily adulterated and of poor quality. Use is<br />
spreading among Blacks and among older users.<br />
Combinations of drugs mentioned in Dallas include<br />
“candy flipping” (LSD and MDMA), “hippie flipping”<br />
(mushrooms and MDMA), “love flipping”<br />
(mescaline and MDMA), “robo flipping” (DXM and<br />
MDMA), and “elephant flipping” (PCP and<br />
MDMA). The club drug distribution in the Division<br />
is dominated by Asian traffickers who are also involved<br />
with hydroponic marijuana and methamphetamine.<br />
Single dosage units of ecstasy sell for $6–$20 in Dallas,<br />
$5–$12.50 in Fort Worth, $12–$25 in Tyler,<br />
$4.75–$25 in Houston, $20–$30 in McAllen, $20 in<br />
Laredo, and $11–$20 in San Antonio. Multiple dos-<br />
<strong>EPIDEMIOLOGIC</strong> TRENDS IN <strong>DRUG</strong> <strong>ABUSE</strong>—Texas<br />
age units (1,000 tablets) sell for $5,000–$8,000 in<br />
Houston.<br />
Gamma Hydroxybutyrate (GHB), Gamma Butyrate<br />
Lactone (GBL), 1-4 Butanediol (1,4 BD)<br />
The 2000 Texas adult survey reported that 0.4 percent<br />
had ever used GHB and 0.1 percent had used in<br />
the past year.<br />
The number of cases of misuse or abuse of GHB<br />
reported to Texas Poison Control Centers was 110 in<br />
1998, 150 in 1999, 120 in 2000, 119 in 2001, 100 in<br />
2002, 66 in 2003, and 54 in the first half of 2004.<br />
Average age of the abusers in 2004 was 28, and of<br />
the callers whose gender was known, 38 percent<br />
were male.<br />
Adult and adolescent clients with a primary, secondary,<br />
or tertiary problem with GHB, GBL, or 1,4<br />
butanediol (1,4 BD) are seen in treatment. In 1998, 2<br />
were admitted, as compared to 17 in 1999, 12 in<br />
2000, 19 in 2001, 35 in 2002, 31 in 2003, and 21 in<br />
the first half of 2004. Clients who used GHB tended<br />
to be the oldest of all the club drug users (age 26)<br />
and the most likely to be White (91 percent). GHB<br />
users were more likely to have used the so-called<br />
“hard-core” drugs; 43 percent had a history of injecting<br />
drug use. Fifty-two percent had a primary problem<br />
with amphetamines or methamphetamines. Because<br />
of the sleep-inducing properties of GHB, users<br />
will also use methamphetamine so they can stay<br />
awake while they are “high” on GHB or they use<br />
GHB to “come down” from their use of methamphetamine<br />
(exhibit 20).<br />
In 1999, there were three deaths that involved GHB,<br />
five in 2000, three in 2001, two in 2002, and two in<br />
2003.<br />
In 1998, there were 18 items identified by DPS labs<br />
as being GHB, in 1999 112 were GHB, 4 were GBL,<br />
and 4 were 1,4 BD (exhibit 21). In 2000, 45 were<br />
GHB, 7 were GBL, and 4 were 1,4 BD. In 2001, 34<br />
were GHB, 7 were GBL, and 19 were 1,4 BD. In<br />
2002, 81 were GHB, 6 were GBL, and 4 were 1,4<br />
BD. In 2003, 150 were GHB, 5 were GBL, and none<br />
were 1,4 BD. In the first half of 2004, 44 were GHB<br />
and none were GBL or 1,4 BD (exhibit 21). In 2004,<br />
82 percent of the GHB items were identified in the<br />
DPS lab in the Dallas area, which shows use of GHB<br />
is centered in this area of the State.<br />
In Dallas, the price had increased from $100–$200<br />
per gallon to $250–$500 per gallon. A dose of GHB<br />
costs $20 in Dallas and $5–$10 in Lubbock and San<br />
Antonio. A 16-ounce bottle costs $100 in San Anto-<br />
Proceedings of the Community Epidemiology Work Group, Vol. II, January 2005 269
nio and two 2-ounce bottles cost $110 in Fort Worth.<br />
The DEA Field Division in Dallas reports that GHB<br />
is being manufactured in home laboratories where<br />
GBL ordered over the Internet is mixed with other<br />
chemicals and water to produce GHB.<br />
Ketamine<br />
The 2000 adult survey reported that 0.3 percent had<br />
ever used ketamine and 0.1 percent had used it in the<br />
last year.<br />
Eight cases of misuse or abuse of ketamine were<br />
reported to Texas Poison Control Centers in 1998,<br />
compared with 7 in 1999, 15 in 2000, 14 in 2001, 10<br />
in 2002, 17 in 2003, and 5 in the first half of 2004.<br />
Five clients were admitted to TDSHS-funded treatment<br />
programs in the first half of 2004 with a secondary<br />
or tertiary problem with ketamine. Forty percent<br />
had a history of injecting drug use, and all had problems<br />
with the legal or criminal justice system (exhibit<br />
20).<br />
There were two deaths in 1999 that involved use of<br />
ketamine, none in 2000, one in 2001, and one in<br />
2002.<br />
In 1999, 25 substances were identified as ketamine<br />
by DPS labs. There were 29 in 2000, 119 in 2001, 78<br />
in 2002, 84 in 2003, and 40 in the first half of 2004<br />
(exhibit 21).<br />
Ketamine costs $2,200–$2,500 per liter in Fort<br />
Worth and $65 per vial in Tyler, with a dose selling<br />
for $20 per pill or gram.<br />
LSD and Other Hallucinogens<br />
The secondary school survey shows that use of hallucinogens<br />
(defined as LSD, PCP, mushrooms, etc.)<br />
is continuing to decrease. Lifetime use peaked at 7.4<br />
percent in 1996 and had dropped to 4.8 percent by<br />
2004. Past-month use dropped from 2.5 percent in<br />
1998 to 1.6 percent in 2004.<br />
The 2000 adult survey reported that 8.8 percent of<br />
Texas adults had ever used LSD and 0.9 percent had<br />
used in the past year.<br />
Texas Poison Control Centers reported 82 mentions<br />
of abuse or misuse of LSD in 1998, 113 in 1999, 97<br />
in 2000, 70 in 2001, 129 in 2002, 20 in 2003, and 14<br />
in the first half of 2004. There were also 98 cases of<br />
270<br />
<strong>EPIDEMIOLOGIC</strong> TRENDS IN <strong>DRUG</strong> <strong>ABUSE</strong>—Texas<br />
intentional misuse or abuse of hallucinogenic mushrooms<br />
reported in 1998, 73 in 1999, 110 in 2000, 94<br />
in 2001, 151 in 2002, 130 in 2003, and 76 in 2004.<br />
The number of adults and youths with a primary,<br />
secondary, or tertiary problem with hallucinogens<br />
entering treatment is decreasing. There were 636 in<br />
2000, 486 in 2001, 436 in 2002, 319 in 2003, and<br />
142 in the first half of 2004. Of the admissions in<br />
2004, the average age was 22, 76 percent were male,<br />
62 percent were White, 26 percent were Hispanic,<br />
and 10 percent were Black. Sixty-three percent were<br />
referred from the criminal justice or legal system<br />
(exhibit 20).<br />
There were two deaths in 1999 with a mention of<br />
LSD. No deaths with a mention of LSD have been<br />
reported since.<br />
DPS labs identified 69 substances as LSD in 1998,<br />
compared with 406 in 1999, 234 in 2000, 122 in<br />
2001, 10 in 2002, 10 in 2003, and 12 in the first half<br />
of 2004 (exhibit 21).<br />
A dosage unit of LSD is selling for $1–$10 in Dallas,<br />
$5–$10 in Tyler, $6–$10 in Fort Worth, $7 in Lubbock,<br />
and $5–$12 in San Antonio. A dosage sheet of<br />
100 sells for $800 in San Antonio.<br />
Phencyclidine (PCP)<br />
The 2000 Texas adult survey reported that 0.9 percent<br />
of adults had ever used PCP or Angel Dust, and<br />
0.1 percent had used it in the past year.<br />
Texas Poison Control Centers reported cases of<br />
“Fry,” “Amp,” “Water,” “Wack,” or “PCP.” Often,<br />
marijuana joints were dipped in formaldehyde that<br />
contained PCP or PCP was sprinkled on the joint.<br />
The number of cases involving PCP increased from<br />
102 in 1998 to a high of 237 in 2002, 172 in 2003,<br />
and 102 in the first half of 2004. There were also 18<br />
cases involving misuse or abuse of formaldehyde or<br />
formalin in 2003 and 29 in the first half of 2004.<br />
Adolescent and adult admissions to treatment with a<br />
primary, secondary, or tertiary problem with PCP are<br />
increasing (exhibit 20), rising from 164 in 1998 to<br />
417 in 2003 and 175 in the first half of 2004. Of<br />
these clients in 2004, 83 percent were Black, 56 percent<br />
were male, 54 percent were involved in the<br />
criminal justice system, 22 percent were employed,<br />
and 20 percent were homeless. While 38 percent<br />
reported a primary problem with PCP, another 31<br />
Proceedings of the Community Epidemiology Work Group, Vol. II, January 2005
percent reported a primary problem with marijuana,<br />
which demonstrates the link between these two drugs<br />
and the use of “Fry” (exhibit 26).<br />
There were three deaths in 1999, three in 2000, five<br />
in 2001, eight in 2002, and two in 2003 that involved<br />
PCP.<br />
DPS labs identified 10 substances as PCP in 1998,<br />
84 in 1999, 104 in 2000, 163 in 2001, 95 in 2002,<br />
143 in 2003, and 83 in first half of 2004 (exhibit 21).<br />
PCP costs $700–$1,200 per ounce in San Antonio<br />
and $30 per dosage unit in McAllen. In Dallas, it<br />
costs $3,800 for a 16-ounce bottle, $375–$450 per<br />
ounce, $25 per cigarette, and $10 for a piece of a<br />
sherm stick. In Fort Worth, it costs $26,000–$28,000<br />
per gallon.<br />
Street outreach workers in the Galveston/Brazoria<br />
area report “Water” is a problem, and in Houston,<br />
there is an increase in the number of clients who<br />
identify their drug of choice as “Fry.”<br />
Rohypnol<br />
Rohypnol (flunitrazepam) is a benzodiazepine that<br />
was never approved for use in the use in the United<br />
States. The drug is legal in Mexico, but since 1996, it<br />
has been illegal to bring it into the United States. It<br />
continues to be a problem along the Texas-Mexico<br />
border. As shown in exhibit 23, the 2004 secondary<br />
school survey found that students from the border area<br />
were about three times more likely to report Rohypnol<br />
use than those living elsewhere in the State (9.1 percent<br />
vs. 2.5 percent lifetime, and 3.5 percent vs. 2.5<br />
percent current use). Use on the border and nonborder<br />
has declined since its peak in 1998.<br />
The 2000 Texas adult survey found that 0.8 percent<br />
reported lifetime use and 0.1 percent reported pastyear<br />
use of Rohypnol.<br />
The number of confirmed exposures to Rohypnol<br />
reported to the Texas Poison Control Centers peaked<br />
at 102 in 1998; 40 cases were reported in the first<br />
half of 2004. Average age in 2003 was 16.7 years,<br />
45.0 percent were male, and 83.0 percent lived in<br />
counties on the border. A study of all the exposure<br />
calls between 1998 and 2003 found a significantly<br />
higher proportion of flunitrazepam abuse and malicious<br />
use calls occurred in border counties. The majority<br />
of the abuse calls involved males, while the<br />
majority of malicious use calls involved females.<br />
Most abuse calls involved adolescents, while the<br />
<strong>EPIDEMIOLOGIC</strong> TRENDS IN <strong>DRUG</strong> <strong>ABUSE</strong>—Texas<br />
majority of the malicious calls involved adults.<br />
Abuse cases occurred most frequently at the patient’s<br />
own residence or at school, while malicious use occurred<br />
most often in public areas, with the patient’s<br />
own residence ranking second (Forrester 2004).<br />
The number of youths and adults admitted into<br />
treatment with a primary, secondary, or tertiary problem<br />
with Rohypnol has varied: 247 in 1998, 364 in<br />
1999, 324 in 2000, 397 in 2001, 368 in 2002, 331 in<br />
2003, and 137 in the first half of 2004. Clients abusing<br />
Rohypnol were among the youngest of the club<br />
drug patients, and they were predominately Hispanic,<br />
which reflects the availability and use of this drug<br />
along the border (exhibit 20). Some 64 percent were<br />
involved with the criminal justice or legal system.<br />
While 14 percent of these clients said that Rohypnol<br />
was their primary problem drug, 45 percent reported<br />
a primary problem with marijuana.<br />
DPS lab exhibits for Rohypnol numbered 43 in 1988,<br />
56 in 1999, 32 in 2000, 35 in 2001, 22 in 2002, 17 in<br />
2003, and 11 in the first half of 2004. This decline in<br />
the percent of seizures, as shown in exhibit 21, parallels<br />
the declines seen in other indicators.<br />
Although Roche is reported to no longer be making<br />
the 2-milligram Rohypnol tablet (a favorite with<br />
abusers) generic versions are still produced, and the<br />
blue dye added to the Rohypnol tablet to warn potential<br />
victims is not in the generic version. Unfortunately,<br />
the dye is not proving effective since people<br />
intent on committing sexual assault may employ blue<br />
tropical drinks and blue punches into which Rohypnol<br />
can be slipped.<br />
Rohypnol was selling for $2–$4 per pill in San Antonio.<br />
Other Abused Substances<br />
Inhalants<br />
The 2004 elementary school survey found that 10.5<br />
percent of students in grades 4 to 6 had ever used<br />
inhalants, and 7.8 percent had used in the school<br />
year. The 2004 secondary school survey found that<br />
17 percent of students in grades 7–12 had ever used<br />
inhalants and 6.7 percent had used in the past month.<br />
Inhalant use exhibits a peculiar age pattern not observed<br />
with any other substance. The prevalence of<br />
lifetime and past-month inhalant use was higher in<br />
the lower grades and lower in the upper grades (exhibit<br />
24). This decrease in inhalant use as students<br />
Proceedings of the Community Epidemiology Work Group, Vol. II, January 2005 271
age may be partially due to the fact that inhalant users<br />
drop out of school early and hence are not in<br />
school in later grades to respond to school-based<br />
surveys.<br />
Inhalant abusers represented 0.3 percent of the admissions<br />
to treatment programs in 2004. The clients<br />
tended to be male (63 percent) and Hispanic (82 percent).<br />
The overrepresentation of Hispanics is due to<br />
the fact that TDSHS has developed and funded<br />
treatment programs that were targeted specifically to<br />
this group. Average age was 22. Seventy percent<br />
were involved with the criminal justice system, average<br />
education was 8.9 years, 10 percent were homeless,<br />
and 16 percent had a history injecting drug use.<br />
In 2000, there were 12 deaths involving misuse of<br />
inhalants, compared with 15 in 2001, 8 in 2002, and<br />
13 in 2003. The categorization of inhalant deaths is<br />
difficult and leads to underreporting, but of those<br />
reported in 2003, the average age was 34, 85 percent<br />
were male, 69 percent were White, and 31 percent<br />
were Hispanic.<br />
Street outreach workers in Austin reported the deaths<br />
of two clients in their quarterly report at the end of<br />
2004. Both were homeless Hispanic males, in their<br />
late forties or early fifties, who were “huffers” and<br />
died from inhaling carburetor fluid. One of the clients<br />
had been inhaling since he was 13 years old.<br />
Steroids<br />
The Texas school survey reported that 2 percent of all<br />
secondary students surveyed in 2004 had ever used<br />
steroids and that less than 1 percent had used steroids<br />
during the month before the survey. Although many<br />
steroids are brought across the border, the school<br />
survey found lifetime usage lower among border students<br />
(1.4 percent) than among non-border students<br />
(2.1 percent).<br />
Carisoprodol (Soma)<br />
Poison control centers confirmed exposure cases of<br />
intentional misuse or abuse of the muscle relaxant<br />
carisoprodol (Soma) increased from 83 in 1998 to<br />
235 in 2003, and there were 160 in the first half of<br />
2004. In addition to the abuse and misuse cases,<br />
there were another 329 cases in which the reason for<br />
the call was suicide.<br />
Between 1998 and 2003, 51 percent of these cases<br />
involved males and 83 percent involved persons older<br />
than 19. Some 37 percent of the cases were in the<br />
Houston region, 18 percent were in the Dallas and<br />
Fort Worth region, and 11 percent were in the<br />
272<br />
<strong>EPIDEMIOLOGIC</strong> TRENDS IN <strong>DRUG</strong> <strong>ABUSE</strong>—Texas<br />
Beaumont region. Carisoprodol is a substance that<br />
tends to be abused in combination with other substances.<br />
Only 39 percent of the cases involved that<br />
one drug; all the others involved combinations of<br />
drugs (Forrester, 2004).<br />
In 2003, carisoprodol was mentioned on 51 death<br />
certificates. Only 1 of the deaths involved exclusively<br />
carisoprodol. Hydrocodone, propoxyphene, alcohol,<br />
and benzodiazepines were also substances that were<br />
mentioned along with carisoprodol.<br />
DPS lab exhibits of carisoprodol reported to NFLIS<br />
increased from 13 in 1998 to 90 in 1999, 153 in 2000,<br />
202 in 2001, 179 in 2002, 278 in 2003, and 132 in the<br />
first half of 2004.<br />
According to the Dallas DEA Field Division, Soma<br />
sells for $2–$5 per tablet.<br />
INFECTIOUS DISEASES RELATED TO <strong>DRUG</strong> <strong>ABUSE</strong><br />
Hepatitis C<br />
Exhibit 25 shows that 18 percent of the 8,798 tests<br />
for HCV exposure given in 2003 were positive. Some<br />
41 percent of those with positive tests were exposed<br />
through injecting drug use. The rates were higher for<br />
males, for American Indians and Blacks, and for persons<br />
aged 40 and older. The highest HCV positivity<br />
rates were reported by persons tested at sexually<br />
transmitted disease clinics and drug treatment centers<br />
(22 percent each) and field outreach centers and corrections<br />
and probation settings (20 percent each).<br />
Forty-eight percent of the 200 clients in narcotic<br />
treatment programs who were interviewed by the<br />
author as part of NIDA Grant R21 DA014744 said<br />
they were positive for hepatitis C, and 54 percent said<br />
a doctor had told them they had liver problems.<br />
However, only 5 percent reported they were HIV<br />
positive.<br />
HIV and AIDS Cases<br />
In 2003, the percent of AIDS cases involving heterosexual<br />
exposures was greater than the percent of<br />
cases due to injecting drug use (exhibit 26). The proportion<br />
due to heterosexual contact has risen from 1<br />
percent in 1987 to 27 percent in the first half of 2004,<br />
while the proportion attributed to injecting drug use<br />
was 16 percent in the first half of 2004.<br />
In 1987, 3 percent of the AIDS cases were females<br />
older than age 12; in the first half of 2004, 24 percent<br />
were female. In 1987, 12 percent of the adult and<br />
adolescent cases were Black; in 2004, 44 percent<br />
Proceedings of the Community Epidemiology Work Group, Vol. II, January 2005
were Black. As exhibit 27 shows, the proportion of<br />
White males has dropped, while the proportion of<br />
Blacks and Hispanics has increased.<br />
The proportion of adult needle users entering<br />
TDSHS-funded treatment programs has decreased<br />
<strong>EPIDEMIOLOGIC</strong> TRENDS IN <strong>DRUG</strong> <strong>ABUSE</strong>—Texas<br />
from 32 percent in 1988 to 22 percent for 2004. Heroin<br />
injectors are most likely to be older, and nearly<br />
two-thirds are people of color, while injectors of<br />
stimulants and cocaine are far more likely to be<br />
White (exhibit 28).<br />
For inquiries concerning this report, please contact Jane C. Maxwell, Ph.D., Research Professor, Center for Social Work Research, The University<br />
of Texas at Austin, Suite 335, 1717 West 6 th Street, Austin, TX 78703, Phone: 512-232-0610, Fax: 512-232-0617, E-mail: jcmaxwell@sbcglobal.net.<br />
Proceedings of the Community Epidemiology Work Group, Vol. II, January 2005 273
<strong>EPIDEMIOLOGIC</strong> TRENDS IN <strong>DRUG</strong> <strong>ABUSE</strong>—Texas<br />
Exhibit 1. Secondary Students Who Had Ever Used Powder or Crack Cocaine, by Grade: 2004<br />
SOURCE: TDSHS<br />
274<br />
100%<br />
90%<br />
80%<br />
70%<br />
60%<br />
50%<br />
40%<br />
30%<br />
20%<br />
10%<br />
0%<br />
5%<br />
3%<br />
8%<br />
4%<br />
12%<br />
6%<br />
16%<br />
9%<br />
20%<br />
23%<br />
11% 10%<br />
Grade 7 Grade 8 Grade 9 Grade 10 Grade 11 Grade 12<br />
Border Nonborder<br />
Exhibit 2. Characteristics of Clients Admitted to TDSHS-Funded Treatment with a Primary Problem with<br />
Cocaine, by Route of Administration: January–June 2004<br />
SOURCE: TDSHS<br />
Crack Powder Powder<br />
Cocaine Cocaine Cocaine Cocaine<br />
Smoke Inject Inhale All*<br />
# Admissions 4,868 554 1,505 7,009<br />
% of Cocaine Admits 70 8 22 100<br />
Lag-1st Use to Tmt-Yrs. 12 14 10 12<br />
Average Age 37 36 31 36<br />
% Male 55 65 57 56<br />
% Black 50 5 15 39<br />
% White 33 63 31 35<br />
% Hispanic 15 27 53 25<br />
% CJ Involved 37 48 49 41<br />
% Employed 12 15 28 16<br />
% Homeless 19 13 5 15<br />
*Total includes clients with "other" routes of administration.<br />
Proceedings of the Community Epidemiology Work Group, Vol. II, January 2005
<strong>EPIDEMIOLOGIC</strong> TRENDS IN <strong>DRUG</strong> <strong>ABUSE</strong>—Texas<br />
Exhibit 3. Routes of Administration of Cocaine by Race/Ethnicity from TDSHS Treatment Admissions:<br />
1993–1H 2004<br />
SOURCE: TDSHS<br />
100%<br />
90%<br />
80%<br />
70%<br />
60%<br />
50%<br />
40%<br />
30%<br />
20%<br />
10%<br />
0%<br />
Crack-93 Crack-04 IDU-93 IDU-04 Inhale-93 Inhale-04<br />
Black White Hispanic<br />
Exhibit 4. Age and Race/Ethnicity of Persons Dying with a Mention of Cocaine in Texas: 1992–2003<br />
Number of Deaths<br />
600<br />
500<br />
400<br />
300<br />
200<br />
100<br />
0<br />
SOURCE: TDSHS<br />
1992 1993 1994 1995 1996 1997 1998 1999 2000 2001 2002 2003<br />
White Hispanic Black Age<br />
Proceedings of the Community Epidemiology Work Group, Vol. II, January 2005 275<br />
40<br />
39<br />
38<br />
37<br />
36<br />
35<br />
34<br />
33<br />
32<br />
31<br />
Age (Years)
276<br />
<strong>EPIDEMIOLOGIC</strong> TRENDS IN <strong>DRUG</strong> <strong>ABUSE</strong>—Texas<br />
Exhibit 5. Substances Identified by Texas DPS Labs: 1998–1H 2004<br />
SOURCE: NFLIS<br />
Exhibit 6. Price 1 of a Kilogram of Cocaine in Texas as Reported by the DEA: 1987–2004<br />
$50,000<br />
$45,000<br />
$40,000<br />
$35,000<br />
$30,000<br />
$25,000<br />
$20,000<br />
$15,000<br />
$10,000<br />
$5,000<br />
$-<br />
1987<br />
1989<br />
1991<br />
1H-93<br />
1<br />
Prices reported by half year since 1993.<br />
SOURCE: DEA<br />
1H-94<br />
1H-95<br />
1H-96<br />
1H-97<br />
1H-98<br />
1H-99<br />
1H-00<br />
Proceedings of the Community Epidemiology Work Group, Vol. II, January 2005<br />
1H-01<br />
1H-02<br />
1H-03<br />
1H-04
<strong>EPIDEMIOLOGIC</strong> TRENDS IN <strong>DRUG</strong> <strong>ABUSE</strong>—Texas<br />
Exhibit 7. Percentage of Texas Secondary Students Who Reported They Normally Consumed Five or More<br />
Drinks at One Time, by Specific Alcoholic Beverage: 1988–2004<br />
SOURCE: TDSHS<br />
25%<br />
20%<br />
15%<br />
10%<br />
5%<br />
0%<br />
1988 1990 1992 1994 1996 1998 2000 2002 2004<br />
Beer Wine Coolers Liquor Wine<br />
Exhibit 8. Texas Substance Abuse-Related Arrests 1 Per 100,000 Population in Texas: 1994–2003<br />
1,200<br />
1,000<br />
800<br />
600<br />
400<br />
200<br />
0<br />
1994 1995 1996 1997 1998 1999 2000 2001 2002 2003<br />
DWI LLV PI Drug Trafficking Drug Possession<br />
1<br />
DWI=Driving While Intoxicated; LLV=Liquor Law Violation; PI=Public Intoxication.<br />
SOURCE: Texas DPS<br />
Proceedings of the Community Epidemiology Work Group, Vol. II, January 2005 277
<strong>EPIDEMIOLOGIC</strong> TRENDS IN <strong>DRUG</strong> <strong>ABUSE</strong>—Texas<br />
Exhibit 9. Characteristics of Clients Admitted to TDSHS-Funded Treatment with a Primary Problem with<br />
Heroin, by Route of Administration: 1H 2004<br />
278<br />
Inject Inhale Smoke All*<br />
# Admissions 2,394 255 27 2,702<br />
% of Heroin Admits 89 9 1 100<br />
Lag-1st Use to Tmt-Yrs. 16 8 7 15<br />
Average Age 37 29 28 36<br />
% Male 69 53 48 67<br />
% Black 6 33 7 9<br />
% White 37 18 44 35<br />
% Hispanic 55 47 41 54<br />
% CJ Involved 31 29 15 30<br />
% Employed 11 16 7 12<br />
% Homeless 13 10 7 13<br />
*Total includes clients with other routes of administration.<br />
SOURCE: TDSHS<br />
Exhibit 10. Heroin Admissions to TCADA-Funded Treatment by Race/Ethnicity: 1986–1H 2004<br />
100%<br />
90%<br />
80%<br />
70%<br />
60%<br />
50%<br />
40%<br />
30%<br />
20%<br />
10%<br />
0%<br />
SOURCE: TDSHS<br />
86 87 88 89 90 91 92 93 94 95 96 97 98 99 00 01 02 03 04<br />
Black White Hispanic<br />
Proceedings of the Community Epidemiology Work Group, Vol. II, January 2005
<strong>EPIDEMIOLOGIC</strong> TRENDS IN <strong>DRUG</strong> <strong>ABUSE</strong>—Texas<br />
Exhibit 11. Age and Race/Ethnicity of Persons Dying with a Mention of Heroin in Texas: 1992–2003<br />
Number of Deaths<br />
400<br />
350<br />
300<br />
250<br />
200<br />
150<br />
100<br />
50<br />
0<br />
SOURCE: TDSHS<br />
1993 1994 1995 1996 1997 1998 1999 2000 2001 2002 2003<br />
White Hispanic Black Age<br />
Exhibit 12. Price 1 of an Ounce of Mexican Black Tar Heroin in Texas as Reported by the DEA: 1987–2004<br />
$9,000<br />
$8,000<br />
$7,000<br />
$6,000<br />
$5,000<br />
$4,000<br />
$3,000<br />
$2,000<br />
$1,000<br />
$-<br />
1987<br />
1989<br />
1991<br />
1H-93<br />
1<br />
Prices reported by half year since 1993.<br />
SOURCE: DEA<br />
1H-94<br />
1H-95<br />
1H-96<br />
Proceedings of the Community Epidemiology Work Group, Vol. II, January 2005 279<br />
1H-97<br />
1H-98<br />
1H-99<br />
1H-00<br />
1H-01<br />
1H-02<br />
1H-03<br />
1H-04<br />
40<br />
39.5<br />
39<br />
38.5<br />
38<br />
37.5<br />
37<br />
36.5<br />
36<br />
Age (Years)
280<br />
<strong>EPIDEMIOLOGIC</strong> TRENDS IN <strong>DRUG</strong> <strong>ABUSE</strong>—Texas<br />
Exhibit 13. Hydrocodone, Oxycodone, and Methadone Indicators in Texas: 1998–1H 2004<br />
1998<br />
Poison Control Center Cases of Abuse and Misuse<br />
1999 2000 2001 2002 2003 1H 2004<br />
Hydrocodone 192 264 286 339 429 414 285<br />
Oxycodone 12 26 22 34 68 64 42<br />
Methadone<br />
TDSHS Treatment Admissions<br />
16 19 21 26 50 41 39<br />
"Other Opiates" 1 542 802 879 1,336 1,752 2,227 1,344<br />
Methadone 53 68 44 50 63 66 29<br />
Deaths with Mention of Substance (TDSHS)<br />
Hydrocodone 25 52 107 168 140<br />
Oxycodone 8 20 40 56 60<br />
Methadone 30 36 62 93 131 122<br />
Drug Exhibits Identified by DPS Laboratories<br />
Hydrocodone 479 629 771 747 1,212 776<br />
Oxycodone 36 72 115 106 174 121<br />
Methadone 1 19 22 42 49 63 67<br />
1 “Other Opiates” refers to those other than heroin.<br />
SOURCES: TPCN, TDSHS, NFLIS, and TDH<br />
Exhibit 14. Percentage of Texas Secondary Students Who Had Used Marijuana in the Past Month, by Grade:<br />
1998–2004<br />
20%<br />
15%<br />
10%<br />
5%<br />
0%<br />
SOURCE: TDSHS<br />
1988 1990 1992 1994 1996 1998 2000 2002 2004<br />
Grade 7 Grade 8 Grade 9<br />
Grade 10 Grade 11 Grade 12<br />
Proceedings of the Community Epidemiology Work Group, Vol. II, January 2005
<strong>EPIDEMIOLOGIC</strong> TRENDS IN <strong>DRUG</strong> <strong>ABUSE</strong>—Texas<br />
Exhibit 15. Price of a Pound of Commercial Grade Marijuana in Texas, as Reported by the DEA: 1992–2004<br />
$1,800<br />
$1,600<br />
$1,400<br />
$1,200<br />
$1,000<br />
$800<br />
$600<br />
$400<br />
$200<br />
$-<br />
SOURCE: DEA<br />
1992 1993 1994 1995 1996 1997 1998 1999 2000 2001 2002 2003 2004<br />
Exhibit 16. Route of Administration of Methamphetamine by Clients Admitted to TDSHS-Funded Programs:<br />
1988–1H 2004<br />
Percent<br />
90<br />
80<br />
70<br />
60<br />
50<br />
40<br />
30<br />
20<br />
10<br />
0<br />
SOURCE: TDSHS<br />
1988 1989 1990 1991 1992 1993 1994 1995 1996 1997 1998 1999 2000 2001 2002 2003 2004<br />
Smoking Inhaling Injecting<br />
Proceedings of the Community Epidemiology Work Group, Vol. II, January 2005 281
282<br />
<strong>EPIDEMIOLOGIC</strong> TRENDS IN <strong>DRUG</strong> <strong>ABUSE</strong>—Texas<br />
Exhibit 17. Characteristics of Clients Admitted to TDSHS-Funded Treatment with a Primary Problem of<br />
Amphetamines or Methamphetamines, by Route of Administration: 1H 2004<br />
Smoke Inject Inhale Oral All*<br />
# Admissions 911 1,292 299 103 2,607<br />
% of Stimulant Admits 35 50 12 4 100<br />
Lag-1st Use to Tmt-Yrs. 9 13 10 11 11<br />
Average Age-Yrs. 28 31 31 31 30<br />
% Male 44 47 48 48 46<br />
% Black 1 0 1 2 1<br />
% White 86 95 87 84 90<br />
% Hispanic 10 4 9 13 7<br />
% CJ Involved 48 51 48 52 50<br />
% Employed 22 16 25 26 19<br />
% Homeless 7 10 6 11 9<br />
*Total includes clients with "other" routes of administration<br />
SOURCE: TDSHS<br />
Exhibit 18. Percent of Items Analyzed by Texas DPS Laboratories Identified as Methamphetamine, by<br />
County and City: 1H 2004<br />
SOURCE: NFLIS<br />
County/City Percent<br />
Hidalgo (McAllen) 0.40<br />
Webb (Laredo) 1.02<br />
El Paso (El Paso) 3.55<br />
Nueces (Corpus Christi) 11.69<br />
Harris (Houston) 10.86<br />
Travis (Austin) 22.11<br />
McLennan (Waco) 26.14<br />
Smith (Tyler) 29.90<br />
Dallas (Dallas) 35.78<br />
Midland (Odessa) 18.69<br />
Taylor (Abilene) 57.75<br />
Lubbock (Lubbock) 29.30<br />
Potter (Amarillo) 44.50<br />
Proceedings of the Community Epidemiology Work Group, Vol. II, January 2005
<strong>EPIDEMIOLOGIC</strong> TRENDS IN <strong>DRUG</strong> <strong>ABUSE</strong>—Texas<br />
Exhibit 19. Benzodiazepines Identified by DPS Labs in Texas: 1998–1H 2004<br />
3.5%<br />
3.0%<br />
2.5%<br />
2.0%<br />
1.5%<br />
1.0%<br />
0.5%<br />
0.0%<br />
SOURCE: NFLIS<br />
1998, 1.1%<br />
1999, 1.1%<br />
2000, 1.3%<br />
2001, 2.0%<br />
2002, 2.6%<br />
2003, 2.7%<br />
2004, 3.1%<br />
1998, 1.7%<br />
1999, 1.4%<br />
2000, 1.1%<br />
Proceedings of the Community Epidemiology Work Group, Vol. II, January 2005 283<br />
2001, 1.1%<br />
Alprazolam Diazepam Clonazepam<br />
Exhibit 20. Characteristics of Clients Admitted to TDSHS-Funded Treatment with a Primary, Secondary, or<br />
Tertiary Problem with Club Drugs: 1H 2004<br />
Club Drug GHB Hallucinogens Ecstasy PCP Ketamine Rohypnol<br />
# Admissions 21 142 289 175 5 137<br />
% Male 57 76 57 56 100 70<br />
% White 91 62 63 8 60 1<br />
% Hispanic 9 26 19 9 40 99<br />
% Black 0 10 16 83 0 0<br />
Average Age (Years) 26 22 22 24 16 19<br />
% Criminal Justice Involved 43 63 64 54 100 64<br />
% History Needle Use 43 22 22 3 40 12<br />
% Primary Drug=Club Drug<br />
Other Primary Drug<br />
29 18 12 38 20 14<br />
% Marijuana 5 46 36 31 40 45<br />
% Alcohol 5 13 9 11 0 10<br />
% Methamphet/Amphetamines 52 7 16 1 0 0<br />
% Powder Cocaine 0 6 13 7 20 15<br />
% Crack Cocaine 5 3 5 9 0 0<br />
% Heroin 0 1 2 1 8 7<br />
SOURCE: TDSHS<br />
2002, 1.0%<br />
2003, 0.8%<br />
2004, 0.6%<br />
1998, 1.4%<br />
1999, 1.1%<br />
2000, 1.0%<br />
2001, 0.9%<br />
2002, 1.0%<br />
2003, 0.9%<br />
2004, 1.0%
<strong>EPIDEMIOLOGIC</strong> TRENDS IN <strong>DRUG</strong> <strong>ABUSE</strong>—Texas<br />
Exhibit 21. Club Drugs Identified by DPS Labs in Texas: 1998–1H 2004<br />
SOURCE: NFLIS<br />
Exhibit 22. Characteristics of Clients Admitted to TDSHS-Funded Treatment with a Problem with Ecstasy:<br />
1990–1H 2004<br />
284<br />
100%<br />
90%<br />
80%<br />
70%<br />
60%<br />
50%<br />
40%<br />
30%<br />
20%<br />
10%<br />
0%<br />
SOURCE: TDSHS<br />
1990 1992 1994 1996 1998 2000 2002 2004<br />
White Hispanic Black<br />
Proceedings of the Community Epidemiology Work Group, Vol. II, January 2005
<strong>EPIDEMIOLOGIC</strong> TRENDS IN <strong>DRUG</strong> <strong>ABUSE</strong>—Texas<br />
Exhibit 23. Percentage of Border and Nonborder Texas Secondary Students Who Had Ever Used Rohypnol,<br />
by Grade: 2004<br />
SOURCE: TDSHS<br />
14%<br />
12%<br />
10%<br />
8%<br />
6%<br />
4%<br />
2%<br />
0%<br />
1.3%<br />
3.8%<br />
Non-Border<br />
Border<br />
6.8%<br />
2.8% 2.8%<br />
10.3%<br />
Proceedings of the Community Epidemiology Work Group, Vol. II, January 2005 285<br />
3.1%<br />
11.2%<br />
2.7%<br />
11.6%<br />
2.3%<br />
11.8%<br />
Grade 7 Grade 8 Grade 9 Grade 10 Grade 11 Grade 12<br />
Exhibit 24. Percentage of Texas Secondary Students Who Had Used Inhalants Ever or in the Past Month,<br />
by Grade: 2004<br />
25%<br />
20%<br />
15%<br />
10%<br />
5%<br />
0%<br />
SOURCE: TDSHS<br />
20%<br />
21%<br />
18%<br />
16%<br />
14%<br />
13%<br />
Grade 7 Grade 8 Grade 9 Grade 10 Grade 11 Grade 12<br />
Lifetime Use Past-Month Use
286<br />
<strong>EPIDEMIOLOGIC</strong> TRENDS IN <strong>DRUG</strong> <strong>ABUSE</strong>—Texas<br />
Exhibit 25. Texas HCV Exposures and Their Demographics: 2003<br />
SOURCE: TDSHS<br />
Demographic Percent<br />
Overall<br />
By Mode of Exposure<br />
17.8<br />
Injection drug exposure 40.7<br />
Medical exposure 13.3<br />
Tattoo or piercing 5.3<br />
Occupational 2.8<br />
Other blood/needle 3.4<br />
Sexual risk 7.6<br />
Shared snorting equipment 3.3<br />
No disclosed risk<br />
Gender<br />
5.1<br />
Male 19.3<br />
Female<br />
Race/Ethnicity<br />
15.3<br />
Hispanic 12.1<br />
Non-Hispanic 20.8<br />
White 16.8<br />
Black<br />
Age Group<br />
20.4<br />
13–19 2.3<br />
20–24 6.3<br />
25–29 11.5<br />
30–39 23.8<br />
40 and older 35.3<br />
Exhibit 26. AIDS Cases 1 in Texas by Route of Transmission: 1987–June 2004<br />
90%<br />
80%<br />
70%<br />
60%<br />
50%<br />
40%<br />
30%<br />
20%<br />
10%<br />
0%<br />
1987 1988 1989 1990 1991 1992 1993 1994 1995 1996 1997 1998 1999 2000 2001 2002 2003 2004<br />
1 Cases with risk not reported excluded.<br />
SOURCE: TDSHS<br />
MSM-Bisexual MSM&IDU IDU Heterosexual<br />
Proceedings of the Community Epidemiology Work Group, Vol. II, January 2005
<strong>EPIDEMIOLOGIC</strong> TRENDS IN <strong>DRUG</strong> <strong>ABUSE</strong>—Texas<br />
Exhibit 27. Texas Male and Female AIDS Cases by Race/Ethnicity: 1987–June 2004<br />
SOURCE: TDSHS<br />
Exhibit 28. Characteristics of Clients Admitted to TDSHS-Funded Treatment Who Used Needles: 1H 2004<br />
SOURCE: TDSHS<br />
Heroin Cocaine Stimulants<br />
# Admissions 2,394 554 1,292<br />
% of Needle Admits\Drug 89 8 50<br />
Lag-1st Use to Tmt-Yrs. 16 14 13<br />
Average Age 37 36 31<br />
% Male 69 65 47<br />
% Black 6 6 0<br />
% White 37 63 95<br />
% Hispanic 55 27 4<br />
% CJ Involved 31 48 51<br />
% Employed 11 15 16<br />
% Homeless 13 13 10<br />
Proceedings of the Community Epidemiology Work Group, Vol. II, January 2005 287
<strong>EPIDEMIOLOGIC</strong> TRENDS IN <strong>DRUG</strong> <strong>ABUSE</strong>—Texas<br />
Exhibit 29. Adult and Youth Admissions to TDSHS-Funded Programs: 1H 2004<br />
Avg. Lag-1st<br />
Total % of All Average Avg. Age Use to % First Percent Percent % Use % History of<br />
Primary Substance Admissions Admissions Age 1st Use Admission Treatment Married Male Needles IV Drug Use<br />
Total 28,261 100.0 32.4 19.1 14.0 43.2 18.7 61.8 19.2 33.1<br />
Heroin 2,702 9.9 35.7 21.5 15.0 21.4 17.0 66.9 87.0 90.5<br />
Methadone 29 0.1 32.2 25.8 7.0 21.9 21.9 37.5 31.3 56.3<br />
Other Opiates 1,344 4.8 35.1 25.2 11.0 35.3 26.6 42.1 17.5 39.2<br />
Alcohol 7,060 28.2 38.0 15.6 23.5 38.8 17.9 68.0 6.4 24.7<br />
Depressants 368 1.3 31.4 23.2 9.0 39.3 18.8 35.7 7.8 26.9<br />
Stimulants 2,760 9.8 30.1 19.7 11.3 50.7 21.0 45.9 49.3 61.4<br />
Powder Cocaine 2,233 7.9 32.1 21.4 11.4 47.1 21.8 58.8 25.7 33.9<br />
Marijuana 5,380 19.0 21.5 13.8 9.0 66.3 19.2 72.4 1.9 7.1<br />
Hallucinogens 92 0.3 26.0 19.8 7.0 38.6 8.4 55.4 6.0 7.2<br />
Other Drugs 160 0.6 31.1 22.4 9.6 50.5 7.7 42.9 9.9 20.9<br />
Crack Cocaine 5,125 18.1 37.4 26.0 12.3 30.7 16.4 55.1 5.3 30.1<br />
% Involved % Employed Average Average # of Women<br />
Percent Percent Percent with CJ or Percent Over Last 12 Education Percent Income Pregnant<br />
Primary Substance Black White Hispanic Legal System Employed Months (Years) Homeless At Adm at Admission<br />
Total 20.0 48.7 29.4 49.0 20.5 3.9 11.3 11.8 $5915 533<br />
Heroin 8.7 35.2 54.1 31.0 12.5 2.7 11.2 12.8 $3780 38<br />
Methadone 6.3 81.3 9.4 40.6 12.5 2.5 11.8 12.5 $2653 0<br />
Other Opiates 9.1 81.9 7.9 31.1 12.1 3.5 12.3 7.8 $6179 13<br />
Alcohol 15.4 58.2 24.4 44.4 24.7 4.6 12.0 13.4 $7382 53<br />
Depressants 7.1 83.8 8.4 36.7 12.0 3.6 12.1 5.8 $5057 4<br />
Stimulants 0.8 90.4 6.6 50.0 19.6 3.7 11.7 8.8 $5551 96<br />
Powder Cocaine 12.3 38.2 47.1 50.0 26.0 4.5 11.4 6.6 $6502 62<br />
Marijuana 21.6 32.4 43.4 75.9 35.5 4.8 9.9 7.7 $6140 126<br />
Hallucinogens 78.3 14.5 7.2 51.8 24.1 2.8 11.2 12.0 $2611 3<br />
Other Drugs 17.6 42.9 38.5 52.7 9.9 2.5 11.8 5.5 $4088 6<br />
Crack Cocaine 49.7 33.5 15.4 37.6 12.1 3.0 11.7 18.4 $4847 129<br />
Percent % Sickness Percent % Family Percen Percent Percent<br />
% on Emergency or Health Employment or Marital Social/Peer Psych/Emot. Drug/Alcohol<br />
Primary Substance Medication Room Visit Problems Problems Problems Problems Problems Problems<br />
Total 21.3 34.0 25.4 52.0 49.4 41.0 41.5 69.1<br />
Heroin 29.1 32.9 25.6 67.3 61.3 55.4 38.2 88.4<br />
Methadone 28.1 53.1 46.9 68.8 81.3 78.1 71.9 93.8<br />
Other Opiates 32.8 56.6 40.0 52.9 57.8 46.8 58.7 84.3<br />
Alcohol 24.0 40.0 27.3 52.8 49.1 41.3 47.4 72.2<br />
Depressants 36.0 57.5 37.0 61.7 62.3 46.8 58.4 83.8<br />
Stimulants 17.5 40.9 28.1 59.2 57.1 45.7 53.6 74.9<br />
Powder Cocaine 18.1 35.8 23.6 48.6 47.7 35.7 38.5 66.0<br />
Marijuana 12.9 15.5 15.3 35.7 31.1 24.2 23.2 44.1<br />
Hallucinogens 14.5 44.6 25.3 54.2 55.4 41.0 30.1 61.4<br />
Other Drugs 38.5 39.6 28.6 48.4 45.1 34.1 36.3 62.6<br />
Crack Cocaine 22.3 38.3 29.6 58.8 57.7 49.4 46.2 77.7<br />
SOURCE: TDSHS<br />
288<br />
Proceedings of the Community Epidemiology Work Group, Vol. II, January 2005
<strong>EPIDEMIOLOGIC</strong> TRENDS IN <strong>DRUG</strong> <strong>ABUSE</strong>—Washington, DC<br />
Patterns and Trends of Drug Abuse in Washington, DC<br />
Erin Artigiani, M.A., Margaret Hsu, M.P.H., and Eric Wish, Ph.D. 1<br />
ABSTRACT<br />
Cocaine/crack, marijuana, and heroin continued to<br />
be the main illicit drug problems in Washington, DC,<br />
in 2004, while the use and availability of PCP started<br />
to decline. Although cocaine/crack treatment admissions<br />
declined, cocaine remained one of the most serious<br />
drugs of abuse in the District. More adult arrestees<br />
tested positive for cocaine than for any other<br />
drug during the first 8 months of 2004. Pretrial Services<br />
test results indicate that PCP positives dropped<br />
sharply during this time. Juvenile arrestees were more<br />
likely to test positive for marijuana than for any other<br />
drug, but the percentage testing positive decreased<br />
slightly. Heroin treatment admissions increased<br />
slightly. While other parts of the country have seen<br />
shifts in the use of methamphetamine, use remains<br />
low and confined to isolated populations in DC.<br />
INTRODUCTI<strong>ON</strong><br />
Area Description<br />
The Nation’s Capital is home to approximately<br />
570,898 people residing in 8 wards that remain<br />
largely distinguishable by race and economic status<br />
(U.S. Bureau of the Census, 2001 update). A majority<br />
of the District’s wealthy White residents live in the<br />
northwest part of the city, while many of the poor<br />
African-American residents live in the northeast and<br />
southeast. There are slightly more females than<br />
males, and the majority of the District’s population<br />
continues to be African-American (60 percent).<br />
Nearly one-third of the population is White (31 percent),<br />
and the remainder is primarily Hispanic and/or<br />
Asian (U.S. Bureau of the Census, 2000 Census). The<br />
population of the District is slightly older than the<br />
general U.S. population. One in five residents are<br />
younger than 18, and slightly more than 12 percent<br />
are age 65 and older. More than one-third (39.1 percent)<br />
of adults age 25 or older have at least a bachelor’s<br />
degree (Pach et al. 2002).<br />
Data from the 2000 census reveal several key demographic<br />
changes since 1990. The total population<br />
decreased by 5.7 percent during the 1990s, from<br />
606,900 in 1990 to 572,059 in 2000. The number of<br />
African-Americans decreased by 14.1 percent, the<br />
number of Asians grew by 38.6 percent, and the<br />
number of Hispanic residents grew by 37.4 percent.<br />
The White population also grew by a much more<br />
modest 2 percent during this time period (Pach et al.<br />
2002).<br />
Despite a nationwide economic recession, wealth<br />
distributions in the District became more polarized<br />
during 2002. Buoyed by the draw of potential income<br />
from service employment, government spending, and<br />
an established technology industry, measures of<br />
wealth such as median household income ($40,127 in<br />
the District in 1999) increased in the DC metropolitan<br />
region. The percentage of persons living in poverty<br />
also increased in many areas in and around<br />
Washington (Pach et al. 2002). One in five residents<br />
were living in poverty in 1999 (U.S. Census Bureau).<br />
Alcohol abuse costs the District approximately $700<br />
million per year, and illicit drug use costs about $500<br />
million per year. Nearly 1 in 10 residents (approximately<br />
60,000) are addicted to illegal drugs and/or<br />
alcohol. At least one-half (26,000–42,000) of these<br />
individuals have co-occurring substance abuse and<br />
mental health disorders. The DC Household Survey<br />
indicates that first-time drug use occurs at a younger<br />
age in the District than in the rest of the Nation.<br />
Homicides in the District decreased sharply from 248<br />
in 2003 to 198 in 2004. Drugs are still listed as one of<br />
the four most common motives behind these homicides,<br />
along with arguments, retaliation, and robberies.<br />
The major drug problems in the District continue to be<br />
cocaine/crack, marijuana, and heroin. The use and<br />
availability of phencyclidine (PCP) increased from<br />
2000 to 2002 but decreased in 2004. The use of club<br />
drugs like methylenedioxymethamphetamine (MDMA)<br />
also appears to be decreasing.<br />
Information from the Department of Justice’s National<br />
Drug Intelligence Center (NDIC) suggests that<br />
the District has a wide variety of drug transportation<br />
options, including an extensive highway system,<br />
three major airports, and rail and bus systems. While<br />
both NDIC and ethnographic information suggest<br />
that traffickers extensively use all of these options,<br />
Washington appears to be a secondary drug distribution<br />
center; most drugs intended for distribution in<br />
DC are distributed first to larger cities, such as New<br />
1 The authors are affiliated with the Center for Substance Abuse Research, College Park, Maryland. Some background material was taken from<br />
prior CEWG reports.<br />
Proceedings of the Community Epidemiology Work Group, Vol. II, January 2005 289
York and Miami (Pach et al. 2002). The street-level<br />
dealing in DC was described as less organized and<br />
more free-flowing than the organized networks in<br />
these larger cities. Information from NDIC suggests<br />
that Colombian drug trafficking organizations continue<br />
to play a major role in supplying opiates and cocaine<br />
to DC criminal groups of Colombian and Dominican<br />
descent.<br />
Data Sources<br />
A number of sources were used to obtain comprehensive<br />
information regarding the drug use trends<br />
and patterns in Washington, DC. Data for this report<br />
were obtained from the sources shown below. In addition,<br />
interviews were conducted with a sample of<br />
substance abuse professionals in the fields of criminal<br />
justice, public health, and recovery.<br />
• Emergency department (ED) drug data were<br />
derived for 2004 from the Drug Abuse Warning<br />
Network (DAWN) Live!, a restricted-access online<br />
query system administered by the Office of<br />
Applied Studies (OAS), Substance Abuse and<br />
Mental Health Services Administration (SAMHSA).<br />
Eligible hospitals in the area totaled 34; hospitals<br />
in the DAWN sample totaled 29; EDs in the<br />
DAWN sample numbered 30. (One hospital has<br />
two EDs.) The data were incomplete, with varying<br />
numbers of EDs reporting each month (see exhibit<br />
1a). Tables reflect cases that were received by<br />
DAWN as of January 18, 2005, 1:13 P.M. ET.<br />
All DAWN cases are reviewed for quality control.<br />
Based on this review, cases may be corrected or<br />
deleted. Therefore, these data are subject to<br />
change. The data are unweighted and are not estimates<br />
for the Washington, DC, metropolitan<br />
area. Data presented in this paper represent drug<br />
reports in drug-related ED visits. Drug reports exceed<br />
the number of visits, since a patient may report<br />
use of multiple drugs (up to six drugs plus alcohol).<br />
These data cannot be compared with<br />
DAWN ED data from 2002 and before, nor can<br />
they be used for comparison with future data accessed<br />
through DAWN Live!. Only weighted<br />
data released by SAMHSA can be used in trend<br />
analysis. A full description of the DAWN system<br />
can be found at the DAWN Web site<br />
.<br />
• Drug-related death data were derived from<br />
DAWN, OAS, SAMHSA, and annual medical examiner<br />
(ME) data for 1997 to 2002.<br />
• Drug treatment data for 2000–2003 were obtained<br />
from the Treatment Episode Data Set<br />
(TEDS), OAS, SAMHSA.<br />
290<br />
<strong>EPIDEMIOLOGIC</strong> TRENDS IN <strong>DRUG</strong> <strong>ABUSE</strong>—Washington, DC<br />
• Arrest, crime, and law enforcement action<br />
data were derived from the Metropolitan Police<br />
Department (MPD) crime statistics and press<br />
releases pertaining to law enforcement action<br />
through December 2004, which can be accessed<br />
at www.mpdc.dc.gov.<br />
• Arrestee urinalysis data were derived from the<br />
District of Columbia Pretrial Services Agency for<br />
adult and juvenile arrestees for 2000 through the<br />
first 8 months of 2004.<br />
• Drug prices and trafficking trends were obtained<br />
from the NDIC Narcotics Digest Weekly<br />
Special Issue: Illicit Drug Prices January 2004-<br />
June 2004 and the Washington-Baltimore High<br />
Intensity Drug Trafficking Area (HIDTA) Washington/Baltimore<br />
Threat Assessment reports released<br />
in 2003 and 2004.<br />
• General information on drug use was derived<br />
from the University of Maryland’s Center for<br />
Substance Abuse Research (CESAR), Drug Early<br />
Warning System (DEWS) County indicators,<br />
DEWS Investigates reports, and CESAR Briefings,<br />
available at www.dewsonline.org and<br />
www.cesar.umd.edu. Additional information was<br />
obtained from the Citywide Comprehensive Substance<br />
Abuse Strategy for the District of Columbia,<br />
2003, and the National Poison Control Center,<br />
2000–2003.<br />
• Census data for the District of Columbia were<br />
derived from the “Council of the District of Columbia;<br />
Subcommittee on Labor, Voting Rights<br />
and Redistricting; Testimony of the Office of<br />
Planning/State Data Center on Bill 14-137, The<br />
Ward Redistricting Amendment Act of 2002,”<br />
available at http/www.planning.D.C.gov/docu<br />
ments/census2002.shtm.<br />
• Test results on drug items analyzed by local<br />
crime lab(s) were obtained from the National Forensic<br />
Laboratory Information System (NFLIS)<br />
for Federal fiscal year (FY) 2004.<br />
• Regional counts on methamphetamine labs<br />
seized were obtained from the El Paso Intelligence<br />
Center’s (EPIC) National Clandestine<br />
Laboratory Seizure Database for 1999–2003.<br />
• Human immunodeficiency virus (HIV) and<br />
acquired immunodeficiency syndrome (AIDS)<br />
data were obtained from the HIV/AIDS Epidemiologic<br />
Profile for the District of Columbia, 2004.<br />
Proceedings of the Community Epidemiology Work Group, Vol. II, January 2005
<strong>DRUG</strong> <strong>ABUSE</strong> PATTERNS AND TRENDS<br />
Cocaine/Crack<br />
Cocaine, particularly in the form of crack, remains<br />
the most serious drug of abuse in the District, accounting<br />
for more ED episodes, adult arrestee positive<br />
drug tests, and drug-related deaths than any other<br />
drug. Only heroin has a higher percentage of treatment<br />
admissions. Cocaine is most often sold at openair<br />
markets in the poorer parts of the city and is decreasing<br />
in price. The NDIC reported that powder<br />
cocaine sold for $27,500–$28,000 per kilogram and<br />
$60–$100 per gram during the first 6 months of 2004.<br />
Crack sells for slightly more: $28,000–$34,000 per<br />
kilogram and $80–$100 per gram. NFLIS data for<br />
Federal FY 2004 show that analyzed drug items were<br />
more likely to test positive for cocaine (39.57 percent)<br />
than for any other drug. Cocaine is smuggled<br />
into the District from New York, Miami, Los Angeles,<br />
or Philadelphia.<br />
Unweighted data accessed from DAWN Live! show<br />
that cocaine was the most frequently involved substance<br />
in reported ED visits (exhibit 1b). Of the<br />
2,728 ED reports involving cocaine in 2004, 61 percent<br />
were male, 74 percent were Black, and 20 percent<br />
were White. Nearly three-quarters (73 percent)<br />
were age 35 or older, 19 percent were age 25 to 34,<br />
and 7 percent were between the ages of 18 and 25.<br />
Nearly one-quarter (21 percent) of the cases involved<br />
patients seeking detoxification, and 3 percent<br />
resulted from suicide attempts. The majority of<br />
these patients (75 percent) were designated “other”<br />
substance abuse cases.<br />
Cocaine-involved deaths totaled 58 in 2002, 27 of<br />
which were single-drug deaths (exhibit 2). These 58<br />
deaths represent an increase from 2001, when the<br />
total was 42, and from 2000, when the total was 54.<br />
In 2003, cocaine was the primary substance of abuse<br />
among approximately 29 percent of treatment admissions<br />
reported to TEDS, with 19 percent reporting<br />
smoked cocaine (referred to as “crack” here) (exhibit<br />
3a). The percentage of primary admissions for nonsmoked<br />
cocaine (referred to as “powder” here) increased<br />
51 percent from 474 admissions in 2001 to<br />
717 in 2002, while those for crack decreased 19 percent<br />
from 1,450 to 1,172 during this time. In 2003,<br />
the number of admissions for crack (912) continued<br />
to decrease. Admissions for powder cocaine decreased<br />
in 2003 for the first time since 2000. Treatment<br />
admissions in 2003 with powder cocaine and<br />
crack cocaine as the primary drugs of abuse were<br />
more likely to be male (65.7 and 64.7 percent, re-<br />
<strong>EPIDEMIOLOGIC</strong> TRENDS IN <strong>DRUG</strong> <strong>ABUSE</strong>—Washington, DC<br />
spectively) than female (exhibit 3b). More than 94<br />
percent of both cocaine admissions groups were<br />
Black, and more than one-half were age 36–45.<br />
Reports from the DC Pretrial Services Agency indicate<br />
that the percentage of adult arrestees testing<br />
positive for cocaine has remained about the same<br />
since 2000 (exhibit 4a). In the first 8 months of 2004,<br />
37 percent of adult arrestees in DC Pretrial Services<br />
tested positive for cocaine; in the first 8 months of<br />
2004, 3.0 percent of juveniles tested positive (exhibit<br />
4b). The percentage of adults testing positive in 2004<br />
appears to be slight increase from 2003.<br />
Heroin<br />
Heroin is one of the three leading drug problems in<br />
the District, along with cocaine and marijuana. The<br />
MPD describes crack as a weekend drug but heroin<br />
as having a more steady ongoing market. The NDIC<br />
reported that heroin sold for $74,000–$110,000 per<br />
kilogram and $100–$110 per gram during the first 6<br />
months of 2004. NFLIS data for Federal FY 2004<br />
show that approximately 13 percent of analyzed drug<br />
items tested positive for heroin.<br />
The number of heroin abusers in the District continued<br />
to increase in 2003, with estimates of 14,000 to<br />
18,000 abusers according to the Washington/Baltimore<br />
HIDTA. Most heroin is from South America,<br />
although Southeast Asian and Southwest African<br />
heroin are still distributed by various groups. Purity<br />
ranged from 20.8 percent (South American) to 22.7<br />
percent pure (Southeast Asian). Northwest Washington<br />
is frequented by White suburban users purchasing<br />
high-purity heroin, while eastern Washington is frequented<br />
by more well-established sellers and longterm<br />
addicts. Eastern Washington experiences higher<br />
levels of trafficking and associated violence.<br />
Unweighted data from DAWN Live! show approximately<br />
1,442 ED heroin reports in 2004 (exhibit 1b).<br />
Nearly two-thirds (65 percent) of these patients were<br />
male; 71 percent were Black and 24 percent were<br />
White. More than three-quarters (78 percent) were<br />
age 35 or older. Nearly one-quarter (21 percent) of<br />
the cases involved individuals seeking detoxification,<br />
and 1 percent resulted from suicide attempts. The<br />
majority of the cases (78 percent) were designated<br />
“other” (exhibit 1b).<br />
Of the 20 heroin-involved deaths in 2002, 4 were<br />
single-drug deaths (exhibit 2). The number of deaths<br />
in 2002 was substantially lower than the totals in<br />
1997 to 2000, but it was an increase from 2001.<br />
Deaths peaked at 53 in 1998.<br />
Proceedings of the Community Epidemiology Work Group, Vol. II, January 2005 291
In 2003, heroin was the primary substance of abuse for<br />
41.9 percent of treatment admissions, a steady increase<br />
from 2000 (exhibit 3a). Of the 2,023 primary heroin<br />
admissions in 2003, approximately 72 percent were<br />
male and 96 percent were Black (exhibit 3b). More<br />
than three-quarters (84 percent) were age 36 to 55.<br />
As with cocaine, reports from the DC Pretrial Services<br />
Agency indicate that the percentage of adult arrestees<br />
testing positive for opiates has remained about the<br />
same since 2001 (exhibit 4a). Ten percent of adult<br />
arrestees tested positive for opiates in 2003 and in the<br />
first 8 months of 2004. Juvenile arrestees were not<br />
tested for opiates during this time (exhibit 4b).<br />
Other Opiates/Narcotics<br />
Unweighted data accessed from DAWN Live! for<br />
2004 show that there were 989 ED reports involving<br />
narcotic analgesics. Of these 989 reports, oxycodone/combinations<br />
accounted for 39 (4 percent)<br />
cases, methadone accounted for 201 (20 percent), and<br />
hydrocodone/combinations accounted for 155 (16<br />
percent). Nearly one-quarter (24 percent) of narcotic<br />
analgesic cases were for adverse reactions, 22 percent<br />
were for overmedication, and 16 percent were for<br />
patients seeking detoxification. Approximately onethird<br />
(32 percent) were designated “other.” One-half<br />
of these patients were male; 24 percent were Black<br />
and 65 percent were White. Nearly two-thirds (65<br />
percent) were age 35 or older.<br />
Twenty-six deaths involving narcotic analgesics were<br />
reported in 2002 (exhibit 2). This is a substantial increase<br />
from the 6 in 2001 and from the 15–22 reported<br />
in the prior 3 years. The number of deaths<br />
involving methadone in the DC metropolitan area<br />
increased from 15 in 2001 to 18 in 2002. Two of the<br />
2002 deaths occurred in DC.<br />
Other opiates were the primary substance of abuse<br />
among 0.3 percent of the 4,832 treatment admissions<br />
in 2003 (exhibit 3a). This percentage has remained<br />
about the same since 2000.<br />
Criminal justice and public health contacts indicate<br />
that OxyContin abuse is low and scattered, but one<br />
contact described it in mid-2003 as emergent in the<br />
economically depressed areas surrounding the District.<br />
Several high-profile cases were conducted in<br />
Northern Virginia. Prescription medications like<br />
OxyContin are available at street markets and are<br />
also obtained through doctor shopping by organized<br />
groups, prescription fraud, and improper prescribing<br />
practices. According to the MPD, OxyContin available<br />
at street markets in northeast DC sells for less<br />
than pills sold in the surrounding suburbs ($0.50 per<br />
292<br />
<strong>EPIDEMIOLOGIC</strong> TRENDS IN <strong>DRUG</strong> <strong>ABUSE</strong>—Washington, DC<br />
milligram vs. $1 per milligram in 2003). Oxycodone<br />
and hydrocodone combined accounted for less than 1<br />
percent of analyzed drug items reported to NFLIS.<br />
Marijuana<br />
Marijuana is widely used in the District, as it is in<br />
many other jurisdictions. Commercial-grade and<br />
high-grade marijuana are available for wide-ranging,<br />
but relatively stable, prices. Most of the marijuana is<br />
transported into the District via package delivery services<br />
by Mexican and Jamaican trafficking organizations,<br />
according to the most recent NDIC and HIDTA<br />
threat assessments. Marijuana is most often smoked<br />
in blunts or joints, which can be combined with rocks<br />
of cocaine or dipped in liquid PCP. Popular types of<br />
marijuana in the District and Maryland suburbs include<br />
“chronic,” “kind bud,” “purple haze,” “blueberry,”<br />
and “orange tulip.” All of these types are reputed<br />
to have high levels of tetrahydrocannabinol<br />
(THC). The NDIC reported that commercial grade<br />
marijuana sold for $1,800 per pound and Hydro sold<br />
for $5,000 per pound during the first 6 months of<br />
2004. Joints sold for $5 to $10 during this time.<br />
NFLIS data for Federal FY 2004 show that approximately<br />
34.8 percent of analyzed drug items tested<br />
positive for marijuana, making marijuana the second<br />
most frequently found drug.<br />
In the data accessed from DAWN Live! for 2004,<br />
there were 1,210 ED reports involving marijuana<br />
(exhibit 1b). More than two-thirds (68 percent) of<br />
these reports involved patients who were male; 51<br />
percent were Black and 35 percent were White.<br />
Twenty-nine percent involved patients age 18–24, 23<br />
percent were patients age 25–34, and 30 percent were<br />
those age 35 and older. Eighteen percent involved<br />
patients age 12–17. Twelve percent of the cases involved<br />
patients seeking detoxification, and 3 percent<br />
resulted from suicide attempts. The majority of the<br />
cases (85 percent) were designated “other.”<br />
Marijuana in combination with other drug(s) was<br />
involved in one death in the District in 2001 and one<br />
in 2000 (exhibit 2). No marijuana-involved deaths<br />
were reported in 2002.<br />
Marijuana was the primary substance of abuse for 7.0<br />
percent of the 2003 treatment admissions, compared<br />
with 6.4 percent in 2001 and 8.0 percent in 2000 (exhibit<br />
3a). More than three-quarters of the 336 primary<br />
marijuana admissions in 2003 were male, and 87.8<br />
percent were Black (exhibit 3b). Approximately onethird<br />
(32.7 percent) of these admissions were age 12<br />
to 17, and more than one-quarter (28.6 percent) were<br />
age 18 to 25.<br />
Proceedings of the Community Epidemiology Work Group, Vol. II, January 2005
The DC Pretrial Services Agency does not test adult<br />
arrestees for marijuana, but more than one-half of<br />
juveniles have tested positive for marijuana each year<br />
between 2000 and 2003 (exhibit 4b). During the first<br />
8 months of 2004, 49 percent of juveniles tested positive<br />
for marijuana.<br />
Phencyclidine<br />
According to the MPD, the number of adult arrests<br />
related to PCP increased 65 percent between 2001 and<br />
2002 (from 142 to 234). According to the Washington/Baltimore<br />
HIDTA 2003 Threat Assessment, PCP<br />
was rapidly becoming the drug of choice at raves and<br />
nightclubs, sometimes used in combination with marijuana<br />
and/or MDMA (ecstasy). In 2004, however, PCP<br />
use began to decline, and its use is still well behind<br />
that of crack and marijuana.<br />
While most PCP is transported to the District from<br />
southern California, the seizure of precursor chemicals<br />
and PCP at a clandestine laboratory in Baltimore<br />
several months ago indicates the drug has been produced<br />
in the region. No clandestine labs have been<br />
identified to date in the District. NFLIS data for Federal<br />
FY 2004 show that approximately 5 percent of<br />
analyzed drug items tested positive for PCP, making<br />
PCP the fourth most frequently found drug (after<br />
cocaine, marijuana, and heroin).<br />
In the unweighted DAWN Live! system in 2004,<br />
there were 275 ED reports involving PCP (exhibit<br />
1b). More than three-quarters (77 percent) were for<br />
patients who were male, and 82 percent were for<br />
Blacks. Nearly one-third (29 percent) involved patients<br />
age 18–24, 32 percent were for those age 25–<br />
34, and 31 percent were for those age 35 and older.<br />
Eight percent were patients age 12–17. Eight percent<br />
of the cases involved patients seeking detoxification,<br />
and 3 percent resulted from suicide attempts. The<br />
majority of the cases (89 percent) were designated<br />
“other.”<br />
There were 27 PCP-related deaths in the metropolitan<br />
area in 2002—8 in the District and 14 in Prince<br />
George’s County, Maryland. The number of deaths in<br />
the District increased from three in 2001.<br />
The National Poison Control Center reports an increase<br />
in reported PCP exposures in the District from<br />
4 in 2000 to 38 in 2002. Although the numbers remain<br />
low, the volume is now at a level last seen in<br />
1988. As of June 12, there were 11 reported exposures<br />
in 2003.<br />
In 2003, PCP was the primary substance of abuse<br />
among 3.9 percent of treatment admissions, an in-<br />
<strong>EPIDEMIOLOGIC</strong> TRENDS IN <strong>DRUG</strong> <strong>ABUSE</strong>—Washington, DC<br />
crease from 2001 (1.8 percent) and 2000 (0.7 percent)<br />
(exhibit 3a). Of the 189 primary PCP admissions<br />
in 2003, nearly two-thirds were male, and<br />
nearly all were Black (exhibit 4b). More than onehalf<br />
(59 percent) were age 18–25, and one-third (33<br />
percent) were 26–35.<br />
Data from the DC Pretrial Services Agency show the<br />
rise in PCP use from the low single digits in the late<br />
1990s to levels in the mid-teens in 2002 and 2003<br />
(exhibit 4a). In 2003, 13.5 percent of adult arrestees<br />
screened for illicit drugs tested positive for PCP,<br />
which is up dramatically from 2.0 percent in 1998.<br />
PCP use declined in the first 8 months of 2004, however,<br />
from 10.6 percent in January to 4 percent in<br />
August. Trend data from 1987 to the present indicate<br />
that PCP use in the juvenile arrestee population has<br />
mirrored that of the adult arrestee population (exhibits<br />
5 and 6), with spikes in the late 1980s, mid-1990s,<br />
and again in the current decade. The number of juveniles<br />
testing positive for PCP decreased from 13.4<br />
percent in 2002 to 2.2 percent in the first 8 months of<br />
2004 (exhibit 4b).<br />
Amphetamine/Methamphetamine<br />
Abuse of amphetamines and methamphetamine does<br />
not appear to be a major problem in the District. Five<br />
deaths involving amphetamines (n=2) or methamphetamine<br />
(n=3) were reported from 1997 to 2002<br />
(exhibit 2). One methamphetamine-involved death<br />
and one amphetamine-involved death were reported<br />
in 2002.<br />
From 2000 through 2003, amphetamines accounted<br />
for less than 1 percent of all treatment admissions in<br />
the District (exhibit 3a). Admissions involving<br />
methamphetamine as a substance of abuse increased<br />
steadily from 1 in 1998 to 47 in 2001 (exhibit 3c). In<br />
2002, there were only 29 methamphetamine mentions,<br />
a decrease of 38 percent.<br />
Amphetamine ED reports in the unweighted data<br />
from DAWN Live! totaled 74 in 2004, and those for<br />
methamphetamine totaled 30. Nearly two-thirds (63<br />
percent) of the methamphetamine patients were<br />
White, and 90 percent were male. One-third of the<br />
methamphetamine patients were age 18–24, 47 percent<br />
were age 25–34, and 17 percent were those age<br />
35 and older. Three percent were patients age 12–17.<br />
More than one-third (37 percent) of the cases involved<br />
individuals seeking detoxification, and 63<br />
percent were designated “other.”<br />
The Washington/Baltimore HIDTA reports that<br />
methamphetamine use is established in the homosexual<br />
community. In addition, detectives from the Met-<br />
Proceedings of the Community Epidemiology Work Group, Vol. II, January 2005 293
opolitan Police Department report that both tablet<br />
and powder methamphetamine are visible in the<br />
Washington, DC, club scenes. NFLIS data for Federal<br />
FY 2004 show that approximately 1 percent of<br />
analyzed drug items tested positive for methamphetamine.<br />
The NDIC reported that methamphetamine<br />
sold for $4,800 per one-half pound and 8-balls<br />
sold for $400 during the first 6 months of 2004.<br />
As in the District, the demand for and availability of<br />
methamphetamine in Maryland is extremely low<br />
compared to other drugs. Methamphetamine users in<br />
Maryland tend to be Caucasian males, particularly<br />
youth, those involved with the rave and club scenes,<br />
and middle- to lower-class blue collar workers.<br />
Methamphetamine use is more prevalent in the rural<br />
Western, Eastern, and Southern parts of the State.<br />
From January 2003 to May 2004, law enforcement<br />
officials reported that there were eight methamphetamine<br />
labs seized in Maryland: two in Garrett,<br />
one in Washington, three in Charles, one in Prince<br />
George's, and one in Cecil Counties.<br />
Although there is little indication that methamphetamine<br />
is an emerging problem in the District, there<br />
have been increases in the number of methamphetamine<br />
labs seized in several of the States surrounding<br />
the District. For example, there were 8 methamphetamine<br />
labs seized in Virginia in 1999, compared<br />
to 23 in 2003. In West Virginia and Pennsylvania, the<br />
number of labs seized over this period increased even<br />
more dramatically, from 3 to 52 and from 1 to 49,<br />
respectively.<br />
The Washington Post reported that nearly all of the<br />
methamphetamine seized in Virginia in 2004 was<br />
found in the Shenandoah Valley; methamphetamine<br />
is the primary drug seized along the north-south corridor<br />
between Winchester and Harrisonburg. A special<br />
report on methamphetamine from the Washington/Baltimore<br />
HIDTA explains this trend further. The<br />
cities of Harrisonburg and Strasburg, in particular,<br />
are highlighted by law enforcement as having a substantial<br />
methamphetamine presence. According to<br />
law enforcement, the primary users in these areas are<br />
rural, White, working-class adults, while the sellers<br />
are primarily Latino. Rival Hispanic criminal groups,<br />
such as MS-13 and South Side Locos in Strasburg,<br />
VA, have collaborated in the sale of methamphetamine<br />
since early 2004, increasing the chance that<br />
methamphetamine may increase in the area because<br />
of the presence of MS-13 in Maryland.<br />
Other Drugs<br />
Abuse of club drugs, such as MDMA, gamma hydroxybutyrate<br />
(GHB), and ketamine, is also relatively<br />
294<br />
<strong>EPIDEMIOLOGIC</strong> TRENDS IN <strong>DRUG</strong> <strong>ABUSE</strong>—Washington, DC<br />
low in the District. MDMA is the most readily available<br />
and frequently abused “club drug,” selling for<br />
$18–$25 per tablet in the fourth quarter of 2002, according<br />
to the DEA Washington Division. The Washington/Baltimore<br />
HIDTA estimated a slightly lower<br />
range for the cost per dosage unit: $10–$20. MDMA<br />
is most frequently used and distributed by teens and<br />
young adults at raves and nightclubs. MDMA is typically<br />
driven to the District from New York, Philadelphia,<br />
Orlando, and Miami by Dominican and Asian<br />
trafficking organizations.<br />
In the unweighted data accessed from DAWN Live!<br />
for 2004, there were 82 ED reports involving<br />
MDMA, 7 involving GHB, and 8 involving lysergic<br />
acid diethylamide (LSD) (exhibit 1b). There was only<br />
one report involving ketamine. MDMA and methylenedioxyamphetamine<br />
(MDA) each accounted for<br />
approximately 1 percent of analyzed drug items<br />
tested through NFLIS in Federal FY 2004. GHB and<br />
ketamine were each found in less than 1 percent of<br />
analyzed drug items tested through NFLIS in Federal<br />
FY 2004. No drug items tested positive for LSD. No<br />
deaths involving club drugs were reported in the<br />
DAWN mortality data from 1997 to 2002 (exhibit 2).<br />
Mentions of benzodiazepines are reported in the<br />
DAWN ED and mortality reports. In the unweighted<br />
DAWN data for 2004, 718 reports involved benzodiazepines.<br />
One death in 2001 was attributed solely to<br />
benzodiazepines (exhibit 2), but in the 1997–2000 time<br />
period, mentions of benzodiazepines in the mortality<br />
data ranged between 10 and 13. In 2002, four deaths<br />
were attributed to multiple drugs, including benzodiazepines.<br />
In the 2004 unweighted DAWN Live! system, there<br />
were 2,438 reports involving alcohol. DAWN mortality<br />
data show that mentions of deaths involving alcohol<br />
in combination with other drugs decreased from<br />
29 in 1997 to 17 in 2001, with a peak of 44 in 1998.<br />
In 2002, however, alcohol-involved deaths more than<br />
doubled to 37 deaths (exhibit 2). In 2003, primary<br />
alcohol admissions accounted for approximately 18<br />
percent of all treatment admissions, a slight decline<br />
from 2000 and 2001 (exhibit 3a).<br />
INFECTIOUS DISEASES RELATED TO <strong>DRUG</strong> <strong>ABUSE</strong><br />
The diagnosis of AIDS cases increased rapidly from<br />
1982 to 1993, when they peaked at 1,342 cases. The<br />
number of cases decreased 49 percent from 1993 to<br />
2001, but cases increased 37.5 percent in 2002. There<br />
were 943 diagnosed cases in 2002, the last year for<br />
which data are available (exhibit 7). Males accounted<br />
for 70 percent of cases diagnosed in 2002. Almost<br />
three-quarters of the diagnoses in 2002 occurred<br />
Proceedings of the Community Epidemiology Work Group, Vol. II, January 2005
among 30–49-year-olds. Almost two-thirds (62 percent)<br />
of people in DC diagnosed with AIDS in 2002<br />
were African-American, and about 21 percent had a<br />
history of injection drug use. The rate of AIDS deaths<br />
decreased from 47 per 100,000 in 1998 to 25 per<br />
100,000 in 2003.<br />
REFERENCE<br />
Pach, A.; Brown, J.; Hendrickson, J.; Odom, T.; and<br />
Nemes, S. “Patterns and Trends of Drug Abuse<br />
<strong>EPIDEMIOLOGIC</strong> TRENDS IN <strong>DRUG</strong> <strong>ABUSE</strong>—Washington, DC<br />
in Washington, DC.” Epidemiologic Trends in<br />
Drug Abuse, Volume II: Proceedings of the<br />
Community Epidemiology Work Group June<br />
2002. Washington, DC: National Institute on<br />
Drug Abuse, 2002.<br />
For inquiries concerning this report, please contact Eric Wish, Ph.D., Director, Center for Substance Abuse Research, University of Maryland,<br />
4321 Hartwick Road, Suite 501, College Park, MD 20740, Phone: 301-405-9770, Fax: 301-403-8342, E-mail: .<br />
Proceedings of the Community Epidemiology Work Group, Vol. II, January 2005 295
296<br />
<strong>EPIDEMIOLOGIC</strong> TRENDS IN <strong>DRUG</strong> <strong>ABUSE</strong>—Washington, DC<br />
Exhibit 1a. Data Completeness for Washington, DC, Metropolitan Area DAWN Emergency Departments<br />
(n=30), 1 by Month: 2004<br />
Data<br />
Number of EDs by Month<br />
Completeness Jan-04 Feb-04 Mar-04 Apr-04 May-04 Jun-04 Jul-04 Aug-04 Sep-04 Oct-04 Nov-04 Dec-04<br />
Basically<br />
Complete 1<br />
9 11 11 12 10 11 13 8 8 9 9 7<br />
Partially<br />
Complete 2<br />
4 2 2 1 3 2 2 5 3 3 3 2<br />
Incomplete 3 0 0 1 0 0 1 0 2 0 2 1 4<br />
No Data<br />
Reported<br />
17 17 16 17 17 16 15 15 19 16 17 17<br />
Total EDs in<br />
Sample 4<br />
30 30 30 30 30 30 30 30 30 30 30 30<br />
1<br />
Total eligible hospitals in area = 34; Hospitals in DAWN sample = 29; Hospitals not in DAWN Sample = 5. Tables reflect cases that have been<br />
received by DAWN as of 1/18/05, 1:13 P.M. ET.<br />
2 3 4 5<br />
90%+ Complete; 50% to 89% Complete; Less than 50% Complete; Some hospitals in the DAWN sample have more than one emergency<br />
department. All DAWN cases are reviewed for quality control. Based on this review, cases may be corrected or deleted. Therefore, these data<br />
are subject to change.<br />
SOURCE: DAWN Live!, OAS, SAMHSA, updated 1/18/2005<br />
Exhibit 1b. Major Substances of Abuse in ED Reports in the Washington, DC, Metropolitan Area, by Substance<br />
(Unweighted 1 ): 2004<br />
Cocaine<br />
Alcohol<br />
Heroin<br />
Marijuana<br />
PCP<br />
Stimulants<br />
MDMA<br />
Inhalants<br />
Misc. Halludinogens<br />
Combinations NTA<br />
LSD<br />
GHB<br />
Ketamine<br />
18<br />
14<br />
8<br />
7<br />
1<br />
82<br />
55<br />
104<br />
275<br />
1 The unweighted data are from 11 to 15 Washington, DC, EDs reporting to DAWN. All DAWN cases are reviewed for quality control.<br />
Based on this review, cases may be corrected or deleted and, therefore, are subject to change.<br />
SOURCE: DAWN Live!, OAS, SAMHSA, updated 1/18/2005, 1:13 pm ET.<br />
1,210<br />
1,442<br />
2,438<br />
2,728<br />
Proceedings of the Community Epidemiology Work Group, Vol. II, January 2005
<strong>EPIDEMIOLOGIC</strong> TRENDS IN <strong>DRUG</strong> <strong>ABUSE</strong>—Washington, DC<br />
Exhibit 2. Drug-Related Deaths in Washington, DC: 1997–2002<br />
Drug 1997 1998 1999 2000 2001 2002<br />
Single-<br />
Drug<br />
Deaths,<br />
2002<br />
Alcohol-in-Combination 29 44 37 26 17 37 N/A<br />
Cocaine 33 63 64 54 42 58 27<br />
Heroin/Morphine 41 53 41 36 15 20 4<br />
Marijuana – – – 1 1 _ _<br />
Amphetamines – – – 1 – 1 _<br />
Methamphetamine – 1 – 1 – 1 _<br />
Club Drugs 1 – – – – – _ _<br />
Hallucinogens 2 1 – 2 1 3 8 2<br />
Inhalants – – – – – _ _<br />
Narcotic Analgesics 3 6 22 15 20 6 26 6<br />
Other Analgesics 2 3 3 2 1 1 1<br />
Benzodiazepines 13 13 11 10 1 4 _<br />
Antidepressants 4 14 11 4 1 _ _<br />
All Other 3 7 30 18 10 1 5 1<br />
Total Drug Deaths 79 145 121 100 53 91 41<br />
Total Drug Mentions 136 243 202 166 88 161 41<br />
Total Deaths Certified 1,414 1,607 1,763 1,751 1,582 1,754 N/A<br />
1<br />
Includes ecstasy (MDMA), ketamine, GHB-GBL, and Rohypnol.<br />
2<br />
Includes PCP, LSD, and miscellaneous hallucinogens.<br />
3<br />
Not tabulated above.<br />
SOURCES: DAWN 2002 9/2003 Update, OAS, SAMHSA<br />
Exhibit 3a. Percentages of Treatment Admissions in Washington, DC, by Year: 2000–2003<br />
Drug 2000 2001 2002 2003<br />
Total Admissions (N) (6,025) (5,755) (5,659) (4,832)<br />
Powder Cocaine 7.4 8.2 12.7 9.6<br />
Crack Cocaine 27.0 25.2 20.7 18.9<br />
Heroin 35.2 37.9 39.2 41.9<br />
Other Opiates 0.2 0.4 0.3 0.3<br />
Marijuana 8.0 6.4 4.8 7.0<br />
PCP 0.7 1.8 3.6 3.9<br />
Alcohol 21.1 19.3 18.4 18.2<br />
Amphetamines (includes<br />
methamphetamine)<br />
0.2 0.6 0.3 0.2<br />
SOURCE: TEDS, SAMHSA<br />
Proceedings of the Community Epidemiology Work Group, Vol. II, January 2005 297
298<br />
<strong>EPIDEMIOLOGIC</strong> TRENDS IN <strong>DRUG</strong> <strong>ABUSE</strong>—Washington, DC<br />
Exhibit 3b. Demographic Characteristics of Treatment Admissions in Washington, DC, by Selected Drugs<br />
and Percent: 2003 1<br />
Drug<br />
Powder Cocaine<br />
Crack<br />
Cocaine<br />
Heroin Marijuana PCP<br />
Amphetamines<br />
3<br />
(N=) (466) (912) (2,023) (336) (189) (10)<br />
Gender<br />
Male<br />
Female<br />
Race/Ethnicity<br />
Black<br />
White<br />
Other 2<br />
Age Group<br />
17 and younger<br />
18–25<br />
26–35<br />
36–45<br />
46–55<br />
56 and older<br />
65.7<br />
34.3<br />
94.4<br />
0.9<br />
4.8<br />
0.0<br />
4.5<br />
15.8<br />
54.5<br />
21.9<br />
3.2<br />
64.7<br />
35.3<br />
94.8<br />
1.2<br />
4.0<br />
0.2<br />
2.7<br />
18.3<br />
58.2<br />
18.0<br />
2.4<br />
1<br />
May not add up to 100 percent due to rounding.<br />
2<br />
Primarily Hispanic or Latino.<br />
3<br />
Amphetamines includes methamphetamines, Benzedrine, Dexedrine, Preludin, Ritalin, and any other amines and related drugs.<br />
SOURCE: TEDS, SAMHSA<br />
Exhibit 3c. Numbers of Treatment Admissions in Washington, DC, with Methamphetamine Mentioned as a<br />
Substance of Abuse: 1994–2002<br />
0 0<br />
SOURCE: TEDS, SAMHSA<br />
2 2<br />
1<br />
72.0<br />
28.0<br />
95.8<br />
1.8<br />
2.3<br />
0.0<br />
1.7<br />
9.9<br />
45.6<br />
38.4<br />
4.4<br />
75.9<br />
24.1<br />
87.8<br />
0.9<br />
11.3<br />
32.7<br />
28.6<br />
20.8<br />
12.2<br />
5.1<br />
0.6<br />
63.0<br />
37.0<br />
98.4<br />
0.0<br />
1.6<br />
2.1<br />
55.0<br />
32.8<br />
6.3<br />
2.7<br />
1.1<br />
1994 1995 1996 1997 1998 1999 2000 2001 2002<br />
10<br />
19<br />
90.0<br />
10.0<br />
10.0<br />
90.0<br />
0.0<br />
0.0<br />
10.0<br />
30.0<br />
60.0<br />
0.0<br />
0.0<br />
Proceedings of the Community Epidemiology Work Group, Vol. II, January 2005<br />
47<br />
29
<strong>EPIDEMIOLOGIC</strong> TRENDS IN <strong>DRUG</strong> <strong>ABUSE</strong>—Washington, DC<br />
Exhibit 4a. Percentages of Adult Arrestees in Washington, DC, Testing Positive for Selected Drugs:<br />
2000–2004<br />
Drug 2000<br />
2001 2002 2003<br />
(N=) (15,630) (17,350) (17,952) (17,742) (13,617)<br />
Cocaine 33.6 34.2 35.2 34.8 36.8<br />
PCP 9.3 12.7 14.2 13.5 6.5<br />
Opiates 9.5 10.5 10.5 10.0 9.9<br />
Any Drug 43.2 46.1 48.0 47.3 44.1<br />
1 2004 data include urines tested through August 2004.<br />
SOURCE: District of Columbia Pretrial Services Agency<br />
Proceedings of the Community Epidemiology Work Group, Vol. II, January 2005 299<br />
2004 1<br />
Exhibit 4b. Percentages of Juvenile Arrestees in Washington, DC, Testing Positive for Selected Drugs:<br />
2000–2004<br />
2004 1<br />
Drug 2000 2001 2002 2003<br />
(N=) (2,162) (2,165) (1,896) (1,899) (1,379)<br />
Marijuana 60.7 56.9 54.2 50.8 48.2<br />
Cocaine 5.7 4.8 5.5 3.7 3.0<br />
PCP 9.8 13.5 13.4 11.1 2.2<br />
Any Drug 62.0 59.1 56.4 53.1 48.7<br />
1 2004 data include urines tested through August 2004.<br />
SOURCE: District of Columbia Pretrial Services Agency
<strong>EPIDEMIOLOGIC</strong> TRENDS IN <strong>DRUG</strong> <strong>ABUSE</strong>—Washington, DC<br />
Exhibit 5. Percentages of Washington, DC, Adult Arrestees Testing Positive for Any Drug, Cocaine, PCP,<br />
and Opiates: 1984–2004 1<br />
300<br />
80%<br />
70%<br />
60%<br />
50%<br />
40%<br />
30%<br />
20%<br />
10%<br />
0%<br />
1 Data for 2004 are through August.<br />
SOURCE: Adapted by CESAR from data from the District of Columbia Pretrial Services Agency.<br />
Exhibit 6. Percentages of Washington, DC, Juvenile Arrestees Testing Positive for Any Drug, Marijuana,<br />
PCP, and Opiates: 1987–2004 1<br />
80%<br />
70%<br />
60%<br />
50%<br />
40%<br />
30%<br />
20%<br />
10%<br />
0%<br />
1984<br />
1988<br />
1986<br />
1990<br />
1988<br />
1990<br />
1992<br />
1 Data for 2004 are through August.<br />
SOURCE: Adapted by CESAR from data from the District of Columbia Pretrial Services Agency.<br />
1992<br />
1994<br />
1994<br />
1996<br />
1996<br />
1998<br />
Any Positive<br />
Cocaine<br />
Opiates<br />
PCP<br />
Any Positive<br />
Cocaine<br />
Marijuana<br />
PCP<br />
1998<br />
Proceedings of the Community Epidemiology Work Group, Vol. II, January 2005<br />
2000<br />
2000<br />
2002<br />
2002<br />
2004<br />
2004*
<strong>EPIDEMIOLOGIC</strong> TRENDS IN <strong>DRUG</strong> <strong>ABUSE</strong>—Washington, DC<br />
Exhibit 7. District of Columbia Diagnosed AIDS Cases by Gender, Race/Ethnicity, Age, and Exposure:<br />
1981–2002<br />
Characteristic<br />
1998 1999 2000 2001 2002<br />
Cumulative<br />
1981–2002<br />
# % # % # % # % # % # %<br />
Gender<br />
Male 719 72 526 74 471 69 468 68 658 70 12,098 80<br />
Female 278 28 188 26 210 31 218 32 285 30 3,034 20<br />
Total Cases<br />
Race/Ethnicity<br />
997 715 681 686 943 15,132<br />
White 112 11 88 12 68 10 59 9 46 5 2,962 20<br />
Black 837 84 591 83 562 83 567 83 584 62 11,286 75<br />
Hispanic 42 4 27 4 32 5 28 4 22 2 485 3<br />
Asian/Pacific Islander
International<br />
Report
<strong>EPIDEMIOLOGIC</strong> TRENDS IN <strong>DRUG</strong> <strong>ABUSE</strong>—SISVEA<br />
Update of the Epidemiological Surveillance System of<br />
Addictions (SISVEA) in Mexico: January–June 2004<br />
Roberto Tapia-Conyer, Patricia Cravioto, Pablo Kuri, Mario Cortés, and Fernando Galván 1<br />
ABSTRACT<br />
In the first half of 2004, cocaine remained the most<br />
common primary drug of use among patients at<br />
government treatment centers. At nongovernment<br />
treatment centers, however, alcohol was the most<br />
common current primary drug of abuse. Information<br />
from the Juvenile Detention Centers shows that<br />
34.4 percent of the 5,393 juveniles arrested during<br />
the first half of 2004 used marijuana. According to<br />
medical examiners, the abuse of alcohol was involved<br />
in 85.2 percent of the drug-related deaths.<br />
INTRODUCTI<strong>ON</strong><br />
The Epidemiological Surveillance System of Addictions<br />
(SISVEA) monitors the use and abuse of tobacco,<br />
alcohol, and medical and illegal drugs, as well<br />
as their effects on morbidity, mortality, and juvenile<br />
arrests. Created in 1990 by the General Directorate of<br />
Epidemiology, SISVEA initially operated in eight<br />
cities located on Mexico’s northern border; since<br />
then, it has monitored drug consumption throughout<br />
Mexico. Currently, SISVEA provides information on<br />
31 States in Mexico.<br />
Initially, SISVEA was based conceptually and operationally<br />
on three strategies, which have evolved and<br />
been reinforced to form the present system. The five<br />
main indicators of the present system give continuity<br />
to the original model. The indicators and data sources<br />
are shown below:<br />
• Information on consumption of tobacco, alcohol,<br />
and medical and illegal drugs is obtained from<br />
treatment centers.<br />
• Data on diseases and accidental mortality are<br />
provided by emergency rooms.<br />
• Information on mortality among drug users is<br />
provided by coroners’ offices.<br />
• Statistics on crimes against health are obtained<br />
from law enforcement agencies.<br />
1 The authors are affiliated with the Ministry of Health of Mexico.<br />
• General information on consumption of tobacco,<br />
alcohol, and medical and illegal drugs in the<br />
general population and risk groups is obtained<br />
from surveys and qualitative studies.<br />
Data Sources for This Update<br />
The data sources used to construct different indicators<br />
are described below:<br />
• Treatment information covers the characteristics<br />
and consumption patterns related to the first<br />
drug of use and primary drug of use. These data<br />
were obtained from government treatment centers<br />
(GTCs or Centers of Juvenile Integration)<br />
and nongovernment treatment centers (NGCs)<br />
that participated in SISVEA cities in the first 6<br />
months of 2004.<br />
• Drug consumption data is gathered from the<br />
general population and the risk groups. Data on<br />
juvenile infractors was reported by the Juvenile<br />
Detention Centers for the first 6 months of 2004.<br />
• Medical examiner (ME) data cover drugrelated<br />
deaths in the first half of 2004. The data<br />
cover accidental and violent deaths (homicides<br />
or suicides) in cases in which drug abuse may be<br />
the direct cause of death or a contributing factor.<br />
<strong>DRUG</strong> <strong>ABUSE</strong> PATTERNS AND TRENDS<br />
Marijuana<br />
According to GTCs, marijuana users during the first<br />
half of 2004 were mostly male (92.1 percent); 27.1<br />
percent were age 15–19; 46.0 percent had only a<br />
middle school education; 61.4 percent were single;<br />
and 49.0 percent came from a middle-low socioeconomic<br />
level (exhibit 1). The age of onset for 49.1<br />
percent of marijuana users occurred between 10 and<br />
14 years of age, and for 43.4 percent between 15 and<br />
19 years of age. Of this user group, 66.1 percent<br />
reported daily use.<br />
Proceedings of the Community Epidemiology Work Group, Vol. II, January 2005 305
Among GTC patients, marijuana was the second<br />
most common drug of first use (11.6 percent); as a<br />
primary drug, marijuana also ranked second (17.7<br />
percent) (exhibit 2).<br />
Based on GTC data on the natural history of marijuana<br />
use, an average of 10.4 percent of patients used<br />
only marijuana at treatment entry; 89.6 percent had<br />
progressed to a second drug, usually alcohol (32.9<br />
percent) or tobacco (21.4 percent) (exhibit 3). Of the<br />
multiple drug users in this group, 84.8 percent advanced<br />
to a third drug, usually alcohol (24.1 percent),<br />
tobacco (21.2 percent), or cocaine (20.4 percent).<br />
Among patients at NGCs, most marijuana users were<br />
male (95.5 percent); 23.1 percent were age 35 and<br />
older; 41.1 percent had a middle school education;<br />
and 59.4 percent were single (exhibit 4). The age of<br />
onset for marijuana use among 48.0 percent of these<br />
patients was between 10 and 14; 85.9 percent reported<br />
daily use.<br />
Marijuana ranked second (26.7 percent) as the drug<br />
of first use for NGC admissions in the first half of<br />
2004; as a primary drug, it was fourth most common<br />
(10.4 percent) (exhibit 5).<br />
Natural history data on marijuana consumption reported<br />
by NGCs in the first half of 2004 show that<br />
12.2 percent of patients were monodrug users at<br />
treatment entry; the remaining 87.8 percent had progressed<br />
to a second drug, mainly cocaine (26.1 percent)<br />
and alcohol (17.3 percent) (exhibit 3). Of this<br />
NGC group, 74.4 percent were already using a third<br />
drug at the time of treatment entry, mainly cocaine<br />
(22.8 percent), heroin (18.3 percent), and crystal<br />
methamphetamine (14.8 percent).<br />
Information from the Juvenile Detention Centers<br />
shows that 34.4 percent of the 5,393 juveniles arrested<br />
during the first half of 2004 used marijuana<br />
(exhibit 6). Most of this population were male (95.2<br />
percent); 50.7 percent had an elementary school education;<br />
40.3 percent were subemployed; 37.1 percent<br />
had a tattoo; and 31.5 percent were gang members.<br />
Nearly one-third (31.5 percent) of the offenses were<br />
committed under intoxication, and 42.8 percent of the<br />
offenses were robberies.<br />
ME data indicated that 3.2 percent of the intoxication<br />
deaths reported were associated with marijuana; this<br />
decedent group was primarily male (91.2 percent).<br />
More than one-quarter (26.5 percent) were age 20–<br />
24, and 20.6 percent were age 40 or older (exhibit 7).<br />
The main cause of death in these cases was asphyxia<br />
(19.4 percent), followed by firearms (16.1 percent).<br />
306<br />
<strong>EPIDEMIOLOGIC</strong> TRENDS IN <strong>DRUG</strong> <strong>ABUSE</strong>—SISVEA<br />
More than one-half of these deaths occurred either on<br />
the street (33.3 percent) or at home (21.2 percent).<br />
Inhalants<br />
Inhalant users attending GTCs were mostly male<br />
(85.1 percent) and age 15–19 (31.3 percent) (exhibit<br />
1). Most patients had a middle school education (55.3<br />
percent); 76.4 percent were single; and 55.1 percent<br />
were from a middle-low socioeconomic level (exhibit<br />
1). Most began to use inhalants between ages 10 and<br />
14 (65.9 percent); 42.2 percent used inhalants daily;<br />
and 41.3 percent used them once a week.<br />
During the first half of 2004, inhalants ranked as the<br />
third most commonly reported drug of onset (7.4<br />
percent) and fourth as primary drug (10.6 percent)<br />
among GTC patients (exhibit 2).<br />
GTC data on the natural history of inhalants use show<br />
that 25.7 percent of inhalant patients were monodrug<br />
users when entering treatment and that 74.3 percent<br />
were already using a second drug, mainly marijuana<br />
(33.8 percent), alcohol (22.4 percent), or tobacco<br />
(20.9 percent). Of the multiple drug user group, 81.0<br />
percent had used a third drug, mainly alcohol (27.9<br />
percent), marijuana (20.0 percent), tobacco (17.9<br />
percent), or cocaine (13.3 percent) (exhibit 8).<br />
NGCs reported that of the 2,243 patients who used<br />
inhalants in the first 6 months of 2004, most were<br />
male (92.4 percent), and 31.6 percent were age 15–19<br />
(exhibit 4). More than one-half (58.7 percent) had an<br />
elementary school education; 71.7 percent were single;<br />
58.8 percent began to use inhalants between ages<br />
10 and 14; and 89.4 percent reported daily use.<br />
Among NGC patients, inhalants ranked third (11.0<br />
percent) as drug of onset and fifth (8.1 percent) as a<br />
primary drug of abuse (exhibit 5).<br />
As for the natural history of drug use for inhalant<br />
users, 58.8 percent of the NGC patients had progressed<br />
to a second drug by the time of treatment<br />
entry, mainly marijuana (52.3 percent), alcohol (15.5<br />
percent), and other inhalants (8.4 percent). Of this<br />
group, 74.1 percent used a third drug, usually cocaine<br />
(25.6 percent), marijuana (16.1 percent), tranquilizers<br />
(12.2 percent), or heroin (8.6 percent) (exhibit 8).<br />
According to Juvenile Detention Centers, 13.9 percent<br />
of juvenile arrestees used inhalants (exhibit 6).<br />
Most were male (94.8 percent), had an elementary<br />
school education (61.4 percent), and were subemployed<br />
(45.3 percent). More than one-third (39.4<br />
percent) had tattoos, and 40.5 percent belonged to a<br />
Proceedings of the Community Epidemiology Work Group, Vol. II, January 2005
gang. Of these arrestees, 37.8 percent committed the<br />
offense while intoxicated, and robbery was the most<br />
common offense (46.5 percent).<br />
Alcohol<br />
Of the 10,761 GTC patients who attended treatment<br />
during the first 6 months of 2004, 3,582 were abusing<br />
alcohol. The majority (82.6 percent) were male; 24.0<br />
percent were age 15–19; and 20.9 percent were age<br />
35 or older (exhibit 1). Many had a middle school<br />
education (41.8 percent); 54.9 percent were single;<br />
and 54.5 percent were from a middle-low socioeconomic<br />
level. Almost one-half (47.0 percent) began to<br />
use alcohol between ages 15 and 19; 48.2 percent<br />
reported weekly use; and 31.3 percent reported using<br />
alcohol 1–3 times per month.<br />
Alcohol was the most commonly reported drug of first<br />
use (33.3 percent) among GTC patients, but it ranked<br />
third (17.4 percent) as a primary drug (exhibit 2).<br />
Among GTC patients whose drug of first use was<br />
alcohol, 91.4 percent had progressed to using a second<br />
drug by the time of treatment entry, usually tobacco<br />
(57.8 percent), marijuana (17.3 percent), or<br />
cocaine (13.2 percent) (exhibit 9). Of this multiple<br />
drug user group, 74.6 percent reported using a third<br />
drug, usually marijuana (33.1 percent), cocaine (26.6<br />
percent), or inhalants (10.5 percent).<br />
NGCs reported that most of the 6,123 patients who<br />
abused alcohol during the first half of 2004 were male<br />
(91.6 percent) (exhibit 4); 42.2 percent were age 35 or<br />
older; 33.3 percent had only an elementary school<br />
education; 42.6 percent were single; and many (46.4<br />
percent) started to use alcohol between ages 15 and 19.<br />
The majority (72.0 percent) reported daily alcohol use,<br />
and 21.9 percent used alcohol once a week.<br />
Among NGC patients, alcohol ranked first as the<br />
drug of first use (30.1 percent) and first as a current<br />
drug of use (19.8 percent) (exhibit 5).<br />
Natural history data on alcohol use among NGC<br />
patients show that 29.6 percent were monodrug users<br />
upon treatment entry, while the remaining 70.4 percent<br />
had progressed to a second drug, typically marijuana<br />
(36.9 percent), cocaine (21.4 percent), or tobacco<br />
(15.5 percent). The 64.5 percent who had progressed<br />
to using a third drug were most likely to use<br />
cocaine (32.8 percent), marijuana (17.3 percent), or<br />
crystal methamphetamine (13.9 percent) (exhibit 9).<br />
Among juvenile infractors, 13.3 percent reported<br />
alcohol abuse (exhibit 6). Most (91.5 percent) were<br />
male; 45.1 percent had an elementary school educa-<br />
<strong>EPIDEMIOLOGIC</strong> TRENDS IN <strong>DRUG</strong> <strong>ABUSE</strong>—SISVEA<br />
tion; 38.8 percent were subemployed; 30.7 percent<br />
had tattoos; and 26.1 percent were gang members.<br />
More than one-third of the juveniles (46.4 percent)<br />
committed the offense while intoxicated, and robbery<br />
(40.7 percent) was the most common offense.<br />
According to medical examiners, the abuse of alcohol<br />
was involved in 85.2 percent of the drug-related<br />
deaths. Most of these decedents were male (93.8<br />
percent), and 40.4 percent were age 40 or older (exhibit<br />
7). The main cause of death was asphyxia (19.6<br />
percent), followed by traffic accidents (17.8 percent).<br />
The most common place where deaths occurred was<br />
on the street (37.0 percent) or at home (30.4 percent).<br />
Cocaine<br />
GTCs reported that cocaine users in the first half of<br />
2004 were mostly male (78.6 percent) (exhibit 1).<br />
More than one-quarter (26.3 percent) were age 15–19<br />
or 20–24; 45.6 percent had a middle school education;<br />
51.8 percent were single; and 26.7 percent were<br />
married. More than one-half (56.9 percent) were<br />
members of a middle-low socioeconomic level, and<br />
49.3 percent initiated cocaine use between ages 15<br />
and 19. Forty-two percent used cocaine once a week,<br />
and 35.8 percent used the drug daily.<br />
Among GTC patients, cocaine ranked fourth as the<br />
first drug of use (3.8 percent) and first as primary<br />
drug (25.8 percent) (exhibit 2).<br />
Natural history data on cocaine use among GTC patients<br />
show that 25.7 percent were monodrug users<br />
upon treatment entry; the remainder were already<br />
using a second drug, usually alcohol (31.3 percent),<br />
marijuana (20.0 percent), or tobacco (18.3 percent). Of<br />
the multiple drug users, 69.3 percent were using a third<br />
drug, usually alcohol (28.4 percent), tobacco (26.9<br />
percent), or marijuana (19.7 percent) (exhibit 10).<br />
Of the cocaine users who attended NGCs, 91.3 percent<br />
were male; 23.6 percent were age 20–24; 39.5<br />
percent had a middle school education; 31.5 percent<br />
had an elementary school education; and 50.4 percent<br />
were single (exhibit 4). Many (43.5 percent) started<br />
to use cocaine between ages 15 and 19; 72.9 percent<br />
reported daily use; and 21.4 percent reported weekly<br />
use of cocaine.<br />
Cocaine ranked fourth as the drug of onset (6.3 percent)<br />
among the NGC cases and second as current<br />
drug (18.7 percent) (exhibit 5).<br />
Natural history data on cocaine abuse among NGC<br />
patients in the first half of 2004 show that 36.2 percent<br />
were monodrug users upon entry to treatment.<br />
Proceedings of the Community Epidemiology Work Group, Vol. II, January 2005 307
Others (63.8 percent) were using a second drug, usually<br />
marijuana (26.1 percent), crystal methamphetamine<br />
(20.9 percent), alcohol (15.4 percent), or heroin<br />
(12.3 percent). Of the multiple drug using group, 46.3<br />
percent used a third drug, mainly crystal methamphetamine<br />
(23.9 percent), marijuana (15.2 percent),<br />
or alcohol (14.6 percent) (exhibit 10).<br />
Juvenile Detention Centers reported that 15.2 percent<br />
of the younger arrestees in the first half of 2004 used<br />
cocaine (exhibit 6). Most were male (94.4 percent);<br />
54.3 percent had an elementary school education; 39.5<br />
percent were subemployed; 35.5 percent had tattoos;<br />
and only 32.5 percent were gang members. Less than<br />
one-third of these juvenile infractors (29.3 percent)<br />
committed the offense under intoxication, and robbery<br />
was the most common offense (48.5 percent).<br />
Heroin<br />
According to GTCs, heroin patients in the first half of<br />
2004 were all males. More than one-quarter (27.3<br />
percent) were age 20–24; 18.2 percent were age 15–<br />
19; 90.0 percent were equally divided between having<br />
an elementary, middle school, and high school<br />
education; and 27.3 percent were single (exhibit 1).<br />
Sixty percent came from a middle low socioeconomic<br />
background, and 30.0 percent were from a low socioeconomic<br />
level. The age of onset for 45.5 percent of<br />
the heroin users occurred between the ages of 10 and<br />
14. All reported daily use.<br />
Of the 11 GTC patients attending treatment during<br />
the first half of 2004, only 0.1 percent reported heroin<br />
as their drug of onset; as a primary drug it ranked<br />
fifth (2.4 percent).<br />
According to NGC data, most heroin patients were<br />
male (92.2 percent); 39.1 percent were age 35 and<br />
older; 40.5 percent had only an elementary school<br />
308<br />
<strong>EPIDEMIOLOGIC</strong> TRENDS IN <strong>DRUG</strong> <strong>ABUSE</strong>—SISVEA<br />
education; and 54.7 percent were single. The most<br />
common age of first use of heroin among these patients<br />
was 15–19 (38.6 percent); 95.2 percent reported<br />
daily use.<br />
Since 1994, heroin as drug of onset among NGC<br />
patients has been increasing. In the first half of 2004,<br />
2.1 percent of NGC patients reported heroin as a drug<br />
of first use. As the primary drug of use, heroin ranked<br />
third among NGC patients (18.3 percent).<br />
Juvenile Detention Centers reported that 0.4 percent<br />
of the juveniles arrested during the first half of 2004<br />
used heroin (exhibit 6). Most were male (95.5 percent);<br />
57.1 percent had an elementary school education;<br />
36.4 percent were unemployed; 50.0 percent had<br />
tattoos; and 45.5 percent were gang members. Of the<br />
heroin arrestees, 42.9 percent of their offenses were<br />
committed under intoxication, and robbery was the<br />
most common offense (59.1 percent).<br />
C<strong>ON</strong>CLUSI<strong>ON</strong>S<br />
SISVEA has been strengthened and currently includes<br />
all areas in Mexico. The types of drugs reported varied<br />
according to different sources of information. Marijuana<br />
and cocaine increased among the Juvenile Detention<br />
Center population. GTCs reported a slight<br />
increase in the use of cocaine among female patients.<br />
Prior to 1998, marijuana was the most frequently reported<br />
drug in NGCs. Beginning in 1999, however,<br />
surveillance data show a slight increase in alcohol<br />
consumption among NGC patients; alcohol currently<br />
ranks first in consumption reports. Alcohol appears as<br />
the greatest drug of impact during the first half of 2004<br />
and ranked slightly above cocaine and heroin. An<br />
increase in alcohol use was also observed at GTCs as<br />
both the drug of onset and the drug of impact; it ranked<br />
above cocaine as the drug of impact.<br />
For inquiries concerning this report, please contact Roberto Tapia-Conyer, Ministry of Health of Mexico, Cerro de Macuiltepec #83, Col.<br />
Campestre Churubusco, 04200, Delagacion Coyoacan, D.F., Mexico City, Phone: 525-55-53-7145, Fax: 525-55-53-7292, E-mail:<br />
rtapia@mail.ssa.gob.mx.<br />
Proceedings of the Community Epidemiology Work Group, Vol. II, January 2005
<strong>EPIDEMIOLOGIC</strong> TRENDS IN <strong>DRUG</strong> <strong>ABUSE</strong>—SISVEA<br />
Exhibit 1. Demographic Characteristics of GTC Patients, by First Drug of Use and Percent:<br />
January–June 2004<br />
Total Marijuana Inhalants Alcohol Cocaine 1 Demographic<br />
Heroin Tobacco<br />
Characteric N=10,761 n=1,250 n=799 n=3,582 n=404 n=11 n=4,460<br />
Gender<br />
Age<br />
Male 82.4 92.1 85.1 82.6 78.6 100.0 79.3<br />
Female 17.6 7.9 14.9 17.4 21.4 0.0 20.7<br />
5–14 years 8.7 6.6 28.6 7.0 6.5 0.0 7.2<br />
15–19 26.8 27.1 31.3 24.0 26.3 18.2 28.3<br />
20–24 18.5 19.7 15.3 18.9 26.3 27.3 17.7<br />
25–29 15.1 18.0 11.0 16.5 22.1 9.1 13.3<br />
30–34 11.1 12.9 6.5 12.7 11.7 0.0 10.2<br />
35 and older 19.8 15.8 7.3 20.9 7.1 45.4 23.2<br />
Schooling<br />
Elementary school 19.4 22.9 33.2 16.8 15.9 30.0 18.2<br />
Middle school 43.9 46.0 55.3 41.8 45.6 30.0 43.0<br />
High school 22.1 21.3 8.1 24.8 25.9 30.0 22.4<br />
College studies 9 6.5 0.5 10.3 6.5 10.0 10.4<br />
No formal education 0.4 0.5 0.9 0.6 0.3 0.0 0.2<br />
Other 5.1 2.7 2.0 5.8 5.8 0.0 5.8<br />
Marital Status<br />
Single 57.9 61.4 76.4 54.9 51.8 27.3 56.6<br />
Married 23.4 18.4 10.2 26.2 26.7 27.3 24.8<br />
Divorced 2.1 1.8 0.6 2.3 1.6 27.3 2.3<br />
Widowed 0.6 0.2 0.0 0.4 0.0 0.0 1.0<br />
Living together 10.4 11.9 8.9 10.4 13.7 18.2 10.0<br />
Other 5.6 6.3 3.9 5.8 6.2 0.0 5.4<br />
Socioeconomic Level<br />
High, middle-high 15.3 14.0 8.4 15.4 12.2 10.0 16.9<br />
Middle-low 54.2 49.0 55.1 54.5 56.9 60.0 54.9<br />
Middle 7.4 9.5 4.5 7.6 5.1 0.0 7.4<br />
Low 23.2 27.5 32.0 22.5 25.9 30.0 20.7<br />
Age of Onset<br />
9 and younger 5.2 2.1 6.5 5.2 1.7 0.0 6.1<br />
10–14 48.4 49.1 65.9 39.5 29.1 45.5 53.5<br />
15–19 40.2 43.4 26.6 47.0 49.3 27.3 35.7<br />
20–24 4.3 4.5 0.8 6.1 8.6 18.2 3.2<br />
25–29 1.1 0.6 0.1 1.3 7.6 0.0 0.9<br />
30–34 0.4 0.2 0.0 0.5 2.3 9.1 0.3<br />
35 and older 0.4 0.1 0.0 0.5 1.3 0.0 0.3<br />
Frequency<br />
Daily 53.9 66.1 42.2 16.7 35.8 100.0 79.2<br />
Once a week 27.6 21.1 41.3 48.2 42.3 0.0 12.4<br />
1–3 times per month 16.8 11.2 14.6 31.3 20.9 0.0 8.0<br />
1–11 times per year 1.7 1.6 1.9 3.8 1.0 0.0 0.4<br />
1 Includes cocaine, basuco, and crack.<br />
SOURCE: SISVEA—Government treatment centers<br />
Proceedings of the Community Epidemiology Work Group, Vol. II, January 2005 309
310<br />
<strong>EPIDEMIOLOGIC</strong> TRENDS IN <strong>DRUG</strong> <strong>ABUSE</strong>—SISVEA<br />
Exhibit 2. First Drug of Use and Current Drug of Use Among Patients at Government Treatment Centers, by<br />
Percent: 1991–June 2004<br />
45<br />
40<br />
35<br />
30<br />
25<br />
20<br />
15<br />
10<br />
5<br />
0<br />
1991<br />
1992<br />
1993<br />
1994<br />
1995<br />
SOURCE: SISVEA—Government treatment centers<br />
Exhibit 3. Natural History of Marijuana Use Among Treatment Patients: January–June 2004<br />
Government Centers<br />
1996<br />
89.6% 84.8%<br />
Marijuana Use a 2nd drug Use a 3rd drug<br />
Alcohol 32.9% Alcohol 24.1%<br />
Tobacco 21.4% Tobacco 21.2%<br />
Cocaine 14.6% Cocaine 20.4%<br />
10.4% Inhalants 11.7% Crack 5.7%<br />
Monodrug users Others 19.4% 15.2% Others 28.6%<br />
Nongovernment Centers<br />
First Drug Current Drug<br />
1997<br />
87.8% 74.4%<br />
Marijuana Use a 2nd drug Use a 3rd drug<br />
Cocaine 26.1% Cocaine 22.8%<br />
Alcohol 17.3% Heroin 18.3%<br />
Inhalants 15.4% Crystal 14.8%<br />
12.2% Crystal 11.1% Inhalants 10.6%<br />
Monodrug users Others 30.1% 25.6% Others 33.5%<br />
SOURCE: SISVEA—Government and nongovernment treatment centers<br />
1998<br />
1999<br />
2000<br />
2001<br />
2002<br />
2003<br />
2004 *<br />
Marijuana<br />
Inhalants<br />
Alcohol<br />
Cocaine<br />
Heroin<br />
45<br />
40<br />
35<br />
30<br />
25<br />
20<br />
15<br />
10<br />
5<br />
0<br />
1991<br />
1992<br />
1993<br />
1994<br />
1995<br />
1996<br />
1997<br />
Proceedings of the Community Epidemiology Work Group, Vol. II, January 2005<br />
1998<br />
1999<br />
2000<br />
2001<br />
2002<br />
2003<br />
2004 *
<strong>EPIDEMIOLOGIC</strong> TRENDS IN <strong>DRUG</strong> <strong>ABUSE</strong>—SISVEA<br />
Exhibit 4. Demographic Characteristics of NGC Patients, by First Drug of Use and Percent:<br />
January–June 2004<br />
Total Marijuana Inhalants Alcohol Cocaine 1 Demographic<br />
Heroin Tobacco<br />
Characteric N=20,324 n=5,436 n=2,243 n=6,123 n=1,273 n=422 n=3,838<br />
Gender<br />
Age<br />
Male 93.0 95.5 92.4 91.6 91.3 92.2 92.6<br />
Female 7.0 4.5 7.6 8.4 8.7 7.8 7.4<br />
5–14 years 2.2 1.9 7.4 1.1 0.9 1.9<br />
15–19 15.5 16.9 31.6 9.6 18.5 4.7 13.8<br />
20–24 19.3 22.7 23.8 13.9 23.6 14.7 19.6<br />
25–29 18.4 20.0 16.5 16.8 21.9 23.5 18.2<br />
30–34 15.5 15.5 9.5 16.4 18.3 18.0 16.3<br />
35 and older 29.1 23.1 11.1 42.2 16.7 39.1 30.3<br />
Schooling<br />
Elementary school 37.8 36.8 58.7 33.3 31.5 40.5 36.1<br />
Middle school 36.0 41.1 29.0 31.3 39.5 37.4 39.1<br />
High school 16.9 16.4 4.3 20.3 22.0 14.9 18.1<br />
College studies 4.8 2.5 0.7 8.8 5.0 3.4 4.0<br />
No formal education 4.2 3.0 7.2 5.7 1.7 3.8 2.4<br />
Other 0.3 0.2 0.6 0.3 0.2<br />
Marital Status<br />
Single 53.9 59.4 71.7 42.6 50.4 54.7 54.7<br />
Married 23.3 18.6 11.0 32.4 28.3 17.5 21.8<br />
Divorced 3.8 3.6 1.7 5.0 2.6 4.3 3.8<br />
Widowed 1.0 0.6 0.4 1.6 0.6 1.2 0.9<br />
Living together 11.9 11.9 10.9 11.4 12.5 12.5 12.7<br />
Other 6.2 5.9 4.2 7.0 5.6 9.8 6.1<br />
Age of Onset<br />
9 and younger 5.8 4.5 9.7 4.3 1.0 1.7 9.8<br />
10–14 43.3 48.0 58.8 35.4 19.6 16.0 51.1<br />
15–19 39.9 40.2 28.8 46.4 43.5 38.6 34.5<br />
20–24 6.8 4.9 1.8 9.2 17.3 20.2 3.5<br />
25–29 2.4 1.4 0.4 2.7 10.7 11.0 0.7<br />
30–34 1.0 0.5 0.1 1.1 4.2 6.7 0.3<br />
35 and older 0.9 0.4 0.3 0.9 3.7 6.0 0.3<br />
Frequency<br />
Daily 80.3 85.9 89.4 72 72.9 95.2 80.9<br />
Once a week 15.7 11.4 8.0 21.9 21.4 3.8 15.7<br />
1–3 times per month 3.2 2.0 2.0 4.9 4.3 1.0 2.8<br />
1–11 times per year 0.9 0.7 0.5 1.2 1.3 0.7<br />
1 Includes cocaine, basuco, and crack.<br />
SOURCE: SISVEA—Nongovernment treatment centers<br />
Proceedings of the Community Epidemiology Work Group, Vol. II, January 2005 311
312<br />
<strong>EPIDEMIOLOGIC</strong> TRENDS IN <strong>DRUG</strong> <strong>ABUSE</strong>—SISVEA<br />
Exhibit 5. First Drug of Use and Current Drug of Use Among Patients at Nongovernment Treatment Centers,<br />
by Percent: 1994–June 2004<br />
45<br />
40<br />
35<br />
30<br />
25<br />
20<br />
15<br />
10<br />
5<br />
0<br />
1994<br />
SOURCE: SISVEA—Nongovernment treatment centers<br />
Exhibit 6. Social Characteristics and Type of Offense Committed by Juvenile Drug-Using Arrestees, by<br />
Percent: January–June 2004<br />
Total Marijuana Inhalants Alcohol Cocaine Heroin<br />
N=5,393 n=1,857 n=750 n=720 n=821 n=22<br />
Male<br />
91.5%<br />
Elementary school<br />
46.5%<br />
Subemployed<br />
31.6%<br />
Tattoo<br />
23.3%<br />
Belong to a gang<br />
20.6%<br />
Offense under<br />
intoxication<br />
18.5%<br />
Robbery<br />
Against health<br />
Injuries<br />
Damages<br />
Other<br />
1995<br />
1996<br />
44.1%<br />
13.9%<br />
9.4%<br />
6.6%<br />
28.0%<br />
1997<br />
1998<br />
1999<br />
Male<br />
95.2%<br />
Elementary school<br />
50.7%<br />
Subemployed<br />
40.3%<br />
Tattoo<br />
37.1%<br />
Belong to a gang<br />
31.5%<br />
Offense under<br />
intoxication<br />
31.5%<br />
Robbery<br />
Against health<br />
Drug<br />
Consumption<br />
Injuries<br />
Other<br />
2000<br />
42.8%<br />
26.2%<br />
8.4%<br />
5.8%<br />
16.8%<br />
2001<br />
SOURCE: SISVEA—Juvenile detention centers<br />
First Drug Current Drug<br />
2002<br />
2003<br />
Male<br />
94.8%<br />
Elementary school<br />
61.4%<br />
Subemployed<br />
45.3%<br />
Tattoo<br />
39.4%<br />
Belong to a gang<br />
40.5%<br />
Offense under<br />
intoxication<br />
37.8%<br />
Robbery<br />
Against health<br />
Drug<br />
Consumption<br />
Arms bearing<br />
Other<br />
2004 *<br />
Frequent Offenses<br />
46.5%<br />
18.7%<br />
11.2%<br />
5.3%<br />
18.3%<br />
45<br />
40<br />
35<br />
30<br />
25<br />
20<br />
15<br />
10<br />
5<br />
0<br />
1994<br />
Marijuana<br />
Inhalants<br />
Alcohol<br />
Cocaine<br />
Heroin<br />
1995<br />
Male<br />
91.5%<br />
Elementary school<br />
45.1%<br />
Subemployed<br />
38.8%<br />
Tattoo<br />
30.7%<br />
Belong to a gang<br />
26.1%<br />
Offense under<br />
intoxication<br />
46.4%<br />
Robbery<br />
Injuries<br />
Against health<br />
Damages<br />
Other<br />
1996<br />
1997<br />
40.7%<br />
11.7%<br />
10.4%<br />
7.2%<br />
30.0%<br />
1998<br />
Male<br />
94.4%<br />
Elementary school<br />
54.3%<br />
Subemployed<br />
39.5%<br />
Tattoo<br />
35.5%<br />
Belong to a gang<br />
32.5%<br />
Offense under<br />
intoxication<br />
29.3%<br />
Robbery<br />
Against health<br />
Drug<br />
Consumption<br />
Injuries<br />
Other<br />
48.5%<br />
28.5%<br />
5.2%<br />
5.2%<br />
12.6%<br />
Male<br />
95.5%<br />
Elementary school<br />
57.1%<br />
Unemployed<br />
36.4%<br />
Tattoo<br />
50.0%<br />
Belong to a gang<br />
45.5%<br />
Offense under<br />
intoxication<br />
42.9%<br />
Robbery<br />
Against health<br />
Drug<br />
Consumption<br />
Other<br />
59.1<br />
13.6<br />
9.1<br />
18.2<br />
Proceedings of the Community Epidemiology Work Group, Vol. II, January 2005<br />
1999<br />
2000<br />
2001<br />
2002<br />
2003<br />
2004 *
<strong>EPIDEMIOLOGIC</strong> TRENDS IN <strong>DRUG</strong> <strong>ABUSE</strong>—SISVEA<br />
Exhibit 7. Type of Death Under Intoxication of Selected Drugs 1 in Mexico by Percent: January–June 2004<br />
Total Alcohol Marijuana Opioids 2<br />
Type of Death N=1,048 n=893 n=34 n=36<br />
Gender<br />
Male 92.9 93.8 91.2 94.4<br />
Female 7.1 5.7 8.8 5.6<br />
Age Group<br />
10–14 0.3 0.2 0.0 0.0<br />
15–19 8.8 8.1 14.7 13.9<br />
20–24 13.0 13.2 26.5 16.7<br />
25–29 13.2 14.0 14.7 16.7<br />
30–34 10.9 10.6 14.7 19.4<br />
35–39 13.7 13.4 8.8 16.7<br />
40 and older 40.2 40.4 20.6 16.7<br />
Cause of Death<br />
Run over 13.1 14.5 6.5 0.0<br />
Traffic accident 15.9 17.8 9.7 2.8<br />
Fall 4.7 4.9 9.7 0.0<br />
Electrocuted 0.8 0.6 0.0 0.0<br />
Burned 1.3 1.0 6.5 0.0<br />
Beaten 3.3 3.5 0.0 0.0<br />
Asphyxia 18.1 19.6 19.4 0.0<br />
Crushed 0.1 0.1 0.0 0.0<br />
Fire arm 8.6 9.3 16.1 0.0<br />
Steel knife 4.2 4.6 12.9 0.0<br />
Violation 0.0 0.0 0.0 0.0<br />
Intoxicated 9.9 5.9 9.7 94.4<br />
Poisoned 0.3 0.2 0.0 0.0<br />
Other 19.9 18.0 9.7 2.8<br />
Place of Death<br />
Traffic 16.8 18.1 9.1 0.0<br />
Home 30.6 30.4 21.2 13.9<br />
Street 36.0 37.0 33.3 63.9<br />
Public baths 0.2 0.1 3.0 2.8<br />
Recreational areas 4.5 4.9 12.1 0.0<br />
At work 1.1 1.2 3.0 0.0<br />
Service areas 6.7 1.8 6.1 13.9<br />
Other 4.2 3.9 12.1 5.6<br />
1 Deaths fro all causes totaled 8,095.<br />
2 Indicates opium, morphine, and heroin.<br />
SOURCE: SISVEA—Medical examiner<br />
Proceedings of the Community Epidemiology Work Group, Vol. II, January 2005 313
<strong>EPIDEMIOLOGIC</strong> TRENDS IN <strong>DRUG</strong> <strong>ABUSE</strong>—SISVEA<br />
Exhibit 8. Natural History of Inhalants Use Among Treatment Patients: January–June 2004<br />
314<br />
Government Centers<br />
74.3% 81.0%<br />
Inhalants Use a 2nd drug Use a 3rd drug<br />
Marijuana 33.8% Alcohol 27.9%<br />
Alcohol 22.4% Marijuana 20.0%<br />
Tobacco 20.9% Tobacco 17.9%<br />
25.7% Inhalants 11.4% 19.0% Cocaine 13.3%<br />
Monodrug users Others 11.5% Others 20.9%<br />
Nongovernment Centers<br />
58.8% 74.1%<br />
Inhalants Use a 2nd drug Use a 3rd drug<br />
Marijuana 52.3% Cocaine 25.6%<br />
Alcohol 15.5% Marijuana 16.1%<br />
Inhalants 8.4% Tranquilizers 12.2%<br />
41.2% Cocaine 6.4% 25.9% Heroin 8.6%<br />
Monodrug users Others 17.4% Others 37.5%<br />
SOURCE: SISVEA—Government and nongovernment treatment centers<br />
Exhibit 9. Natural History of Alcohol Use Among Treatment Patients: January–June 2004<br />
Government Centers<br />
91.4% 74.6%<br />
Alcohol Use a 2nd drug Use a 3rd drug<br />
Tobacco 57.8% Marijuana 33.1%<br />
Marijuana 17.3% Cocaine 26.6%<br />
Cocaine 13.2% Inhalants 10.5%<br />
8.6% Inhalants 5.2% 25.4% Tobacco 9.6%<br />
Monodrug users Others 6.5% Others 20.2%<br />
Nongovernment Centers<br />
70.4% 64.5%<br />
Alcohol Use a 2nd drug Use a 3rd drug<br />
Marijuana 36.9% Cocaine 32.8%<br />
Cocaine 21.4% Marijuana 17.3%<br />
Tobacco 15.5% Crystal 13.9%<br />
29.6% Crystal 5.6% 35.5% Inhalants 7.3%<br />
Monodrug users Others 20.6% Others 28.7%<br />
SOURCE: SISVEA—Government and nongovernment treatment centers<br />
Proceedings of the Community Epidemiology Work Group, Vol. II, January 2005
<strong>EPIDEMIOLOGIC</strong> TRENDS IN <strong>DRUG</strong> <strong>ABUSE</strong>—SISVEA<br />
Exhibit 10. Natural History of Cocaine Use Among Treatment Patients: January–June 2004<br />
Government Centers<br />
74.3% 69.3%<br />
Cocaine Use a 2nd drug Use a 3rd drug<br />
Alcohol 31.3% Alcohol 28.4%<br />
Marijuana 20.0% Tobacco 26.9%<br />
Tobacco 18.3% Marijuana 19.7%<br />
25.7% Crystal 6.0% 30.7% Inhalants 7.2%<br />
Monodrug users Others 24.4% Others 17.8%<br />
Nongovernment Centers<br />
63.8% 46.3%<br />
Cocaine Use a 2nd drug Use a 3rd drug<br />
Marijuana 26.1% Crystal 23.9%<br />
Crystal 20.9% Marijuana 15.2%<br />
Alcohol 15.4% Alcohol 14.6%<br />
36.2% Heroin 12.3% 53.7% Heroin 8.2%<br />
Monodrug users Others 25.3% Others 38.1%<br />
SOURCE: SISVEA—Government and nongovernment treatment centers<br />
Proceedings of the Community Epidemiology Work Group, Vol. II, January 2005 315
Panel<br />
on<br />
Methamphetamine<br />
Abuse:<br />
NIDA-Supported<br />
Research<br />
Studies
<strong>EPIDEMIOLOGIC</strong> TRENDS IN <strong>DRUG</strong> <strong>ABUSE</strong>—Panel on Methamphetamine Abuse: NIDA-Supported Research Studies<br />
Panel on Methamphetamine Abuse: NIDA-Supported<br />
Research Studies<br />
Natural History of Methamphetamine<br />
(MA) Abuse and Long-Term<br />
Consequences<br />
Mary-Lynn Brecht, Ph.D.<br />
MAJOR FINDINGS<br />
Major findings from a natural history study of 350<br />
methamphetamine abusers admitted to publicly<br />
funded drug abuse treatment programs in Los Angeles<br />
County include the following:<br />
• All had used alcohol, marijuana, and/or tobacco,<br />
with 95 percent initiating one or more of these<br />
prior to first use of MA. Ninety-seven percent<br />
had also used at least one other drug, initiated<br />
prior to first use of MA for 65 percent.<br />
• The average age of first use of methamphetamine<br />
was 19.<br />
• More than one-half (51 percent) of the respondents<br />
reported prolonged use of MA (at least 20<br />
days per month for at least 36 months since the<br />
age of 14).<br />
• Health problems reported by a majority of the<br />
users included weight loss (84 percent), sleeplessness<br />
(78 percent), paranoia (67 percent), hallucinations<br />
(61 percent), violent behavior (56<br />
percent), and dental problems (55 percent).<br />
• Prolonged MA use (more than 36 months) was<br />
associated with current health problems and<br />
lower self-reported health status.<br />
• Pregnancy and fetal loss rates were higher than<br />
national figures; 406 children were born to the<br />
153 women in the sample. One-third (33 percent)<br />
of these women reported having children with<br />
disabilities; 75 percent had children who had<br />
lived with someone else during at least some period<br />
of the child’s life.<br />
• Four of every 10 respondents reported continuous<br />
MA abstinence for at least 12 months after<br />
treatment discharge. Approximately 2 in 10 were<br />
still MA abstinent 48 months after discharge<br />
from treatment.<br />
• Nearly one-half (46 percent) of the respondents<br />
completed treatment. The average time in treatment<br />
was 3.7 months. Respondents with longer<br />
times in treatment were more likely to maintain<br />
abstinence to 24 and 48 months after treatment.<br />
• Time-to-relapse outcomes were worse for respondents<br />
who sold MA and respondents who<br />
experienced parental divorce during childhood.<br />
BACKGROUND AND STUDY DESCRIPTI<strong>ON</strong><br />
From 1992 to 2002, there was a fivefold increase in<br />
the number of methamphetamine treatment admissions<br />
in California––from 5 to 27 percent of all<br />
treatment admissions to outpatient and residential<br />
programs. To better understand the impact of MA<br />
use on the treatment system, a NIDA-funded study<br />
[RO1 DA11020] was undertaken by the University of<br />
California Los Angeles Integrated Substance Abuse<br />
Programs (ISAP) to study the patterns of MA use and<br />
the consequences of MA use on health, risk behaviors,<br />
and treatment outcomes.<br />
The ISAP study sample was randomly selected from<br />
adults admitted to Los Angeles County-funded outpatient<br />
and residential programs from 1995 to 1997<br />
(most were admitted in 1996). The sample was stratified<br />
by gender, ethnicity, and modality. Of the sample<br />
selected…<br />
• Seventy-six percent were located.<br />
• Three-quarters (75 percent) of those located participated<br />
in study interviews conducted in 1999–<br />
2000 (n=365); 282 of them participated in a second<br />
interview in 2001–2003.<br />
• Complete data were available for analysis of the<br />
first interview on 350 study subjects.<br />
C<strong>ON</strong>CLUSI<strong>ON</strong>S<br />
The major findings, as summarized above, are evidence<br />
of the impact of MA abuse on users and the<br />
treatment system.<br />
Given the increase in MA treatment admissions, the<br />
health problems of users, special needs (e.g., of children<br />
born to MA abusers), and the long-term treatment<br />
outcomes, there is a need to implement and<br />
Proceedings of the Community Epidemiology Work Group, Vol. II, January 2005 319
<strong>EPIDEMIOLOGIC</strong> TRENDS IN <strong>DRUG</strong> <strong>ABUSE</strong>—Panel on Methamphetamine Abuse: NIDA-Supported Research Studies<br />
evaluate specialized treatment approaches for this<br />
population.<br />
Because of the health problems associated with longterm<br />
MA use, early interventions could decrease the<br />
high medical and social costs of MA use.<br />
For inquiries concerning this report, please contact Mary-Lynn<br />
Brecht, Ph.D., UCLA ISAP, 1640 S. Sepulveda Blvd., Suite 200,<br />
Los Angeles, CA 90025, Phone: 310-445-0874 ext. 270, E-mail:<br />
lbrecht@ucla.edu.<br />
Prenatal Exposure to Methamphetamine<br />
and Child Development<br />
Barry Lester, Ph.D., Linda LaGasse, Ph.D., Lynne<br />
M. Smith, M.D., Chris Derauf, M.D., Penny Grant,<br />
M.D., Rizwan Shah, M.D., Amelia Arria, Ph.D.,<br />
Marilyn Huestis, Ph.D., and Jing Liu, Ph.D.<br />
Preliminary findings on infants exposed prenatally to<br />
methamphetamine (MA) and nonexposed infants<br />
suggest…<br />
• Prenatal exposure to MA is associated with an<br />
increase in SGA (small for gestational size).<br />
• Neurobehavioral deficits at birth were identified<br />
in NNNS (Neonatal Intensive Care Unit Network<br />
Neurobehavioral Scale) neurobehavior, including<br />
dose response relationships and acoustical analysis<br />
of the infant’s cry.<br />
These preliminary findings are from the IDEAL (Infant<br />
Development, Environment, and Lifestyle) clinical<br />
network study supported by NIDA (RO1DA-<br />
01498-01). The final sample will be comprised of<br />
204 exposed and 208 nonexposed infants and their<br />
caretakers.<br />
STUDY SAMPLE AND METHODS<br />
The sample for these preliminary findings is based on<br />
infants who were exposed to MA prenatally and infants<br />
who were not exposed to MA. Exposure was<br />
determined through mothers’ self-reports and/or<br />
GC/MS (Gas Chromatography/Mass Spectroscopy)<br />
confirmation of MA in meconium. Subjects in both<br />
groups were ineligible for the study if the mothers<br />
used lysergic acid diethylamide (LSD), phencyclidine<br />
(PCP), opiates, or cocaine only during pregnancy.<br />
Other maternal exclusion criteria were non-English<br />
speaking, mental confusion or psychotic symptoms,<br />
low cognitive function, and being younger than 18.<br />
Infant exclusion criteria were multiple gestation,<br />
320<br />
congenital anomalies or chromosomal abnormalities,<br />
unlikely to survive, and overt TORCH (Toxoplasmosis,<br />
Other Agents, Rubella, Cytomegalovirus,<br />
Herpes Simplex) infections. Mothers who used alcohol,<br />
tobacco, or marijuana during pregnancy were<br />
included in both the exposed or nonexposed groups.<br />
The subjects were recruited from seven hospitals at<br />
four clinical research sites (Tulsa, OK; Des Moines,<br />
IA; Los Angeles, CA; and Honolulu, HI) from September<br />
1, 2002, through August 31, 2003. The figures<br />
below show the number of mothers who were<br />
screened and ineligible, and the final number of eligibles<br />
who consented to participating in the study.<br />
13,808<br />
Screened<br />
→ 10,510<br />
Available<br />
→ 7,119<br />
Eligible →<br />
1,632<br />
Consented<br />
Subjects with MA exposure and matched comparisons<br />
were enrolled in the followup phase (84 exposed<br />
and 92 comparison). In the comparison group,<br />
mothers denied MA use and the infants had a negative<br />
meconium screen. The comparison group was<br />
matched to the exposed group by race, infants’ birthweight,<br />
type of medical insurance, and maternal education.<br />
Data were collected soon after the infants’ birth and<br />
at a 1-month followup. Mothers were interviewed at<br />
both time points for demographic information, drug<br />
use during pregnancy, and psychological characteristics.<br />
SGA was determined from physical growth parameters<br />
from hospital medical charts. The NNNS<br />
was used to test infant neurobehavior at birth. The<br />
NNNS includes measures of arousal, stress and abstinence<br />
signs, self-regulation, and quality of movement.<br />
Statistical analyses on NNNS scores included<br />
comparison between groups, trimester effects of MA<br />
use, and dose response relationships between the amphetamine<br />
metabolite in meconium and newborn<br />
neurobehavior. Following the NNNS exam, the infant’s<br />
cry was elicited and tape-recorded for subsequent<br />
computer acoustical analysis. The SASSI<br />
(Substance Abuse Subtle Screening Inventory) was<br />
used to determine substance dependence disorder in<br />
the mothers at 1 month.<br />
FINDINGS<br />
Based on self-reports of 1,632 eligible mothers who<br />
consented to participation, it was found that 6 percent<br />
used MA during pregnancy. Findings from this recruitment<br />
sample showed that MA-exposed infants<br />
were significantly more likely than their comparison<br />
counterparts to have lower birthweight and were<br />
more likely to be SGA. However, only the SGA effect<br />
remained with adjustment for covariates.<br />
Proceedings of the Community Epidemiology Work Group, Vol. II, January 2005
<strong>EPIDEMIOLOGIC</strong> TRENDS IN <strong>DRUG</strong> <strong>ABUSE</strong>—Panel on Methamphetamine Abuse: NIDA-Supported Research Studies<br />
Findings below are based on the initial followup<br />
sample of 84 subjects in the methamphetamine group<br />
and 92 subjects in the comparison group. MA use<br />
was higher in the first trimester (3 days a week) than<br />
in the second or third trimesters (2 days a week). Maternal<br />
use of alcohol, marijuana, and tobacco was<br />
higher in the MA group than in the comparison group<br />
(e.g., 79 percent of the MA mothers used tobacco<br />
compared with 26 percent of the comparison group).<br />
Most mothers in the MA group had more than one<br />
prenatal care visit (89 percent), while almost all (99<br />
percent) in the comparison group had more than one<br />
visit. However, the number of visits was somewhat<br />
lower in the MA group (11 vs. 14 in the comparison<br />
group), and the first prenatal visit took place later in<br />
the pregnancy in the exposed group (exposed 15<br />
weeks vs. comparison 9 weeks gestational age).<br />
At hospital discharge, 26 percent of the MA infants<br />
were not placed with their biological mothers, compared<br />
with 2 percent of the nonexposed infants. Child<br />
protection service (CPS) referrals were also higher<br />
(51 vs. 6 percent), as was CPS supervision at discharge<br />
(48 vs. 3 percent). On the SASSI, 74 percent<br />
of mothers in the MA group had a substance use disorder,<br />
compared with 11 percent in the comparison<br />
group. This effect remained after adjustment for covariates.<br />
Among infants, NNNS arousal scores were<br />
significantly lower and stress abstinence scores (with<br />
covariates) were higher in MA-exposed infants. The<br />
amount of MA use during the first and third trimester<br />
was related to more stress/abstinence signs; MA use<br />
during the third trimester was also related to a poorer<br />
quality of movement. There were dose response relationships<br />
between the amount of MA metabolite in<br />
the infant’s meconium and quality of movement,<br />
stress/abstinence signs, and regulation scores. Acoustic<br />
cry analysis showed that with covariates, more<br />
MA- exposed infants cried to the first stimulus, they<br />
had more dysphonation (turbulence), changes in<br />
voice pitch, variability in amplitude (loudness), and<br />
changes in voicing patterns than infants in the comparison<br />
group. There were no differences in maternal<br />
or newborn infant medical factors between the two<br />
groups.<br />
C<strong>ON</strong>CLUSI<strong>ON</strong>S<br />
According to the 1999 National Survey on Drug Use<br />
and Health, MA was the only substance with the<br />
same percentage of use by pregnant and non-pregnant<br />
women. In the 2002 Treatment Episode Data Set, it<br />
was found that 21 percent of those pregnant reported<br />
use of MA, in contrast to 13 percent of the nonpregnant<br />
women. Few studies have been conducted<br />
on the in utero effects of MA. These studies do suggest<br />
birth abnormalities (e.g., placental abruption,<br />
premature delivery, fetal growth retardation) and later<br />
learning disabilities, aggressive behavior, and increased<br />
rates of attention deficit disorder. However,<br />
these findings on humans have been based on small<br />
sample sizes and lack of controls for confounding<br />
variables (including use of other drugs), lack of a<br />
control group, and examiners not being blinded to<br />
exposure status. The IDEAL study has been undertaken<br />
to provide greater knowledge of the effects of<br />
MA use during pregnancy on infants. The preliminary<br />
findings reported here found an increase in<br />
SGA, neurobehavioral and cry deficits in MAexposed<br />
infants. It is possible that this is “déjà vu,”<br />
reminiscent of the effects of cocaine use on human<br />
development. The findings point to the following<br />
needs:<br />
• There is a need for well-designed studies to determine<br />
the effects of MA on child outcome.<br />
• There is a need for caution in not over interpreting<br />
findings that can lead to unwarranted stigmatizing<br />
of drug-exposed infants and their families.<br />
• There is a need for effective intervention programs<br />
that meet the special needs of female MA<br />
users and their children to reduce potential MArelated<br />
deficits.<br />
REFERENCES<br />
Arria, A.; Derauf, C.; LaGasse, L.; Grant, P.; Shah,<br />
R.; Smith, L.; Haning W.; Huestis, M.; Strauss,<br />
A.; DellaGrotta, S.; Liu, J.; and Lester, B.<br />
Methamphetamine and other substance use during<br />
pregnancy: Preliminary estimates from the<br />
Infant Development, Environment, and Lifestyle<br />
(IDEAL) Study. Maternal and Child Health<br />
Journal (submitted for publication).<br />
Arria, A.M.; Derauf, C.; LaGasse, L.; Grant, P.;<br />
Shah, R.; Smith, L.; Haning, W.; Huestis, M.;<br />
Strauss, A.; DellaGrotta, S.; Liu, J.; and Lester,<br />
B. Alcohol, tobacco and illicit drug use during<br />
pregnancy: Preliminary results from the Infant<br />
Development, Environment, and Lifestyle Study<br />
(IDEAL). Pediatric Research 55, No. 4. Part 2,<br />
168A (2004).<br />
Derauf, C.; LaGasse, L.; Grant, P.; Shah, R.; Smith,<br />
L.; Arria, A.; Huestis, M.; Haning, W.; Strauss,<br />
A.; DellaGrotta, S.; Liu, J.; and Lester, B.<br />
Demographic and psychosocial characteristics of<br />
mothers who used methamphetamine during<br />
pregnancy: Preliminary results from the Infant<br />
Development, Environment, and Lifestyle Study<br />
Proceedings of the Community Epidemiology Work Group, Vol. II, January 2005 321
322<br />
<strong>EPIDEMIOLOGIC</strong> TRENDS IN <strong>DRUG</strong> <strong>ABUSE</strong>—Panel on Methamphetamine Abuse: NIDA-Supported Research Studies<br />
(IDEAL). Pediatric Research 55, No. 4. Part 2,<br />
72A (2004).<br />
Grant, P.; LaGasse, L.; Derauf, C.; Shah, R.; Smith,<br />
L.; Arria, A.; Huestis, M.; Strauss, A.; Haning,<br />
W.; DellaGrotta, S.; Liu, J.; and Lester, B. Prenatal<br />
methamphetamine use and maternal health<br />
care characteristics: Preliminary results from the<br />
Infant Development, Environment, and Lifestyle<br />
Study (IDEAL). Pediatric Research 55, No. 4.<br />
Part 2, 72A (2004).<br />
LaGasse, L.; Derauf, C.; Grant, P.; Shah, R.; Smith, L.;<br />
Arria, A.; Huestis, M.; Strauss, A.; Haning, W.;<br />
DellaGrotta, S.; Fallone, M.; Liu, J.; and Lester,<br />
B. Prenatal methamphetamine exposure and neonatal<br />
cry acoustic analysis: Preliminary results<br />
from the Infant Development, Environment, and<br />
Lifestyle Study (IDEAL). Pediatric Research 55,<br />
No. 4. Part 2, 72A (2004).<br />
Smith, L.M.; LaGasse, L.L.; Derauf, C.; Grant, P.;<br />
Shah, R.; Arria, A.; Huestis, M.; Haning, W.;<br />
Strauss, A.; DellaGrotta, S.; Liu, J.; and Lester,<br />
B. Intrauterine growth of infants exposed to prenatal<br />
methamphetamine: Preliminary results<br />
from the Infant Development, Environment, and<br />
Lifestyle Study (IDEAL). Pediatric Research 55,<br />
No. 4. Part 2, 72A (2004).<br />
Smith, L.M.; LaGasse, L.L.; Derauf, C.; Grant, P.;<br />
Shah, R.; Arria, A.; Huestis, M.; Haning, W.;<br />
Strauss, A.; DellaGrotta, S.; Fallone, M.; Liu, J.;<br />
and Lester, B.M. Prenatal methamphetamine<br />
(MA) use and neonatal neurobehavioral outcome:<br />
Preliminary results from the Infant Development,<br />
Environment, and Lifestyle Study<br />
(IDEAL). Pediatric Research 55, No. 4. Part 2,<br />
606A (2004).<br />
Wouldes, T., LaGasse, L., Sheridan, J., Lester, B.<br />
Maternal Methamphetamine Use During Pregnancy<br />
and Child Outcome: What Do We Know?<br />
New Zealand Med J. 117;No. 1206:U1180,<br />
(2004).<br />
For inquiries concerning this report, please contact Barry Lester,<br />
Ph.D., Women and Infants Hospital, Infant Development Center,<br />
79 Plain Street, 2nd Floor, Providence, RI 02903, Phone: 401-<br />
453-7640, Fax: 401-453-7646, E-mail: barry_lester@brown.edu.<br />
Evidence-Based Approaches for<br />
Addressing Methamphetamine Use<br />
Among Gay Urban Males<br />
Cathy J. Reback, Ph.D.<br />
Findings from a study of 162 gay and bisexual men<br />
enrolled in outpatient treatment for methamphetamine<br />
abuse or dependence included…<br />
• Drug abuse treatment interventions were found<br />
to be effective in reducing methamphetamine use<br />
and human immunodeficiency virus (HIV) risk<br />
behaviors of methamphetamine abusers…<br />
– At baseline, the mean number of sexual<br />
partners in the prior 30 days was 8.6, compared<br />
with 2.9 at 52-week follow-up<br />
– Participants demonstrated a threefold decrease<br />
in methamphetamine use (verified by<br />
urinalysis) and unprotected anal intercourse<br />
at 1-year followup.<br />
• Combined contingency management (CM) and<br />
cognitive behavioral therapy (CBT) produced<br />
maximal short-term reductions in drug use and<br />
moderate effects on high-risk sex behaviors.<br />
• Gay-specific CBT produced maximal short-term<br />
high-risk sex reduction and moderate drug use<br />
reduction.<br />
STUDY METHODS<br />
Sample<br />
The study sample consisted of 162 self-reported gay or<br />
bisexual men who were enrolled in a Hollywood, California,<br />
outpatient treatment program for methamphetamine<br />
abuse. All men met the DSM-IV criteria<br />
for methamphetamine abuse or dependence. The participants<br />
were recruited for treatment through advertisements<br />
at gay venues and in the gay media, as well<br />
as through agency referrals. Men who responded were<br />
scheduled for an intake interview, completed an admission<br />
form, and began the informed consent process<br />
(approved by the Friends Research Institute West<br />
Coast Institutional Review Board).<br />
Participants ranged in age from 19 to 57, with an<br />
average age of 37. Most were White (80.2 percent)<br />
Proceedings of the Community Epidemiology Work Group, Vol. II, January 2005
<strong>EPIDEMIOLOGIC</strong> TRENDS IN <strong>DRUG</strong> <strong>ABUSE</strong>—Panel on Methamphetamine Abuse: NIDA-Supported Research Studies<br />
and highly educated (mean years of schooling=14.7).<br />
On average, respondents reported a lifetime use of<br />
methamphetamine of 8.3 years. Nearly 38 percent<br />
reported a history of injection drug use, and 60.5 percent<br />
were HIV-infected.<br />
Interventions<br />
Following screening, participants were randomly<br />
assigned to one of four treatment conditions: contingency<br />
management (CM), cognitive behavioral therapy<br />
(CBT), CM + CBT, and gay-specific CBT<br />
(GCBT). The first three interventions targeted only<br />
drug use, and no instructions were given regarding<br />
sexual risk behaviors. The GCBT integrated the standard<br />
CBT with referents to cultural norms and values<br />
of an urban gay lifestyle and an emphasis on HIVrelated<br />
issues. Treatment was scheduled for a 16-<br />
week duration. Groups met for 90 minutes, three<br />
evenings each week. Nearly 59 percent of the sample<br />
completed the 16-week intervention to which they<br />
were assigned.<br />
Data Collection<br />
Quantitative data were obtained from all participants<br />
at baseline, at 16 weeks, at 6 months, and at 1 year<br />
following treatment initiation. In addition to the<br />
Admission Form that collected demographic, substance<br />
use, treatment history, sexual behavior, and<br />
medical and psychiatric background data at baseline,<br />
Exhibit 1. Outcomes by Treatment Condition<br />
Measure<br />
CM<br />
n=42<br />
two other instruments were used: the Substance Use<br />
Inventory and the Behavior Questionnaire–<br />
Amphetamine (BQA). Urinalysis was used to verify<br />
self-reported drug use. Qualitative interviews were<br />
conducted with 34 of the participants at baseline, 16<br />
weeks, and 1 year.<br />
STUDY FINDINGS<br />
At baseline, 85.2 percent of the men responded that<br />
methamphetamine (i.e., “crystal”) use and sex were<br />
integrally connected, and “always” or “often” go together.<br />
Nearly 76 percent reported engaging in sex in<br />
the prior 30 days while high on methamphetamine.<br />
On average, these men had 8.6 unique sexual partners<br />
during that 30-day period. Sex was considered “compulsive”<br />
by 69.1 percent of the participants.<br />
By 1-year followup, the mean number of sexual partners<br />
was significantly lower (2.9, p
324<br />
<strong>EPIDEMIOLOGIC</strong> TRENDS IN <strong>DRUG</strong> <strong>ABUSE</strong>—Panel on Methamphetamine Abuse: NIDA-Supported Research Studies<br />
Predicting Relapse in Methamphetamine-Dependent<br />
Individuals<br />
Martin P. Paulus, M.D.<br />
Findings from a study of the use and effectiveness of<br />
Functional Magnetic Resonance Imaging (FMRI) in<br />
predicting relapse in methamphetamine (MA) dependent<br />
individuals show that…<br />
• FMRI imagining results can be used to predict<br />
whether and when relapse may occur; findings<br />
show that FMRI correctly predicted…<br />
– 17 of 18 relapses<br />
– 20 of 22 nonrelapses<br />
• In relapse, there is less activation in insular cortex<br />
structures that are critical for decisionmaking;<br />
the poor decisionmaking “sets the stage” for<br />
relapse.<br />
This study, designed to examine the neurobiology of<br />
decisionmaking dysfunction in stimulant dependent<br />
subjects and the efficacy of using FMRI as a tool to<br />
predict relapse, was supported by NIDA [DA 013186<br />
and DA 016663] and conducted by the University of<br />
California San Diego and the San Diego Veterans<br />
Affairs Health Care System.<br />
STUDY SAMPLE AND METHODS<br />
The initial sample included 46 males who were diagnosed<br />
as MA-dependent using the Structured Clinical<br />
Interview for DSM IV diagnosis; 6 were lost for followup,<br />
which was conducted in a median of 370<br />
days. All subjects had been sober for a median of 25<br />
days at baseline. All subjects were drawn from the<br />
San Diego Veterans Affairs Health Care System Alcohol<br />
and Drug Treatment Program under the leadership<br />
of Dr. Marc Schuckitt.<br />
Of the 40 subjects included in the final analyses, 22<br />
were “nonrelapsers” and 18 were “relapsers.” Some<br />
characteristics of the two groups are shown in exhibit 1.<br />
Exhibit 1. Characterisitics of the Study Samples<br />
Characteristic Nonrelapsers Relapsers<br />
Average Age 40.3 41.9<br />
Percent White<br />
Percent Divorced/<br />
73.0 67.0<br />
Separated/ Never 95.0 89.0<br />
Married 1<br />
Average Years of<br />
Education<br />
Average Years of<br />
MA Use 2<br />
12.9 13.5<br />
14.9 17.3<br />
1 Most in this category were either divorced or separated.<br />
2 At baseline, 5 nonrelapsers and 7 relapsers were currently<br />
abusing alcohol/marijuana; at follow-up, the respective numbers<br />
were 1 and 2 and 1 nonrelapse subject was also abusing<br />
cocaine.<br />
The FMRI was used to determine changes in blood<br />
oxygenation and identify brain areas involved in the<br />
behavioral tasks. The Assessment Protocol at baseline<br />
included the following:<br />
• The two-choice prediction task is used to determine<br />
the response characteristics in decisionmaking<br />
situations that have an uncertain<br />
outcome (for a detailed description, see Paulus<br />
1997). Briefly, on a computer screen a house is<br />
presented with a person to the left and right. The<br />
subject is told that the task is to predict whether a<br />
car will come by on the left or right side to pick<br />
up the person on the computer screen. The subject<br />
has to make a decision (pressing the left or<br />
right button) and is shown the car after pressing<br />
the button for 300 milliseconds. If the selected<br />
response is “correct,” (i.e., reinforced), the person<br />
on the selected side crosses over to the car;<br />
otherwise the person moves halfway across the<br />
screen and then returns to the center of the<br />
screen. The reinforcement schedule is determined<br />
apriori, such that 50 percent of the responses<br />
will be reinforced, as if they were<br />
“correct” predictions.<br />
• The two-choice response task is one in which the<br />
subject is told that the task is to press the button<br />
on the same side that the car is shown on the<br />
screen (i.e., left or right). The duration of each<br />
trial depends on the time between presentation of<br />
the initial situation and the selection of the response.<br />
Therefore, the number of trials per experimental<br />
block depends on the subject’s average<br />
latency to select a response during a trial block.<br />
Proceedings of the Community Epidemiology Work Group, Vol. II, January 2005
<strong>EPIDEMIOLOGIC</strong> TRENDS IN <strong>DRUG</strong> <strong>ABUSE</strong>—Panel on Methamphetamine Abuse: NIDA-Supported Research Studies<br />
• The key difference between these two tasks is<br />
that during the two-choice prediction task, the<br />
subject does not know the correct response in<br />
advance, and the only information provided that<br />
may guide the selection of the current response is<br />
the sequence of previous responses and outcomes.<br />
In comparison, during the two-choice response<br />
task, the subject knows the correct<br />
answer before selecting a response, and the current<br />
button press does not depend on the previous<br />
responses.<br />
• Diagnostic––SCID (Structured Clinical Interview<br />
for DSM IV Diagnoses), used to obtain<br />
DSM IV diagnoses.<br />
• Symptoms––BPRS/HDRS (Brief Psychiatric<br />
Rating Scale and Hamilton Depression Rating<br />
Scale) used to assess general psychiatric and depressive<br />
symptoms, and the YMRS (Young Mania<br />
Rating Scale), used to assess manic<br />
symptoms.<br />
• Decisionmaking: see above.<br />
• A MRI––Block design using the Two-Choice<br />
Prediction Task versus the Two-Choice Response<br />
Task. Briefly, both tasks were presented<br />
for 30 seconds each and were repeated five<br />
times.<br />
FINDINGS<br />
The FMRI correctly predicted by imaging included<br />
17 of 18 relapses and 20 of 22 nonrelapses, with a<br />
high level of sensitivity (94.4 percent) and specificity<br />
(86.4 percent).<br />
Relapse was predictable by less activation in brain<br />
structures that are critical to decisionmaking; these<br />
were shown to be in the insular cortex, particularly<br />
the anterior insula, the inferior parietal lobule, and<br />
the dorsolateral prefrontal cortex. It also appears that<br />
poor assessment of the decisionmaking situation and<br />
subsequent reliance on habitual behavior involves<br />
processes in the inferior parietal lobule.<br />
C<strong>ON</strong>CLUSI<strong>ON</strong>S<br />
This study has shown that brain patterns can be used<br />
to predict whether and when relapse may occur.<br />
Questions that need to be more fully addressed in<br />
future research are…<br />
• What are the specific cognitive processes involved<br />
in relapse?<br />
• Do interventions have an impact on relapse?<br />
• Do such findings apply to other addictions?<br />
REFERENCE<br />
Paulus, M.P. Long-range interactions in sequences of<br />
human behavior. Physical Review E 55: 3249-<br />
3256 (1997).<br />
For inquiries concerning this report, please contact Martin P.<br />
Paulus, M.D., Associate Professor, Department of Psychiatry,<br />
Laboratory of Biological Dynamics and Theoretical Medicine,<br />
University of California San Diego, Suite C213, 8950 La Jolla<br />
Village Drive, La Jolla CA 92037-0985, Phone: 858-642-3390,<br />
Fax: 858-642-1429, E-mail: mpaulus@ucsd.edu.<br />
Proceedings of the Community Epidemiology Work Group, Vol. II, January 2005 325
Appendix A<br />
New<br />
Drug Abuse<br />
Warning Network<br />
(DAWN) Emergency<br />
Department Data<br />
and<br />
DAWN Live!:<br />
Major Features
APPENDIX A<br />
<strong>EPIDEMIOLOGIC</strong> TRENDS IN <strong>DRUG</strong> <strong>ABUSE</strong>—Appendix A<br />
New Drug Abuse Warning Network (DAWN) Emergency<br />
Department Data and DAWN Live!: Major Features<br />
NEW DAWN EMERGENCY DEPARTMENT (ED) DATA<br />
Major changes to DAWN were instituted at the beginning<br />
of 2003. These changes are a result of a redesign<br />
that altered virtually every feature of DAWN<br />
except its name. New DAWN data cannot be trended<br />
with prior years.<br />
DAWN Hospitals and Areas. A sample of hospitals<br />
has been selected for each participating metropolitan<br />
area. Eligible hospitals in DAWN are short-term,<br />
general, non-Federal hospitals that operate 24-hour<br />
emergency departments. Some operate more than one<br />
emergency department (ED). Boundary definitions<br />
are based on the 2000 Census.<br />
A DAWN Case. In the new DAWN system a DAWN<br />
case is defined as any emergency department visit<br />
related to recent drug use by persons of any age. The<br />
visits may be associated with substance abuse but<br />
also include drug misuse, both intentional and accidental.<br />
Included are visits related to the use of drugs<br />
for legitimate therapeutic purposes. Current medications<br />
unrelated to a visit are not reported.<br />
To be considered a DAWN case, a drug need not be<br />
the cause of the visit but must be implicated in the<br />
visit. Only recent drug use is included. Case criteria<br />
are “broad enough to encompass all types of drugrelated<br />
events, which include, but are not limited, to<br />
explicit drug use” (OAS 2004) 1 .<br />
Case Finding and Case Types. Case finding involves<br />
a retrospective review of medical charts for all patients<br />
treated in an ED. Reporters are rigorously<br />
trained and quality assurance protocols identify<br />
points where threats to data quality can be avoided or<br />
identified and corrected.<br />
Each Dawn case is assigned hierarchially into one<br />
and only one case type, based on a series of questions<br />
1 For additional details on case definitions and other aspects of<br />
DAWN, see DAWN, 2003: Interim National Estimates of Drug-<br />
Related Emergency Department Visits (DAWN Series D-26,<br />
DHHS Publication No. (SMA) 04-3927). Rockville, MD:<br />
SAMHSA, Office of Applied Studies, December 2004. Available<br />
on-line at .<br />
and rules. Cases are classified into the first case type<br />
that applies, even if it might fit into more than one<br />
case type The eight case types in hierarchical are…<br />
• Suicide attempt<br />
• Seeking detoxification<br />
• Alcohol only in patients under age 21<br />
• Adverse reactions<br />
• Overmedication<br />
• Malicious poisoning (includes drug-facilitated<br />
sexual assault or product tampering)<br />
• Accidental ingestion<br />
• Other<br />
The final case type, which is called other, is designed<br />
to capture all drug-related ED visits that could not be<br />
classified in any of the prior seven case types. Other<br />
is the case-type category designed to capture most<br />
drug abuse cases.<br />
Patient Reporting. A maximum of six drugs, plus<br />
alcohol, may be reported by a patient in an ED visit.<br />
The substances reported may include illicit drugs,<br />
prescription and over-the-counter drugs, dietary supplements,<br />
non-pharmaceutical inhalants, alcohol-incombination<br />
with other drugs, and alcohol only for<br />
patients younger than 21.<br />
DAWN Publications. After each annual data collection,<br />
the DAWN data are cleaned and weighted, statistical<br />
tests are conducted to produce estimates for<br />
each metropolitan area and for the coterminous<br />
United States, and an annual report is published and<br />
disseminated.<br />
Proceedings of the Community Epidemiology Work Group, Vol. II, January 2005 329
DAWN LIVE!<br />
The new DAWN includes capability for “real-time”<br />
surveillance of ED visits through DAWN Live!, an<br />
online data system. Access to DAWN Live! is limited<br />
to authorized users. Data in DAWN Live! are raw and<br />
unweighted reports of individual cases from participating<br />
hospitals. The data from one hospital may not<br />
be representative of all cases in the area; other hospitals<br />
may treat different types of cases or users of different<br />
drugs. Also, data from some hospitals may be<br />
reported more rapidly than data from other hospitals.<br />
DAWN Live! does not produce estimates (i.e., measures<br />
extrapolated from sample data to an entire universe<br />
(e.g., to an entire metropolitan area).<br />
In examining DAWN Live! data, it is important to<br />
consider how many hospitals are reporting and the<br />
completeness of their data.<br />
330<br />
<strong>EPIDEMIOLOGIC</strong> TRENDS IN <strong>DRUG</strong> <strong>ABUSE</strong>—Appendix A<br />
Since DAWN Live! data are raw and unweighted,<br />
they cannot be generalized to the entire metropolitan<br />
area. However they can help answer the following<br />
questions:<br />
• What is the nature of the drug-related ED visits<br />
in participating hospitals?<br />
• What drugs were involved?<br />
• What was the relative mix of case types?<br />
DAWN Live! data can also prove useful in identifying<br />
in a timely fashion the emergence of new drugs in<br />
an area and provide some insights into who is using<br />
these drugs and the associated health consequences.<br />
Proceedings of the Community Epidemiology Work Group, Vol. II, January 2005
Participants
Participant List<br />
National Institute on Drug Abuse<br />
Community Epidemiology Work Group Meeting<br />
Long Beach, California<br />
January 26–28, 2005<br />
T. Kiku Annon<br />
Research Associate<br />
West Ed<br />
4665 Lampson Avenue<br />
Los Alamitos, CA 90720<br />
Phone: 562-799-5127<br />
Fax: 562-799-5151<br />
E-mail: kannon@wested.org<br />
Erin Artigiani<br />
Deputy Director<br />
Policy and Governmental Affairs<br />
Coordinator, Maryland Drug Early<br />
Warning System<br />
Center for Substance Abuse Research<br />
Suite 501<br />
4321 Hartwick Road<br />
College Park, MD 20740<br />
Phone: 301-405-9794<br />
Fax: 301-403-8342<br />
E-mail: erin@cesar.umd.edu<br />
Judy K. Ball, Ph.D., M.P.A.<br />
Project Director<br />
Drug Abuse Warning Network<br />
Office of Applied Studies<br />
Substance Abuse and Mental Health<br />
Services Administration<br />
Department of Health and Human Services<br />
1 Choke Cherry Road, Room 7-1044<br />
Rockville, MD 20857<br />
Phone: 240-276-1256<br />
Fax: 240-276-1260<br />
E-mail: Judy.Ball@samhsa.hhs.gov<br />
Caleb Banta-Green, M.P.H., M.S.W.<br />
Research Scientist<br />
Alcohol and Drug Abuse Institute<br />
University of Washington<br />
1107 N.E. 45th Street, Suite 120<br />
Seattle, WA 98105<br />
Phone: 206-685-3919<br />
Fax: 206-543-5473<br />
E-mail: calebbg@u.washington.edu<br />
<strong>EPIDEMIOLOGIC</strong> TRENDS IN <strong>DRUG</strong> <strong>ABUSE</strong>—Participant List<br />
George Beschner, M.S.W.<br />
MasiMax Resources, Inc.<br />
1375 Piccard Drive, Suite 175<br />
Rockville, MD 20850<br />
Phone: 240-683-1757<br />
Fax: 301-926-3156<br />
E-mail: gbeschner@masimax.com<br />
Carol J. Boyd, M.S.N., Ph.D., R.N.<br />
Professor, Nursing and Women's Studies<br />
Director, Institute for Research on Women<br />
and Gender<br />
University of Michigan Substance Abuse<br />
Research Center<br />
2025 Traverwood, Suite C<br />
Ann Arbor, MI 48105-2194<br />
Phone: 734-764-9537<br />
Fax: 734-764-9533<br />
E-mail: caroboyd@umich.edu<br />
Edward W. Boyer, M.D., Ph.D.<br />
Associate Professor<br />
Department of Emergency Medicine<br />
University of Massachusetts<br />
93 Martin Street<br />
Boston, MA 02132<br />
Phone: 617-469-8890<br />
Fax: 508-856-6609<br />
E-mail: edward.boyer@tch.harvard.edu<br />
Nancy E. Brace, R.N., M.A.<br />
Evaluation and Information Director<br />
Alcohol and Drug Abuse Division<br />
Colorado Department of Human Services<br />
4055 South Lowell Boulevard<br />
Denver, CO 80236-3120<br />
Phone: 303-866-7502<br />
Fax 303-866-7481<br />
E-mail: nancy.brace@state.co.us<br />
Proceedings of the Community Epidemiology Work Group, Vol. II, January 2005 333
Mary-Lynn Brecht, Ph.D.<br />
Integrated Substance Abuse Programs<br />
University of California, Los Angeles<br />
Suite 200<br />
1640 South Sepulveda Boulevard<br />
Los Angeles, CA 90025<br />
Phone: 310-445-0874, ext. 270<br />
Fax: 310-473-7885<br />
E-mail: lbrecht@ucla.edu<br />
Dita Broz, M.P.H.<br />
Project Director<br />
Division of Epidemiology and Biostatistics<br />
Community Outreach Intervention Projects<br />
School of Public Health<br />
University of Illinois at Chicago<br />
1603 West Taylor Street, MC-923<br />
Chicago, IL 60612<br />
Phone: 312-355-4753<br />
Fax: 312-996-1450<br />
E-mail: dbroz2@uic.edu<br />
James K. Byrom<br />
Program Analyst<br />
Pharmaceutical Investigations Section<br />
Office of Enforcement<br />
Drug Enforcement Administration<br />
2401 Jefferson Davis Highway<br />
Arlington, VA 22301<br />
Phone: 202-307-4477<br />
Fax: 202-353-9529<br />
E-mail: james.k.byrom@usdoj.gov<br />
M. Fe Caces, Ph.D.<br />
Statistician/Demographer<br />
Office of National Drug Control Policy<br />
750 17th Street, N.W., Room 534<br />
Washington, DC 20503<br />
Phone: 202-395-3173<br />
Fax: 202-395-6729<br />
E-mail: maria_fe_caces@ondcp.eop.gov<br />
Jessica Campbell, Ph.D.<br />
Health Scientist Administrator<br />
Epidemiology Research Branch<br />
Division of Epidemiology, Services and<br />
Prevention Research<br />
National Institute on Drug Abuse<br />
6001 Executive Boulevard<br />
Bethesda, MD 20892<br />
Phone: 301-402-1850<br />
E-mail: jcampbell@mail.nih.gov<br />
334<br />
<strong>EPIDEMIOLOGIC</strong> TRENDS IN <strong>DRUG</strong> <strong>ABUSE</strong>—Participant List<br />
Usha Charya<br />
MasiMax Resources, Inc.<br />
1375 Piccard Drive, Suite 175<br />
Rockville, MD 20850<br />
Phone: 240-683-1746<br />
Fax: 301-926-3156<br />
E-mail: ucharya@masimax.com<br />
Kathy Chimes<br />
Deputy Project Director, DAWN<br />
Westat<br />
1650 Research Boulevard<br />
Rockville, MD 20850<br />
Phone: 301-251-4302<br />
E-mail: chimeski@westat.com<br />
Patricia Cravioto, Ph.D.<br />
Ministry of Health<br />
Cerro de Macuiltepec #83<br />
Col. Campestre Churubusco, 04200<br />
Delegacion Coyoacan, D.F.<br />
Mexico City, Mexico 04200<br />
Phone: 55-5593-10-11<br />
Fax: 55-5651-83-38<br />
E-mail: pcravioto@dgepi.salud.gob.mx<br />
Christine Crossland<br />
Senior Social Science Analyst<br />
National Institute of Justice<br />
U.S. Department of Justice<br />
810 Seventh Street, NW<br />
Room 6319<br />
Washington, DC 20531<br />
Phone: 202-616-5166<br />
Fax: 202-354-4080<br />
E-mail: Christine.Crossland@usdoj.gov<br />
Samuel J. Cutler<br />
Program Manager<br />
Coordinating Office for Drug and Alcohol<br />
Abuse Programs<br />
Office of Behavioral Health<br />
City of Philadelphia<br />
Suite 800<br />
1101 Market Street<br />
Philadelphia, PA 19107-2908<br />
Phone: 215-685-5414<br />
Fax: 215-685-5427<br />
E-mail: sam.cutler@phila.gov<br />
Proceedings of the Community Epidemiology Work Group, Vol. II, January 2005
Janie B. Dargan, M.S.W.<br />
Policy Analyst<br />
Office of National Drug Control Policy<br />
Executive Office of the President<br />
750 17th Street, N.W., 5th Floor<br />
Washington, DC 20503<br />
Phone: 202-395-6714<br />
Fax: 202-395-6729<br />
E-mail: jdargan@ondcp.eop.gov<br />
Anne-Elyse Deguire<br />
Senior Research Analyst<br />
Canadian Centre on Substance Abuse<br />
75 Albert Street, Suite 300<br />
Ottawa, <strong>ON</strong> Canada K1P 5E7<br />
Phone: 613-235-4048, ext 224<br />
Fax: 613-235-8101<br />
E-mail: adeguire@ccsa.ca<br />
Brian J. Dew, Ph.D., L.P.C.<br />
Assistant Professor<br />
Department of Counseling and<br />
Psychological Services<br />
Georgia State University<br />
640 Glen Iris Drive, Suite 510<br />
Atlanta, GA 30308<br />
Telephone: 404-808-5436<br />
Fax: 404-651-1160<br />
E-mail: bdew@gsu.edu<br />
Ilene L. Dode, Ph.D.<br />
EMPACT-Suicide Prevention Center, Inc.<br />
2528 East Geneva Drive<br />
Tempe, AZ 85282<br />
Phone: 480-784-1514, ext. 1116<br />
Fax: 480-967-3528<br />
E-mail: idode@aol.com<br />
Daniel P. Dooley<br />
Boston Public Health Commission<br />
1010 Massachusetts Avenue<br />
Boston, MA 02118<br />
Phone: 617-534-2360<br />
Fax: 617-534-2422<br />
E-mail: ddooley@bphc.org<br />
Carol L. Falkowski<br />
Director<br />
Research Communications<br />
Hazelden Foundation<br />
Butler Center for Research<br />
15245 Pleasant Valley Road, Box 11<br />
Center City, MN 55012-0011<br />
Phone: 651-213-4566<br />
Fax: 651-213-4344<br />
E-mail: cfalkowski@hazelden.org<br />
<strong>EPIDEMIOLOGIC</strong> TRENDS IN <strong>DRUG</strong> <strong>ABUSE</strong>—Participant List<br />
Beth A. Finnerty, M.P.H.<br />
Associate Director of Training/Epidemiologist<br />
ATTC/NIDA Liaison<br />
Integrated Substance Abuse Programs<br />
University of California, Los Angeles<br />
1640 South Sepulveda Boulevard, Suite 200<br />
Los Angeles, CA 90025<br />
Phone: 310-445-0874, ext. 376<br />
Fax: 310-312-0538<br />
E-mail: finnerty@ucla.edu<br />
Robert F. Forman, Ph.D.<br />
Treatment Research Institute<br />
Department of Psychiatry<br />
Treatment Research Center<br />
University of Pennsylvania<br />
600 Public Ledger Building<br />
150 South Independence Mall West<br />
Philadelphia, PA 19106<br />
Phone: 215-399-0980, ext. 145<br />
Fax: 215-399-0987<br />
E-mail: bforman@tresearch.org<br />
Allison S. Gertel-Rosenberg, M.S.<br />
Program Manager<br />
Division of Addiction Services<br />
Office of Policy Development<br />
New Jersey Department of Human Services<br />
120 South Stockton Street, 3rd Floor<br />
P.O. Box 362<br />
Trenton, NJ 08625<br />
Phone: 609-984-4050<br />
Fax: 609-292-1045<br />
E-mail: allison.gertel@dhs.state.nj.us<br />
Michael Ann Haight, M.A.<br />
Silver Gate Group<br />
16233 Oak Springs Drive<br />
San Diego, CA 92186-5222<br />
Phone: 760-789-5332<br />
Fax: 619-920-6311<br />
E-mail: michaelhaight@cox.net<br />
James N. Hall<br />
Director<br />
Center for the Study and Prevention of<br />
Substance Abuse<br />
Up Front Drug Information Center<br />
Nova Southeastern University<br />
Suite 215<br />
12360 Southwest 132nd Court<br />
Miami, FL 33186<br />
Phone: 786-242-8222<br />
Fax: 786-242-8759<br />
E-mail: upfrontin@aol.com<br />
Proceedings of the Community Epidemiology Work Group, Vol. II, January 2005 335
Leigh A. Henderson, Ph.D.<br />
Synectics for Management Decisions, Inc.<br />
3001 Guilford Avenue<br />
Baltimore, MD 21218-3926<br />
Phone: 410-235-3096<br />
Fax: 703-528-6421<br />
E-mail: leighh@smdi.com<br />
Danyelle Hoover<br />
Intelligence Analyst<br />
Intelligence Division<br />
National Drug Intelligence Center<br />
Department of Justice<br />
319 Washington Street, 5th Floor<br />
Johnstown, PA 15901-1622<br />
Phone: 814-532-4596<br />
Fax: 814-532-4690<br />
E-mail: danyelle.hoover@usdoj.gov<br />
Heidi Israel-Adams, Ph.D.<br />
Division of Infectious Diseases<br />
St. Louis University<br />
School of Medicine<br />
1200 South Grand Avenue<br />
St. Louis, MO 63104-1017<br />
Phone: 314-268-5448<br />
Fax: 314-268-5196<br />
E-mail: israelha@slu.edu<br />
Karin Johnson, Dr.P.H., R.N.<br />
Director<br />
Graduate and Second Degree Programs<br />
Department of Nursing<br />
Salisbury University<br />
1101 Camden Avenue<br />
Salisbury, MD 21801<br />
Phone: 410-543-6411<br />
Fax: 410-548-3316<br />
E-mail: kejohnson@salisbury.edu<br />
Barry M. Lester, Ph.D.<br />
Professor<br />
Department of Pediatrics<br />
Brown Medical School<br />
Director, Infant Development Center<br />
Women and Infants Hospital<br />
Infant Development Center<br />
79 Plain Street, 2nd Floor<br />
Providence, RI 02903<br />
Phone: 401-453-7640<br />
Fax: 401-453-7646<br />
E-mail: barry_lester@brown.edu<br />
336<br />
<strong>EPIDEMIOLOGIC</strong> TRENDS IN <strong>DRUG</strong> <strong>ABUSE</strong>—Participant List<br />
Erin Mallonee<br />
Office of Applied Studies<br />
Substance Abuse and Mental Health Services<br />
Administration<br />
1 Choke Cherry Road, Room 7-1044<br />
Rockville, MD 20857<br />
Phone: 240-276-1274<br />
Fax: 240-276-1260<br />
E-mail: erin.mallonee@samhsa.hhs.gov<br />
Rozanne Marel, Ph.D.<br />
Head, Epidemiology and Needs<br />
Assessment<br />
New York State Office of Alcoholism and<br />
Substance Abuse Services<br />
501 7th Avenue, 9th Floor<br />
New York, NY 10018<br />
Phone: 646-728-4605<br />
Fax: 646-728-4685<br />
E-mail: rozannemarel@oasas.state.ny.us<br />
Jane C. Maxwell, Ph.D.<br />
Research Professor<br />
Center for Social Work Research<br />
University of Texas at Austin<br />
Suite 335<br />
1717 West 6th Street<br />
Austin, TX 78703<br />
Phone: 512-232-0610<br />
Fax: 512-232-0616<br />
E-mail: jcmaxwell@sbcglobal.net<br />
John A. Newmeyer, Ph.D.<br />
Epidemiologist<br />
Haight-Ashbury Free Clinics, Inc.<br />
612 Clayton Street, 2nd Floor<br />
San Francisco, CA 94117<br />
Phone: 415-931-5420<br />
Fax: 415-864-6162<br />
E-mail: jnewmeyer@aol.com<br />
Moira P. O'Brien, M. Phil.<br />
Program Director<br />
Research on Emerging and Current Trends<br />
Epidemiology Research Branch<br />
Division of Epidemiology, Services and<br />
Prevention Research<br />
National Institute on Drug Abuse<br />
National Institutes of Health<br />
Room 5153, MSC-9589<br />
6001 Executive Boulevard<br />
Bethesda, MD 20892-9589<br />
Phone: 301-402-1881<br />
Fax: 301-443-2636<br />
E-mail: mobrien@nida.nih.gov<br />
Proceedings of the Community Epidemiology Work Group, Vol. II, January 2005
Martin P. Paulus, M.D.<br />
Associate Professor<br />
Department of Psychiatry<br />
Laboratory of Biological Dynamics and<br />
Theoretical Medicine<br />
University of California San Diego<br />
Suite C213<br />
8950 La Jolla Village Drive<br />
La Jolla CA 92037-0985<br />
Phone: 858-642-3390<br />
Fax: 858-642-1429<br />
E-mail: mpaulus@ucsd.edu<br />
Cathy Reback, Ph.D.<br />
Principal Investigator<br />
Friends Research Institute<br />
1136 North La Brea Avenue<br />
West Hollywood, CA 90038<br />
Phone: 323-463-2295<br />
Fax: 323-463-0126<br />
E-mail: rebackcj@aol.com<br />
Jean J. Schensul, Ph.D.<br />
Executive Director<br />
The Institute for Community Research<br />
Two Hartford Square West, Suite 100<br />
Hartford, CT 06106-5128<br />
Phone: 860-278-2044 ext. 227<br />
Fax: 860-278-2141<br />
E-mail: jschensu@aol.com<br />
Marcella H. Sorg, R.N., Ph.D.<br />
Research Associate<br />
Margaret Chase Smith Center for Public<br />
Policy<br />
Rural Drug and Alcohol Research Program<br />
University of Maine<br />
5715 Coburn Hall<br />
Orono, ME 04469-5715<br />
Phone: 207-581-2596<br />
Fax: 207-581-1266<br />
E-mail: marcella.sorg@umit.maine.edu<br />
Gail Thornton-Collins<br />
Program Director<br />
New Orleans Department of Health<br />
Suite 200<br />
2025 Canal Street<br />
New Orleans, LA 70119<br />
Phone: 504-528-1900<br />
Fax: 504-528-1904<br />
E-mail: gailc@new-orleans.la.us<br />
<strong>EPIDEMIOLOGIC</strong> TRENDS IN <strong>DRUG</strong> <strong>ABUSE</strong>—Participant List<br />
James M. Tolliver, M.S., Ph.D.<br />
Pharmacologist<br />
Office of Diversion Control<br />
Drug Enforcement Administration<br />
U.S. Department of Justice<br />
600 Army Navy Drive<br />
Arlington, VA 22202<br />
Phone: 202-307-7180<br />
Fax: 202-353-1263<br />
E-mail: james.m.tolliver@usdoj.gov<br />
Sandra L. Woerle<br />
Social Science Analyst<br />
Office of Research and Evaluation<br />
National Institute of Justice<br />
810 7th Street, N.W.<br />
Washington, DC 20531<br />
Phone: 202-616-9030<br />
E-mail: Sandra.Woerle@usdoj.gov<br />
Liqun Wong, M.S.<br />
Chemist<br />
Office of Diversion Control<br />
Drug Enforcement Administration<br />
U.S. Department of Justice<br />
Washington, DC 20537<br />
Phone: 202-307-7176<br />
Fax: 202-353-1263<br />
E-mail: liqun.l.wong@usdoj.gov<br />
D. William Wood, Ph.D.<br />
University of Hawaii<br />
Department of Sociology<br />
2424 Maile Way<br />
Saunders 247<br />
Honolulu, HI 96822<br />
Phone: 808-956-7693<br />
Fax: 808-956-3707<br />
E-mail: dwwood@hawaii.edu<br />
Proceedings of the Community Epidemiology Work Group, Vol. II, January 2005 337