chapter 2 - Bentham Science
chapter 2 - Bentham Science
chapter 2 - Bentham Science

You also want an ePaper? Increase the reach of your titles
YUMPU automatically turns print PDFs into web optimized ePapers that Google loves.
The Italian Demand for Imported Virgin Olive Oil Research Topics in Agricultural and Applied Economics, Vol. 2 5<br />
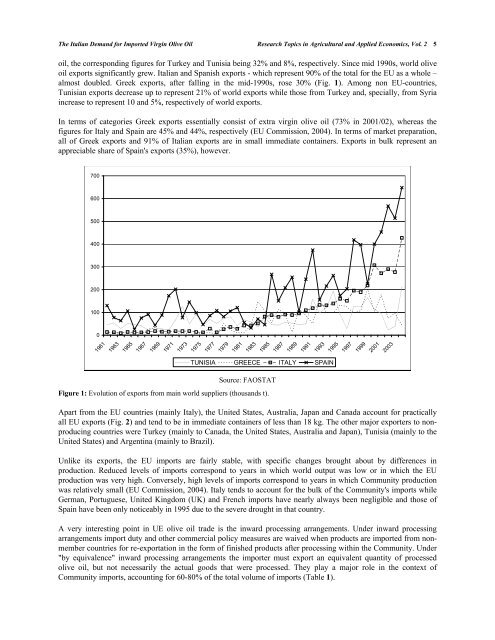
oil, the corresponding figures for Turkey and Tunisia being 32% and 8%, respectively. Since mid 1990s, world olive<br />
oil exports significantly grew. Italian and Spanish exports - which represent 90% of the total for the EU as a whole –<br />
almost doubled. Greek exports, after falling in the mid-1990s, rose 30% (Fig. 1). Among non EU-countries,<br />
Tunisian exports decrease up to represent 21% of world exports while those from Turkey and, specially, from Syria<br />
increase to represent 10 and 5%, respectively of world exports.<br />
In terms of categories Greek exports essentially consist of extra virgin olive oil (73% in 2001/02), whereas the<br />
figures for Italy and Spain are 45% and 44%, respectively (EU Commission, 2004). In terms of market preparation,<br />
all of Greek exports and 91% of Italian exports are in small immediate containers. Exports in bulk represent an<br />
appreciable share of Spain's exports (35%), however.<br />
700<br />
600<br />
500<br />
400<br />
300<br />
200<br />
100<br />
0<br />
Source: FAOSTAT<br />
Figure 1: Evolution of exports from main world suppliers (thousands t).<br />
1961<br />
1963<br />
1965<br />
1967<br />
1969<br />
1971<br />
1973<br />
1975<br />
1977<br />
1979<br />
1981<br />
1983<br />
1985<br />
1987<br />
1989<br />
1991<br />
1993<br />
1995<br />
1997<br />
1999<br />
2001<br />
2003<br />
TUNISIA GREECE ITALY SPAIN<br />
Apart from the EU countries (mainly Italy), the United States, Australia, Japan and Canada account for practically<br />
all EU exports (Fig. 2) and tend to be in immediate containers of less than 18 kg. The other major exporters to nonproducing<br />
countries were Turkey (mainly to Canada, the United States, Australia and Japan), Tunisia (mainly to the<br />
United States) and Argentina (mainly to Brazil).<br />
Unlike its exports, the EU imports are fairly stable, with specific changes brought about by differences in<br />
production. Reduced levels of imports correspond to years in which world output was low or in which the EU<br />
production was very high. Conversely, high levels of imports correspond to years in which Community production<br />
was relatively small (EU Commission, 2004). Italy tends to account for the bulk of the Community's imports while<br />
German, Portuguese, United Kingdom (UK) and French imports have nearly always been negligible and those of<br />
Spain have been only noticeably in 1995 due to the severe drought in that country.<br />
A very interesting point in UE olive oil trade is the inward processing arrangements. Under inward processing<br />
arrangements import duty and other commercial policy measures are waived when products are imported from nonmember<br />
countries for re-exportation in the form of finished products after processing within the Community. Under<br />
"by equivalence" inward processing arrangements the importer must export an equivalent quantity of processed<br />
olive oil, but not necessarily the actual goods that were processed. They play a major role in the context of<br />
Community imports, accounting for 60-80% of the total volume of imports (Table 1).