toyota jidosha kabushiki kaisha toyota motor corporation - Big Three ...
toyota jidosha kabushiki kaisha toyota motor corporation - Big Three ...
toyota jidosha kabushiki kaisha toyota motor corporation - Big Three ...

You also want an ePaper? Increase the reach of your titles
YUMPU automatically turns print PDFs into web optimized ePapers that Google loves.
Table of Contents<br />
ITEM 4A. UNRESOLVED STAFF COMMENTS<br />
None.<br />
ITEM 5. OPERATING AND FINANCIAL REVIEW AND PROSPECTS<br />
5.A OPERATING RESULTS<br />
All financial information discussed in this section is derived from Toyota’s consolidated financial statements that appear elsewhere in this<br />
annual report on Form 20-F. The financial statements have been prepared in conformity with accounting principles generally accepted in the<br />
United States of America.<br />
Overview<br />
The business segments of Toyota include automotive operations, financial services operations and all other operations. Automotive<br />
operations is Toyota’s most significant business segment, accounting for 89% of Toyota’s total revenues before the elimination of intersegment<br />
revenues and 95% of Toyota’s total operating income before the elimination of intersegment revenues and costs for fiscal 2008. The operating<br />
income from automotive operations as a percentage of total operating income increased by 4% compared with fiscal 2007 due to an increase in<br />
operating income from automotive operations. Toyota’s primary markets based on vehicle unit sales for fiscal 2008 were: Japan (25%), North<br />
America (33%), Europe (14%) and Asia (11%).<br />
Automotive Market Environment<br />
The worldwide automotive market is highly competitive and volatile. The demand for automobiles is affected by a number of factors including<br />
social, political and general economic conditions; introduction of new vehicles and technologies; and costs incurred by customers to purchase and<br />
operate vehicles. These factors can cause consumer demand to vary substantially from year to year in different geographic markets and for<br />
different types of automobiles.<br />
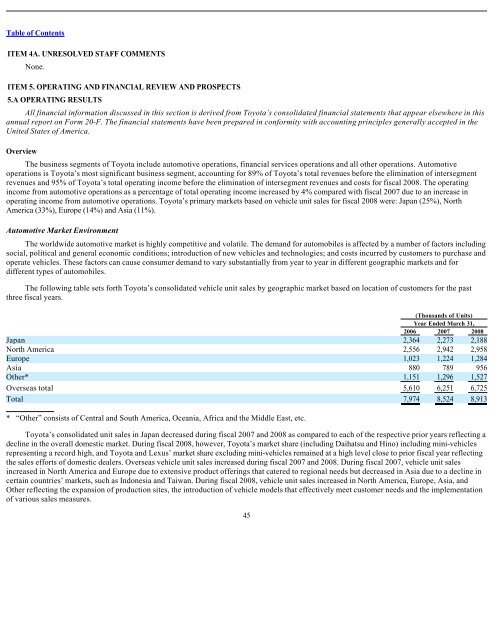
The following table sets forth Toyota’s consolidated vehicle unit sales by geographic market based on location of customers for the past<br />
three fiscal years.<br />
(Thousands of Units)<br />
Year Ended March 31,<br />
2006 2007 2008<br />
Japan 2,364 2,273 2,188<br />
North America 2,556 2,942 2,958<br />
Europe 1,023 1,224 1,284<br />
Asia 880 789 956<br />
Other* 1,151 1,296 1,527<br />
Overseas total 5,610 6,251 6,725<br />
Total 7,974 8,524 8,913<br />
* “Other” consists of Central and South America, Oceania, Africa and the Middle East, etc.<br />
Toyota’s consolidated unit sales in Japan decreased during fiscal 2007 and 2008 as compared to each of the respective prior years reflecting a<br />
decline in the overall domestic market. During fiscal 2008, however, Toyota’s market share (including Daihatsu and Hino) including mini-vehicles<br />
representing a record high, and Toyota and Lexus’ market share excluding mini-vehicles remained at a high level close to prior fiscal year reflecting<br />
the sales efforts of domestic dealers. Overseas vehicle unit sales increased during fiscal 2007 and 2008. During fiscal 2007, vehicle unit sales<br />
increased in North America and Europe due to extensive product offerings that catered to regional needs but decreased in Asia due to a decline in<br />
certain countries’ markets, such as Indonesia and Taiwan. During fiscal 2008, vehicle unit sales increased in North America, Europe, Asia, and<br />
Other reflecting the expansion of production sites, the introduction of vehicle models that effectively meet customer needs and the implementation<br />
of various sales measures.<br />
45