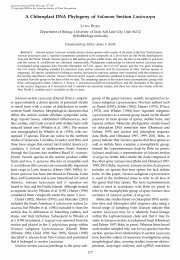
364 KURSAR ET AL. LU z/ 0~~~~~~~~ co1
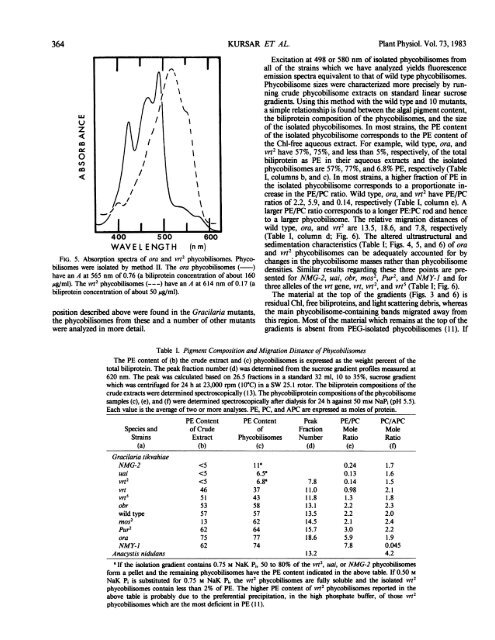
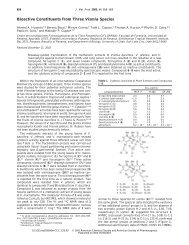
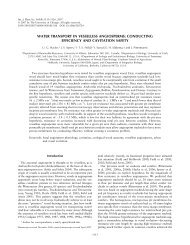
w z m o 0 a d b e C~~~~~~~ PHYCOBILISOMES OF GRACILARIA PIGMENT MUTANTS MIGRATION > FIG. 6. Pr<strong>of</strong>iles <strong>of</strong> <strong>the</strong> phycobilisome isolation gradients <strong>of</strong> (a) vrt5, (b) wild type, (c) ora, (d) vrt2, (e) NMY-J, and (0 vrt. Phycobilisomes were isolated by method II except that a 10 to 20% gradient and a centrifugation time <strong>of</strong> 30 h were used for (d), (e), and (0. The gradients were all scanned at 620 nm and ora was also scanned at 546 nm (---). phycobilisomes prepared using PEG are analyzed on a sucrose gradient, 40 to 70% <strong>of</strong> <strong>the</strong> biliprotein sediments to <strong>the</strong> bottom and <strong>the</strong> remaining soluble phycobilisomes migrate as though aggregated (11). The integrity <strong>of</strong> <strong>the</strong> phycobilisomes is maintained during <strong>the</strong> isolation procedure. After isolation on a sucrose gradient or after rapid separation <strong>of</strong> free biliproteins from phycobilisomes using PEG, in most cases 80 to 90% <strong>of</strong> <strong>the</strong> PE or PC recovered is found in <strong>the</strong> phycobilisomes (data not shown). Two exceptions are mos2 in which 90% <strong>of</strong> <strong>the</strong> PC is not phycobilisome bound and NMY-J in which essentially all <strong>of</strong> <strong>the</strong> PC and 40% <strong>of</strong> <strong>the</strong> PE are not phycobilisome bound. The percent <strong>of</strong> PE in each <strong>of</strong> <strong>the</strong> major phycobilisome-containing sucrose gradient fractions <strong>of</strong> vrt, vrt5, wild type, mos2, Pur2 gradients and ora is presented in Table II. The PE content <strong>of</strong> <strong>the</strong> phycobilisomes in fraction 12 <strong>of</strong> vrt, vrt5, wild type, mos2, and Pur2 is between 43.9 and 57.2% (Table II). Similarly, <strong>the</strong> PE f I'''~~~~~~~~~~~~~~~~~~ content in fraction 17 <strong>of</strong>wild type, mos2, Pur2, and ora is between 66.5% and 74.1%. The differences between strains in <strong>the</strong> PE content <strong>of</strong> equivalent fractions are probably due to diffusion and convection from <strong>the</strong> region <strong>of</strong> highest particle concentration. In <strong>the</strong> absence <strong>of</strong> such effects, <strong>the</strong> PE content <strong>of</strong> a particular sucrose gradient fraction should be nearly equivalent in all <strong>of</strong> <strong>the</strong> strains presented in Table II. If so, <strong>the</strong> gross architecture <strong>of</strong> <strong>the</strong> phycobilisome must be <strong>the</strong> same in all strains (except NMY-1) and <strong>the</strong> phycobilisome sedimentation properties depend primarily on <strong>the</strong>ir content <strong>of</strong> PE. A population <strong>of</strong> phycobilisomes which are heterogeneous in size should also be heterogeneous in biliprotein composition. In wild type, <strong>the</strong> phycobilisomes are 49.9% PE in fraction 12, 54.3% in fraction 13, which increases to 66.5% PE in fraction 17 (Table II). Analogous results were obtained for vrt, vrt5, Pur2, and mos2. These data confirm that, in a particular strain, an increase in phycobilisome size is associated in an increase in <strong>the</strong> PE content <strong>of</strong> <strong>the</strong> phycobilisomes and that in most strains <strong>the</strong> phycobilisomes are heterogeneous in size. The phycobilisomes <strong>of</strong> NMY-1 are unusual in this regard; all <strong>of</strong> <strong>the</strong> NMY-J phycobilisome fractions in Figure 6e have nearly <strong>the</strong> same biliprotein composition (Table II). Ora phycobilisomes also are relatively homogenous as shown by inspection <strong>of</strong> Table II and by comparison <strong>of</strong> gradient scans at 620 and 546 nm (Fig. 6c; cf. Fig. 3). Most <strong>of</strong> <strong>the</strong> strains containing significant amounts <strong>of</strong> PE make phycobilisomes which are quite heterogeneous in size. To investigate size heterogeneity <strong>of</strong> strains with small phycobilisomes, preparations were separated on a shallow sucrose gradient (10- 20%). The phycobilisomes <strong>of</strong>NMY-J and vrt form a broad band and are heterogeneous (Fig. 6, e and f), whereas vrt2 phycobilisomes form a narrow, symmetrical band suggesting that <strong>the</strong>y are homogeneous in size (Fig. 6d). The PC/APC should be independent <strong>of</strong> fraction number. For <strong>the</strong> four strains above and obr, <strong>the</strong> ratios <strong>of</strong> PC to APC <strong>of</strong> <strong>the</strong> individual gradient fractions are 2.0 ± 0.5 (data not shown); <strong>the</strong> average PC/APC <strong>of</strong> <strong>the</strong> main phycobilisome band in wild type and <strong>of</strong> <strong>the</strong> mutants examined is also 2.0 ± 0.5 (Table I, column 0. The uncertainty is due to <strong>the</strong> concentration dependence <strong>of</strong> <strong>the</strong> PC and APC extinction coefficients. Additional evidence on Table II. PE Content <strong>of</strong><strong>the</strong> Principal Phycobilisome-Containing Sucrose Gradient Fractions <strong>of</strong> Wild Type and Selected Mutants <strong>of</strong><strong>Gracilaria</strong> PE content is presented as <strong>the</strong> weight percent <strong>of</strong> <strong>the</strong> total biliprotein. Phycobilisomes were isolated by method II on a 10 to 20% sucrose gradient for NMY-1 and 10 to 35% gradients for <strong>the</strong> o<strong>the</strong>r strains. PE content is expressed as <strong>the</strong> weight percent <strong>of</strong> <strong>the</strong> total biliprotein. The PE contents <strong>of</strong> <strong>the</strong> crude extracts and phycobilisomes were determined as described in Reference 13 and "Materials and Methods," respectively. The values for NMY-1 and vrt are from one experiment; those for vrt5, mos2, Pur2,, and ora are <strong>the</strong> averages <strong>of</strong> two experiments; and <strong>the</strong> values for wild type are <strong>the</strong> averages from three experiments. The values for PE content vary between experiments by 2 to 5 percentage points. Phycoerythrin Content NMY-1 vrt vrt5 Wild mos2 pur2 ora type Crude extract 62 46 51 57 13.5 62 75 Fraction 9 20.9 Fraction 10 28.8 32.0 Fraction 11 37.0 38.0 Fraction 12 43.9 44.2 49.9 53.1 57.2 Fraction 13 48.4 48.5 54.3 58.0 60.2 Fraction 14 71.7 51.7 58.9 60.6 63.2 Fraction 15 72.2 54.6 61.3 64.7 66.0 Fraction 16 73.8 65.2 67.5 68.4 72.2 Fraction 17 73.7 66.5 69.7 70.7 74.1 Fraction 18 74.5 76.6 Fraction 19 74.3 77.9 Fraction 20 78.5 365