an electrical conductivity study
an electrical conductivity study
an electrical conductivity study

You also want an ePaper? Increase the reach of your titles
YUMPU automatically turns print PDFs into web optimized ePapers that Google loves.
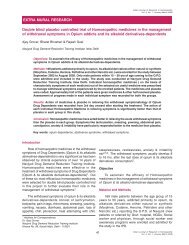
FUNDAMENTAL RESEARCH<br />
Modeling Physical-Chemical Properties of High Dilutions:<br />
<strong>an</strong> <strong>electrical</strong> <strong>conductivity</strong> <strong>study</strong>*<br />
Introduction<br />
High Dilutions (HD) have been prepared all over<br />
the world through a biphasic serial process (named<br />
dynamization) consisting of dilution <strong>an</strong>d succussion<br />
(shaking). As the homeopathic therapy is the most<br />
successful application of HD, its Pharmacopeia has<br />
been adopted by the HD scientific <strong>an</strong>d technological<br />
community. The dilution is usually performed on a<br />
decimal or centesimal scale (per unit of volume) while<br />
succussion c<strong>an</strong> be made by m<strong>an</strong>ual, mech<strong>an</strong>ical, or<br />
vortex procedures, among others [1-2].<br />
The preference for the various succussion methods<br />
is cultural technological commercial or philosophical in<br />
reasoning. However, experimental models <strong>an</strong>d clinical<br />
trials have demonstrated the efficacy of all these<br />
procedures, validating the different succussion<br />
techniques [3-7].<br />
The most common method of succussion is to place<br />
a liquid preparation inside a glass vessel <strong>an</strong>d beat it<br />
vigorously against a hard elastic surface, either<br />
m<strong>an</strong>ually or using a mech<strong>an</strong>ical apparatus.<br />
1<br />
Indi<strong>an</strong> Journal of Research in Homoeopathy<br />
Vol. 2, No. 4, October-December 2008<br />
1 Carla Hol<strong>an</strong>dino, 1 Rafael Harduim, 2 Venício Feo da Veiga, 3 Sheila Garcia, 4 Carlos Renato Zacharias<br />
1. UFRJ – Rio de J<strong>an</strong>eiro Federal University – Laboratory of Pharmaceutical Sciences<br />
2. UFRJ – Rio de J<strong>an</strong>eiro Federal University – Microbiology Institute<br />
3. UFRJ – Rio de J<strong>an</strong>eiro Federal University – Control Quality Laboratory<br />
4. UNESP - São Paulo State University – Chemistry <strong>an</strong>d Physics Department<br />
The most common way to perform succussions is to place a liquid preparation inside a glass<br />
vessel <strong>an</strong>d beat it vigorously against a hard elastic surface, either m<strong>an</strong>ually or using a mech<strong>an</strong>ical<br />
apparatus. This procedure has been assumed able to tr<strong>an</strong>sfer mech<strong>an</strong>ical energy to the molecular<br />
level, where it becomes available to perform chemical work. Such interpretation has been enforced<br />
by observed ch<strong>an</strong>ges in the <strong>electrical</strong> <strong>conductivity</strong> (EC) of High Dilutions (HD) due to succussion.<br />
In order to address this question, we compared the <strong>electrical</strong> <strong>conductivity</strong> ch<strong>an</strong>ges of HD prepared<br />
from Vincristine sulfate (VCR) samples with those of <strong>an</strong> inert solvent. Samples were produced<br />
through m<strong>an</strong>ual <strong>an</strong>d mech<strong>an</strong>ical succusions in order to observe the influence of bubbles production.<br />
The results confirmed the timing of EC ch<strong>an</strong>ges but these were equivalent for VCR <strong>an</strong>d solvent,<br />
except for VCR 1cH samples. Also, the production of bubbles does not affect the EC in <strong>an</strong> extent<br />
able to distinguish succussion procedures. We concluded that the physical-chemical properties<br />
of HD c<strong>an</strong> be modeled by chemical <strong>an</strong>d diffusive mech<strong>an</strong>isms typical of distilled water.<br />
Key words: succussion; <strong>electrical</strong> <strong>conductivity</strong>; high dilutions; distilled water; modeling<br />
*This article was originally published in the journal ‘International<br />
Journal of High Dilution Research’, 2008; 7(25):165-173. Reprinted<br />
with the consent of the author & publisher.<br />
Succussions were initially proposed by Hahnem<strong>an</strong>n [8],<br />
probably inspired on alchemist techniques [9].<br />
Mech<strong>an</strong>ical succussion had probably originated during<br />
the Industrial Revolution, with the desire to produce<br />
higher potencies faster, cheaper <strong>an</strong>d more st<strong>an</strong>dardized<br />
[10]. An import<strong>an</strong>t feature of mech<strong>an</strong>ical succussion is<br />
the intense production of bubbles in the liquid phase<br />
[11], as compared with those produced by m<strong>an</strong>ual<br />
succusion. Physical chemistry leads us to assume that<br />
bubbles increase the surface area of <strong>an</strong>d increase<br />
gasification, in some way augment the chemical<br />
degradation process. However, it is not known if <strong>an</strong>d<br />
how this affects the physical structure <strong>an</strong>d biological<br />
action of high dilutions [12-13]. Also, succussion has<br />
been interpreted as a mech<strong>an</strong>ism that allows tr<strong>an</strong>sfer<br />
of mech<strong>an</strong>ical energy down to the molecular level,<br />
where it becomes available to perform chemical work<br />
[14-16].<br />
Some literature suggests unexpected physical<br />
chemistry properties <strong>an</strong>d biological implications of high<br />
dilutions [17-25] after dynamization. Electrical<br />
<strong>conductivity</strong> measurement is one technique able to<br />
observe the dependence of HD on preparation<br />
protocols <strong>an</strong>d aging [18-20, 23, 26].<br />
Indi<strong>an</strong> Journal of Research in Homoeopathy<br />
Vol. 2, No. 4, October-December 2008
Modeling Physical-Chemical Properties of High Dilutions: <strong>an</strong> <strong>electrical</strong> <strong>conductivity</strong> <strong>study</strong><br />
Carla Hol<strong>an</strong>dino et al<br />
The <strong>electrical</strong> <strong>conductivity</strong> of liquid samples<br />
measures its ability to conduct electricity <strong>an</strong>d is<br />
influenced by chemical species which tend to ionize in<br />
the solution. Therefore chemical degradation <strong>an</strong>d<br />
diffusion play <strong>an</strong> import<strong>an</strong>t rule in the process. Also,<br />
aqueous systems have their own natural ionic species<br />
[27] other th<strong>an</strong> outsider contamin<strong>an</strong>ts.<br />
In this paper, we measured the <strong>electrical</strong><br />
<strong>conductivity</strong> (EC) of m<strong>an</strong>ually <strong>an</strong>d mech<strong>an</strong>ically<br />
sucussed samples of highly diluted Vincristine sulfate<br />
(VCR). The main objective was to qu<strong>an</strong>tify the EC<br />
dependence on time <strong>an</strong>d potency following different<br />
succussion procedures, with the hope of adding to our<br />
physical-chemical underst<strong>an</strong>ding of these procedures.<br />
Material <strong>an</strong>d Methods<br />
The starting solution was Vincristine sulfate – VCR<br />
– (Zodiac®) in purified water. VCR is a<br />
chemotherapeutic agent metabolized by the hum<strong>an</strong><br />
body at 37 Celsius degree, despite its low storage<br />
temperature (-20ºC) [28]. The samples were prepared<br />
<strong>an</strong>d stored at room temperature. VCR was chosen due<br />
our interest treating neoplastic cell cultures with<br />
multidrug resist<strong>an</strong>ce (MDR) to VCR, [29], according to<br />
the principles of isotherapy.<br />
The starting solution consisted of 1.0 mg/ml VCR<br />
diluted in 7.5ml of distilled water, placed in a 10 ml<br />
test-tube. Centesimal Hahnem<strong>an</strong>ni<strong>an</strong> potencies were<br />
produced to 15cH (potentized VCR). Mech<strong>an</strong>ical<br />
succussions (Vm group) were performed with one<br />
hundred succussions (Denise 10-50, Autic®) over 33<br />
seconds (approximately 3 hertz), while h<strong>an</strong>dmade ones<br />
(Vh group) were performed with similar frequency. In<br />
order to register the chemical effect of the VCR<br />
presence or systematic experimental errors on<br />
measurements, equivalent sets of control samples (1<br />
to 15cH) were prepared with distilled water only, by<br />
mech<strong>an</strong>ical (Wm) <strong>an</strong>d m<strong>an</strong>ual (Wh) succussions.<br />
In order to reduce eventual chemical release <strong>an</strong>d<br />
contaminations, ambar borosilicate (USP type I) testtubes<br />
were used, composed mainly of silicon dioxide<br />
<strong>an</strong>d boric oxide, with low levels of the non- networkforming<br />
oxides [30], [31]. Furthermore, all samples were<br />
<strong>an</strong>alyzed in a differential way, comparing the active<br />
sample with its control prepared with solvent only, but<br />
processed in the same m<strong>an</strong>ner. All test-tubes <strong>an</strong>d<br />
plastic stoppers were washed three times with distilled<br />
water (Millipore ® ) before initiating sample preparation.<br />
Test-tubes (10 ml) were filled up to 2/3 volume. Samples<br />
were monitored for microbiological contamination.<br />
Electrical <strong>conductivity</strong> (EC) measurements were<br />
performed on all samples at 25°C with systematic<br />
Indi<strong>an</strong> Journal of Research in Homoeopathy<br />
Vol. 2, No. 4, October-December 2008<br />
2<br />
calibration <strong>an</strong>d temperature compensation using a<br />
Mettler-Toledo MPC 227 apparatus. Intrinsic<br />
experimental errors were 0.5%. The potencies 1cH <strong>an</strong>d<br />
4cH were selected to evaluate the extent of effects due<br />
to the presence of VCR molecules; 7 <strong>an</strong>d 9cH as<br />
examples of pre- Avogadro’s dilutions <strong>an</strong>d 12 to 15cH<br />
as post-Avogadro samples. The Vh <strong>an</strong>d Vm groups<br />
were formed only by potencies at or above 4cH. The<br />
data from the samples were collected immediately after<br />
sample preparation (time zero) <strong>an</strong>d after 7, 14, 21 <strong>an</strong>d<br />
35 days. The samples were kept at rest in the interval<br />
<strong>an</strong>d no succussions were performed before<br />
measurements. Each sample was measured 4 (four)<br />
times to evaluate the averaged value <strong>an</strong>d st<strong>an</strong>dard<br />
deviation.<br />
Results<br />
Figures 1 to 4 shows the EC time dependence, for<br />
VCR <strong>an</strong>d water (control) samples. All <strong>electrical</strong><br />
<strong>conductivity</strong> values are on μS/cm <strong>an</strong>d time in days. The<br />
data are presented as averaged value <strong>an</strong>d st<strong>an</strong>dard<br />
deviation.<br />
Figure 1: Water control samples – mech<strong>an</strong>ical succussions<br />
(Wm). Averaged curves with st<strong>an</strong>dard deviation bars are<br />
shown for all potencies (n cH). The bold line is the averaged<br />
curve over all potencies.<br />
Figure 2: Water control samples – h<strong>an</strong>dmade succussions<br />
(Wh). Averaged curves with st<strong>an</strong>dard deviation bars are shown<br />
for all potencies (n cH). The bold line is the averaged curve<br />
over all potencies.
Figure 3: VCR samples – mech<strong>an</strong>ical succussions (Vm).<br />
Averaged curves with st<strong>an</strong>dard deviation bars are shown for<br />
all potencies (n cH). The bold line is the averaged curve over<br />
all potencies, except 1cH (n ≥ 4).<br />
Figure 4: VCR samples – h<strong>an</strong>dmade succussions (Vh).<br />
Averaged curves with st<strong>an</strong>dard deviation bars are shown for<br />
all potencies (n cH). The bold line is the averaged curve over<br />
all potencies, excep 1cH (n ≥ 4).<br />
Analysis<br />
Observing figures 1 to 4, some common aspects<br />
(except for VCR 1cH curves) c<strong>an</strong> be noted: a time<br />
dependent increase similar for all potencies <strong>an</strong>d a<br />
common starting EC value. Regarding 1cH samples,<br />
the EC time evolution shows two behaviors. The first,<br />
up to 7th day, shows a decrease in EC values (from 24<br />
to 18 ìS/cm), followed by a gradual increase. The initial<br />
decrease c<strong>an</strong> probably be attributed to a chemical<br />
degradation. As noted earlier, VCR must be stored at -<br />
20ºC, despite its clinical use at 37ºC. The samples were<br />
prepared <strong>an</strong>d stored, during the measurement period,<br />
at room temperature (about 25ºC).<br />
A second effect may be attributed to distilled water<br />
dynamics, as will be discussed latter. From 7 th to 35 th<br />
Modeling Physical-Chemical Properties of High Dilutions: <strong>an</strong> <strong>electrical</strong> <strong>conductivity</strong> <strong>study</strong><br />
Carla Hol<strong>an</strong>dino et al<br />
3<br />
day one c<strong>an</strong> observe a slight increasing in EC, similar<br />
to those observed to Vm <strong>an</strong>d Vh groups, as well to<br />
control (Wm <strong>an</strong>d Wh). However, these curves will not<br />
be interpreted in this article. They were collected only<br />
to verify up to what extent the presence of VCR<br />
molecules affects the EC. One c<strong>an</strong> realize from figures<br />
3 <strong>an</strong>d 4 that for VCR 4cH <strong>an</strong>d higher, EC results reveal<br />
a non-measurable presence of VCR molecules <strong>an</strong>d<br />
theirs derivatives.<br />
In figures 1 <strong>an</strong>d 2. All curves show the same time<br />
dependence: <strong>an</strong> initial rapid increase of EC up to day<br />
7 th , starting from EC value about 6.0 ìS/cm, followed<br />
by <strong>an</strong> asymptotical convergence, similar for all<br />
potencies (within st<strong>an</strong>dard deviations) <strong>an</strong>d independent<br />
of the succussion technique. Thus, one c<strong>an</strong> calculate<br />
<strong>an</strong> averaged curve representative of Wm <strong>an</strong>d Wh<br />
groups (figure 5).<br />
Wm <strong>an</strong>d Wh groups have similar behaviors, despite<br />
the different succussion procedures <strong>an</strong>d potencies.<br />
Thus, one c<strong>an</strong> assume that this is the behavior for the<br />
control dynamized distilled water. The EC values for<br />
distilled water used on preparations, while kept at rest,<br />
were (2.76 ± 0.16) μS/cm, typical of values for distilled<br />
water [1]. According to figure 5, the initial value for<br />
dynamized water (EC for t = 0) was about 6.5 μS/cm.<br />
This value me<strong>an</strong>s that the Dynamization procedure,<br />
particularly the succussions, alters the physicalchemical<br />
properties of water, probably due to<br />
gasification <strong>an</strong>d bubbling.<br />
The time dependence c<strong>an</strong> be attributed to typical<br />
water dynamics [27,32] as distilled water is a non-<br />
Figure 5: Wm <strong>an</strong>d Wh data. Experimental points (average<br />
<strong>an</strong>d st<strong>an</strong>dard deviation) are shown in squares (Wm) <strong>an</strong>d<br />
circles (Wh). The averaged curve is shown (tri<strong>an</strong>gles). The<br />
bold curve is the logarithm fitting (see details in text <strong>an</strong>d<br />
table 1). The fitted function <strong>an</strong>d determination coefficient (r 2 )<br />
are also shown.<br />
Indi<strong>an</strong> Journal of Research in Homoeopathy<br />
Vol. 2, No. 4, October-December 2008
Modeling Physical-Chemical Properties of High Dilutions: <strong>an</strong> <strong>electrical</strong> <strong>conductivity</strong> <strong>study</strong><br />
Carla Hol<strong>an</strong>dino et al<br />
equilibrium system. The natural <strong>an</strong>d more stable water<br />
state is reached by the equilibrium of molecular species,<br />
ionic contamin<strong>an</strong>ts, dissolved gases <strong>an</strong>d solutes,<br />
aerosols, <strong>an</strong>d silica among others. As the samples were<br />
prepared using special test-tubes <strong>an</strong>d distilled water,<br />
the molecular dynamics might be driven mainly by the<br />
intrinsic water ion formation <strong>an</strong>d dissolved gases <strong>an</strong>d<br />
aerosols. Ion formation <strong>an</strong>d other chemical reactions<br />
generally are very rapid processes, while gasification<br />
or diffusive mech<strong>an</strong>isms are slower. Wm <strong>an</strong>d Wh<br />
groups exhibited similar behaviors for all measured time<br />
<strong>an</strong>d for all potencies, indicating that if gasification really<br />
happens, it might be import<strong>an</strong>t only during the first hours<br />
after succussions, but would not strongly influence the<br />
chemical stabilization of the solutions. One c<strong>an</strong> visualize<br />
this rapid dynamic period in figure 5: up to the first four<br />
days after succussion the EC values ch<strong>an</strong>ge<br />
signific<strong>an</strong>tly. After 35 days the system reach <strong>an</strong> EC<br />
values about 14.4 μS/cm, <strong>an</strong> intermediated value<br />
between fresh <strong>an</strong>d aged distilled water [33-34].<br />
The EC time dependence of Wm <strong>an</strong>d Wh groups<br />
(figure 5) suggests a rapid dynamic in the first 7 days,<br />
followed by a slow convergence to a stable value (aged<br />
water). Such behavior c<strong>an</strong> be approximated by m<strong>an</strong>y<br />
mathematical functions. One convenient function c<strong>an</strong><br />
be proposed from the natural logarithm, defined as<br />
x(t) = A + B In (t + tr) (eq. 1)<br />
where the coefficients A, B <strong>an</strong>d tr c<strong>an</strong> be adjusted<br />
numerically. Physically, this function describes <strong>an</strong><br />
increasing logarithmic behavior weighted by B, time<br />
shifted by a factor tr with a baseline given by A.<br />
The fit of this function to experimental data is shown<br />
in figure 5 <strong>an</strong>d the fitted coefficients are reported in<br />
table 1:<br />
Table 1: Logarithm fitting for water groups<br />
(averaged curve)<br />
X (t) = A + B ln(t+t r) Numerical fitting<br />
A 7.72 [μS/cm]<br />
B 1.88 [μS/cm.day]<br />
tr 0.53 [day]<br />
r 2 0.972<br />
For VCR groups, the <strong>an</strong>alyses c<strong>an</strong> be done in two<br />
steps: one related to 1cH samples only <strong>an</strong>d the other,<br />
to all other potencies. Figures 3 <strong>an</strong>d 4 refer to VCR<br />
groups (Vm <strong>an</strong>d Vh). At a first gl<strong>an</strong>ce, one may note<br />
that, except for 1cH samples, the EC time dependence<br />
is similar for all potencies <strong>an</strong>d are independent from<br />
Indi<strong>an</strong> Journal of Research in Homoeopathy<br />
Vol. 2, No. 4, October-December 2008<br />
4<br />
the succussion procedure. The exception of 1cH<br />
samples c<strong>an</strong> be understood by the presence of<br />
molecules of VCR (10.0 µg/ml), able to affect the EC<br />
values. For 4cH samples, the concentration reaches a<br />
mathematical value of 1.0 ng/ml, <strong>an</strong>d the EC remains<br />
similar for all higher potencies (within experimental<br />
deviations). Thus, we assumed that after 4cH the EC<br />
time dependence is governed only by solvent effects<br />
other th<strong>an</strong> the presence of VCR molecules or theirs<br />
derivatives. These curves c<strong>an</strong> be <strong>an</strong>alyzed through<br />
averaged curves (figure 6) as well fitted by a logarithm<br />
function, as reported in table 2:<br />
Figure 6: Vm <strong>an</strong>d Vh data. Experimental points (average <strong>an</strong>d<br />
st<strong>an</strong>dard deviation) are shown in squares (Vm) <strong>an</strong>d circles<br />
(Vh). The averaged curve is shown as tri<strong>an</strong>gles. The bold<br />
curve is the logarithm fitting (see detais in text <strong>an</strong>d table 2).<br />
The fitted function <strong>an</strong>d determination coefficient (r 2 ) are also<br />
shown.<br />
Table 2: Logarithm fitting for VCR groups (averaged<br />
curve)<br />
X (t) = A + B ln(t+t r) Numerical fitting<br />
A 7.31 [μS/cm]<br />
B 1.74 [μS/cm.day]<br />
tr 0.51 [day]<br />
r 2 0.929<br />
Comparing both fitted curves (figure 7) as well their<br />
fitted parameters (tables 1 <strong>an</strong>d 2) one c<strong>an</strong> note that<br />
they show the same general behavior, me<strong>an</strong>ing the<br />
chemical process involved might be similar for both<br />
groups. However, one c<strong>an</strong> note that VCR groups show<br />
a slower convergence (smaller B coefficient) with a<br />
slight smaller baseline value (A coefficient), with<br />
equivalent time shift (tr).
Figure 7: Comparison between fitted curves (water <strong>an</strong>d VCR).<br />
The upper graphics is plotted in linear scale <strong>an</strong>d the lower<br />
one, in log-scale. Averaged data (average <strong>an</strong>d st<strong>an</strong>dard<br />
deviation) are shown in squares for water group <strong>an</strong>d in circles<br />
for VCR one. The continuous curve is the logarithm fitting for<br />
water <strong>an</strong>d the dashed for VCR. In the lower graphics one c<strong>an</strong><br />
recognize the systematic difference between curves (see<br />
details in text).<br />
The differences between VCR (for n ≥ 4) <strong>an</strong>d water<br />
samples might suggest some effect based on the<br />
sample histories: while VCR set originates in contact<br />
with VCR molecules, the water set had never be put in<br />
contact with <strong>an</strong>y subst<strong>an</strong>ce other th<strong>an</strong> distilled water.<br />
In some aspects it c<strong>an</strong> be seen as a memory effect,<br />
though chemically supported. One c<strong>an</strong> suppose that<br />
the degradation process of VCR molecules creates<br />
some products or chemical species able to rearr<strong>an</strong>ge<br />
the solvent in order to release or neutralize other<br />
species involved in the solvent <strong>electrical</strong> properties<br />
seen in <strong>electrical</strong> <strong>conductivity</strong>. Considering this<br />
neutralizing process happens in the first few hours, one<br />
would expect smaller values for EC because some<br />
(neutralized) species contribute no more EC ch<strong>an</strong>ges.<br />
One must keep in mind that the sample preparation<br />
Modeling Physical-Chemical Properties of High Dilutions: <strong>an</strong> <strong>electrical</strong> <strong>conductivity</strong> <strong>study</strong><br />
Carla Hol<strong>an</strong>dino et al<br />
5<br />
from 1cH to 15cH requires some time in itself. Further,<br />
considering the EC ch<strong>an</strong>ges occur by different chemical<br />
ch<strong>an</strong>nels, the elimination of some of them c<strong>an</strong> reduces,<br />
but not eliminate, the EC temporal ch<strong>an</strong>ges.<br />
Mathematical Modeling<br />
The EC time dependence showed in figure 7 <strong>an</strong>d<br />
fitted by equation 1 by values reported on table 1 <strong>an</strong>d<br />
2 suggests a slow chemical process, probably due to<br />
gasification or diffusion.<br />
Let’s consider a general chemical reaction (eq. 2)<br />
where some reagents (R i, i=1,L) produce two sets of<br />
products (P j, j=1,M) <strong>an</strong>d (P k, j=1,N) in such way that<br />
only products Pk are involved in the <strong>electrical</strong><br />
<strong>conductivity</strong> time dependence.<br />
L M N<br />
→<br />
←<br />
i=1 j=1 k=1<br />
∑ ciRi ∑cjPj +∑ckPk (eq. 2)<br />
For simplicity, all products Pk will be treated as one<br />
<strong>an</strong>d the effective molar concentration will be named<br />
[P]. As the chemical reaction proceeds, [P] ch<strong>an</strong>ges<br />
over time. Let’s suppose that such time dependence<br />
c<strong>an</strong> be described by a power law (eq. 3)<br />
[P](t) = P 0α(t)(t + t 0) c (eq. 3)<br />
where [P](t) is the [P] value at the inst<strong>an</strong>t t (mol/l), t is<br />
the time (day), P 0 is the [P] for t = 0, α(t) is a function<br />
related to the reaction speed (day -1), c is the exponent<br />
that governs the [P] time dependence (reaction order)<br />
<strong>an</strong>d t 0 is a reference time indicating that the reaction<br />
has already started before t=0 (day).<br />
The use of a power law for fitting is convenient<br />
because by adjusting the exponent c one c<strong>an</strong> model<br />
different time dependences as described in table 3.<br />
Table 3: Time dependence accordingly exponent c.<br />
c value Interpretation<br />
c
Modeling Physical-Chemical Properties of High Dilutions: <strong>an</strong> <strong>electrical</strong> <strong>conductivity</strong> <strong>study</strong><br />
Carla Hol<strong>an</strong>dino et al<br />
The assumption of speed reaction time dependent<br />
[α(t)] is import<strong>an</strong>t because as t→∞ the reaction must<br />
stop (dynamical equilibrium) due to the consumption<br />
of reagents or inversion in the reaction direction.<br />
However, as we have measured the EC time<br />
dependence only during the first 35 days, <strong>an</strong>d figure 7<br />
indicates that the reaction continues for longer times,<br />
we will assume that α(t) is a const<strong>an</strong>t, named only as<br />
α.<br />
So, eq. 3 c<strong>an</strong> be rewrite as<br />
[P](t) = P 0α(t + t 0) c (eq. 4)<br />
The values of P0, α, t0 <strong>an</strong>d c c<strong>an</strong> be determined by<br />
fitting with averaged experimental values (figure 7). As<br />
the obtained experimental data refers to EC values,<br />
one has to establish a correlation between [P] <strong>an</strong>d EC.<br />
As far as the authors know, such correlation seems to<br />
be non-trivial. However, it is well known that the<br />
measurement of pH <strong>an</strong>d EC are technically similar,<br />
based on ion tr<strong>an</strong>sport. The relation between pH <strong>an</strong>d<br />
molar concentration is defined through a logarithm<br />
function. Thus, one c<strong>an</strong> propose <strong>an</strong> equivalent relation<br />
to EC <strong>an</strong>d [P] as defined in eq. 5.<br />
X(t) [P](t)<br />
—— = |n ( ———)<br />
(eq. 5)<br />
X 0<br />
P 0<br />
where, Χ (t) <strong>an</strong>d [P] (t) are, respectively, the EC <strong>an</strong>d molar<br />
concentration of P at <strong>an</strong>y time t <strong>an</strong>d Χ 0 <strong>an</strong>d P 0 are the<br />
respective initial values. The hypothesis proposed in<br />
eq. 5 involves relative qu<strong>an</strong>tities to simplification <strong>an</strong>d<br />
dimensional adjustment.<br />
Starting from eq. 4, one c<strong>an</strong> calculate the EC time<br />
dependence as bellow:<br />
[P](t)<br />
—— = α(t + t0) c<br />
P0 [P](t)<br />
———) = |n(a(t + t0) c )<br />
P0 [P](t)<br />
———) = |n(a) + c |n(t + t0) |n (<br />
|n (<br />
P 0<br />
The left term c<strong>an</strong> be substituted accordingly eq. 5<br />
to obtain<br />
X(t)<br />
—— = |n(a) + c |n(t + t 0)<br />
X 0<br />
Finally we c<strong>an</strong> state,<br />
X(t) = X 0 |n(a) + X 0c |n(t + t 0) (eq. 6)<br />
Indi<strong>an</strong> Journal of Research in Homoeopathy<br />
Vol. 2, No. 4, October-December 2008<br />
6<br />
Equation 6 has the same mathematical structure<br />
as the eq. 1, used to fit experimental data. Comparing<br />
both equations we c<strong>an</strong> identify parameters A, B <strong>an</strong>d tr<br />
as:<br />
A = X 0 |n(a) (eq. 8)<br />
B = X 0c (eq. 9)<br />
t r = t 0<br />
Numerical Fittings<br />
(eq. 10)<br />
In order to compare eqs. 8 to 10 with numerical<br />
data reported in tables 1 <strong>an</strong>d 2, one first needs to<br />
determine X 0 values for water (W) <strong>an</strong>d VCR (V)<br />
averaged curves. These c<strong>an</strong> be calculated from data<br />
on tables 1 <strong>an</strong>d 2, imposing t=0 in eq. 1. Thus one<br />
obtains X 0 = 6.5 <strong>an</strong>d 6.1 μS/cm for water <strong>an</strong>d VCR<br />
groups, respectively. Then, the parameters A, B <strong>an</strong>d tr<br />
c<strong>an</strong> be calculated, as reported on table 4.<br />
Table 4: Numerical fitted parameters<br />
Parameter Water VCR average<br />
a (day -1 ) 3.28 3.31 3.30<br />
c 0.289 0.284 0.287<br />
t 0 (day) 0.53 0.51 0.52<br />
The values reported on table 4 indicate that the<br />
chemical temporal dynamics for water <strong>an</strong>d VCR are<br />
similar. As discussed before, the differences observed<br />
on figure 7 might be explained as a consequence of<br />
the initial VCR degradation, while the samples were<br />
being prepared or during the first hours after<br />
preparation. The similar values reported on table 4<br />
come to reinforce this hypothesis. So, it is convenient<br />
calculate the averaged values for these parameters.<br />
The parameter c reveals a dissipative dynamics<br />
where the continuous formation of the product P k<br />
inhibits the chemical reaction <strong>an</strong>d thus, the increase of<br />
the EC. From eq. 4 <strong>an</strong>d table 4 one c<strong>an</strong> determine the<br />
relative molar concentration (M p) as well its formation<br />
speed (s p) as given below:<br />
[P](t)<br />
Mp(t) = ——— = 3.30 (t + 0.52) 0.287<br />
P0 d [P](t)<br />
Sp(t) = — ( ———) = 0.95(t + 0.52)–0.71<br />
dt P0 M p(t) <strong>an</strong>d S p(t) c<strong>an</strong> be visualized in figure 8.
Figure 8: relative molar concentration (M p) <strong>an</strong>d product<br />
formation speed (s p).<br />
Figure 8 shows that the reaction speed reduces to<br />
50% in 1 day <strong>an</strong>d 25% after 7 days, when the second<br />
set of measurements were collected. Thus, the details<br />
of this fast dynamics could not be directly observed.<br />
After the 7 th day, the speed decreases slowly, as the<br />
relative molar concentration increase almost linearly.<br />
As discussed before, the reaction must reach a steady<br />
state represented by stable concentrations <strong>an</strong>d speed<br />
values. However, this condition was not observed within<br />
the first 35 days.<br />
Conclusions<br />
The first objective of this work was compare<br />
mech<strong>an</strong>ically <strong>an</strong>d m<strong>an</strong>ually succussed highly diluted<br />
samples regarding a physical chemical parameter. The<br />
selection of <strong>electrical</strong> <strong>conductivity</strong> was based on<br />
recently published articles suggesting the existence of<br />
a complex dynamic of the water able to exhibit memory<br />
<strong>an</strong>d time dependent effects.<br />
As the initial solution contained molecules of VCR<br />
<strong>an</strong>d was prepared at room temperature, chemical<br />
degradation was expected. Thus, we <strong>an</strong>alyzed VCR<br />
data only for potencies 4cH or higher. The control<br />
samples were prepared using the same protocol using<br />
only distilled water.<br />
Mech<strong>an</strong>ical succussions are known to produce<br />
intense bubbling when compared to h<strong>an</strong>dmade<br />
ones. Bubbles, beyond being a mech<strong>an</strong>ical agent,<br />
increase the contact air-liquid area generally<br />
affecting the speed of reactions. Thus, a chemically<br />
instable subst<strong>an</strong>ce submitted to bubbling would<br />
reveal differences when compared to water control<br />
samples.<br />
The experimental results showed differences<br />
between VCR <strong>an</strong>d control samples (figure 7) but these<br />
were systematic (figure 7, lower graphic). These<br />
Modeling Physical-Chemical Properties of High Dilutions: <strong>an</strong> <strong>electrical</strong> <strong>conductivity</strong> <strong>study</strong><br />
Carla Hol<strong>an</strong>dino et al<br />
7<br />
differences could be explained by chemical effects in<br />
the first days after samples preparation. Such a<br />
hypothesis was reinforced by the calculation of the<br />
model parameter, reported on table 4, similarly valued<br />
for both groups of samples, as well for the similarity<br />
between VCR <strong>an</strong>d control samples in all potencies (n<br />
cH).<br />
Mathematical modeling requires the assumption of<br />
a relationship between EC <strong>an</strong>d [P] (eq. 5). Despite its<br />
similarity with the concept of pH, this assumption must<br />
be studied further to be confirmed. The use of a power<br />
law to fit EC time dependence is not critical, because<br />
this function c<strong>an</strong> describe m<strong>an</strong>y natural phenomena<br />
<strong>an</strong>d the parameters were adjusted from experimental<br />
data, obtaining a correlation factor almost unitary (see<br />
tables 1 <strong>an</strong>d 2).<br />
The main conclusion is that water shows a slow<br />
dynamics, probably driven mainly by diffusive<br />
mech<strong>an</strong>isms without relation with <strong>an</strong>y special<br />
property of the dynamization procedure beyond th<strong>an</strong><br />
mech<strong>an</strong>ical agitation. Memory effect c<strong>an</strong> be<br />
understood as a time shift in such dynamics.<br />
Bubbling represents <strong>an</strong> import<strong>an</strong>t process only when<br />
<strong>an</strong> instable subst<strong>an</strong>ce is present. For samples<br />
prepared with distilled water only, no difference was<br />
observed between 1cH <strong>an</strong>d higher potencies.<br />
However, all potencies for both groups showed <strong>an</strong><br />
increase of EC even at the first measurements, when<br />
compared with distilled water kept at rest. Our<br />
findings are in agreement with the well known fact<br />
that distilled water is <strong>an</strong> out-of-equilibrium state<br />
<strong>an</strong>d naturally goes to maximum entropy, especially<br />
when perturbed by bubbling <strong>an</strong>d mech<strong>an</strong>ical<br />
agitation.<br />
All these conclusions are strongly limited to<br />
<strong>electrical</strong> <strong>conductivity</strong> measurements. No biological<br />
implication c<strong>an</strong> be extracted directly from these<br />
results until further biological experiments are<br />
performed, in order to correlate EC with biological<br />
effects [35].<br />
Despite the findings reported in this article<br />
indicate that dynamized Vincristine is not different<br />
from water (in terms of EC), it does not me<strong>an</strong>s that<br />
HDs do not have biological action. One c<strong>an</strong>not<br />
invalidate the biological activity evidences based on<br />
isolated EC results or <strong>an</strong>y other physical-chemical<br />
parameter. HD biological activity is not well<br />
understood <strong>an</strong>d some evidences seem to indicate<br />
that a biological sensor is required to observe the<br />
responses. If this hypothesis is true, non-biological<br />
studies should be secondary to characterize a<br />
HD. Much research work is required to clear this<br />
point.<br />
Indi<strong>an</strong> Journal of Research in Homoeopathy<br />
Vol. 2, No. 4, October-December 2008
Modeling Physical-Chemical Properties of High Dilutions: <strong>an</strong> <strong>electrical</strong> <strong>conductivity</strong> <strong>study</strong><br />
Carla Hol<strong>an</strong>dino et al<br />
Acknowledgements<br />
This work was supported by Conselho Nacional<br />
de Desenvolvimento Científico e Tecnológico (CNPq),<br />
Fundação de Amparo a Pesquisa no Estado do Rio de<br />
J<strong>an</strong>eiro (FAPERJ), Fundação José Bonifácio<br />
(FUJB),FundaçãoAryFr<strong>an</strong>zino/Fundação Educacional<br />
Charles Darwin (FAF/FECD/ONCO) <strong>an</strong>d Projetos de<br />
Pesquisa para o Sistema Único de Saúde (PPSUS/<br />
FAPERJ).<br />
References<br />
[1] Brazili<strong>an</strong> Homeopathic Pharmacopeia. 2° ed, vol 1. São<br />
Paulo: Atheneu, 1997.<br />
[2] The Homeopathic Pharmacopoeia of the United States<br />
8th edn, vol I, 1979, p.14.<br />
[3] Belon P, Cumps J, Ennis M, et al. Histamine dilutions<br />
modulate basophil activation. Inflamm Res. 2004; 53(5):<br />
181-188.<br />
[4] Bonamin LV, Lagache A, Bastide M. Research on Ultradilutions<br />
<strong>an</strong>d the theory of corporeal signifiers: the follow<br />
up. In: Bonamin LV, editor. Signals<strong>an</strong>dImages:<br />
Contributions<strong>an</strong>d Contradictions about High Dilution<br />
Research. Heidelberg: Springer; 2008. 3-25.<br />
[5] Aquino CL, Barbosa GM, Barbosa GM, Varricchio MCBA,<br />
Veiga VF, Kuster R, Z<strong>an</strong>c<strong>an</strong> P, Sola-Penna M, Quaresma<br />
CH. High dilutions of Euphorbia tirucalli L. (AVELOZ)<br />
modify the viability <strong>an</strong>d glycolytic metabolism of cell lines.<br />
Int J High Dilution Res [serial on the WWW]. 2008 [cited<br />
2008 Oct 05]; 7(24): 132-139.<br />
[6] Sh<strong>an</strong>g A, Müntener-H K, Nartey L, et al. Are the clinical<br />
effects of homoeopathy placebo effects? Comparative<br />
<strong>study</strong> of placebo-controlled trials of homoeopathy <strong>an</strong>d<br />
allopathy. L<strong>an</strong>cet. 2005; 366: 726-732.<br />
[7] Varricchio MCBN, Aquino C L, Moreno GB, Pereira FG,<br />
Veiga VF, Z<strong>an</strong>c<strong>an</strong> P, Sola-Penna M, Kuster RM,<br />
Hol<strong>an</strong>dino C. Cytotoxicity <strong>an</strong>d <strong>an</strong>titumoral activity of<br />
extremely diluted solutions of Euphorbia tirucalli Lineu:<br />
<strong>an</strong> in vitro <strong>study</strong>. Proceedings of the Improving the<br />
Success of Homeopathy 5: A global perspective; 2006;<br />
London, UK. London. P 141.<br />
[8] Hahnem<strong>an</strong>n S. Org<strong>an</strong>on of Medicine. 6th ed. London:<br />
Orion Books Ltd; 2003. §270.<br />
[9] Ruiz R. Da Alquimia à Homeopatia. Bauru: Edusc; 2002.<br />
[10] Wiston J. A brief history of potentizing machines. British<br />
Homeopathic J. 1989; 78(1): 59-68.<br />
[11] Hol<strong>an</strong>dino C, Leal FD, Barcellos BO, Campos MA,<br />
Oliveira R, Vega VF, Garcia S, Zacharias CR. Mech<strong>an</strong>ical<br />
versus H<strong>an</strong>dmade Succussions: a physical chemistry<br />
comparison. In: Bonamin LV, editor. Signals <strong>an</strong>d Images:<br />
Contributions <strong>an</strong>d Contradictions about High Dilution<br />
Research. Heidelberg: Springer; 2008, 37-48.<br />
[12] Vallée P, Lafait J, Legr<strong>an</strong>d L, Mentré P, Monod MO,<br />
Thomas Y. Effects of pulsed low-frequency<br />
electromagnetic fields on water characterized by light<br />
scattering techniques: role of bubbles. L<strong>an</strong>gmuir. 2005;<br />
21: 2293-2299.<br />
[13] Rey L. Thermoluminescence of ultra high dilutions of<br />
lithium chloride <strong>an</strong>d sodium chloride. Physica A. 2003;<br />
323: 67-74.<br />
Indi<strong>an</strong> Journal of Research in Homoeopathy<br />
Vol. 2, No. 4, October-December 2008<br />
8<br />
[14] Torres, JL. Physical basis of succussion. Homeopathy.<br />
2002; 91(3): 221-224.<br />
[15] Anagnostatos GS. Small water clusters (clathates) in the<br />
preparation process of Homeopathy. In: Endler PC,<br />
Schulte J, editor. Ultra High Dilution: Physiology <strong>an</strong>d<br />
Physics. Dordrecht: Kluwer Academic Publishers; 1994.<br />
121-128.<br />
[16] Auerbach D. Mass, fluid <strong>an</strong>d wave theory motion during<br />
the preparation of the ultra high dilutions. In: Endler PC,<br />
Schulte J, editors. Ultra High Dilution: Physiology <strong>an</strong>d<br />
Physics. Dordrecht: Kluwer Academic Publishers; 1994.<br />
129.<br />
[17] Elia V, Bai<strong>an</strong>o S, Duro I, Napoli E, Niccoli M, Nonatelli L.<br />
Perm<strong>an</strong>ent physical chemistry properties of extremely<br />
diluted aqueous solutions of homeopathic medicines.<br />
Homeopathy. 2004; 93(2): 144-150.<br />
[18] Elia V, Elia L, Cacace P, Napoli E, Niccoli M, Savarese F.<br />
The extremely diluted solutions as multi-variable systems:<br />
a <strong>study</strong> of calorimetric <strong>an</strong>d conductometric behaviour as<br />
a function of the parameter time. J Thermal Analysis <strong>an</strong>d<br />
Calorimetry. 2006; 84(2): 317-323.<br />
[19] Elia V, Marchese M, Mont<strong>an</strong>ino M, Napoli E, Niccoli M,<br />
Nonatelli L, Ramaglia A. Hydrohysteretic phenomena of<br />
extremely diluted solutions induced by mech<strong>an</strong>ical<br />
treatments: a calorimetric <strong>an</strong>d conductometric <strong>study</strong> at<br />
25oC. J Solution Chemistry. 2005; 34(8): 947-960.<br />
[20] v<strong>an</strong> Wijk R, Bosm<strong>an</strong> S, v<strong>an</strong> Wijk EP.<br />
Thermoluminescenceinultra-highdilution research. J<br />
Altern Complement Med. 2006; 12(5): 437-43.<br />
[21] Lobyshev VI, Shikhlinskaya RE, Ryzhikov BD.<br />
Experimental evidence for intrinsic luminescence of<br />
water. J Molecular Liquids. 1999; 82: 73-81.<br />
[22] Samal S, Geckeler KE. Unexpected solute aggregation<br />
in water on dilution. Chem Commun. 2001; 21: 2224-<br />
2225.<br />
[23] Walach H, Assendonk T, Bourkas P, Delininick A, Ives G,<br />
Karraginnopoulos C, Lüdtke R, Wassenhoven M, Witt<br />
C. Electric measurement of ultra-high dilutions – a blinded<br />
controlled experiment. Brit Homeophatic J. 1988; 87:<br />
3-12.<br />
[24] Klimek W, Y<strong>an</strong> Y, Tschulakow AV. A new approach to the<br />
memory of water. Homeopathy. 2005; 94: 241-247.<br />
[25] Elia V, Napoli E, Germ<strong>an</strong>o R. The “Memory of Water”:<br />
<strong>an</strong> almost deciphered enigma. Dissipative structures in<br />
extremely dilute aqueous solutions. Homeopathy. 2007;<br />
96(3): 163-169.<br />
[26] Mir<strong>an</strong>da AR. Water <strong>an</strong>d High Dilutions Phenomenology:<br />
Physical Characterization. In: Bonamin LV, editor. Signals<br />
<strong>an</strong>d Images: Contributions <strong>an</strong>d Contradictions about High<br />
Dilution Research. Heidelberg: Springer; 2008; 49-63.<br />
[27] Chaplin MF. The memory of water: <strong>an</strong> overview.<br />
Homeopathy. 2007; 96(3): 143-150.<br />
[28] BIOMOL International [cited 2008 Oct 08]. [about 1 p].<br />
Available from: http://www.biomol.com/SiteData/docs/<br />
productdata/T 117.pdf.<br />
[29] Hol<strong>an</strong>dino C, Veiga VF, Rodrigues ML, Morales MM,<br />
Capella MAM, Alvi<strong>an</strong>o CS. Direct current decreases cell<br />
viability but not P-Glycoprotein expression <strong>an</strong>d function<br />
in hum<strong>an</strong> multidrugresist<strong>an</strong>tleukaemiccells.<br />
Bioelectromagnetics. 2001; 22: 471-478.<br />
[30] Gennaro AR, editor. Remington: The Science <strong>an</strong>d<br />
Practice of Pharmacy. 20 ed. Philadelphia: Lippincott<br />
Williams & Wilkins; 2000.
[31] Milgrom LR et al, Br Homeopathic J. 2001; 90: 5-13.<br />
[32] Teixeira J. C<strong>an</strong> water possibly have a memory? A<br />
sceotical view. Homeopathy. 2008; 96(3): 158-162.<br />
[33] Lennetech Water Conductivity [cited 2008 Oct 08].<br />
Available from: http://www.lenntech.com/water<strong>conductivity</strong>.htm.<br />
Modeling Physical-Chemical Properties of High Dilutions: <strong>an</strong> <strong>electrical</strong> <strong>conductivity</strong> <strong>study</strong><br />
Carla Hol<strong>an</strong>dino et al<br />
9<br />
[34] Amber Science Inc [cited 2008 Oct 08]. Available from:<br />
http://www.amberscience.com/reference.html.<br />
[35] Zacharias CR. Theoretical <strong>an</strong>d Physical-Chemical<br />
Models for Dynamized Systems: validation creiteria. In:<br />
Bonamin LV, editor. Signals<strong>an</strong>dImages:Contributions<strong>an</strong>d<br />
Contradictions about High Dilution Research. Heidelberg:<br />
Springer; 2008. 29-35.<br />
Indi<strong>an</strong> Journal of Research in Homoeopathy<br />
Vol. 2, No. 4, October-December 2008