iCoseg: Interactive Co-segmentation with Intelligent Scribble Guidance
iCoseg: Interactive Co-segmentation with Intelligent Scribble Guidance
iCoseg: Interactive Co-segmentation with Intelligent Scribble Guidance

Create successful ePaper yourself
Turn your PDF publications into a flip-book with our unique Google optimized e-Paper software.
scheme is illustrated in Figure 3.<br />
5. The CMU-<strong>Co</strong>rnell <strong>i<strong>Co</strong>seg</strong> Dataset<br />
To evaluate our proposed approach and to establish a<br />
benchmark for future work, we introduce the largest co<strong>segmentation</strong><br />
dataset yet, the CMU-<strong>Co</strong>rnell <strong>i<strong>Co</strong>seg</strong> Dataset.<br />
While previous works have experimented <strong>with</strong> a few pairs<br />
of images, our dataset contains 38 challenging groups <strong>with</strong><br />
643 total images (∼17 images per group), <strong>with</strong> associated<br />
pixel-level ground truth. We built this dataset from the<br />
Flickr® online photo collection, and hand-labelled pixellevel<br />
<strong>segmentation</strong>s in all images. We used the “Group”<br />
feature in Flickr, where users form groups around popular<br />
themes, to search for images from this theme. Our dataset<br />
consists of animals in the wild (elephants, pandas, etc.),<br />
popular landmarks (Taj Mahal, Stonehenge, etc.), sports<br />
teams (Baseball, Football, etc.) and other groups that contain<br />
a common theme or common foreground object. For<br />
some (though not all) of the groups, we restricted the images<br />
to come from the same photographer’s photo-stream,<br />
making this a more realistic scenario. Examples of these<br />
groups are shown in various figures in this paper and more<br />
examples may be found online [3]. We note that this<br />
dataset is significantly larger than those used in previous<br />
works [13, 23]. We have made this dataset (and annotations)<br />
publicly available [3] to facilitate further work, and<br />
allow for easy comparisons.<br />
6. Experiments<br />
6.1. Machine Experiments<br />
To conduct a thorough set of experiments and evaluate<br />
various design choices, it is important to be able to perform<br />
multiple iterations <strong>with</strong>out explicitly polling a human<br />
for scribbles. Thus, we develop a mechanism to generate<br />
automatic scribbles, that mimic human scribbles (we also<br />
present results of a user-study in Section 6.2). We model<br />
these synthetic scribbles as (smooth) random walks that do<br />
not cross foreground-background boundaries. Our scribble<br />
generation technique consists of sampling a starting point<br />
in the image uniformly at random. A direction angle is then<br />
randomly sampled such that it is highly correlated <strong>with</strong> the<br />
previous direction sample (for smoothness) for the scribble,<br />
3 and a fixed-size (=30 pixels) step is taken along this<br />
direction to extend the scribble (as long as it does not cross<br />
object boundaries, as indicated by the groundtruth <strong>segmentation</strong><br />
of the image). To mimic user-scribbles given a recommendation<br />
map, the initial as well as subsequent points<br />
on the scribble are picked by considering the recommendation<br />
map to be a distribution. Using synthetic scribbles<br />
3 For the first two sampled points, there is no previous direction and this<br />
direction is sampled uniformly at random.<br />
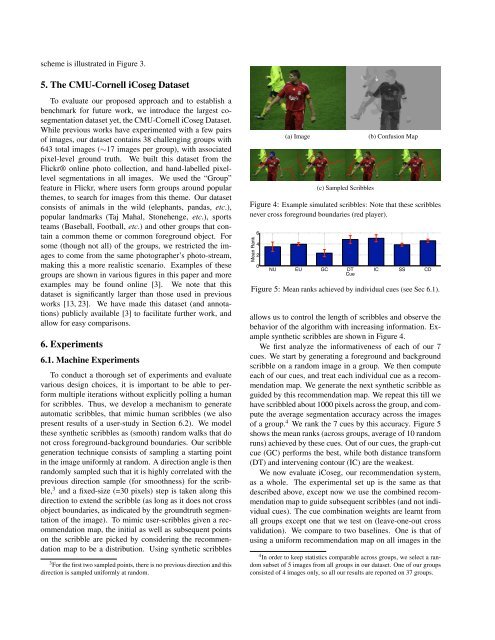
(a) Image (b) <strong>Co</strong>nfusion Map<br />
(c) Sampled <strong>Scribble</strong>s<br />
Figure 4: Example simulated scribbles: Note that these scribbles<br />
never cross foreground boundaries (red player).<br />
Mean Rank<br />
6<br />
4<br />
2<br />
0<br />
NU EU GC DT IC SS CD<br />
Cue<br />
Figure 5: Mean ranks achieved by individual cues (see Sec 6.1).<br />
allows us to control the length of scribbles and observe the<br />
behavior of the algorithm <strong>with</strong> increasing information. Example<br />
synthetic scribbles are shown in Figure 4.<br />
We first analyze the informativeness of each of our 7<br />
cues. We start by generating a foreground and background<br />
scribble on a random image in a group. We then compute<br />
each of our cues, and treat each individual cue as a recommendation<br />
map. We generate the next synthetic scribble as<br />
guided by this recommendation map. We repeat this till we<br />
have scribbled about 1000 pixels across the group, and compute<br />
the average <strong>segmentation</strong> accuracy across the images<br />
of a group. 4 We rank the 7 cues by this accuracy. Figure 5<br />
shows the mean ranks (across groups, average of 10 random<br />
runs) achieved by these cues. Out of our cues, the graph-cut<br />
cue (GC) performs the best, while both distance transform<br />
(DT) and intervening contour (IC) are the weakest.<br />
We now evaluate <strong>i<strong>Co</strong>seg</strong>, our recommendation system,<br />
as a whole. The experimental set up is the same as that<br />
described above, except now we use the combined recommendation<br />
map to guide subsequent scribbles (and not individual<br />
cues). The cue combination weights are learnt from<br />
all groups except one that we test on (leave-one-out cross<br />
validation). We compare to two baselines. One is that of<br />
using a uniform recommendation map on all images in the<br />
4 In order to keep statistics comparable across groups, we select a random<br />
subset of 5 images from all groups in our dataset. One of our groups<br />
consisted of 4 images only, so all our results are reported on 37 groups.