Comparison of Signal-to-noise, Blank Determination, and - Universiti ...
Comparison of Signal-to-noise, Blank Determination, and - Universiti ...
Comparison of Signal-to-noise, Blank Determination, and - Universiti ...

Create successful ePaper yourself
Turn your PDF publications into a flip-book with our unique Google optimized e-Paper software.
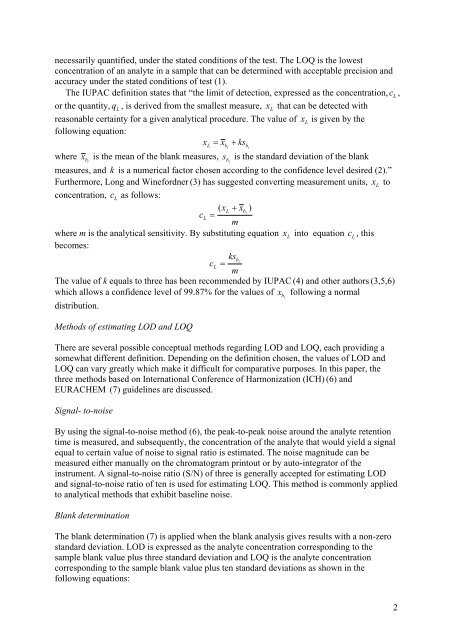
necessarily quantified, under the stated conditions <strong>of</strong> the test. The LOQ is the lowest<br />
concentration <strong>of</strong> an analyte in a sample that can be determined with acceptable precision <strong>and</strong><br />
accuracy under the stated conditions <strong>of</strong> test (1).<br />
The IUPAC definition states that “the limit <strong>of</strong> detection, expressed as the concentration, cL<br />
,<br />
or the quantity, qL , is derived from the smallest measure, L that can be detected with<br />
reasonable certainty for a given analytical procedure. The value <strong>of</strong><br />
x<br />
x L is given by the<br />
following equation:<br />
x = x + ks<br />
L<br />
bi<br />
where i b x is the mean <strong>of</strong> the blank measures, sb<br />
is the st<strong>and</strong>ard deviation <strong>of</strong> the blank<br />
i<br />
measures, <strong>and</strong> k is a numerical fac<strong>to</strong>r chosen according <strong>to</strong> the confidence level desired (2).”<br />
Furthermore, Long <strong>and</strong> Winefordner (3) has suggested converting measurement units, xL<br />
<strong>to</strong><br />
concentration, cL<br />
as follows:<br />
( xL<br />
+ xb<br />
) i<br />
cL<br />
=<br />
m<br />
where m is the analytical sensitivity. By substituting equation xL in<strong>to</strong> equation L , this<br />
becomes:<br />
c<br />
ksbi<br />
cL<br />
=<br />
m<br />
The value <strong>of</strong> k equals <strong>to</strong> three has been recommended by IUPAC (4) <strong>and</strong> other authors (3,5,6)<br />
which allows a confidence level <strong>of</strong> 99.87% for the values <strong>of</strong> x following a normal<br />
distribution.<br />
Methods <strong>of</strong> estimating LOD <strong>and</strong> LOQ<br />
There are several possible conceptual methods regarding LOD <strong>and</strong> LOQ, each providing a<br />
somewhat different definition. Depending on the definition chosen, the values <strong>of</strong> LOD <strong>and</strong><br />
LOQ can vary greatly which make it difficult for comparative purposes. In this paper, the<br />
three methods based on International Conference <strong>of</strong> Harmonization (ICH) (6) <strong>and</strong><br />
EURACHEM (7) guidelines are discussed.<br />
<strong>Signal</strong>- <strong>to</strong>-<strong>noise</strong><br />
By using the signal-<strong>to</strong>-<strong>noise</strong> method (6), the peak-<strong>to</strong>-peak <strong>noise</strong> around the analyte retention<br />
time is measured, <strong>and</strong> subsequently, the concentration <strong>of</strong> the analyte that would yield a signal<br />
equal <strong>to</strong> certain value <strong>of</strong> <strong>noise</strong> <strong>to</strong> signal ratio is estimated. The <strong>noise</strong> magnitude can be<br />
measured either manually on the chroma<strong>to</strong>gram prin<strong>to</strong>ut or by au<strong>to</strong>-integra<strong>to</strong>r <strong>of</strong> the<br />
instrument. A signal-<strong>to</strong>-<strong>noise</strong> ratio (S/N) <strong>of</strong> three is generally accepted for estimating LOD<br />
<strong>and</strong> signal-<strong>to</strong>-<strong>noise</strong> ratio <strong>of</strong> ten is used for estimating LOQ. This method is commonly applied<br />
<strong>to</strong> analytical methods that exhibit baseline <strong>noise</strong>.<br />
<strong>Blank</strong> determination<br />
The blank determination (7) is applied when the blank analysis gives results with a non-zero<br />
st<strong>and</strong>ard deviation. LOD is expressed as the analyte concentration corresponding <strong>to</strong> the<br />
sample blank value plus three st<strong>and</strong>ard deviation <strong>and</strong> LOQ is the analyte concentration<br />
corresponding <strong>to</strong> the sample blank value plus ten st<strong>and</strong>ard deviations as shown in the<br />
following equations:<br />
bi<br />
bi<br />
2