Comparison of Signal-to-noise, Blank Determination, and - Universiti ...
Comparison of Signal-to-noise, Blank Determination, and - Universiti ...
Comparison of Signal-to-noise, Blank Determination, and - Universiti ...
You also want an ePaper? Increase the reach of your titles
YUMPU automatically turns print PDFs into web optimized ePapers that Google loves.
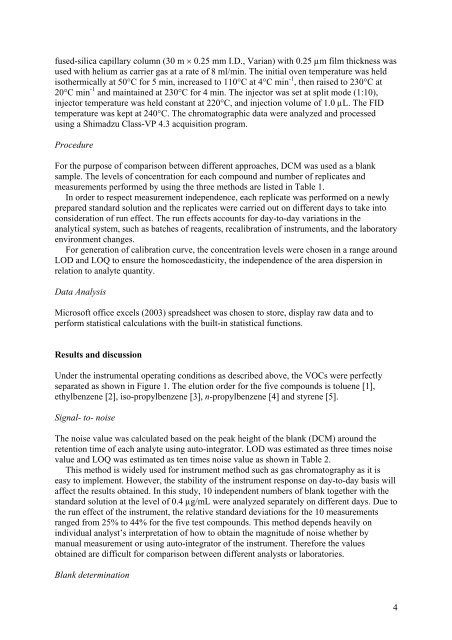
fused-silica capillary column (30 m × 0.25 mm I.D., Varian) with 0.25 µm film thickness was<br />
used with helium as carrier gas at a rate <strong>of</strong> 8 ml/min. The initial oven temperature was held<br />
isothermically at 50°C for 5 min, increased <strong>to</strong> 110°C at 4°C min -1 , then raised <strong>to</strong> 230°C at<br />
20°C min -1 <strong>and</strong> maintained at 230°C for 4 min. The injec<strong>to</strong>r was set at split mode (1:10),<br />
injec<strong>to</strong>r temperature was held constant at 220°C, <strong>and</strong> injection volume <strong>of</strong> 1.0 µL. The FID<br />
temperature was kept at 240°C. The chroma<strong>to</strong>graphic data were analyzed <strong>and</strong> processed<br />
using a Shimadzu Class-VP 4.3 acquisition program.<br />
Procedure<br />
For the purpose <strong>of</strong> comparison between different approaches, DCM was used as a blank<br />
sample. The levels <strong>of</strong> concentration for each compound <strong>and</strong> number <strong>of</strong> replicates <strong>and</strong><br />
measurements performed by using the three methods are listed in Table 1.<br />
In order <strong>to</strong> respect measurement independence, each replicate was performed on a newly<br />
prepared st<strong>and</strong>ard solution <strong>and</strong> the replicates were carried out on different days <strong>to</strong> take in<strong>to</strong><br />
consideration <strong>of</strong> run effect. The run effects accounts for day-<strong>to</strong>-day variations in the<br />
analytical system, such as batches <strong>of</strong> reagents, recalibration <strong>of</strong> instruments, <strong>and</strong> the labora<strong>to</strong>ry<br />
environment changes.<br />
For generation <strong>of</strong> calibration curve, the concentration levels were chosen in a range around<br />
LOD <strong>and</strong> LOQ <strong>to</strong> ensure the homoscedasticity, the independence <strong>of</strong> the area dispersion in<br />
relation <strong>to</strong> analyte quantity.<br />
Data Analysis<br />
Micros<strong>of</strong>t <strong>of</strong>fice excels (2003) spreadsheet was chosen <strong>to</strong> s<strong>to</strong>re, display raw data <strong>and</strong> <strong>to</strong><br />
perform statistical calculations with the built-in statistical functions.<br />
Results <strong>and</strong> discussion<br />
Under the instrumental operating conditions as described above, the VOCs were perfectly<br />
separated as shown in Figure 1. The elution order for the five compounds is <strong>to</strong>luene [1],<br />
ethylbenzene [2], iso-propylbenzene [3], n-propylbenzene [4] <strong>and</strong> styrene [5].<br />
<strong>Signal</strong>- <strong>to</strong>- <strong>noise</strong><br />
The <strong>noise</strong> value was calculated based on the peak height <strong>of</strong> the blank (DCM) around the<br />
retention time <strong>of</strong> each analyte using au<strong>to</strong>-integra<strong>to</strong>r. LOD was estimated as three times <strong>noise</strong><br />
value <strong>and</strong> LOQ was estimated as ten times <strong>noise</strong> value as shown in Table 2.<br />
This method is widely used for instrument method such as gas chroma<strong>to</strong>graphy as it is<br />
easy <strong>to</strong> implement. However, the stability <strong>of</strong> the instrument response on day-<strong>to</strong>-day basis will<br />
affect the results obtained. In this study, 10 independent numbers <strong>of</strong> blank <strong>to</strong>gether with the<br />
st<strong>and</strong>ard solution at the level <strong>of</strong> 0.4 µg/mL were analyzed separately on different days. Due <strong>to</strong><br />
the run effect <strong>of</strong> the instrument, the relative st<strong>and</strong>ard deviations for the 10 measurements<br />
ranged from 25% <strong>to</strong> 44% for the five test compounds. This method depends heavily on<br />
individual analyst’s interpretation <strong>of</strong> how <strong>to</strong> obtain the magnitude <strong>of</strong> <strong>noise</strong> whether by<br />
manual measurement or using au<strong>to</strong>-integra<strong>to</strong>r <strong>of</strong> the instrument. Therefore the values<br />
obtained are difficult for comparison between different analysts or labora<strong>to</strong>ries.<br />
<strong>Blank</strong> determination<br />
4


