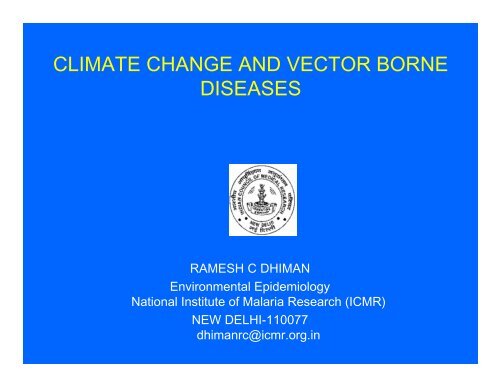
CLIMATE CHANGE AND VECTOR BORNE DISEASES
CLIMATE CHANGE AND VECTOR BORNE DISEASES
CLIMATE CHANGE AND VECTOR BORNE DISEASES

Create successful ePaper yourself
Turn your PDF publications into a flip-book with our unique Google optimized e-Paper software.
<strong>CLIMATE</strong> <strong>CHANGE</strong> <strong>AND</strong> <strong>VECTOR</strong> <strong>BORNE</strong><br />
<strong>DISEASES</strong><br />
RAMESH C DHIMAN<br />
Environmental Epidemiology<br />
National Institute of Malaria Research (ICMR)<br />
NEW DELHI-110077<br />
dhimanrc@icmr.org.in
Overview of presentation<br />
• Evidence of climate change<br />
• Impact of health and VBDs.<br />
• Temp thresholds for transmission.<br />
• Projected impact on Transmission Windows of<br />
Malaria and Dengue using PRECIS model by<br />
2030.<br />
• Emerging chikungunya and Kala-azar need<br />
detailed studies<br />
• Possible adaptation measures.<br />
• CONCLUSION
Changes in Climate<br />
<strong>CLIMATE</strong> has always been changing and this<br />
Change is NATURAL. EARTH has witnessed ice<br />
ages in past which are examples of Change in<br />
Climate.<br />
Naturally occurring Greenhouse Gases include<br />
WATER VAPOUR, CARBON DIOXIDE, OZONE,<br />
METHANE, CLOROFLURO CARBON (CFC) and<br />
NITROUS OXIDE, <strong>AND</strong> TOGETHER CREATE A<br />
NATURAL GREENHOUSE EFFECT.<br />
However, Human activities are causing Greenhouse<br />
Gas levels in the atmosphere to increase and thus<br />
Causing in GLOBAL TEMPERATURE. This increase<br />
in mean Global Temperature is called GLOBAL<br />
WARMING.
What is Climate Change?<br />
Climate change refers to any change<br />
in climate over time, whether due to<br />
natural variability or as a result of<br />
human activity (IPCC,2007).
Projected Global Climate Change (IPCC, 2007)
Anomalies of average land surface maximum<br />
temperatures (°C) (1901–2003)<br />
There is appreciable increase in Temp after 1990. Re-emergence of<br />
Chikungunya in 2006 needs analysis
Potential Impacts of Climate Change on Health (WHO)<br />
Climate Change<br />
Temperature<br />
Precipitation (rainfall)<br />
Sea Level<br />
Weather related<br />
mortality<br />
Infectious diseases<br />
Altered food<br />
productivity &<br />
associated pest and<br />
diseases<br />
Air quality respiratory<br />
illnesses<br />
Heat Strokes<br />
Skin Diseases<br />
Eye Diseases<br />
Floods , Storms leading to deaths,<br />
Injury ,Psychological distress<br />
Loss of PH infrastructure<br />
Geographic range and incidence<br />
of Vector Borne diseases,<br />
Changed incidence of Diarrhoeal<br />
Diseases<br />
Malnutrition , Hunger ,<br />
Impaired child growth and<br />
development<br />
Asthma & Respiratory<br />
diseases
Summary of 4 th Assessment<br />
Report of IPCC (2007)<br />
• Anthropogenic warming has had a discernible influence<br />
on many physical and biological systems.<br />
• Impacts of CC will vary regionally, they are likely to<br />
impose net annual costs which will increase over time.<br />
• Adaptation will be necessary to address impacts from<br />
warming which is unavoidable<br />
• Future vulnerability due to CC depends not only due to<br />
CC but also on development pathway.<br />
• Sustainable development can reduce vulnerability;CC<br />
can impede sustainable devlopment.<br />
• Many impacts can be avoided, reduced or delayed.
Malaria: Epidemiological Triangle<br />
Environment<br />
• Analogy: Applicable to all vector borne diseases<br />
•Development of vectors and pathogens in insect vectors is<br />
affected by climatic conditions
Major Vector Borne Diseases in India<br />
(2010)<br />
Diseases Cases/annum Deaths<br />
Malaria 1.59 million 1023<br />
Filariasis 600 million (total<br />
burden)<br />
Kala-azar 28941 105<br />
Dengue 28292 110<br />
Chikungunya 59535 (23.26%<br />
confirmed)*<br />
Japanese<br />
Encephalitis<br />
*Reported cases in 2007<br />
5149 677<br />
-<br />
-<br />
Source : NVBDCP
Temperature thresholds (0C) for pathogens and<br />
vectors of major vector borne diseases<br />
Disease Pathogen Minimum<br />
Temp<br />
Malaria Plasmodium<br />
falciparum<br />
Plasmodium<br />
vivax<br />
Maximum<br />
temp<br />
Vector Minimum temp<br />
for vector<br />
16–19 C 33–39 Anopheles 8–10 (biological<br />
activity)<br />
14.5–15 C 33–39 Anopheles 8–10 (biological<br />
activity)<br />
Dengue Dengue virus 11.9 not known Aedes 6–10<br />
Chagas<br />
disease<br />
Schistosom<br />
iasis<br />
Lyme<br />
disease<br />
Trypanosoma<br />
cruzi<br />
18 38 Triatomine<br />
bugs<br />
Cercaria 14.2 >37 Snails<br />
(Bulinus and<br />
others)<br />
Borrelia<br />
burdorferi<br />
Not yet<br />
determined<br />
Not yet<br />
determined<br />
Ixodes ticks 5–8<br />
2–6 (survival) 20<br />
(biological<br />
activity)<br />
5(biological<br />
activity)<br />
25±2(optimum<br />
range)<br />
IPCC,2001
Relationship of Temp. & RH with Malaria<br />
Parasite and Mosquito Development<br />
10 11 12 13<br />
Minimum temp. for<br />
parasite development<br />
Optimum<br />
temp.<br />
Maximum temp.<br />
for mosquito<br />
survival<br />
25 26 27 40 o +<br />
Relative Humidity 40 60 70 80+<br />
Minimum T required for transmission<br />
P vivax: 14.5-16 0 C P falciparum:16-18 0 C<br />
(Adapted from :Bruce chwatt ,1980<br />
and Martens et al 1995
Impact Assessments<br />
made
Projected impacts of climate Change ( Source:<br />
IPCC,2007)<br />
Disease‐Region Results<br />
Malaria‐Global >220‐400 m additional pop at risk with A2 scenario<br />
by 2020 to 2080;reduced if >3 consecutive months<br />
are considered.<br />
Malaria‐Africa 16‐28% increase in person‐months of exposure(<br />
including 5‐7% increase in altitudinal by 2020‐2080.<br />
Limited latitudinal expansion.<br />
Malaria‐Zimbabwe Highlands become more suitable for transmission<br />
with 1.4 to 4.5 0 C increase.<br />
Malaria‐ Britain Increase in risk of local malaria transmission 8‐15%<br />
with 1‐2.5 0 C avg T rise by 2050. Indigenous<br />
transmission unlikely.<br />
Malaria‐Portugal<br />
Increase in No of days suitable for survival of malaria<br />
vector. Risk is very low if no vector
Projected impacts of climate Change<br />
Disease‐Region Result<br />
Malaria‐Australia<br />
Malaria‐India<br />
Dengue‐Global<br />
Dengue‐N.Z’land<br />
Dengue‐Australia<br />
Lyme disease‐Canada<br />
Tick borne Encep.<br />
Receptive zone expands southward by 2050. Absolute risk<br />
of reintroduction very low<br />
Projected shift to southwaest and northern states. TWs<br />
widen in northern and wetsern states; shorten in southern<br />
states by 2050.<br />
Global Poln at risk 3.5 billion with CC; 5‐6 billion with<br />
popln. growth & CC( baseline 1.5 billion)<br />
Potential Risk of outbreaks in more regions<br />
Climate suitability increase southwards with 1.8 to 2.8 0 C<br />
increase.<br />
Northward expansion; tick abundance<br />
increase 30‐100% by 2020<br />
Pushed towards northeast under low to high degree of CC<br />
by 2050
(source: WPRO,WHO website (courtesy of Dr. Michael B.<br />
Nathan, Department of Control of Neglected Tropical Diseases,<br />
WHO Geneva)
Estimated baseline population at risk of Dengue<br />
in 1990<br />
Estimated population at risk in 2085<br />
Source: Hales et al 2002
Activities & Methodology<br />
• Analysis of baseline and projected<br />
climatic parameters for malaria/dengue at<br />
national level using A2 and A1B scenario<br />
of PRECIS model<br />
• Detailed analysis for Himalayan region,<br />
Northeastern,Western Ghats and Coastal<br />
areas
Methodology<br />
• Monthly temperature, RH and rainfall (January 1961 to<br />
December 1990) extracted from PRECIS (Providing<br />
Regional Climate for Impact Studies) were used as<br />
baseline.<br />
• Projected scenario (A2 scenario) for 2071,2081,2091<br />
and 2100) of PRECIS were used.<br />
• 18 0 C and 32 0 C T and 55-90% RH were taken as lower<br />
and upper limits for malaria parasite development in<br />
mosquito.<br />
• For dengue 12 0 C T was taken as lower limit while 32 0 C<br />
as upper cut off temperature.
Contd.<br />
• Maps of monthly open Transmission Windows (TW) for<br />
malaria transmission based on Temperature, and T &<br />
RH at each grid (0.44 X 0.44 deg. Pixel, roughly 50 X50<br />
Km) were prepared for baseline and projected scenario.<br />
• Based on the number of months TW is open, pixels were<br />
grouped into 5 classes i.e.<br />
• Class - 1, Closed for 12 months;<br />
• Class – 2, open for 1-3 months;<br />
• Class – 3 open for 4-6;<br />
• Class - 4 open for 7-9 and<br />
• Class – 5 open for 10-12 months.
Contd. Criteria of Determining Transmission<br />
Windows<br />
• Temperature 18-32 C and RH 55% or more: OPEN FOR<br />
TRANSMISSION<br />
• Consecutive opening of TWS for 3 months:<br />
INDIGENOUS TRANSMISSION<br />
• Suitability of transmission for >6 months: STABLE<br />
MALARIA<br />
Scenario used A1B (1961-1990 for baseline and 2030 for projection)
Baseline and projected Transmission windows of malaria<br />
( A2 Scenario)<br />
In 3-9 months TW open<br />
categories, appreciable<br />
increase in months of TWs<br />
is expected leading towards<br />
stable malaria.<br />
In baseline 128 pixels<br />
show NO transmission which<br />
may reduce to 90 pixels by<br />
2091<br />
Baseline TWs in 10-12<br />
months( 546) are likely to be<br />
reduced to 322 by the year<br />
2091.
Transmission Windows of malaria in<br />
baseline and projected temperature and RH<br />
scenario (A2)<br />
TW open<br />
months<br />
2071<br />
2100<br />
Baseline<br />
Reduction in 9-12 month open category; increase in 3-6 month TW open
Scenario<br />
TWs of malaria based on T & RH<br />
(A1B Scenario, by 2030) Dhiman et al 2011<br />
a. Baseline and b. by 2030s In 2009<br />
Baseline<br />
Projection<br />
(by 2030)<br />
Category<br />
(0) II (1 3) III (46) IV (79) V (1012)<br />
Remarks<br />
( NA)<br />
160 118 593 456 126 42<br />
155 152 652 363 131 42
State<br />
No. of<br />
Districts<br />
Gujarat 2<br />
Maharsthra 6<br />
Karnataka 15<br />
Kerala 5<br />
Tamil Nadu 2<br />
5 30<br />
Projection of TWs of malaria in Western Ghats by 2030<br />
( based on Temperature of A1B scenario)<br />
No. of months open for Malaria Transmission<br />
0 1‐2 3 4‐6 7‐9 10‐12 Data not<br />
available<br />
Baseline 0 0 0 0 0 1 1<br />
Projection 0 0 0 0 0 1 1<br />
Baseline 0 0 0 0 0 6 0<br />
Projection 0 0 0 0 0 6 0<br />
Baseline 0 0 0 0 0 15 0<br />
Projection 0 0 0 0 0 15 0<br />
Baseline 0 0 0 0 0 4 1<br />
Projection 0 0 0 0 0 4 1<br />
Baseline 0 0 0 0 0 2 0<br />
Projection 0 0 0 0 0 2 0<br />
Baseline 0 0 0 0 0 28 2<br />
Projection 0 0 0 0 0 28 2
Seasonality of malaria in Mangalore<br />
( Source: Office of DMO, Mangalore)
TWs of malaria in Himalayan region based<br />
on minimum required T and RH under (a)<br />
baseline and (b) projected scenario
Impact of CC in Himalayan region<br />
(based on T & RH)
Projected impact of Climate Change on<br />
malaria in Sambalpur district (Odisha)<br />
Projected reduction in TW by one month will not be affected as<br />
vegetation cover is present over endemic area.
Transmission Windows of dengue in<br />
baseline and projected temperature scenario<br />
(A2)<br />
Transmission<br />
Open Months<br />
Climatically almost whole country is suitable; water<br />
availability and life style are major determinants.<br />
TW Criteria : 12 to 40 C
Transmission Windows of dengue<br />
(A1B Scenario)<br />
Baseline TW criteria: 12-32 C<br />
Projected by 2030<br />
Inconclusive, no matching with current distribution
Conclusion<br />
• Malaria is endemic in most of the districts of India.<br />
Projections based on temperature reveal introduction of<br />
new foci in Jammu & Kashmir and Uttarakhand.<br />
• Increase in opening of more transmission months in<br />
districts of Himalayan region.<br />
• North-eastern states are projected to rise in transmission<br />
intensity.<br />
• Districts under Western Ghats are not likely to<br />
•<br />
experience any change in TWs when determined based<br />
on temperature alone. But TWs based on T and RH<br />
show reduced intensity but increase in months of<br />
transmission.<br />
East coastal areas are projected to experience reduction<br />
in number of months open for transmission (but may<br />
not).
Limitations<br />
• Since transmission dynamics of VBDs is<br />
affected by agricultural practices,<br />
deforestation, urbanization, socioeconomic<br />
conditions and intervention measures,<br />
projections may be viewed as plausible<br />
guidelines and not with certainty.
Adaptation measures<br />
required
National Action Plan on Climate Change<br />
• HEALTH RELATED ACTIVITIES<br />
Provision of enhanced public health care service<br />
Assessment of increased burden of disease due<br />
to climate change.<br />
Providing high-resolution weather and climate<br />
data to study the regional pattern of disease<br />
Development of a high-resolution health impact<br />
model at the state level<br />
GIS mapping of access routes to health facilities<br />
in areas prone to climatic extremes<br />
Prioritization of geographic areas based on<br />
epidemiological data and the extent of<br />
vulnerability to adverse impacts of climate<br />
change<br />
Ecological study of air pollutants and pollen (as<br />
the triggers of asthma and respiratory diseases)<br />
and how they are affected by climate change.<br />
Studies on the response of disease vectors to<br />
climate change<br />
Enhanced provision of primary, secondary and<br />
tertiary health care facilities and implementation<br />
of public health measures, including vector<br />
control, sanitation, and clean drinking water<br />
supply.supply.<br />
www.pmindia.nic.in
Possible adaptation measures<br />
Researchable issues:<br />
• Situation analysis for current strategies in vulnerable areas and in<br />
general.<br />
• Assessment of impact of climatic factors on different species of<br />
disease vectors.<br />
• Development of risk maps of Vector Borne Diseases<br />
• Development of Early warning system<br />
Strengthening of Health system & intervention strategies<br />
• Shift in time of indoor residual spray and number of rounds<br />
• Assessment of adaptive capacity of communities in vulnerable areas<br />
• Health education to communities about prevention and control of<br />
VBDs<br />
• Development of health infrastructure.
Prediction for the Epidemics of malaria in<br />
Kutch( India)<br />
Accumulated rainfall from May to Aug. (blue dots) could predict malaria cases in Sept. to<br />
December ( green dots) using VSEIRS model.<br />
(Laneri et al PLoS Com. Biol. 2010)
Predictability power of NDVI v/s rainfall<br />
The picture shows that NDVI is<br />
a better predictor than rainfall<br />
one month prior (September;<br />
dashed line) to the epidemic<br />
season (Oct-Nov-Dec) for<br />
Barmer, Bikaner and Kutch.<br />
For BMP, rainfall from<br />
Banaskantha is a better<br />
predictor.<br />
For Kheda, neither NDVI nor<br />
rainfall is a good predictor for<br />
the epidemics.<br />
Baeza et al 2011)
Current observations
Distinct Physiography and malaria endemicity in<br />
District Nainital<br />
Tarai<br />
Hills<br />
Bhabhar<br />
API in 2007: Hills- 0 ; Bhabhar- 0.43 ; Tarai- 0.41<br />
Cases reported from Hilly area also
Chikungunya in India<br />
a Circles indicate old foci of chikungunya (till 1973) b. Filled circles indicate<br />
new foci of chikungunya (2005 onwards); figures indicate number of districts<br />
affected
Re-emergence of kala-azar in India<br />
Circles indicate old foci of kala-azar; filled squares indicate kala-azar cases that<br />
occurred till 1982; squares indicate re-emergence of cases; rhombus indicate new<br />
foci of kala-azar after 1982 Dhiman et al 2010
ICMR sponsored project<br />
• Evidence based<br />
assessment of<br />
biophysical<br />
determinants of malaria<br />
in the north-eastern<br />
states of India and<br />
development of<br />
framework for<br />
adaptation measures<br />
for malaria control<br />
under climate change<br />
scenario<br />
.<br />
Almora<br />
Nainital<br />
Karbi<br />
Anglong<br />
Aizwal West<br />
Jorhat<br />
Kolasib<br />
RC Dhiman: PI
Temperature<br />
Temperature<br />
38<br />
36<br />
34<br />
32<br />
30<br />
28<br />
26<br />
24<br />
22<br />
20<br />
18<br />
16<br />
14<br />
12<br />
10<br />
8<br />
6<br />
4<br />
2<br />
0<br />
38<br />
36<br />
34<br />
32<br />
30<br />
28<br />
26<br />
24<br />
22<br />
20<br />
18<br />
16<br />
14<br />
12<br />
10<br />
8<br />
6<br />
4<br />
2<br />
0<br />
Jan, 81<br />
Mar<br />
Temperature of Bhimtal<br />
(a. from 1981 to1983; b. from 2005 to 2008)<br />
Minimum Temp Maximum Temp Average Temp<br />
May<br />
Jul<br />
Sep<br />
Nov<br />
Jan,82<br />
Mar<br />
May<br />
Jul<br />
Years<br />
a<br />
b<br />
Sep<br />
Nov<br />
Jan,83<br />
Mar<br />
May<br />
Jul<br />
Sep<br />
Nov<br />
Minimum Temp Maximum Temp Average Temp<br />
Jan,05<br />
Apr<br />
Jul<br />
Oct<br />
Jan,06<br />
Apr<br />
Jul<br />
Oct<br />
Jan, 07<br />
Apr<br />
Jul<br />
Oct<br />
Jan ,08<br />
Apr<br />
Jul<br />
Oct<br />
years<br />
Rise in minimum<br />
temperature in the month of<br />
March and April ( up to 3.27 0 C)<br />
Reduction in minimum<br />
temperature during winter<br />
months
Development and Malaria<br />
• Sustainable development variables<br />
may sometimes reduce the adverse<br />
impacts on the system due to<br />
climate change alone, while it may<br />
sometimes also aggravate these<br />
impacts if the development variables<br />
are not managed well.<br />
• Well crafted and well managed<br />
developmental policies could result in<br />
enhanced resilience of communities and<br />
systems, and lower health impacts due to<br />
climate change.,<br />
(Garg, A, Dhiman, RC, Bhattacharya S(2009). Environ<br />
Management 43:779:789 DOI10.1007/s00267-008-<br />
9242-z52)
Way forward<br />
• Refined assessments using min/max,<br />
diurnal/night temp and outdoor/indoor temp are<br />
required.<br />
• Dengue and Chikungunya are resurging fast.<br />
Need understanding the relationship between<br />
climate and diseases and impact assessment.<br />
• Leishmaniasis, JE and leptospirosis also need to<br />
be evaluated in the context of climate change.<br />
• Plenty of scope for research.<br />
• ICMR’s Global Environmental Change and<br />
Health,MoEF &DST support research proposals.
• Manoj Pant<br />
• Laxman Chavan<br />
• Sharmila Pahwa<br />
• MoEF and<br />
• IITM Pune<br />
Acknowledgement
Thanks for your<br />
kind attention