Growth assessment in tropical trees: large daily diameter ...
Growth assessment in tropical trees: large daily diameter ...
Growth assessment in tropical trees: large daily diameter ...

You also want an ePaper? Increase the reach of your titles
YUMPU automatically turns print PDFs into web optimized ePapers that Google loves.
Introduction<br />
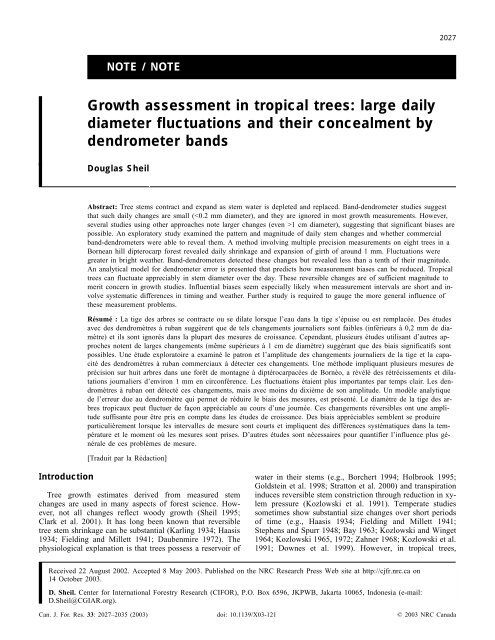
NOTE / NOTE<br />
<strong>Growth</strong> <strong>assessment</strong> <strong>in</strong> <strong>tropical</strong> <strong>trees</strong>: <strong>large</strong> <strong>daily</strong><br />
<strong>diameter</strong> fluctuations and their concealment by<br />
dendrometer bands<br />
Douglas Sheil<br />
Abstract: Tree stems contract and expand as stem water is depleted and replaced. Band-dendrometer studies suggest<br />
that such <strong>daily</strong> changes are small (1 cm <strong>diameter</strong>), suggest<strong>in</strong>g that significant biases are<br />
possible. An exploratory study exam<strong>in</strong>ed the pattern and magnitude of <strong>daily</strong> stem changes and whether commercial<br />
band-dendrometers were able to reveal them. A method <strong>in</strong>volv<strong>in</strong>g multiple precision measurements on eight <strong>trees</strong> <strong>in</strong> a<br />
Bornean hill dipterocarp forest revealed <strong>daily</strong> shr<strong>in</strong>kage and expansion of girth of around 1 mm. Fluctuations were<br />
greater <strong>in</strong> bright weather. Band-dendrometers detected these changes but revealed less than a tenth of their magnitude.<br />
An analytical model for dendrometer error is presented that predicts how measurement biases can be reduced. Tropical<br />
<strong>trees</strong> can fluctuate appreciably <strong>in</strong> stem <strong>diameter</strong> over the day. These reversible changes are of sufficient magnitude to<br />
merit concern <strong>in</strong> growth studies. Influential biases seem especially likely when measurement <strong>in</strong>tervals are short and <strong>in</strong>volve<br />
systematic differences <strong>in</strong> tim<strong>in</strong>g and weather. Further study is required to gauge the more general <strong>in</strong>fluence of<br />
these measurement problems.<br />
Résumé : La tige des arbres se contracte ou se dilate lorsque l’eau dans la tige s’épuise ou est remplacée. Des études<br />
avec des dendromètres à ruban suggèrent que de tels changements journaliers sont faibles (<strong>in</strong>férieurs à 0,2 mm de diamètre)<br />
et ils sont ignorés dans la plupart des mesures de croissance. Cependant, plusieurs études utilisant d’autres approches<br />
notent de <strong>large</strong>s changements (même supérieurs à1cmdediamètre) suggérant que des biais significatifs sont<br />
possibles. Une étude exploratoire a exam<strong>in</strong>é le patron et l’amplitude des changements journaliers de la tige et la capacité<br />
des dendromètres à ruban commerciaux à détecter ces changements. Une méthode impliquant plusieurs mesures de<br />
précision sur huit arbres dans une forêt de montagne à diptérocarpacées de Bornéo, a révélé des rétrécissements et dilatations<br />
journaliers d’environ 1 mm en circonférence. Les fluctuations étaient plus importantes par temps clair. Les dendromètres<br />
à ruban ont détecté ces changements, mais avec mo<strong>in</strong>s du dixième de son amplitude. Un modèle analytique<br />
de l’erreur due au dendromètre qui permet de réduire le biais des mesures, est présenté. Le diamètre de la tige des arbres<br />
tropicaux peut fluctuer de façon appréciable au cours d’une journée. Ces changements réversibles ont une amplitude<br />
suffisante pour être pris en compte dans les études de croissance. Des biais appréciables semblent se produire<br />
particulièrement lorsque les <strong>in</strong>tervalles de mesure sont courts et impliquent des différences systématiques dans la température<br />
et le moment où les mesures sont prises. D’autres études sont nécessaires pour quantifier l’<strong>in</strong>fluence plus générale<br />
de ces problèmes de mesure.<br />
[Traduit par la Rédaction] Sheil 2035<br />
Tree growth estimates derived from measured stem<br />
changes are used <strong>in</strong> many aspects of forest science. However,<br />
not all changes reflect woody growth (Sheil 1995;<br />
Clark et al. 2001). It has long been known that reversible<br />
tree stem shr<strong>in</strong>kage can be substantial (Karl<strong>in</strong>g 1934; Haasis<br />
1934; Field<strong>in</strong>g and Millett 1941; Daubenmire 1972). The<br />
physiological explanation is that <strong>trees</strong> possess a reservoir of<br />
water <strong>in</strong> their stems (e.g., Borchert 1994; Holbrook 1995;<br />
Goldste<strong>in</strong> et al. 1998; Stratton et al. 2000) and transpiration<br />
<strong>in</strong>duces reversible stem constriction through reduction <strong>in</strong> xylem<br />
pressure (Kozlowski et al. 1991). Temperate studies<br />
sometimes show substantial size changes over short periods<br />
of time (e.g., Haasis 1934; Field<strong>in</strong>g and Millett 1941;<br />
Stephens and Spurr 1948; Bay 1963; Kozlowski and W<strong>in</strong>get<br />
1964; Kozlowski 1965, 1972; Zahner 1968; Kozlowski et al.<br />
1991; Downes et al. 1999). However, <strong>in</strong> <strong>tropical</strong> <strong>trees</strong>,<br />
Received 22 August 2002. Accepted 8 May 2003. Published on the NRC Research Press Web site at http://cjfr.nrc.ca on<br />
14 October 2003.<br />
D. Sheil. Center for International Forestry Research (CIFOR), P.O. Box 6596, JKPWB, Jakarta 10065, Indonesia (e-mail:<br />
D.Sheil@CGIAR.org).<br />
Can. J. For. Res. 33: 2027–2035 (2003) doi: 10.1139/X03-121 © 2003 NRC Canada<br />
2027
2028 Can. J. For. Res. Vol. 33, 2003<br />
where transpiration demands may be greater, the subject is<br />
little studied.<br />
This paper <strong>in</strong>vestigates <strong>tropical</strong> tree stem <strong>diameter</strong> fluctuations<br />
and reviews past studies. Us<strong>in</strong>g observations from Indonesian<br />
Borneo, it shows that significant diurnal changes<br />
do occur and that band-dendrometers, the “standard” for record<strong>in</strong>g<br />
short-term changes, can underestimate their magnitude.<br />
The potential to cause bias <strong>in</strong> forest growth monitor<strong>in</strong>g<br />
is discussed. A model to predict dendrometer error and to<br />
suggest improvements is provided.<br />
Previous evidence<br />
I previously suggested that reversible flex<strong>in</strong>g might expla<strong>in</strong><br />
some long-term growth patterns from a semideciduous<br />
Ugandan forest (Sheil 1997). Stem populations from five<br />
plots of over 1.8 ha each varied significantly <strong>in</strong> growth over<br />
consecutive multiyear <strong>in</strong>tervals. In general, the very slowest<br />
grow<strong>in</strong>g stems grew faster over wetter measurement periods,<br />
while most stems grew slower. In Uganda, wet season measures<br />
often take place <strong>in</strong> bright conditions (cloud generally<br />
builds up later <strong>in</strong> the day) when the <strong>trees</strong> are <strong>in</strong> full leaf and<br />
transpiration demands are high.<br />
How <strong>large</strong> are reported <strong>daily</strong> changes <strong>in</strong> <strong>tropical</strong> <strong>trees</strong>?<br />
Unfortunately, <strong>in</strong>formation is scarce. CABI’s compendium<br />
of forestry research abstracts (1939–2001) yields only two<br />
studies (Iyamabo 1971; Yoda and Sato 1975), both of which<br />
are <strong>in</strong>completely reported. These and six other studies are<br />
described <strong>in</strong> Table 1. In summary, two band studies (Sumatra<br />
and Ghana) imply small <strong>daily</strong> fluctuations (0–0.1 mm <strong>in</strong><br />
<strong>diameter</strong>), while five us<strong>in</strong>g other methods (Uganda, Malaysia,<br />
Honduras, Uruguay, and Java) found bigger changes<br />
(0.5 mm to >10 mm). One study (Nigeria) found clear <strong>daily</strong><br />
patterns but their magnitude was not reported.<br />
Suitable data to estimate stem changes <strong>in</strong> relation to water<br />
use are hard to f<strong>in</strong>d. Andrade et al. (1998) and Goldste<strong>in</strong> et<br />
al. (1998) detailed whole-tree water use for one 35-m-tall,<br />
1.02-m-<strong>diameter</strong> Anacardium excelsum <strong>in</strong> Panama. They reported<br />
that “the amount of water withdrawn from stem storage<br />
and subsequently replaced <strong>daily</strong> is 54 kg” (Goldste<strong>in</strong> et<br />
al. 1998). Consider<strong>in</strong>g this deficit aga<strong>in</strong>st stem volume implies<br />
a volumetric ratio of around 0.4%. If reflected <strong>in</strong> <strong>daily</strong><br />
<strong>diameter</strong> changes, this implies shr<strong>in</strong>kage of around 2 mm.<br />
Given rigid vessels, this value is an upper estimate, but<br />
millimetre-scale changes appear to be plausible.<br />
To clarify both the magnitude of <strong>daily</strong> changes and<br />
whether band methods can reveal them, a small exploratory<br />
study was undertaken.<br />
Methods<br />
Site and tree selection<br />
The site is the Centre for International Forestry Research’s<br />
(CIFOR) field camp <strong>in</strong> Mal<strong>in</strong>au, East Kalimantan (Borneo),<br />
Indonesia (UTM50, 44°55′0 0′′ E, 33°23′0 0′′ N). Annual ra<strong>in</strong>fall<br />
is between 3000 and 4000 mm. Vegetation is evergreen<br />
lowland dipterocarp forest. Eight <strong>trees</strong> were subjectively selected<br />
for their wide undistorted boles (Table 2). All lie<br />
with<strong>in</strong> 50 m of each other, 20–50 m from the flood-prone<br />
Seturan River, about 100 m above sea level, on level alluvial<br />
sandy clay soils.<br />
Measurement procedures<br />
Dawk<strong>in</strong>s’ (1956) multiple-measures (DMM) approach<br />
Each bole was scrubbed clean. Eight separate measurement<br />
paths were marked at 10-cm <strong>in</strong>tervals above any buttresses.<br />
For each path, three near-equidistant po<strong>in</strong>ts were<br />
aligned us<strong>in</strong>g a straight edge and marked with oil-based<br />
pa<strong>in</strong>t. Dur<strong>in</strong>g measurement, a steel tape was aligned to the<br />
po<strong>in</strong>ts (requir<strong>in</strong>g two people) and girth recorded to the nearest<br />
millimetre. Ladders were needed on each side of some<br />
stems. For analyses, the eight records were averaged to provide<br />
per stem means.<br />
Band-dendrometers<br />
Band-dendrometers (Series 5, high tension, from Forestry<br />
Suppliers Inc., Jackson, Miss.) were <strong>in</strong>stalled on four stems<br />
above any buttresses and between the DMM mark<strong>in</strong>gs. The<br />
scale hous<strong>in</strong>g is bolted to the tree and holds one end of the<br />
metal band fixed. The other end is attached to a constanttension<br />
spr<strong>in</strong>g (1.22 N) and adjustable vernier scale provid<strong>in</strong>g<br />
0.1-mm resolution. One band was subsequently damaged.<br />
Record<strong>in</strong>g commenced 10 days after <strong>in</strong>stallments.<br />
“Tra<strong>in</strong><strong>in</strong>g read<strong>in</strong>gs” (not used) had confirmed that all units<br />
were show<strong>in</strong>g change.<br />
Schedule<br />
Two circuits were completed each day: 0700 to 0800 hours<br />
and 1500 to 1600 hours. Each circuit took approximately 1 h.<br />
DMM and dendrometer read<strong>in</strong>gs were taken together.<br />
Weather<br />
Each day, hourly classifications of weather were made and<br />
weighted to provide a rough <strong>in</strong>dex of transpiration demand.<br />
The classes (and weights) were as follows: S, full sun (10);<br />
CL, clear (6); LC, light cloud (4); OC, overcast (2); R, ra<strong>in</strong><br />
(–10). Overnight ra<strong>in</strong>, although recorded, is not <strong>in</strong>cluded <strong>in</strong><br />
the <strong>in</strong>dex because, given the wet weather encountered, soils<br />
were never dry and moisture was not considered a limit<strong>in</strong>g<br />
factor.<br />
Results<br />
The dendrometer, DMM, and weather data are presented,<br />
aligned by days, <strong>in</strong> Fig. 1. The dendrometers show only<br />
small size changes dur<strong>in</strong>g the measurement period. A m<strong>in</strong>uscule<br />
(
Sheil 2029<br />
Table 1. Tropical studies record<strong>in</strong>g diurnal tree stem <strong>diameter</strong> changes.<br />
Location Population Method Results Source<br />
Yoda and Sato<br />
1975<br />
All <strong>trees</strong> showed a <strong>daily</strong> cycle with <strong>large</strong>st sizes generally<br />
achieved at night or early morn<strong>in</strong>g and m<strong>in</strong>imum size <strong>in</strong><br />
midafternoon. Unfortunately, stem sizes are only provided<br />
for four <strong>in</strong>dividuals. Summary implies that approximately<br />
0.5–1 mm <strong>daily</strong> changes <strong>in</strong> girth are normal (even on the<br />
33 plate-gauge (not band)<br />
dendrometers. Radial changes<br />
were recorded hourly over<br />
2.5 days<br />
Pasoh, Malayasia 26 stems over 7 cm <strong>in</strong> <strong>diameter</strong> <strong>in</strong><br />
a10m×20mplot<br />
K. Affum-Baffoe<br />
et al., unpublished;<br />
Sheil<br />
1997<br />
Baker et al. 2003<br />
smallest stems)<br />
Despite dull overcast weather, <strong>daily</strong> changes of approximately<br />
0.2% of stem size and a longer term shr<strong>in</strong>k<strong>in</strong>g<br />
trend were detected <strong>in</strong> all of the <strong>trees</strong><br />
Kibale, Uganda Eight <strong>large</strong> stems for 10 days Dawk<strong>in</strong>s’ (1956) method of multiple<br />
measures (see ma<strong>in</strong> text) was<br />
used<br />
T<strong>in</strong>te Bepo and 42 Celtis mildbraedii <strong>in</strong> a<br />
Dendrometer bands (lim<strong>in</strong>g type). Comb<strong>in</strong><strong>in</strong>g results for all four occasions, mean ± SE diurnal<br />
Bonsa River, semideciduous forest<br />
Four occasions twice a day: <strong>diameter</strong> change was 0.017 ± 0.015 mm (n = 59), i.e., a<br />
Ghana<br />
0800 to 1200 hours and 1600 to small change but not significantly different from zero<br />
1800 hours<br />
Jambi, Sumatra, Five planted rubber <strong>trees</strong> (Hevea Dendrometer bands (lim<strong>in</strong>g type). Two of the five <strong>trees</strong> showed some degree of <strong>daily</strong> shr<strong>in</strong>k- G. V<strong>in</strong>cent et al.,<br />
Indonesia brasiliensis), 60–90 cm <strong>in</strong> girth, 0600 and 1800 hours over a age, but the mean <strong>daily</strong> girth change rema<strong>in</strong>ed less than unpublished<br />
<strong>in</strong> “near-open” conditions<br />
period of 8 days<br />
the m<strong>in</strong>imum measurement unit of 0.1 mm<br />
Honduras Sapodilla (Achras zapota) <strong>trees</strong> The exact technique is not<br />
Implies <strong>daily</strong> changes <strong>in</strong> <strong>diameter</strong> of 5 mm or more (<strong>in</strong> Karl<strong>in</strong>g 1934<br />
described but a detailed series of stems about 30 cm <strong>in</strong> <strong>diameter</strong>). Results show that <strong>daily</strong><br />
cont<strong>in</strong>uous read<strong>in</strong>gs are presented changes are less when soil moisture is limited, and <strong>large</strong><br />
changes occur <strong>in</strong> bright but wet conditions<br />
Uruguay Unclear Unclear Reported as “similar” to Karl<strong>in</strong>g (1934) (above) Hall 1890, cited<br />
<strong>in</strong> Karl<strong>in</strong>g<br />
1934<br />
Bogor, Java, “Many different types” “Measured at different time <strong>in</strong>ter- “The <strong>trees</strong> usually decreased <strong>in</strong> <strong>diameter</strong> dur<strong>in</strong>g the fore- Kraus 1895,<br />
Indonesia<br />
vals of the day”<br />
noon and early afternoon and beg<strong>in</strong> to <strong>in</strong>crease at<br />
cited <strong>in</strong><br />
approximately 3:00 pm, thus show<strong>in</strong>g <strong>daily</strong> reversible Karl<strong>in</strong>g 1934<br />
variation. Oreodoxa regia, for <strong>in</strong>stance, varied as much<br />
as 1.02 cm over a period of seven hours”<br />
Nigeria “Three small Triplochiton<br />
Not stated Clear <strong>daily</strong> changes noted (but magnitude not given) (see Iyamabo 1971<br />
scleroxlon [sic] H. Schum”<br />
figs. 2a and 2b <strong>in</strong> Iyamabo 1971)<br />
© 2003 NRC Canada
2030 Can. J. For. Res. Vol. 33, 2003<br />
Table 2. Trees used <strong>in</strong> the <strong>diameter</strong> change <strong>assessment</strong> conducted for this study.<br />
Tree Species<br />
A Gironnera subaquilis<br />
Planch. Ulmaceae<br />
B Litsea garciae Vidal<br />
Lauraceae<br />
C Mallotus c.f. muticus (M.A.)<br />
Airy Shaw Euphorbiaceae<br />
D Mallotus c.f. muticus (M.A.)<br />
Airy Shaw Euphorbiaceae<br />
E Aglaia c.f. argentea Bl.<br />
Meliaceae<br />
F Litsea garciae Vidal<br />
Lauraceae<br />
G Dryobalanops lanceolata<br />
Burck Dipterocarpaceae<br />
H Bhesa paniculata Am.<br />
Celastraceae<br />
*Crown classes as per Dawk<strong>in</strong>s (1958).<br />
Dendrometer<br />
bands<br />
Crown<br />
position*<br />
0.1, n = 12). Figure 1 suggests that fluctuations dur<strong>in</strong>g wetter<br />
periods are reduced with the <strong>large</strong>r fluctuations <strong>in</strong> <strong>in</strong>terven<strong>in</strong>g<br />
bright periods. All DMM series <strong>daily</strong> magnitudes<br />
showed a positive relationship to the <strong>daily</strong> weather <strong>in</strong>dex (12<br />
of 12 positive, P = 0.00024 by exact test, four with P < 0.1)<br />
(Table 4).<br />
The <strong>large</strong>st mean DMM <strong>daily</strong> changes were from tree C, a<br />
tall, not especially exposed Mallotus. The smallest <strong>daily</strong><br />
changes were from <strong>trees</strong> G and H, a <strong>large</strong> well-exposed<br />
hard-barked Dryobalanops and a tall Bhesa. In proportional<br />
terms, the <strong>large</strong>st changes are from tree E, a ragged crowned<br />
Aglaia, while the smallest are from tree G, a <strong>large</strong><br />
Dryobalanops. This sample is too small to generalize how<br />
flex<strong>in</strong>g relates to size, species, crown form, and exposure,<br />
but <strong>daily</strong> girth changes of 0.5–2 mm are unexceptional dur<strong>in</strong>g<br />
this generally cloudy period.<br />
The DMM approach consistently registers <strong>large</strong>r <strong>daily</strong><br />
changes than the dendrometers. The difference between<br />
mean <strong>daily</strong> girth changes for the two methods is just under<br />
1 mm: tree B, 0.77; tree C, 0.98; tree D, 0.92 mm. The magnitude<br />
of each <strong>daily</strong> change recorded by the two different<br />
techniques is plotted for the three <strong>trees</strong> <strong>in</strong> Fig. 2. The scatters,<br />
especially for tree B, suggest a possible stick-slip<br />
dendrometer threshold, where only <strong>large</strong> changes are consistently<br />
detected. The comparison of <strong>large</strong>st versus smallest<br />
records over the full period <strong>in</strong>volved DMM changes of about<br />
2 mm, with one tree, B, giv<strong>in</strong>g a value of 6 mm. The differences<br />
for the dendrometer bands are less (Table 3).<br />
How do DMM and dendrometer approaches compare if<br />
only growth across days is considered? The cross-method<br />
correspondences were exam<strong>in</strong>ed separat<strong>in</strong>g morn<strong>in</strong>g and afternoon<br />
series (Fig. 3). The strength of these relationships<br />
rank <strong>in</strong> order of actual growth (tree B > tree D > tree C).<br />
Tree C shows little correlation. The Pearson correlations for<br />
tree B are almost equal for afternoon and morn<strong>in</strong>g data (afternoon,<br />
r = 0.884; morn<strong>in</strong>g, r = 0.891; P < 0.001 for both,<br />
n = 12) and also for tree D (afternoon, r = 0.693, P = 0.12;<br />
morn<strong>in</strong>g, r = 0.509, P = 0.09), although the overall relationship<br />
is weaker. For tree B, regression of the dendrometer<br />
Crown<br />
form*<br />
Estimated<br />
height (m)<br />
versus DMM measures shows a 95% confidence <strong>in</strong>terval on<br />
a gradient of 0.297 to 0.649 and 0.271 to 0.573 for afternoon<br />
and morn<strong>in</strong>g, respectively; for tree D, the respective ranges<br />
are 0.119 to 0.772 and –0.061 to 0.694, i.e., 1:1 is excluded<br />
<strong>in</strong> all four. However, Fig. 3 also <strong>in</strong>dicates that dur<strong>in</strong>g periods<br />
of rapid <strong>daily</strong> expansion, both methods can show equivalent<br />
changes, with tree B dendrometer track<strong>in</strong>g the DMM<br />
results for the second half of the observation period.<br />
Discussion<br />
Buttress<strong>in</strong>g<br />
to (m)<br />
Height of lowest<br />
read<strong>in</strong>g (m)<br />
Girth<br />
(cm)<br />
Diameter<br />
(cm)<br />
No (broken) 3 5 16 None 1.1 76.2 24.3<br />
Yes at 1.5 m 5 5 18 0.5 1.2 174.2 55.5<br />
Yes at 1.8 m 4 3 23 1.2 1.5 151.4 48.2<br />
Yes at 1.5 m 3 2 20 0.7 1.2 124.9 39.8<br />
No 3 2 18 0.6 1.3 87.5 27.8<br />
No 4 4 20 1.6 1.8 160.8 51.2<br />
No 5 3 36 1.8 2 179.4 57.1<br />
No 3 2 26 2 2.2 161.0 51.2<br />
Overview<br />
The DMM approach offers a technically simple means to<br />
record stem girth changes with submillimetre precision and<br />
accuracy. This reveals morn<strong>in</strong>g–afternoon differences <strong>in</strong><br />
girth of around 1 mm. Tim<strong>in</strong>g and relationships with<br />
weather suggest, as expected, that stem water status is <strong>in</strong>volved.<br />
Band-dendrometers detect some of these changes but<br />
underestimate their magnitude.<br />
Tropical stem shr<strong>in</strong>kage is not a new discovery (e.g.,<br />
Karl<strong>in</strong>g 1934). I suggest two explanations for recent neglect.<br />
First, oversight: studies of tree growth <strong>in</strong> the tropics have neglected<br />
with<strong>in</strong>-day (diurnal) patterns. Second, <strong>in</strong>appropriate<br />
methods: band-dendrometers have become the “technique of<br />
choice” for precision growth studies.<br />
While past observations and the recent study are limited,<br />
they imply that <strong>daily</strong> stem size changes can be <strong>large</strong><br />
(>0.3 mm <strong>in</strong> <strong>diameter</strong>) and that band methods can underestimate<br />
them. Such implications deserve careful appraisal, <strong>in</strong><br />
terms of both general growth studies and specific dendrometer<br />
limitations.<br />
Scales and uncerta<strong>in</strong>ties<br />
Do <strong>daily</strong> size changes matter <strong>in</strong> normal growth <strong>assessment</strong>s?<br />
Currently, we can only speculate about how such effects<br />
might <strong>in</strong>fluence data from general <strong>in</strong>ventory methods<br />
(with tapes, calipers, etc.). Size fluctuations might be viewed<br />
as simple “noise” spread randomly across a population. Yet,<br />
tree measurement sequences are not random, and measure-<br />
© 2003 NRC Canada
Sheil 2031<br />
Fig. 1. Summary of the data from (a) the twice-<strong>daily</strong><br />
dendrometer band records, (b) the twice-<strong>daily</strong> Dawk<strong>in</strong>s (1956)<br />
multiple-measures approach (the first two records were trials several<br />
days before the ma<strong>in</strong> study period; these data are not used<br />
<strong>in</strong> the ma<strong>in</strong> analyses but are <strong>in</strong>cluded here), and (c) the hourly,<br />
by day, and two per night weather records. Note that the horizontal<br />
scale for each is aligned by days but not hours. Capital<br />
letters denote the <strong>trees</strong> as <strong>in</strong> Table 2.<br />
ment periods are never matched for time and weather conditions.<br />
Systematic biases are probable.<br />
Diameter growth <strong>in</strong> <strong>tropical</strong> <strong>trees</strong> is usually around 1–<br />
10 mm/year (Worbes 1999). In the Kalimantan observations,<br />
the <strong>daily</strong> flex<strong>in</strong>g effect is about 0.3 mm <strong>in</strong> <strong>diameter</strong>, and<br />
mean growth is 2.8 mm/year (SD = 0.14, all species comb<strong>in</strong>ed,<br />
stems ≥20 cm <strong>in</strong> <strong>diameter</strong>, twenty-four 1-ha plots for<br />
2 years, n > 2000; CIFOR, unpublished data). A systemwide<br />
bias of 0.3 mm <strong>diameter</strong> would represents about 10%<br />
of yearly growth. At the <strong>in</strong>dividual stem level, the situation<br />
may be worse: the distribution of growth records <strong>in</strong> any census<br />
period is strongly skewed, with a median well below the<br />
mean (Sheil 1995). Biases caused by flex<strong>in</strong>g may cause<br />
<strong>large</strong>r proportionate error on slow-grow<strong>in</strong>g stems than is apparent<br />
us<strong>in</strong>g stand mean data. In addition, most yield summaries<br />
reported from forest plots can be attributed to<br />
changes measured <strong>in</strong> just a few <strong>large</strong>r <strong>trees</strong>: such stems are<br />
generally well exposed to transpiration demands.<br />
Such biases can <strong>in</strong>fluence yield studies. We can illustrate<br />
this us<strong>in</strong>g ∆volume ≈ volume × 2∆girth/girth (∆ means<br />
“change <strong>in</strong>”) (Sheil 1997). Assum<strong>in</strong>g a forest with an aboveground<br />
volume of 400 m 3 /ha and a systematic stem size bias<br />
of 0.1% gives approximately 0.8 m 3 /ha, while a 0.3% bias<br />
implies approximately 2.4 m 3 /ha. These are not negligible<br />
errors.<br />
Bias seems plausible when the absolute growth measurements<br />
are themselves small (e.g., short-term growth studies,<br />
slow-grow<strong>in</strong>g stems) and when climatic conditions differ between<br />
measures. The contribution of all such biases will be<br />
dim<strong>in</strong>ished over longer measurement <strong>in</strong>tervals when true<br />
growth contributes more. For short-term (e.g., monthly)<br />
studies, <strong>large</strong> proportional biases appear to be possible. Artifacts<br />
may also <strong>in</strong>fluence <strong>in</strong>vestigation of weather–growth relationships.<br />
These concerns, while speculative, justify<br />
further evaluation.<br />
<strong>Growth</strong> and season<br />
The observation that wetter periods are sometimes associated<br />
with lower growth has generated several explanations,<br />
<strong>in</strong>clud<strong>in</strong>g the effect of cloud cover (Clark and Clark 1992,<br />
1994; Raich et al. 1991), altered competition, and actual water<br />
availability (Bullock 1997). Trees also allocate energy to<br />
new leaves, fruits, etc., on seasonal and weather-related cues,<br />
and such phenology likely <strong>in</strong>fluences stem growth. Such proposals<br />
rema<strong>in</strong> debatable, but I add the suggestion that ephemeral<br />
patterns of stem shr<strong>in</strong>kage may play a role. In full foliage<br />
and bright sunsh<strong>in</strong>e, stem water can be greatly depleted. Similar<br />
effects could also expla<strong>in</strong> the opposite pattern of higher<br />
wet season growth (e.g., Silva et al. 2002), with swollen<br />
stems be<strong>in</strong>g measured more often <strong>in</strong> wet conditions under<br />
heavy cloud cover. Patterns will likely depend on many factors,<br />
<strong>in</strong>clud<strong>in</strong>g local weather, tree behavior, and measurement<br />
practices.<br />
When is the best time to measure growth?<br />
When should <strong>trees</strong> be measured for accurate growth <strong>assessment</strong><br />
<strong>in</strong>volv<strong>in</strong>g longer periods (≥1 year)? I have previously<br />
suggested for semideciduous forests that wet season<br />
measures are more perturbed by moisture (deficits and availability)<br />
and by phenological events (flowers, fruit etc.) impact<strong>in</strong>g<br />
true growth. Dry season quiescence reduces growth<br />
variance (Sheil 1995, 1997). Karl<strong>in</strong>g’s (1934) observations<br />
concur (Table 1): <strong>daily</strong> changes were reduced when soil<br />
moisture was limited and <strong>in</strong>creased <strong>in</strong> bright conditions<br />
when water was available. Baker et al. (2003) disagreed.<br />
They found that <strong>in</strong>teryear variance <strong>in</strong> recorded growth was<br />
higher between dry rather than wet seasons. However, this<br />
result rema<strong>in</strong>s debatable, given the use of dendrometer<br />
bands, with a failure to detect diurnal changes, an unknown<br />
<strong>in</strong>fluence of “settl<strong>in</strong>g” <strong>in</strong> dry season measures, and an unusually<br />
strong drought dur<strong>in</strong>g their measurement period.<br />
© 2003 NRC Canada
2032 Can. J. For. Res. Vol. 33, 2003<br />
Table 3. Tree size and magnitude of <strong>daily</strong> girth changes (differences between morn<strong>in</strong>g and afternoon) and those over the whole period.<br />
Dendrometer bands Dawk<strong>in</strong>s’ (1956) multiple measures<br />
Tree B C D A B C D E F G H<br />
Mean girth (cm) 174.2 151.4 124.9 76.2 174.2 151.4 124.9 87.5 160.8 179.4 161.0<br />
Mean <strong>daily</strong> change (mm) 0.054 0.100 –0.013 0.792 0.821 1.083 0.905 1.000 0.917 0.667 0.698<br />
Mean % 0.003 0.007 –0.010 0.104 0.047 0.072 0.072 0.114 0.057 0.037 0.043<br />
Max. (mm) 0.250 0.300 0.200 1.625 1.571 1.571 2.143 1.625 2.250 1.250 1.125<br />
Max. % 0.014 0.020 0.016 0.213 0.090 0.104 0.172 0.186 0.140 0.070 0.070<br />
M<strong>in</strong>. (mm) 0.000 –0.100 –0.200 0.125 –0.143 0.143 –0.714 0.250 0.000 –0.125 –0.625<br />
M<strong>in</strong>. % 0.000 –0.007 –0.016 0.016 –0.008 0.009 –0.057 0.029 0.000 –0.007 –0.039<br />
No. of zeros 7 2 8 0 0 0 1 0 1 0 0<br />
No. of negatives 0 1 3 0 1 0 1 0 0 1 1<br />
P (sign test) 0.031 0.011 0.94 0.00024 0.0032 0.00024 0.0058 0.00024 0.00049 0.0032 0.0032<br />
Whole period max.–m<strong>in</strong>. (mm) 2.300 0.600 1.200 2.000 6.000 2.143 2.571 1.875 2.250 2.375 1.750<br />
Whole period max.–m<strong>in</strong>. % 0.132 0.040 0.032 0.263 0.344 0.142 0.206 0.214 0.140 0.132 0.109<br />
Table 4. Relationship of <strong>daily</strong> differences (morn<strong>in</strong>g m<strong>in</strong>us afternoon) by Kendall’s τ rank correlation<br />
(n = 12 and quot<strong>in</strong>g two-sided probability (P) with values
Sheil 2033<br />
Fig. 2. Relationship of <strong>daily</strong> changes recorded by the two <strong>assessment</strong> methods on stems B, C, and D. The dotted l<strong>in</strong>e <strong>in</strong>dicates equivalence.<br />
Fig. 3. Relationship of overall changes recorded by the two <strong>assessment</strong> methods compar<strong>in</strong>g morn<strong>in</strong>g (AM) and afternoon (PM) series<br />
on stems B, C, and D. The dotted l<strong>in</strong>e <strong>in</strong>dicates the gradient of a 1:1 correspondence.<br />
perature rise. If sunsh<strong>in</strong>e were to fall directly on (half) the<br />
metal band, an additional 0.3 mm/m seems plausible: similar<br />
<strong>in</strong> magnitude to the <strong>daily</strong> flex<strong>in</strong>g. However, this slack<br />
would cause overestimation of <strong>daily</strong> shr<strong>in</strong>kage, not the underestimation<br />
observed.<br />
Band elasticity<br />
Girth changes are translated by an “<strong>in</strong>elastic” band to the<br />
slid<strong>in</strong>g gauge. However, as shifts <strong>in</strong> the band require a<br />
change <strong>in</strong> tension, and no material is perfectly <strong>in</strong>elastic,<br />
some stretch<strong>in</strong>g must occur. Assum<strong>in</strong>g a Young’s modulus<br />
of 2.0 × 10 11 N/m 2 (steel), a force of 1.22 N (the dendrometer<br />
spr<strong>in</strong>g strength), a tree of 3-m girth, and a band of<br />
cross section of 1 mm 2 suggests a stretch of less than<br />
0.02 mm. The changes <strong>in</strong> tensile forces needed to register<br />
0.1-mm length differences would be several times higher<br />
than the near-fixed forces that occur <strong>in</strong> normal operation.<br />
Friction<br />
Friction may hold a band without slipp<strong>in</strong>g as a stem<br />
shr<strong>in</strong>ks. As the band is relatively <strong>in</strong>elastic, the required surface<br />
to surface pressure is presumably ma<strong>in</strong>ta<strong>in</strong>ed by the<br />
elastic rebound of the stem as tension decl<strong>in</strong>es. “Miss<strong>in</strong>g<br />
band length” may derive from differences <strong>in</strong> stem deformation,<br />
and associated band lengths, under alternative limit<strong>in</strong>g<br />
(no-slippage) tension patterns (Fig. 4). This idea can help<br />
predict error and its dependencies.<br />
A standard result <strong>in</strong> analytical mechanics shows that a<br />
band, wrapp<strong>in</strong>g a fixed object, with a tension T L applied at<br />
one end can be held static by a lower tension at the other<br />
end. The relationship between T L and T S, the lowest sufficient<br />
hold<strong>in</strong>g tension, is given by<br />
[1] T L = T Se µθ<br />
where θ is the completed angle of wrap (radians), and µ is<br />
the coefficient of friction. Given this relationship, and an expression<br />
for how each stem deforms under pressure, we can<br />
estimate the length differences that can occur between a limit<strong>in</strong>g<br />
situation under stem expansion and contraction<br />
(Fig. 4).<br />
I assume a circular stem section and l<strong>in</strong>ear stem elasticity.<br />
The band radius, R, is variable and is def<strong>in</strong>ed as relaxed radius,<br />
R r, m<strong>in</strong>us radial deformation, ∆R, i.e., R = R r – ∆R<br />
(∆R
2034 Can. J. For. Res. Vol. 33, 2003<br />
Fig. 4. Tension gradients can lead to band length differences.<br />
(a) A band held static by friction can have different tensions at<br />
each end. A standard formula <strong>in</strong> mechanics provides the relationship<br />
between these <strong>in</strong> the limit<strong>in</strong>g case. (b) Alternate tension<br />
gradients along the band cause different “spiral” lengths between<br />
the two limit<strong>in</strong>g scenarios (illustrated here for the same “true”<br />
stem <strong>diameter</strong>). As the stem shr<strong>in</strong>ks, the constant spr<strong>in</strong>g force<br />
(T ++) is the higher of the tensions (the other end is T +), but if<br />
the stem expands, the spr<strong>in</strong>g eventually becomes the lower tension,<br />
and the other end is higher (T +++). (c) A formula can be<br />
derived to predict error based on angle of wrap and l<strong>in</strong>ear stem<br />
deformation.<br />
Here, R cancels out dur<strong>in</strong>g simplification, so L T – L S is <strong>in</strong>dependent<br />
of R, proportional to λ and T S, and shows a complex<br />
relationship with µ and θ.<br />
The equivalent model 2 derivation yields<br />
Model 2:<br />
L T – L S = λ kT S(e µθ –e –µθ)/(2πR rµ 2)<br />
Thus, model 2 is just as model 1 multiplied by k/R, and so,<br />
L T – L S is now <strong>in</strong>versely related to stem size. The true situation<br />
may lie between the two models.<br />
Can such models apply to those band-dendrometers held<br />
<strong>in</strong> place only by spr<strong>in</strong>g tension (e.g., Lim<strong>in</strong>g 1957)? The<br />
Ghana and Sumatra examples <strong>in</strong> Table 1 are of this type.<br />
The physics are similar, so I believe that the same problems<br />
occur. A technical argument can be proposed: the full band<br />
can be replaced with a model where the middle of the band<br />
is fixed, yield<strong>in</strong>g two half-bands with a “free” end. The various<br />
expressions that we have developed for the full circuit<br />
expression can be used for each half and added (i.e., θ≈π,<br />
rather than ≈2π, and the path difference is doubled for the<br />
full band length), i.e., scenario 1 is now<br />
LT – LS = λ TS(e µθ –e –µθ)/(πµ 2)<br />
and scenario 2 is<br />
L T – L S = λ kT S(e µθ –e –µθ)/(πR rµ 2)<br />
Thus, the expressions are similar. What do these predict?<br />
(i) Each tree–band comb<strong>in</strong>ation has a threshold for detectable<br />
size fluctuation <strong>in</strong>volv<strong>in</strong>g alternat<strong>in</strong>g expansion and<br />
contraction, (ii) this threshold is dependent on bark friction<br />
and degree of stem plasticity (softer stems and bark will give<br />
bigger errors, and reduc<strong>in</strong>g friction <strong>in</strong> the band to bark contact<br />
will improve sensitivity), (iii) stronger spr<strong>in</strong>gs will<br />
cause proportionally <strong>large</strong>r errors (more friction, more deformation),<br />
and (iv) as absolute error may be <strong>large</strong>ly <strong>in</strong>dependent<br />
of stem size (model 1), or even <strong>in</strong>versely related to it<br />
(model 2), <strong>large</strong>r <strong>trees</strong> will have smaller proportional errors.<br />
Note that accord<strong>in</strong>g to predictions ii and iv, <strong>large</strong> stems, with<br />
hard firm bark, as chosen <strong>in</strong> our field study, may yield the<br />
smallest errors. All of these predictions are amenable to future<br />
<strong>in</strong>vestigation.<br />
The proposal that bands may normally ma<strong>in</strong>ta<strong>in</strong> a subslippage<br />
tension gradient may be relevant <strong>in</strong> other ways. A<br />
tense band may slowly relax over time, e.g., with vibration<br />
and moisture. Reich and Borchert (1982) found up to 1 mm<br />
of shr<strong>in</strong>kage for Tabebuia <strong>in</strong> Costa Rica. Baker et al. (2003)<br />
found seasonal shr<strong>in</strong>kage of over 0.7 mm <strong>in</strong> Ghanaian Celtis<br />
over the 1997–1998 El Niño. Baker et al. (2003) also evaluated<br />
band settl<strong>in</strong>g by plac<strong>in</strong>g a dendrometer on a liv<strong>in</strong>g butdamaged<br />
tree that showed no growth over the measurement<br />
period. They found no change <strong>in</strong> stem <strong>diameter</strong> over 2 years<br />
and suggested that long-term settl<strong>in</strong>g is therefore “not a concern”.<br />
However, such settl<strong>in</strong>g is likely a very different physical<br />
process on a vigorous size-fluctuat<strong>in</strong>g stem.<br />
A possible fix<br />
Few precision approaches are as cheap and simple as the<br />
band-dendrometer, so improvements are worth <strong>in</strong>vestigat<strong>in</strong>g.<br />
If error <strong>in</strong> band methods is pr<strong>in</strong>cipally due to unequal tension<br />
patterns, remov<strong>in</strong>g associated variation should improve<br />
accuracy. I predict that a momentary tension <strong>in</strong>crease “sufficient<br />
to guarantee slipp<strong>in</strong>g”, just prior to read<strong>in</strong>g, will standardize<br />
tension patterns and improve accuracy. Such a fix<br />
appears to be technically simple, especially for a firmly attached<br />
dendrometer, and can be <strong>in</strong>vestigated further as a<br />
means of track<strong>in</strong>g true <strong>diameter</strong> changes.<br />
Conclusions<br />
Accord<strong>in</strong>g to previous band-dendrometer studies, <strong>daily</strong><br />
fluctuations <strong>in</strong> tree <strong>diameter</strong> are generally small, less than<br />
0.2 mm. However, other studies noted much <strong>large</strong>r changes.<br />
These changes seem to have been ignored <strong>in</strong> <strong>tropical</strong> growth<br />
studies.<br />
The DMM approach shows <strong>daily</strong> variation <strong>in</strong> girth of<br />
about 1 mm <strong>in</strong> all eight stems exam<strong>in</strong>ed <strong>in</strong> Borneo. Changes<br />
are <strong>large</strong>r <strong>in</strong> bright conditions. These changes do appear to<br />
be of sufficient magnitude to <strong>in</strong>terfere with the accurate<br />
evaluation of woody growth under some circumstances, although<br />
this requires further study. Just as long-term sea level<br />
changes would be difficult to assess from <strong>in</strong>termittent records<br />
if tides were unrecognized, the evaluation of tree<br />
growth must consider both long- and short-term fluctuation<br />
processes. Mis<strong>in</strong>terpretations seem especially likely when<br />
true growth over any measurement <strong>in</strong>terval is small, or when<br />
measurements take place under different conditions. Patterns<br />
of <strong>diameter</strong> change, and associated growth <strong>assessment</strong> errors,<br />
are complex and require further study.<br />
Dendrometer bands can considerably underestimate stem<br />
changes <strong>in</strong>volv<strong>in</strong>g alternate shr<strong>in</strong>kage and expansion. A likely<br />
explanation is that friction holds the band fixed while stems<br />
shr<strong>in</strong>k. Theoretical analyses suggest that such errors depend<br />
on a stem’s elastic deformation and the friction of bark–band<br />
contact. Any process ensur<strong>in</strong>g consistent band tensions prior<br />
to read<strong>in</strong>g should improve dendrometer accuracy.<br />
Acknowledgements<br />
Tim Baker, Kofi Affum-Baffoe, Andrew Baka<strong>in</strong>ga, David<br />
Burslem, Greg V<strong>in</strong>cent, and the ICRAF Jambi team gener-<br />
© 2003 NRC Canada
Sheil 2035<br />
ously allowed me to refer to unpublished results, Ia<strong>in</strong> Paterson<br />
undertook the day to day implementation of the small<br />
field evaluation, Kuswata Kartaw<strong>in</strong>ata, Ismayadi Samsoed<strong>in</strong>,<br />
and Herwasono Soedjito provided project support, and Kim<br />
(Meil<strong>in</strong>da Wan) helped with logistical arrangements. I am<br />
grateful to Ismael from the Bogor Herbarium for identify<strong>in</strong>g<br />
the <strong>trees</strong>. Indah Susilanasari, Meil<strong>in</strong>da Wan, Levania Santoso,<br />
and the CIFOR library staff provided valued help with references<br />
and document preparation. Tim Baker, Greg V<strong>in</strong>cent,<br />
Takeshi Toma, Laura Snook, Miriam van Heist, and reviewers<br />
k<strong>in</strong>dly commented on versions of this paper.<br />
References<br />
Agricultural Electronics Co. 1996. Instructions leaflet provided<br />
with the dendrometer (Series 5 — high tension banddendrometers<br />
from Forestry Suppliers Inc.). Agricultural Electronics<br />
Co., Tucson, Ariz.<br />
Andrade, J.L., Me<strong>in</strong>zer, F.C., Goldste<strong>in</strong>, G., Holbrook, N.M.,<br />
Cavelier, J., Jackson, P., and Silvera, K. 1998. Regulation of water<br />
flux through trunks, branches, and leaves <strong>in</strong> <strong>trees</strong> of a lowland<br />
<strong>tropical</strong> forest. Oecologia, 115: 463–471.<br />
Baker, T.R., Affum-Baffoe, K., Burslem, D.F.R.P., and Swa<strong>in</strong>e,<br />
M.D. 2003. Phenological differences <strong>in</strong> tree water use and the<br />
tim<strong>in</strong>g of <strong>tropical</strong> forest <strong>in</strong>ventories: conclusions from patterns<br />
of dry season <strong>diameter</strong> change. For. Ecol. Manage. 19: 109–125.<br />
Bay, R.R. 1963. Soil moisture and radial <strong>in</strong>crement <strong>in</strong> two density<br />
levels of Red P<strong>in</strong>e. U.S. For. Serv. Res. Note LS-30.<br />
Borchert, R. 1994. Soil and stem water storage determ<strong>in</strong>e<br />
phenology and distribution of <strong>tropical</strong> dry forest <strong>trees</strong>. Ecology,<br />
75: 1437–1449.<br />
Bormann, F.H., and Kozlowski, T.T. 1962. Measurement of tree<br />
growth with dial gauge dendrometers and vernier tree r<strong>in</strong>g<br />
bands. Ecology, 43: 289–294.<br />
Bower, D.R., and Blocker, W.W. 1966. Accuracy of bands and tape<br />
for measur<strong>in</strong>g <strong>diameter</strong> <strong>in</strong>crements. J. For. 64: 21–22.<br />
Bullock, S.H. 1997. Effects of seasonal ra<strong>in</strong>fall on radial growth <strong>in</strong><br />
two <strong>tropical</strong> tree species. Int. J. Biometeorol. 41: 13–16.<br />
Clark, D.A., and Clark, D.B. 1992. Life history diversity of <strong>tropical</strong><br />
<strong>trees</strong>. Ecol. Monogr. 62: 315–344.<br />
Clark, D.A., and Clark, D.B. 1994. Climate <strong>in</strong>duced annual variation<br />
<strong>in</strong> canopy tree growth <strong>in</strong> a Costa Rican <strong>tropical</strong> ra<strong>in</strong> forest.<br />
J. Ecol. 82: 865–872.<br />
Clark, D.A., Brown, S., Kicklighter, D., Chambers, J., Thoml<strong>in</strong>son,<br />
J.R., and Ni, J. 2001. Measur<strong>in</strong>g net primary production <strong>in</strong> forests:<br />
concepts and field methods. Ecol. Appl. 11: 356–370.<br />
Daubenmire, R. 1972. Phenology and other characteristics of <strong>tropical</strong><br />
semi-deciduous forest <strong>in</strong> northwestern Costa Rica. J. Ecol.<br />
60: 147–180.<br />
Dawk<strong>in</strong>s, H.C. 1956. Rapid detection of aberrant girth <strong>in</strong>crement<br />
of ra<strong>in</strong>-forest <strong>trees</strong>. Emp. For. Rev. 35: 3–8.<br />
Dawk<strong>in</strong>s, H.C. 1958. The management of natural <strong>tropical</strong> highforest<br />
with reference to Uganda. Commonwealth Forestry Institute,<br />
Oxford, U.K. Pap. 34.<br />
Downes, G., Beadle, C., and Worledge, D. 1999. Daily stem<br />
growth patterns <strong>in</strong> irrigated Eucalyptus globulus and E. nitens <strong>in</strong><br />
relation to climate. Trees Struct. Funct. 14: 102–111.<br />
Field<strong>in</strong>g, J.M., and Millett, M.R.O. 1941. Some studies of the<br />
growth of Monterey p<strong>in</strong>e (P<strong>in</strong>us radiata). Part I. Diameter<br />
growth. Bull. For. Bur. 27.<br />
Goldste<strong>in</strong>, G., Andrade, J.L., Me<strong>in</strong>zer, F.C., Holbrook, N.M.,<br />
Cavelier, J., Jackson, P., and Celis, A. 1998. Stem water storage<br />
and diurnal patterns of water use <strong>in</strong> <strong>tropical</strong> forest canopy <strong>trees</strong>.<br />
Plant Cell Environ. 21: 397–406.<br />
Haasis, F.W. 1934. Diametral changes <strong>in</strong> tree trunks. Carnegie Inst.<br />
Wash<strong>in</strong>gton Publ. 450.<br />
Holbrook, H.M. 1995. Stem water storage. In Plant stems: physiology<br />
and functional morphology. Edited by B.L. Gartner. Academic<br />
Press, New York. pp. 151–174.<br />
Iyamabo, D.E. 1971. Some aspects of girth and radial growth patterns<br />
of Triplochiton scleroxylon H. Schum. Res. Pap. (For. Ser.)<br />
Dep. For. Res. Niger. 1. pp. 51–57.<br />
Karl<strong>in</strong>g, J.S. 1934. Dendrograph studies on Achras zapota <strong>in</strong> relation<br />
to the optimum conditions for tapp<strong>in</strong>g. Am. J. Bot. 21:<br />
161–193.<br />
Keeland, B.D., and Sharitz, R.R. 1993. Accuracy of tree growth<br />
measurements us<strong>in</strong>g dendrometer bands. Can. J. For. Res. 23:<br />
2454–2457.<br />
Kozlowski, T.T. 1965. Expansion and contraction of plants. Adv.<br />
Front. Plant Sci. 10: 63–77.<br />
Kozlowski, T.T. 1972. Shr<strong>in</strong>kage and swell<strong>in</strong>g of plant tissues. In<br />
Water deficits and plant growth. Vol. 3. Edited by T.T. Kozlowski.<br />
Academic Press, New York. pp. 1–64.<br />
Kozlowski, T.T., and W<strong>in</strong>get, C.H. 1964. Diurnal and seasonal<br />
variation <strong>in</strong> radii of tree stems. Ecology, 45: 149–155.<br />
Kozlowski, T.T., Kramer, P.J., and Pallardy, S.G. 1991. The physiological<br />
ecology of woody plants. Academic Press, Inc., San<br />
Diego, Calif.<br />
Lim<strong>in</strong>g, F.G. 1957. Homemade dendrometers. J. For. 55: 575–577.<br />
Raich, J.W., Rastetter, E.B., Melillo, J.M., Kicklighter, D.W., Steudler,<br />
P.A., Peterson, B.J., Grace, A.L., Moore, B., and Vorosmarty, C.J.<br />
1991. Potential net primary productivity <strong>in</strong> South America: application<br />
of a global model. Ecol. Appl. 1: 399–429.<br />
Reich, P.B., and Borchert, R. 1982. Phenology and ecophysiology<br />
of the <strong>tropical</strong> tree, Tabebuia neochrysantha (Bignoniaceae).<br />
Ecology, 63: 294–299.<br />
Sheil, D. 1995. A critique of permanent plot methods and analysis<br />
with examples from Budongo Forest, Uganda. For. Ecol. Manage.<br />
77: 11–34.<br />
Sheil, D. 1997. Long-term growth and ra<strong>in</strong>fall <strong>in</strong> a Ugandan moist<br />
forest: seasonal rhythms and flex<strong>in</strong>g stems. Commonw. For.<br />
Rev. 76: 121–127.<br />
Silva, R.P., Santos, J., Tribuzy, E.S., Chambers, J.Q., Nakamura,<br />
S., and Higuchi, N. 2002. Diameter <strong>in</strong>crement and growth patterns<br />
for <strong>in</strong>dividual <strong>trees</strong> <strong>in</strong> Central Amazon, Brazil. For. Ecol.<br />
Manage. 166: 295–301.<br />
Stephens, E.P., and Spurr, S.H. 1948. The immediate response of<br />
red p<strong>in</strong>e to th<strong>in</strong>n<strong>in</strong>g and prun<strong>in</strong>g. In Proceed<strong>in</strong>gs of the Society<br />
for American Foresters, 1947–1948. Society for American Foresters,<br />
Wash<strong>in</strong>gton, D.C. pp. 353–369.<br />
Stratton, L., Goldste<strong>in</strong>, G., and Me<strong>in</strong>zer, F.C. 2000. Stem water<br />
storage capacity and efficiency of water transport: their functional<br />
significance <strong>in</strong> a Hawaiian dry forest. Plant Cell Environ.<br />
23: 99–106.<br />
Worbes, M. 1999. Annual growth r<strong>in</strong>gs, ra<strong>in</strong>fall dependent growth<br />
and the long-term growth patterns of <strong>tropical</strong> <strong>trees</strong> from the<br />
Caparo Forest Reserve <strong>in</strong> Venezuela. J. Ecol. 87: 391–403.<br />
Yoda, K., and Sato, H. 1975. Daily fluctuation of trunk <strong>diameter</strong> <strong>in</strong><br />
<strong>tropical</strong> ra<strong>in</strong> forest <strong>trees</strong>. Jpn. J. Ecol. 25: 47–48.<br />
Zahner, R. 1968. Water deficits and growth of <strong>trees</strong>. In Water deficits<br />
and plant growth. Vol. 2. Edited by T.T. Kozlowski. Academic<br />
Press Inc., New York. pp. 191–254.<br />
© 2003 NRC Canada