
You also want an ePaper? Increase the reach of your titles
YUMPU automatically turns print PDFs into web optimized ePapers that Google loves.
Contents<br />
<strong>Indonesia</strong> Economic <strong>Update</strong> :<br />
Balance of Payment in 2011<br />
Fund Inflows and Foreign<br />
p.02<br />
Ownership In <strong>Indonesia</strong>n Capital<br />
Market<br />
p.08<br />
US EPA Statement About CPO<br />
“Failure”: Should We Worry?<br />
p.40<br />
Coal Market 2012: Future Remains<br />
Bright<br />
p.45<br />
Property Sector (Apartment)<br />
Outlook in 2012<br />
p.57<br />
<strong>Mandiri</strong> Leading Economic Index<br />
(LEI)<br />
p.64<br />
<strong>Indonesia</strong> Current Data (Table) p.67<br />
Chief Economist<br />
Destry Damayanti<br />
destry.damayanti@bankmandiri.co.id<br />
Analyst<br />
Faisal Rino Bernando<br />
Andry Asmoro<br />
M. Ajie Maulendra<br />
Nadia Kusuma Dewi<br />
Nurul Yuniataqwa Karunia<br />
Sindi Paramita<br />
Reny Eka Putri<br />
Ahmad Subhan Irani<br />
Andrian Bagus Santoso<br />
Publication Address:<br />
<strong>Bank</strong> <strong>Mandiri</strong> Head Office<br />
Office of Chief Economist<br />
18 th Floor, Plaza <strong>Mandiri</strong><br />
Jalan Jend. Gatot Subroto Kav.36-38<br />
Jakarta 12190, <strong>Indonesia</strong><br />
Phone: (62-21) 5245516 / 5272<br />
Fax: (62-21) 5210430<br />
Email:<br />
rino.bernando@bankmandiri.co.id<br />
andry.asmoro@bankmandiri.co.id<br />
ajie.maulendra@bankmandiri.co.id<br />
nadia.dewi@bankmandiri.co.id<br />
nurul.karunia@bankmandiri.co.id<br />
sindi.paramita@bankmandiri.co.id<br />
reny.putri@bankmandiri.co.id<br />
ahmad.subhan@bankmandiri.co.id<br />
andrian.bagus@bankmandiri.co.id<br />
See important disclaimer at the end of<br />
this material<br />
OFFICE OF CHIEF ECONOMIST<br />
March 2012<br />
<strong>Indonesia</strong> <strong>Update</strong><br />
<strong>Indonesia</strong> economic update : Balance of Payment in 2011<br />
<strong>Indonesia</strong>’s recorded deficit for the second consecutive quarter in its balance of<br />
payment, sending the full-year balance of payment surplus down to USD11.9 bn<br />
from USD30.3 bn in 2010. Interestingly, it was not caused by the trade balance as<br />
the trade surplus increased, but by increasing use of foreign services, notably<br />
transportations, and also higher income repatriation by foreign direct investment<br />
(FDI) investors.<br />
Fund Inflows and Foreign Ownership In <strong>Indonesia</strong>n Capital Market<br />
Increasing funds from domestic investors, foreign capital inflows coming into the<br />
domestic capital market are relatively also experiencing an upward trend. Although<br />
at the end of 2008 global financial market suffered from crisis and liquidity<br />
problems, causing a correction in the domestic capital market, in 2009 a recovery in<br />
the domestic financial market has occurred.<br />
The Development of Commercial <strong>Bank</strong>ing in <strong>Indonesia</strong><br />
Development of <strong>Indonesia</strong>’s banking system during 2011 still showed the maintained<br />
stability with the improved intermediary function, despite of amidst the financial<br />
market turmoil due to the influence of the global economic downturn. The solid<br />
domestic banking condition was still reflected in the high Capital Adequacy Ratio<br />
(CAR), which was far above the minimum of 8%, reached 16.1% by December 2011<br />
US EPA Statement About CPO “Failure”: Should We Worry?<br />
An agency in the United States (U.S.) engaged in the environment sector, namely<br />
EPA (Environmental Protection Agency) had issued an announcement related to its<br />
studies that biodiesel and renewable diesel produced from crude palm oil do not<br />
meet the environmentally friendly requirements. The EPA studies show that<br />
biodiesel produced from crude palm oil cannot reduce greenhouse gas emissions in<br />
a minimum amount of 20% as required in the U.S.<br />
Coal Market 2012: Future Remains Bright<br />
The global outlook for coal demand and supply in 2012 is marked by uncertainty.<br />
From the demand side, recovery from financial crisis has been fragile in many<br />
countries, casting doubt on future growth rates. But, the growth in developing<br />
countries – lead by China and India – will lead demand growth in recent years.<br />
Property Sector (Apartment) Outlook in 2012<br />
Development of the property sector is expected to continue in 2012. In 2012 the<br />
developers are starting to add the property projects, including residential such as<br />
apartments along with better economic conditions and increasing purchasing power.<br />
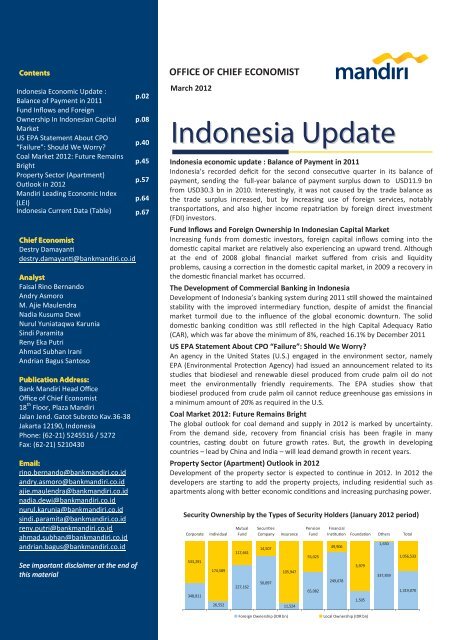
Security Ownership by the Types of Security Holders (January 2012 period)<br />
Corporate Individual<br />
533,291<br />
348,811<br />
174,589<br />
26,552<br />
Mutual<br />
Fund<br />
117,661<br />
227,162<br />
Securities<br />
Company Insurance<br />
14,507<br />
50,897<br />
105,947<br />
11,524<br />
Pension<br />
Fund<br />
55,025<br />
65,082<br />
49,906<br />
249,678<br />
3,979<br />
1,505<br />
Foreign Ownership (IDR bn) Local Ownership (IDR bn)<br />
Financial<br />
Institution Foundation Others Total<br />
1,630<br />
337,859<br />
1,056,533<br />
1,319,070
<strong>Indonesia</strong> Economic <strong>Update</strong> : Balance of Payment in 2011<br />
Aldian Taloputra (aldian.taloputra@mandirisek.co.id)<br />
<strong>Indonesia</strong>’s recorded deficit for the second consecutive<br />
quarter in its balance of payment, sending the full-year<br />
balance of payment surplus down to USD11.9 bn from<br />
USD30.3 bn in 2010.<br />
Specifically, the current account posted a deficit of USD0.94<br />
bn in 4Q11, swinging from a surplus at USD0.47 bn in 3Q11 as<br />
the trade balance surplus continued to narrow while foreign<br />
transportation needs resulted in a larger net outflow on<br />
overall services. For the full-year 2011, the current account<br />
surplus continued to drop from USD5.1 bn in 2010 to USD2.1<br />
bn. Interestingly, it was not caused by the trade balance as the<br />
trade surplus increased, but by increasing use of foreign<br />
services, notably transportations, and also higher income<br />
repatriation by foreign direct investment (FDI) investors.<br />
On the other hand, capital & financial account deficit<br />
narrowed in 4Q11 to USD1.4 bn from USD4.1 bn in the<br />
previous quarter. Surprisingly, the main cause for the net<br />
outflow was rising placement of funds by <strong>Indonesia</strong>ns on<br />
deposit and saving overseas, while foreign portfolio<br />
investment inflows posted a marginal result. For overall 2011,<br />
capital & financial account recorded a decline from USD26.6<br />
bn in 2010 to USD14.0 bn in 2011 with the source for the drop<br />
came from the public portfolio, in particular SBIs as it went<br />
from surplus to deficit last year. Nevertheless, we think most<br />
of the foreign outflows on SBI were intentionally done by <strong>Bank</strong><br />
<strong>Indonesia</strong>. On the other hand, FDI continued to record an<br />
increase of inflows last year lured by solid economic<br />
fundamentals.<br />
We believe <strong>Indonesia</strong>’s balance of payment surplus will<br />
continue to shrink this year. Current account is likely to chalk a<br />
deficit of around USD1.9 bn or 0.2% of GDP, on weaker<br />
exports, stronger import growth, and higher income<br />
repatriation by FDI investors. On the capital account side, we<br />
still believe <strong>Indonesia</strong> strong economic fundamentals, high<br />
yields, and improved sovereign ratings will continue to attract<br />
foreign investors. Other investments are likely to improve<br />
© Office of Chief Economist Page 2 of 68<br />
Page 2 of 68<br />
© Office of Chief Economist
ITEMS<br />
gradually as the central bank regulation on export and loan<br />
proceed repatriation is gradually implemented. Against this<br />
backdrop, we forecast the rupiah to weaken only slightly to<br />
IDR9,100/USD by YE12 vs. IDR9,068/USD end of last year.<br />
INDONESIA'S BALANCE OF PAYMENTS<br />
(millions of USD)<br />
2010 2011<br />
Q1 Q2 Q3 Q4 TOTAL<br />
I. CURRENT ACCOUNT 1,891 1,342 1,043 870 5,144 2,072 473 468 -944 2,069<br />
II. CAPITAL & FINANCIAL ACCOUNT 5,662 3,767 7,464 9,728 26,621 6,646 12,849 -4,107 -1,370 14,018<br />
III. TOTAL (I+II) 7,552 5,108 8,507 10,597 31,764 8,718 13,322 -3,639 -2,313 16,088<br />
IV. NET ERRORS & OMISSIONS -932 312 -1,552 692 -1,480 -1,052 -1,446 -321 -1,413 -4,232<br />
V. OVERALL BALANCE (III+IV)<br />
* Provisional figures<br />
** Very provisional figures<br />
6,620 5,420 6,955 11,289 30,284 7,666 11,876 -3,960 -3,726 11,856<br />
Figure 1. <strong>Indonesia</strong>’s balance of payment. (Source: <strong>Bank</strong> <strong>Indonesia</strong>)<br />
Q1* Q2* Q3* Q4** TOTAL<br />
<strong>Indonesia</strong>’s balance of payment recorded another deficit in<br />
the last quarter of 2011, recording the second consecutive<br />
deficit (see figure 1 and 2). Specifically, the current account<br />
turned into deficit for the first time since 4Q08 while capital<br />
account deficit narrowed from that in the 3Q11. Overall last<br />
year, balance of payment surplus shrank to USD11.9 bn from<br />
USD30.3 bn in 2010 driven by the decline on current and<br />
capital accounts.<br />
Specifically, current account posted a deficit of USD0.94 bn in<br />
4Q11, swinging from a surplus of USD0.47 bn in the previous<br />
quarter. We think the deficit was basically caused by two<br />
factors. First, it was due to lower trade surplus compared with<br />
in the 3Q11 as exports were dampened by lower commodity<br />
prices and decreasing global demand during the period. At the<br />
same time imports growth remained robust as investment<br />
activities continued to rise. Second, rising imports led to<br />
increasing transportation costs paid to foreign companies (see<br />
figure 2). Thus, they resulted in a deeper deficit on overall<br />
services as transportation services accounted for 74% of the<br />
total services in 2011.<br />
© Office of Chief Economist Page 3 of 68<br />
© Office of Chief Economist Page 3 of 68
Page 4 of 68<br />
As for the full 2011, the current account surplus continued to<br />
slump from USD5.1 bn in 2010 to USD2.1 bn (see figure 4).<br />
What is interesting is the full-year decline was not caused by<br />
international trade as trade surplus increased to USD35.5 bn<br />
in 2011 from USD30.6 bn in 2010. It seems that the lower<br />
surplus was driven by increasing use of foreign transportation<br />
services and increasing income repatriation of income by FDI<br />
investors (see figure 3).<br />
On the other side, capital & financial account registered an<br />
easing trend of deficit in 4Q11, amounting USD1.4 bn<br />
compared with the previous quarter at USD4.1 bn (see figure<br />
4). Surprisingly, the main cause for the net outflow was due to<br />
higher placement of funds by <strong>Indonesia</strong>ns outside the country.<br />
Meanwhile, foreign portfolio investment posted a marginal<br />
net inflow even after foreigners took their money out of<br />
maturing SBIs. We believe most of the foreign outflow on SBI’s<br />
was done intentionally by the central bank as they eliminate 3<br />
and 6 month SBI instrument causing impossible for foreigners<br />
to rollover it. Moreover, foreigners were more discouraged<br />
placing on the existing 9 month SBI instrument due to central<br />
bank’s holding period policy for the instrument (see figure 3).<br />
On the other hand, foreign flows to the stock market and<br />
government bonds swung from outflows to inflows. Whereas,<br />
foreign inflows to corporate bonds increased during the<br />
period. Despite the global economic uncertainty, foreign<br />
investors’ sentiment on the domestic financial market was<br />
better in fourth quarter than in the 3Q11. Meanwhile, FDI<br />
continued to increase lured by a solid economic fundamentals.<br />
For the full-year 2011, capital account & financial account<br />
recorded a decline USD26.6 bn in 2010 to USD14.0 bn in 2011<br />
amid global economic uncertainty. Foreign portfolio inflows<br />
significantly slid from USD15.7 bn in 2010 to USD5.6 bn. The<br />
essential source for the drop came from the public portfolio as<br />
foreign flows into SBI’s went from surplus of USD1.3 bn in<br />
2010 to net outflows of USD5.4 bn last year, in line with the<br />
central bank’s goal. On the other hand, foreign inflows to the<br />
government bonds were still positive but eased from USD12.2<br />
bn in 2010 to USD6.2 bn as foreign investors turned riskaverse<br />
in late August. Meanwhile, foreign direct investment<br />
continued to record an increase of inflows from USD13.8 bn to<br />
USD18.2 bn in 2011.<br />
© Office of Chief Economist Page 4 of 68<br />
© Office of Chief Economist
12<br />
10<br />
8<br />
6<br />
4<br />
2<br />
0<br />
BOP (USD bn)-3qma<br />
IDR/USD-RHS (reverse report)<br />
We believe <strong>Indonesia</strong>’s balance of payment surplus will<br />
continue to shrink this year. Current account is likely to print a<br />
deficit of around USD1.9 bn or 0.2% of GDP, underpinned by<br />
weaker exports, stronger import growth, and higher income<br />
repatriation by FDI investors. On the capital account side, we<br />
still believe <strong>Indonesia</strong>’s strong economic fundamentals, high<br />
yields, and improved sovereign ratings will continue to attract<br />
foreign investors. However, rising risk aversion may dampen<br />
foreigners’ appetite on risky assets. Other investments are<br />
likely to improve gradually as the central bank regulation on<br />
mandatory repatriation of export and offshore loan proceeds<br />
is gradually implemented. Although there is no requirement to<br />
park such proceeds in the domestic banks for a specific time,<br />
we expect some of the ‘idle’ money will stay. Against this<br />
backdrop, we forecast the rupiah to weaken only slightly to<br />
IDR9,100/USD by YE12 vs. IDR9,068/USD end of last year.<br />
8,000<br />
8,500<br />
9,000<br />
9,500<br />
10,000<br />
10,500<br />
11,000<br />
11,500<br />
-2<br />
12,000<br />
3Q06 2Q07 1Q08 4Q08 3Q09 2Q10 1Q11 4Q11<br />
BOP items (USD bn)<br />
Figure 2. Lower BOP value has led weakening exchange rate (left figure). Higher transportation<br />
service driven from increasing imports (right figure). (Source: <strong>Bank</strong> <strong>Indonesia</strong>, CEIC)<br />
© Office of Chief Economist Page 5 of 68<br />
© Office of Chief Economist Page 5 of 68<br />
6<br />
5<br />
4<br />
3<br />
2<br />
1<br />
0<br />
1Q06<br />
3Q06<br />
1Q07<br />
Flows of transportation services<br />
Imports-RHS<br />
3Q07<br />
1Q08<br />
3Q08<br />
1Q09<br />
3Q09<br />
1Q10<br />
3Q10<br />
1Q11<br />
3Q11<br />
50<br />
45<br />
40<br />
35<br />
30<br />
25<br />
20<br />
15<br />
10<br />
5<br />
0
20<br />
18<br />
16<br />
14<br />
12<br />
10<br />
8<br />
6<br />
4<br />
2<br />
0<br />
© Office of Chief Economist Page 6 of 68<br />
Page 6 of 68<br />
BOP items (USD bn)<br />
Foreign income repatriation of FDI<br />
FDI<br />
2006 2007 2008 2009 2010 2011<br />
3<br />
2<br />
1<br />
0<br />
-1<br />
-2<br />
-3<br />
-4<br />
Foreign flows in SBI (USD bn)<br />
Persistent foreign outflows in SBI was visible<br />
as foreigners could not rollover it due to BI's<br />
policies in SBI<br />
1Q10 2Q10 3Q10 4Q10 1Q11 2Q11 3Q11 4Q11<br />
Figure 3. Increasing income repatriation in line with raising FDI activity (left figure). Presistent<br />
foreign outflow due to BI’s policy (right figure). (Source: <strong>Bank</strong> <strong>Indonesia</strong>)<br />
© Office of Chief Economist
I. CURRENT ACCOUNT 1,891 1,342 1,043 870 5,144 2,072 473 468 -944 2,069<br />
A. Goods, net 6,954 6,848 7,593 9,232 30,628 8,684 9,637 9,586 7,440 35,347<br />
- Exports, fob. 35,088 37,444 39,712 45,830 158,074 45,818 51,797 52,476 51,382 201,473<br />
- Imports, fob. -28,134 -30,596 -32,119 -36,597 -127,447 -37,134 -42,160 -42,890 -43,941 -166,125<br />
1. Non Oil & Gas, net 5,812 5,881 6,605 9,097 27,395 8,628 10,551 9,085 7,013 35,277<br />
1.1. Exports, fob 28,511 30,298 32,763 37,845 129,416 37,092 42,307 42,168 41,626 163,193<br />
1.2. Imports, fob -22,699 -24,417 -26,158 -28,747 -102,021 -28,464 -31,756 -33,084 -34,613 -127,918<br />
2. Oil, net -1,663 -2,140 -1,991 -2,859 -8,653 -3,439 -5,098 -4,060 -3,712 -16,309<br />
2.1. Exports, fob 3,556 3,840 3,749 4,547 15,691 4,856 5,000 5,189 5,239 20,283<br />
2.2. Imports, fob -5,219 -5,980 -5,740 -7,406 -24,344 -8,295 -10,098 -9,249 -8,952 -36,594<br />
3. Gas, net 2,805 3,107 2,980 2,994 11,886 3,495 4,184 4,562 4,140 16,381<br />
3.1. Exports, fob 3,022 3,306 3,201 3,438 12,968 3,870 4,490 5,119 4,517 17,996<br />
3.2. Imports, fob -217 -200 -222 -444 -1,082 -375 -306 -557 -377 -1,615<br />
B. Services, net -2,106 -2,275 -2,155 -2,787 -9,324 -2,122 -3,379 -2,818 -3,503 -11,822<br />
1. Inflow 3,873 4,015 4,334 4,544 16,766 4,456 4,530 5,400 6,146 20,532<br />
2. Outflow -5,979 -6,291 -6,489 -7,331 -26,089 -6,578 -7,909 -8,218 -9,649 -32,354<br />
C. Income, net -4,038 -4,329 -5,547 -6,876 -20,790 -5,518 -6,747 -7,344 -6,058 -25,667<br />
1. Inflow 444 443 521 482 1,890 579 635 653 610 2,478<br />
2. Outflow -4,482 -4,772 -6,068 -7,357 -22,679 -6,097 -7,382 -7,997 -6,668 -28,144<br />
D. Current transfers, net 1,080 1,098 1,151 1,301 4,630 1,028 963 1,044 1,177 4,212<br />
1. Inflow 1,815 1,816 1,883 2,057 7,571 1,830 1,841 1,908 2,057 7,636<br />
2. Outflow -735 -718 -732 -756 -2,941 -802 -878 -864 -880 -3,424<br />
II. CAPITAL & FINANCIAL ACCOUNT 5,662 3,767 7,464 9,728 26,621 6,646 12,849 -4,107 -1,370 14,018<br />
A. CAPITAL ACCOUNT 18 2 4 26 50 1 0 0 0 1<br />
B. FINANCIAL ACCOUNT 5,644 3,765 7,460 9,702 26,571 6,645 12,849 -4,107 -1,370 14,017<br />
- Assets -3,601 -583 -4,748 2,031 -6,901 -3,298 -1,228 -4,399 -7,554 -16,479<br />
- Liabilities 9,244 4,347 12,208 7,672 33,471 9,943 14,076 292 6,185 30,496<br />
1. Direct investment 2,556 2,368 1,764 4,419 11,107 3,461 3,249 1,661 2,066 10,437<br />
1.1 Abroad -427 -982 -1,191 -64 -2,664 -1,529 -2,526 -1,350 -2,317 -7,722<br />
1.2 In <strong>Indonesia</strong> 2,983 3,350 2,955 4,483 13,771 4,990 5,775 3,011 4,383 18,159<br />
2. Portfolio investment 6,159 1,089 4,517 1,437 13,202 3,588 5,537 -4,665 -261 4,199<br />
2.1 Assets -409 -152 -1,597 -353 -2,511 -521 -731 154 -318 -1,416<br />
2.2 Liabilities 6,569 1,241 6,114 1,789 15,713 4,109 6,268 -4,819 57 5,615<br />
2.2.1 Public Sector 6,556 997 4,820 1,154 13,526 4,383 2,964 -4,270 -2,250 826<br />
2.2.2 Private Sector 13 244 1,295 636 2,187 -274 3,304 -549 2,306 4,788<br />
3. Other investment -3,072 308 1,179 3,846 2,262 -404 4,062 -1,103 -3,174 -619<br />
3.1 Assets -2,764 552 -1,960 2,447 -1,725 -1,248 2,029 -3,203 -4,919 -7,340<br />
3.2 Liabilities -308 -244 3,139 1,400 3,987 844 2,033 2,101 1,745 6,723<br />
3.2.1 Public Sector 147 -879 1,093 1,395 1,756 95 -1,402 -712 -240 -2,258<br />
3.2.2 Private Sector -455 636 2,046 5 2,231 749 3,435 2,813 1,985 8,981<br />
III. TOTAL (I+II) 7,552 5,108 8,507 10,597 31,764 8,718 13,322 -3,639 -2,313 16,088<br />
IV. NET ERRORS & OMISSIONS -932 312 -1,552 692 -1,480 -1,052 -1,446 -321 -1,413 -4,232<br />
V. OVERALL BALANCE (III+IV) 6,620 5,420 6,955 11,289 30,284 7,666 11,876 -3,960 -3,726 11,856<br />
* Provisional figures<br />
** Very provisional<br />
ITEMS<br />
INDONESIA'S BALANCE OF PAYMENTS<br />
(millions of USD)<br />
2010 2011<br />
Q1 Q2 Q3 Q4 TOTAL Q1* Q2* Q3* Q4** TOTAL<br />
Figure 4. <strong>Indonesia</strong>’s balance of payment. (Source: <strong>Bank</strong> <strong>Indonesia</strong>)<br />
© Office of Chief Economist Page 7 of 68<br />
© Office of Chief Economist Page 7 of 68
Fund Inflows and Foreign Ownership In <strong>Indonesia</strong>n Capital<br />
Market<br />
Reny Eka Putri (reny.putri@bankmandiri.co.id)<br />
…foreign fund<br />
inflows coming<br />
into the domestic<br />
capital market are<br />
relatively also<br />
experiencing an<br />
upward trend…<br />
Capital market has provided an important role in spurring the<br />
economic growth in <strong>Indonesia</strong>. In addition to the financial<br />
service industry, capital market is also a means for people to<br />
invest in various financial instruments, such as stocks, bonds,<br />
mutual funds and others. In addition to increasing funds from<br />
domestic investors, foreign capital inflows coming into the<br />
domestic capital market are relatively also experiencing an<br />
upward trend. Although at the end of 2008 global financial<br />
market suffered from crisis and liquidity problems, causing a<br />
correction in the domestic capital market, in 2009 a recovery<br />
in the domestic financial market has occurred. It can be seen<br />
from the performance of stock markets in the period of 2005-<br />
2009, in which the foreign capital inflows rose sharply in<br />
October-November 2008 when the acquisition of shares of<br />
listed companies by foreign investors and purchase of bluechip<br />
shares from banking and commodity sectors.<br />
Global Liquidity Direction<br />
Financial and economic crisis led the U.S. economy and some<br />
countries in Europe to have a weakening pressure.<br />
Country/Region 2010 2011E 2012F 2013F<br />
United States -471 -462 -391 -353<br />
Euro Area -61 -54 11 44<br />
Japan 196 107 110 118<br />
Other Mature Economies -21 -40 -37 -35<br />
Emerging Economies 363 360 264 58<br />
Latin America -47 -43 -88 -97<br />
Emerging Europe 0 -8 -26 -93<br />
Middle East/Africa 66 185 179 148<br />
Emerging Asia<br />
Note: E = Estimation, F = Forecast<br />
344 226 199 101<br />
Figure 5. Global Current Account (USD bn). Capital flows to emerging markets will still remain<br />
high compared to the United States, Europe, Japan and other mature economies. By 2012, the<br />
Current Account balance of emerging economies is estimated at USD264 billion (Source: The<br />
Institute of International Finance)<br />
© Office of Chief Economist Page 8 of 68<br />
Page 8 of 68<br />
© Office of Chief Economist
…the continued<br />
improvements in<br />
international<br />
confidence in<br />
<strong>Indonesia</strong><br />
encourage inflows<br />
of foreign funds…<br />
Unstable conditions in developed countries (Mature<br />
Economies) are believed to be able to attract foreign investors<br />
to transfer funds to developing countries (Emerging<br />
Economies), including <strong>Indonesia</strong>. The abundance of global<br />
liquidity as an implication of policies in the mature economies<br />
during the crisis and the continued improvements in<br />
international confidence in <strong>Indonesia</strong> encourage inflows of<br />
foreign funds into domestic financial markets primarily<br />
through portfolio investments.<br />
Based on a report from the Institute of International Finance,<br />
it is estimated the capital inflows to emerging markets will still<br />
remain high compared to the United States, Europe, Japan<br />
and other mature economies. For 2012, the Current Account<br />
balance in emerging economies is estimated at USD264 bn.<br />
261 258 249<br />
201<br />
208<br />
91<br />
488<br />
372<br />
Note: - Latin America (Argentina, Brazil, Chile, Colombia, Ecuador, Mexico, Peru, Venezuela)<br />
- Emerging Europe (Bulgaria, Czech Republic, Hungary, Poland, Romania, Russia, Turkey, Ukraine)<br />
- Middle East/Africa (Egypt, Lebanon, Morocco, Nigeria, Saudi Arabia, South Africa, UAE)<br />
- Emerging Asia (China, India, <strong>Indonesia</strong>, Malaysia, Philippines, South Korea, Thailand)<br />
Figure 6. Emerging Markets: Net Private Capital Inflows (USD bn). In 2012, capital inflows to the<br />
Emerging Asian countries are projected at USD287 billion and in 2013 will reach USD324 billion<br />
(Source: The Institute of International Finance)<br />
In terms of capital inflows for the entire Emerging Economies,<br />
a group of Emerging Asian countries, consisting of China, India,<br />
<strong>Indonesia</strong>, Malaysia, Philippines, South Korea and Thailand,<br />
are expected to gain greater inflows of funds compared to<br />
© Office of Chief Economist Page 9 of 68<br />
© Office of Chief Economist Page 9 of 68<br />
146<br />
73 64<br />
2010 2011E 2012F 2013F<br />
Latin America Emerging Europe Middle East/Africa Emerging Asia<br />
287<br />
272<br />
217<br />
80<br />
324
…<strong>Indonesia</strong> is a<br />
developing<br />
country that<br />
becomes a target<br />
of global<br />
investors…<br />
…the inflows of<br />
foreign funds are<br />
primarily through<br />
portfolio<br />
investments…<br />
© Office of Chief Economist Page 10 of 68<br />
Page 10 of 68<br />
countries in Latin America, Emerging Europe countries and<br />
Middle East / Africa. In 2012, capital inflows into Emerging<br />
Asia countries are projected at USD287 bn and in 2013 will<br />
reach USD324 bn.<br />
Capital inflows into <strong>Indonesia</strong>: Increased Sharply<br />
Recently, <strong>Indonesia</strong> is a developing country that becomes a<br />
target of global investors. Since the economic and financial<br />
crisis in developed countries, <strong>Indonesia</strong> and other developing<br />
countries become more attractive locations for foreign<br />
investors to invest their capitals. This condition is of course a<br />
momentum of its own for the domestic financial sector to the<br />
inflows of foreign funds to be properly managed and used to<br />
support the domestic economic growth.<br />
Over the last eight years, inflows of foreign funds (foreign<br />
capital inflows / financial account liabilities) had an increasing<br />
trend and reached its peak in 2010 at USD31.7 bn, up<br />
significantly by 65.5%YoY. The inflows of foreign funds are<br />
primarily through portfolio investments. Portfolio investment<br />
liabilities in 2010 reached USD15.7 bn (about 50% of the total<br />
inflows of foreign funds) or increased 1.5 times higher than in<br />
2009 at USD10.5 bn.<br />
During the period of 2004-2011, the decline in capital inflows<br />
occurred in 2008 just as the impact of the global financial crisis<br />
widespread. Further declines in commodity prices, a<br />
downward revision to demand from abroad and a potential of<br />
additional shocks to the domestic economy also affect the<br />
inflows of payment balance.<br />
Historically, with a longer period of time, <strong>Indonesia</strong>n financial<br />
account did not always have a surplus. In the period of 1980-<br />
1996 (before the crisis in 1998), the financial account was<br />
recorded to have a surplus at an average of USD4.88 bn per<br />
year. However, during the period of 1997-2003, the financial<br />
account had an average annual deficit of USD5.02 bn since the<br />
Asian financial crisis that began in July 1997 in Thailand, which<br />
ultimately affected the currency, stock and other asset prices<br />
in several Asian countries including <strong>Indonesia</strong>. This event is<br />
also often referred to as the 1998 monetary crisis in <strong>Indonesia</strong>.<br />
Furthermore, during the last eight years (2004-2011), the<br />
© Office of Chief Economist
-<br />
30<br />
25<br />
20<br />
15<br />
10<br />
5<br />
(5)<br />
(10)<br />
(15)<br />
(USD bn)<br />
average annual financial account again had a surplus of<br />
USD6.04 bn.<br />
2004 2005 2006 2007 2008 2009 2010 2011<br />
Direct investment Portfolio investment<br />
Other Invesment Financial Account<br />
(USD bn)<br />
Figure 7. <strong>Indonesia</strong> Balance Of Payments. Over the last eight years (2004-2011), the average<br />
annual financial account again had a surplus of USD6.04 billion. (Source: <strong>Bank</strong> <strong>Indonesia</strong>)<br />
…the portfolio<br />
investments<br />
began to improve<br />
as marked by the<br />
initial high capital<br />
inflows into<br />
various<br />
investments…<br />
© Office of Chief Economist Page 11 of 68<br />
© Office of Chief Economist Page 11 of 68<br />
30<br />
25<br />
20<br />
15<br />
10<br />
5<br />
-<br />
(5)<br />
(10)<br />
(15)<br />
The pressure of the debt crisis in Europe in 3Q11 triggered the<br />
high outflows of portfolio investments in the country.<br />
However, the pressure was reduced as the perception of<br />
foreign market participants that returned to be positive in<br />
4Q11. The capital outflows on the balance sheets that occur<br />
when foreign investors sell government stocks and bonds may<br />
occur at any time. It should be noted that the domestic<br />
market is quite sensitive to the flows of funds and ownership<br />
of assets by foreign investors.<br />
The portfolio investments began to improve in 4Q11<br />
compared to 3Q11 as marked by the initial high capital inflows<br />
into various investment instruments in the form of stock,<br />
government securities (SBN) and the issuance of USDdenominated<br />
sharia bonds (sukuk). Global liquidity factors and<br />
high positive perception of investors towards <strong>Indonesia</strong>’s<br />
macroeconomic stability (as reflected by the relatively strong<br />
economic growth, controlled inflation and exchange rate)
…better ratings to<br />
<strong>Indonesia</strong> also<br />
become a factor<br />
driving the inflows<br />
of foreign<br />
capital…<br />
© Office of Chief Economist Page 12 of 68<br />
Page 12 of 68<br />
support the increasing inflows of foreign funds mainly to the<br />
domestic investment instruments (portfolio).<br />
According to Asia Bond Monitor reported by Asian<br />
Development <strong>Bank</strong>, foreign holdings of Emerging East Asian<br />
Local Currency government bonds (as percentage of total<br />
bond holdings) continued to rise in all markets especially in<br />
<strong>Indonesia</strong>. Foreign holdings in <strong>Indonesia</strong> reached 30.87% in<br />
October 2011, higher than Malaysia (24.6%), Thailand (10.2%)<br />
and Japan (5.7%).<br />
Portfolio investments are encouraged by the development of<br />
<strong>Indonesia</strong>’s Sovereign Credit Rating<br />
A number of international rating agencies that puts better<br />
ratings to <strong>Indonesia</strong> also become a factor driving the inflows<br />
of foreign capital. The government anticipation that is<br />
considered appropriate in the face of global economic turmoil<br />
gets a positive response from the international community.<br />
On April 8, 2011, the Standard & Poor’s increase <strong>Indonesia</strong>’s<br />
debt rating to be BB+ from BB or one notch below the<br />
investment grade. The new rating is the highest since the<br />
financial crisis of 1997. The increase reflects the improved<br />
financial condition and liquidity of domestic markets, thus<br />
potentially widening the foreign capital inflows to <strong>Indonesia</strong> in<br />
the coming periods.<br />
On December 15, 2011, <strong>Indonesia</strong>’s sovereign credit (longterm<br />
debt) was also rated by an international rating agency,<br />
the Fitch Ratings, to be included in the investment grade<br />
category (becoming BBB- from BB+) with a stable outlook. The<br />
Fitch stated that the rise in rating was based on an assessment<br />
that reflected the country’s strong and resilient economic<br />
growth, low and continuously declining public debt ratio, a<br />
strong external liquidity and prudentially executed macro<br />
policy framework.<br />
The steps of the two rating agencies were followed by the<br />
Moody’s, which performed an upgraded rating to the<br />
<strong>Indonesia</strong>’s sovereign credit rating becoming Baa3 from Ba1<br />
on the last January 18, 2012.<br />
© Office of Chief Economist
Standard & Poor's<br />
Moody's Investor<br />
Service<br />
Fitch Rating<br />
Japan Credit Rating<br />
Rating & Investment<br />
Information<br />
08 Apr 2011 : BB BB+<br />
12 Mar 2010 : BB- BB<br />
26 Jul 2006 : B+ BB-<br />
18 Jan 2012 : Ba1 Baa3<br />
17 Jan 2011 : Ba2 Ba1<br />
16 Sep 2009 : Ba3 Ba2<br />
15 Dec 2011 : BB+ BBB-<br />
25 Jan 2010 : BB BB+<br />
14 Feb 2008 : BB- BB<br />
13 Jul 2010 : BB+ BBB-<br />
07 Jul 2009 : BB BB+<br />
06 Sep 2007 : BB- BB<br />
31 Oct 2007 : BB BB+<br />
12 Oct 2006 : BB- BB<br />
Agency Commentary : <strong>Indonesia</strong> continuing improvements in the government's<br />
balance sheet and external liquidity, againts a backdrop of a resilient economic<br />
performance and cautious fiscal management<br />
Agency Commentary : A more favorable assessment of <strong>Indonesia</strong>'s economic<br />
strength is underpinned by gains in investment spending, improved prospects for<br />
infrastructure development following key policy reforms and a well-managed<br />
financial system<br />
Agency Commentary : The upgrades reflect the country's strong and resilient<br />
economic growth, low and declining public debt ratios, strengthened external<br />
liquidity and a prudent overall macro policy framework<br />
Agency Commentary : <strong>Indonesia</strong>'s enhanced political and social stability along with<br />
the progress in democratization and decentralization. Sustainable economic growth<br />
outlook underpinned by solid domestic demand and alleviated public debt burden as<br />
a result of prudent fiscal management<br />
Agency Commentary : <strong>Indonesia</strong> economic structure, which depends substantially<br />
on domestic demand, cushioned the negative impact resulting from the drop in<br />
external demand that was triggered by the global recession<br />
Figure 8. <strong>Indonesia</strong>’s Upgraded Credit Rating. S&P, Moody’s, Fitch and JCR have all recently<br />
upgraded <strong>Indonesia</strong>’s credit rating based on <strong>Indonesia</strong>’s sustained strong economic growth<br />
(Source: Bloomberg)<br />
…our country has<br />
a conducive<br />
investment<br />
climate and<br />
strong<br />
macroeconomic<br />
fundamentals that<br />
have been<br />
successfully built<br />
by the<br />
government in the<br />
last 10 years…<br />
The World <strong>Bank</strong> also welcomed the rise in <strong>Indonesia</strong>’s<br />
sovereign debt rating because it believes that our country has<br />
a conducive investment climate and strong macroeconomic<br />
fundamentals that have been successfully built by the<br />
government in the last 10 years. A good macro policy<br />
framework and progress on structural reforms have made<br />
<strong>Indonesia</strong> generate a positive economic growth. This<br />
development is a momentum in order to encourage long term<br />
investments in infrastructure, regulatory certainty and<br />
transparency that are highly important to create jobs and a<br />
more inclusive growth of <strong>Indonesia</strong>. The position of<br />
<strong>Indonesia</strong>’s debt rating nowadays can be in aligned with<br />
Singapore, India, China and Brazil.<br />
The increasing role of foreign investors may increase liquidity<br />
and reduce the cost of capital (increasing investment), indeed;<br />
however, for developing countries like <strong>Indonesia</strong> it also should<br />
be wary to avoid the high volatility in capital markets. The<br />
inflows of funds into a large scale as the hot money may lead<br />
to withdrawal of funds on a large scale (sudden reversal) and<br />
may cause a severe shock to the domestic capital market<br />
instability.<br />
© Office of Chief Economist Page 13 of 68<br />
© Office of Chief Economist Page 13 of 68
…the share of<br />
foreign ownership<br />
on all traded<br />
investment<br />
instruments was<br />
accounted for<br />
55.5%, higher<br />
than the share of<br />
local ownership of<br />
44.5%...<br />
© Office of Chief Economist Page 14 of 68<br />
Page 14 of 68<br />
Increased Foreign Ownership Mainly in Equity Markets<br />
From year to year, the foreign ownership composition shows<br />
an increase compared to the domestic ownership. Based on<br />
the recent data obtained from Capital Market and Financial<br />
Institution Supervisory Agency (Bapepam-LK), as of January<br />
2012, the share of foreign ownership on all tradable<br />
investment instruments was accounted for 55.5%, higher than<br />
the share of local ownership of 44.5%. Nominally, the types of<br />
effects that are mostly owned by foreign parties include<br />
equity of IDR1,305,600 bn, followed by corporate bonds (IDR)<br />
reaching IDR7,425 bn. The high foreign composition in the<br />
stock market indicates that foreign investors tend to seek<br />
short-term profits by utilizing the domestic market liquidity.<br />
© Office of Chief Economist
Securities (IDR bn) Foreign Ownership Local Ownership Total Ownership<br />
Equity 1,305,600 876,115 2,181,715<br />
Corp. Bond (IDR) 7,425 136,940 144,365<br />
Corp. Bond (USD) 9 711 720<br />
Govt. Bond 570 12,424 12,995<br />
Warrant 1,492 3,013 4,505<br />
MTN (IDR) 1,447 10,083 11,530<br />
MTN (USD) 1,549 3,113 4,663<br />
Mutual Fund (IDR) 379 110 488<br />
Islamic Bond 589 7,217 7,806<br />
Sukuk 10 5,399 5,409<br />
Asset Backed Security 0 1,407 1,407<br />
Total 1,319,070 1,056,533 2,375,603<br />
Equity<br />
40.2%<br />
59.8%<br />
Corp.<br />
Bond<br />
(IDR)<br />
Corp.<br />
Bond<br />
(USD)<br />
94.9% 98.8% 95.6%<br />
Govt.<br />
Bond Warrant<br />
66.9%<br />
33.1%<br />
MTN<br />
(IDR)<br />
87.4%<br />
MTN<br />
(USD)<br />
66.8%<br />
33.2%<br />
Mutual<br />
Fund<br />
(IDR)<br />
22.5%<br />
77.5%<br />
Islamic<br />
Bond Sukuk<br />
92.5%<br />
5.1%<br />
1.3%<br />
4.4%<br />
12.6%<br />
7.5% 0.2%<br />
Foreign Ownership Local Ownership<br />
Asset<br />
Backed<br />
Security Total<br />
99.8% 100.0%<br />
Figure 9. Value and Ownership Composition in Various Instruments between Foreign and Local<br />
Investors by the End of January 2012. Nominally, the types of effects that are mostly owned by<br />
foreign parties include equity of IDR 1,305,600 billion, followed by corporate bonds (IDR)<br />
reaching IDR 7,425 billion. (Source: Bapepam-LK, CEIC)<br />
44.5%<br />
55.5%<br />
Meanwhile, based on the types of security holders, holdings in<br />
the domestic market by foreign investors are dominated by<br />
categories of corporate investors with the ownership of<br />
IDR348,811 bn and financial institutions with the ownership of<br />
IDR249,678 bn. Moreover, local investors mostly comprise of<br />
public companies with the ownership value of IDR533,291 bn,<br />
followed by individual investors with the ownership value of<br />
© Office of Chief Economist Page 15 of 68<br />
© Office of Chief Economist Page 15 of 68
Corporate Individual<br />
533,291<br />
348,811<br />
© Office of Chief Economist Page 16 of 68<br />
Page 16 of 68<br />
174,589<br />
26,552<br />
…the stock market<br />
transactions are<br />
more open and<br />
widely<br />
accessible…<br />
Mutual<br />
Fund<br />
117,661<br />
227,162<br />
IDR174,589 bn. This shows the interest of local retail investors<br />
in investing in the stock market is quite high.<br />
Securities<br />
Company Insurance<br />
14,507<br />
50,897<br />
105,947<br />
11,524<br />
Pension<br />
Fund<br />
Figure 10. Security Ownership by the Types of Security Holders (January 2012 period). Local<br />
investors mostly comprise of public companies with the ownership value of IDR533,291 billion,<br />
followed by individual investors with the ownership value of IDR174,589 billion. (Source:<br />
Bapepam-LK, CEIC)<br />
55,025<br />
65,082<br />
49,906<br />
249,678<br />
3,979<br />
1,505<br />
Foreign Ownership (IDR bn) Local Ownership (IDR bn)<br />
Financial<br />
Institution Foundation Others Total<br />
1,630<br />
337,859<br />
1,056,533<br />
1,319,070<br />
Stock Market Performance: Foreign Purchase Transaction is<br />
still high<br />
Viewing the development in the stock market, the JCI (Jakarta<br />
Composite Index) in <strong>Indonesia</strong> Stock Exchange also shows a<br />
rapid growth. The number of companies listed on the JCI<br />
increased to 442 companies as of February 2012 from 331<br />
companies in 2002. Market capitalization also shows a<br />
significant increase from about IDR268.4 tn at the end of 2002<br />
to IDR3,755.5 tn at the end of February 2012. This<br />
development shows that the stock market transactions are<br />
more open and widely accessible. People can diversify<br />
investments, not just save their assets into the banking sector.<br />
Simultaneously, the share of foreign investors that is also<br />
increasing in the stock market indicates the growing<br />
integration of <strong>Indonesia</strong>’s capital markets and money markets<br />
in the globalization era. The increase in <strong>Indonesia</strong>’s stock<br />
performance prospect rating by Morgan Stanley from<br />
underweight to equal weight in 2011 helped to strengthen<br />
investors’ interest to increase their holdings in the domestic<br />
stock market.<br />
© Office of Chief Economist
..ROE is<br />
estimated at<br />
28.8% of CSPI in<br />
2012, higher than<br />
the ROE in 2011 of<br />
28.4%...<br />
80<br />
70<br />
60<br />
50<br />
40<br />
30<br />
20<br />
10<br />
(%)<br />
In addition, the amount of investment returns in the domestic<br />
stock market also illustrates the improved performance of<br />
listed companies as seen from the increasing market<br />
expectation to Return on Equity (ROE) of JCI to 28.8% in 2012,<br />
higher than the ROE in 2011 of 28.4%. The figure below shows<br />
the trend of the ratio of foreign sales and purchases to total<br />
transactions in the domestic stock market. During the period<br />
of 2004 to January 2012, the ratio of foreign purchases to total<br />
purchasing transactions is still quite high in the range of<br />
52.3%.<br />
Jan-04 Jan-05 Jan-06 Jan-07 Jan-08 Jan-09 Jan-10 Jan-11 Jan-12<br />
Foreign to Total Sales Ratio Foreign to Total Purchases Ratio<br />
Figure 11. Foreign Component of <strong>Indonesia</strong> Stock Exchange Share Trade. High uncertainty in<br />
the global market makes the domestic stock market fluctuative. During the period of 2004 to<br />
January 2012, the ratio of foreign purchases to total purchasing transactions is still quite high in<br />
the range of 52.3%. (Source: CEIC)<br />
The Development of Government Securities: Utilizing the<br />
Momentum & Managing the Risk<br />
Along with the development in the stock market, the inflows<br />
of foreign funds also come into the <strong>Indonesia</strong>’s bond market.<br />
Bond prices continue to improve and yield decreases. Low<br />
yield would provide an opportunity for <strong>Indonesia</strong> to utilize<br />
funds from the capital market with lower interest costs than<br />
those offered by banks.<br />
© Office of Chief Economist Page 17 of 68<br />
© Office of Chief Economist Page 17 of 68
(%)<br />
25<br />
20<br />
15<br />
10<br />
5<br />
0<br />
Figure 12. Development of the <strong>Indonesia</strong> Government Bond Yield. Along with the optimism on<br />
the domestic economy prospects, increasing foreign investor confidence can be seen from the<br />
improvement in risk perception and declining <strong>Indonesia</strong> government bond yield. (Source:<br />
Bloomberg)<br />
…the inflow of<br />
foreign funds that<br />
continues to<br />
increase in the<br />
government<br />
security market,<br />
which can pose its<br />
own risks…<br />
© Office of Chief Economist Page 18 of 68<br />
Page 18 of 68<br />
1-year yield<br />
5-year yield<br />
10-year yield<br />
20-year yield<br />
Jan-08 Jun-08 Nov-08 Apr-09 Sep-09 Feb-10 Jul-10 Dec-10 May-11 Oct-11 Mar-12<br />
Ownership of foreign investors in government securities (SBN)<br />
during the period of 2005-2011 is in an increasing trend. This<br />
shows the confidence of foreign investors to government<br />
bonds is increasingly strengthened based on the fiscal policies<br />
and sound and prudent government debt management.<br />
Some factors that make the <strong>Indonesia</strong>n bond market remain<br />
attractive to foreign investors include, among others,<br />
<strong>Indonesia</strong>’s economic growth that remains solid amid the<br />
economic slowdown in developed countries. <strong>Indonesia</strong><br />
managed to overcome the global crisis of 2008-2009 and<br />
increase the credibility in the eyes of foreign investors.<br />
However, a thing to wary is the inflow of foreign funds that<br />
continues to increase in the government security market,<br />
which can pose its own risks.<br />
Until the end of February 2012, foreign ownership reached<br />
30.2% of the total government securities. As a result, the<br />
domestic bond market will be more vulnerable to the global<br />
financial turmoil.<br />
© Office of Chief Economist
800<br />
700<br />
600<br />
500<br />
400<br />
300<br />
200<br />
100<br />
(IDR tn)<br />
0<br />
0<br />
Jan-08 Sep-08 May-09 Jan-10 Sep-10 May-11 Jan-12<br />
Total Tradable Govt. Securities Outstanding - lhs<br />
Foreign Holder of Tradable Govt. Securities Outstanding - lhs<br />
Foreign Holder to Total Tradable Govt. Securities Outstanding Ratio (%) - rhs<br />
Figure 13. Tradable Government Securities Outstanding (SBN) Development. Ownership of<br />
foreign investors in government securities (SBN) during the period of 2005-2011 is in an<br />
increasing trend. This shows the confidence of foreign investors to government bonds is<br />
increasingly strengthened based on the fiscal policies and sound and prudent government debt<br />
management (Source: CEIC)<br />
…in 2012 the<br />
types of<br />
government<br />
securities<br />
instruments have<br />
reached 12<br />
types…<br />
Resilience of the domestic financial market to the global<br />
financial and economic crisis makes foreign investors<br />
increasingly keen to increase the exposure in the government<br />
security market. The increasing foreign purchasing interest is<br />
also supported by macro factors and controllable fiscal risks,<br />
attractive returns and re-achievement of the investment<br />
grade. The current government security market coverage is<br />
also increasingly expanding with the instrument<br />
diversification. In 2002, the government security consists only<br />
of 3 instruments:<br />
1) Fixed Rate Bond (FR),<br />
2) Variable Rate Bond (VR) and<br />
3) Hedge Bond,<br />
But in 2012 the types of government securities instruments<br />
have reached 12 types, namely:<br />
1) Fixed Rate Bond (FR),<br />
2) Variable Rate Bond (VR),<br />
3) International Bond (IB) Bond,<br />
© Office of Chief Economist Page 19 of 68<br />
© Office of Chief Economist Page 19 of 68<br />
(%)<br />
40<br />
35<br />
30<br />
25<br />
20<br />
15<br />
10<br />
5
…<strong>Bank</strong> <strong>Indonesia</strong><br />
issued a policy<br />
package in June<br />
2010 and Policy<br />
Package in<br />
December 2010 in<br />
an effort to<br />
manage the<br />
inflows of foreign<br />
funds…<br />
© Office of Chief Economist Page 20 of 68<br />
Page 20 of 68<br />
4) Retail Bond (ORI),<br />
5) Zero Coupon Bond (ZC),<br />
6) T-Bills (PN),<br />
7) Samurai Bond (RIJPY),<br />
8) Islamic Fixed Rate Bond (IFR),<br />
9) Retail Sukuk (SR),<br />
10) International Sukuk (SNI),<br />
11) Sharia T-Bills (SPN-S) and<br />
12) Project Based Sukuk (PBS)<br />
Foreign purchasing actions mainly occur in short and medium<br />
term government security instruments (including SPN/Surat<br />
Perbendaharaan Negara). Net purchases occurred at the SPN<br />
for USD0.5 bn during 4Q11, causing the share of foreign<br />
ownership of SPN increased to 46.0% from 39.6%.<br />
<strong>Bank</strong> <strong>Indonesia</strong> Policies & Foreign Ownership Development<br />
at <strong>Bank</strong> <strong>Indonesia</strong> Certificate (SBI)<br />
The outflows of foreign funds should still be concerned about<br />
to keep maintaining monetary stability and financial system.<br />
Therefore, there are some capital flow management policies<br />
made by <strong>Bank</strong> <strong>Indonesia</strong>, namely the Policy Package in June<br />
2010 and the Policy Package in December 2010. The first<br />
policy package, relating to the determination of SBI holding<br />
period of at least one month to hold capital traffics to SBI on a<br />
large scale (in-out) (which was later on May 13, 2011<br />
extended to six-month holding period). In addition, the<br />
policies also regulate the issuance of SBI with 9 month period<br />
and 12 month period. With the issuance of the Policy Package<br />
in June 2010, it is expected to strengthen the stability of the<br />
monetary and financial system to support the sustainable<br />
economic growth and at the same time reinforce the<br />
resilience in the face of any economic turmoil possibility.<br />
Meanwhile, further policy package in December 2010 aims to<br />
strengthen the monetary stability, promote the bank<br />
intermediation role, improve the banking resilience and<br />
strengthen the macro-prudential policy. Increased liability of<br />
Statutory Reserve Requirements (GWM/Giro Wajib Minimum)<br />
of foreign exchange gradually is done to strengthen the<br />
management of foreign capital flows by <strong>Bank</strong> <strong>Indonesia</strong><br />
© Office of Chief Economist
June - 2010<br />
Policy<br />
Package<br />
Dec - 2010<br />
Policy<br />
Package<br />
related to efforts to mitigate the risks to the reversal of large<br />
and sudden foreign capital flows.<br />
1. Improvements to the regulation on the Net Open Position<br />
(NOP)<br />
2. Introduction of the minimum one-month holding period<br />
(OMHP) for <strong>Bank</strong> <strong>Indonesia</strong> Certificates (SBI)<br />
3. Issuance of 9-month and 12-month <strong>Bank</strong> <strong>Indonesia</strong> Certificates<br />
(SBI)<br />
1. Reimposition of the limit on Daily Position of Short-Term <strong>Bank</strong><br />
External Borrowings to 30% of bank capital. This policy will<br />
come into force no later than the end of January 2011 with<br />
a 3-month transition period<br />
2. Phased increase in the foreign currency reserve requirement<br />
from 1.0% to 8.0% of foreign currency depositor funds:<br />
Phase I: raise the foreign currency reserve requirement from<br />
1.0% to 5.0%, effective from 1 March 2011<br />
Phase II: raise the foreign currency reserve requirement from<br />
5.0% to 8.0%, effective from 1 June 2011<br />
Figure 14. <strong>Bank</strong> <strong>Indonesia</strong> Policy for Management of Capital Flows in 2010. These policies are<br />
expected to strengthen the stability of the monetary and financial system to support the<br />
sustainable economic growth and at the same time strengthen the resilience in the face of the<br />
economic turmoil possibility. (Source: <strong>Bank</strong> <strong>Indonesia</strong>)<br />
Continuing the Policy Package in June 2010 and the Policy<br />
Package in December 2010, in 2011 a policy of 6-month<br />
holding period also applied (the extension of the SBI<br />
ownership by <strong>Bank</strong> <strong>Indonesia</strong> from originally one month to six<br />
months from May 13, 2011) and removal of SBI auction (for 1,<br />
3 and 6 months). After these policies, the liquidity of the SBI<br />
(<strong>Bank</strong> <strong>Indonesia</strong> Certificate) was reduced so that the<br />
placement of foreign funds decreased.<br />
This decrease had a positive impact on the economy, as <strong>Bank</strong><br />
<strong>Indonesia</strong> would like to encourage the inflows of foreign funds<br />
to come into long term investment instruments. Some of the<br />
foreign funds originally placed in the SBI were then<br />
transferred to other financial instruments, especially the<br />
government securities (SBN). The number of mature SBI also<br />
encourages the outflows of funds from the SBI.<br />
© Office of Chief Economist Page 21 of 68<br />
© Office of Chief Economist Page 21 of 68
(IDR tn)<br />
400<br />
350<br />
300<br />
250<br />
200<br />
150<br />
100<br />
50<br />
0<br />
24.1<br />
21.2<br />
16.7<br />
19.4<br />
© Office of Chief Economist Page 22 of 68<br />
Page 22 of 68<br />
12.2<br />
32.3<br />
32.3<br />
33.6<br />
27.4<br />
27.1<br />
20.4<br />
25.7<br />
23.0<br />
15.5<br />
18.0<br />
38.9<br />
37.9<br />
33.3<br />
33.1<br />
Jan-10 Jun-10 Nov-10 Apr-11 Sep-11 Feb-12<br />
32.0<br />
Total <strong>Bank</strong> <strong>Indonesia</strong> Certificate (SBI) Ownership - lhs<br />
Foreign <strong>Bank</strong> <strong>Indonesia</strong> Certificate (SBI) Ownership - lhs<br />
Foreign to Total SBI Ownership Ratio (%) - rhs<br />
Figure 15. Foreign Ownership in SBI (<strong>Bank</strong> <strong>Indonesia</strong> Certificate). The composition of foreign<br />
ownership of SBI fell to 6.5% in December 2011 compared to 27.4% in November 2011. In<br />
February 2012, the share of foreign ownership of SBI increased again to 8.1%. (Source: <strong>Bank</strong><br />
<strong>Indonesia</strong>, CEIC)<br />
…operation to<br />
transfer the<br />
outflow of funds<br />
caused the<br />
composition of<br />
foreign ownership<br />
of SBI decreased…<br />
27.4<br />
21.6<br />
15.5<br />
6.5<br />
7.2<br />
(%)<br />
50<br />
In the 4Q11, the net outflow of SBI transactions reached<br />
USD3.7 bn, which is higher than the 3Q11 of USD2.4 bn. The<br />
number of outstanding SBI has declined, for which <strong>Bank</strong><br />
<strong>Indonesia</strong> made an operation to transfer the outflow of funds<br />
from the short term SBI (which is the inflow of portfolio that is<br />
more susceptible to changes in the flow direction or turmoil in<br />
the market). This condition caused the composition of foreign<br />
ownership of SBI fell by 6.5% in December 2011 compared to<br />
27.4% in November 2011. By the end of February 2012, the<br />
share of foreign ownership of SBI increased again to 8.1%.<br />
Conclusions<br />
1. In the midst of Europe’s debt crisis and economic turmoil<br />
in the United States, the interest of foreign investors in<br />
<strong>Indonesia</strong>’s investment instruments remains high, driven<br />
by positive international perceptions to the domestic<br />
economy and attractive returns.<br />
8.1<br />
45<br />
40<br />
35<br />
30<br />
25<br />
20<br />
15<br />
10<br />
© Office of Chief Economist<br />
5<br />
0
2. The Institute of International Finance estimates that<br />
capital inflows to emerging markets will still remain high<br />
compared to the United States, Europe, Japan and other<br />
mature economies. In 2012, capital inflows into Emerging<br />
Asia countries are projected at USD287 bn and in 2013 will<br />
reach USD324 bn.<br />
3. The portfolio investments began to improve in 4Q11<br />
compared to 3Q11 as marked by the initial high capital<br />
inflows into various investment instruments in the form of<br />
stock, government securities (SBN) and the issuance of<br />
USD-denominated sharia bonds (sukuk). Global liquidity<br />
factors and high positive perception of investors towards<br />
<strong>Indonesia</strong>’s macroeconomic stability support the<br />
increasing inflows of foreign funds mainly to the domestic<br />
investment instruments (portfolio).<br />
4. As of January 2012, the share of foreign ownership on all<br />
tradable investment instruments was accounted for<br />
55.5%, higher than the share of local ownership of 44.5%.<br />
Nominally, the types of effects that are mostly owned by<br />
foreign parties include equity of IDR1,305,600 bn,<br />
followed by corporate bonds (IDR) reaching IDR7,425 bn.<br />
5. Ownership of foreign investors in government securities<br />
(SBN) during the period of 2005-2011 is in an increasing<br />
trend. <strong>Indonesia</strong> managed to overcome the global crisis of<br />
2008-2009 and increase the credibility in the eyes of<br />
foreign investors. Until the end of January 2012, foreign<br />
ownership reached 32.1% of the total government<br />
securities.<br />
6. Operation of <strong>Bank</strong> <strong>Indonesia</strong> to transfer the outflow of<br />
funds from the short term SBI caused the composition of<br />
foreign ownership of SBI fell by 6.5% in December 2011<br />
compared to 27.4% in November 2011. By the end of<br />
February 2012, the share of foreign ownership of SBI<br />
increased again to 8.1%.<br />
© Office of Chief Economist Page 23 of 68<br />
© Office of Chief Economist Page 23 of 68
The Development of Commercial <strong>Bank</strong>ing in <strong>Indonesia</strong><br />
Nurul Yuniataqwa Karunia (nurul.karunia@bankmandiri.co.id)<br />
Development of <strong>Indonesia</strong>’s banking system during 2011 still<br />
showed the maintained stability with the improved<br />
intermediary function, despite of amidst the financial market<br />
turmoil due to the influence of the global economic downturn.<br />
The solid domestic banking condition was still reflected in the<br />
high Capital Adequacy Ratio (CAR), which was far above the<br />
minimum of 8%, reached 16.1% by December 2011, although<br />
the level of CAR decreased when compared to 2010, which<br />
reached 17.2%. Ratio of gross Non-Performing Loan (NPL) of<br />
commercial banking in <strong>Indonesia</strong> was also still good enough,<br />
equal to 2.17% by December 2011 or under the maximum<br />
limit of the provisions of <strong>Bank</strong> <strong>Indonesia</strong>, which was 5%. The<br />
commercial banking NPL rate in 2011 was better than the NPL<br />
by December 2010, which amounted to 2.67%. Furthermore,<br />
the Loan to Deposit Ratio (LDR) of commercial banks also<br />
increased to 78.8% in 2011 from 75.2% in 2010.<br />
Of the growth of Third Party Funds (TPFs) and lending, the<br />
national banking industry has also increased in 2011. TPFs<br />
continued to be accelerated in line with the loan growth. By<br />
the end of 2011, TPFs grew 19.1% (YoY) to IDR2.785 tn. This<br />
figure was higher than the growth at the end of 2010, which<br />
amounted to 18.5% (YoY) and it was also the highest growth<br />
rate in the banking history of <strong>Indonesia</strong>. Meanwhile, loan to<br />
finance economic activity continued to increase, as reflected<br />
in the loan growth reaching 24.6% (YoY) by December 2011 or<br />
at IDR2,200 tn. The investment loan came with the highest<br />
growth, by 33.2% (YoY), followed by growth in consumer loan<br />
by 24.2% (YoY) and working capital loans by 21.4% (YoY).<br />
<strong>Bank</strong>ing development was also evident from the improvement<br />
in the ratio of national bank loans to GDP reaching 29.7% in<br />
2011 from the previous 27.5% in 2010. This increasing ratio<br />
indicates that the intermediary function is getting better. By<br />
region, commercial bank also shows better performance in all<br />
areas, which are divided into regions of Sumatra, Java,<br />
Kalimantan, Sulawesi, Bali-Nusa Tenggara, and Maluku-Papua.<br />
© Office of Chief Economist Page 24 of 68<br />
Page 24 of 68<br />
© Office of Chief Economist
Development of the<br />
banking industry is<br />
highly affected by the<br />
economic development<br />
of a region<br />
12%<br />
The Role of Regions in <strong>Indonesia</strong>’s <strong>Bank</strong>ing Development<br />
The development of <strong>Indonesia</strong>’s banking industry<br />
performance mostly is still concentrated in Java and Sumatra.<br />
This corresponds to the economic activities and structures<br />
that are also centralized in the areas of Java and Sumatra.<br />
Both regions dominate the contribution of Gross Domestic<br />
Product (GDP) in 2011 nationwide, respectively for 57.7%, and<br />
23.5%.<br />
In this regard, the Ministry of Industry notes the spread of the<br />
concentration of industrial centers in <strong>Indonesia</strong> by 75% is in<br />
the areas of Java. Distribution of industries outside of Java was<br />
far below the percentage of Java, such as Sumatra by 18.37%,<br />
Kalimantan by 3.41%, Sulawesi by 2.16%, Bali-Nusa Tenggara<br />
by 0.79% and Maluku-Papua by 0.3%. Thus, the government<br />
needs to accelerate industrial development outside of Java in<br />
order to develop the industry in regions.<br />
When compared to 2007, the concentration of industry in<br />
<strong>Indonesia</strong> has not much changed. With the economic and<br />
industrial structures, banks are expected to take a role in<br />
advancing areas outside of Java and Sumatra. One way is to<br />
have an entrepreneurship program in regions to drive the<br />
local economy. In 2010, entrepreneurs in <strong>Indonesia</strong> amounted<br />
to 440,000 or 0.18% of the total population. Meanwhile,<br />
developed countries like the U.S. reached 11.5% and<br />
Singapore 7.2%. The government states that <strong>Indonesia</strong> ideally<br />
requires 2% entrepreneurs of the total population.<br />
TPFs Loan<br />
5% 3% 2% 2%<br />
76%<br />
Jawa Sumatera Kalimantan<br />
Sulawesi Bali NT Maluku Papua<br />
© Office of Chief Economist Page 25 of 68<br />
© Office of Chief Economist Page 25 of 68<br />
13%<br />
4% 4% 2%<br />
1%<br />
76%<br />
Jawa Sumatera Kalimantan<br />
Sulawesi Bali NT Maluku Papua<br />
Figure 16. Composition of the <strong>Bank</strong>ing Role by Region, 2011. The role of banks in the areas of Java is<br />
still dominating the banking industry in <strong>Indonesia</strong>. Collection of TPFs and lending amount more than<br />
70% are still done in Java. (Source: <strong>Bank</strong> <strong>Indonesia</strong>)
The high performance<br />
of commercial banks<br />
can also be seen from<br />
the high ratio of loan<br />
to GRDP<br />
© Office of Chief Economist Page 26 of 68<br />
Page 26 of 68<br />
Loan Ratio of Commercial <strong>Bank</strong>s to GRDP<br />
Performance of commercial banks in each province can also<br />
be seen from the ratio of loan to the economy or loan to Gross<br />
Regional Domestic Product (GRDP). The greater ratio the<br />
higher the commercial bank’s role of intermediation to the<br />
economy of the province. This is also related to the economic<br />
development in the province.<br />
In 2010, Jakarta has succeeded to have the highest ratio of<br />
lending to GDP compared to other provinces. This ratio also<br />
indicates that the role of commercial banks in Jakarta is still<br />
dominating in the economic development in <strong>Indonesia</strong>.<br />
Commercial banking in this provinces is able to achieve the<br />
ratio of loan to GRDP by 100.2%. Meanwhile, some general<br />
banking in <strong>Indonesia</strong> had a low ratio of loan to GDRP.<br />
However, it is estimated that Jakarta’s lending is not only from<br />
the province but also from other provinces such as the<br />
distribution in West Java because it is recorded to have a low<br />
ratio while it is the basis of several major industries in<br />
<strong>Indonesia</strong>.<br />
10 Provinces with the Highest and Lowest of Loan to GRDP Ratio, 2010<br />
The Highest Loan to GDRP The Lowest Loan to GDRP<br />
No. Province<br />
Ratio of<br />
Loan/GRDP<br />
(%) No. Province<br />
Ratio of<br />
Loan/GRDP<br />
(%)<br />
1. DKI Jakarta 100.2 1. West Nusa Tenggara 19.3<br />
2. Gorontalo 75.7 2. West Java 18.1<br />
3. Maluku 49.3 3. Lampung 17.7<br />
4. North Maluku 41.6 4. Bangka Belitung 14.5<br />
5. Riau Islands 38.5 5. West Papua 13.5<br />
6. Bali 36.5 6. East Kalimantan 10.1<br />
7. North Sulawesi 35.4 7. Papua 9.4<br />
8. South Sulawesi 35.4 8. South Sumatera 9.2<br />
9. West Sulawesi 33.1 9. Riau 8.6<br />
10. Bengkulu 31.9 10. Southeast Sulawesi 6.5<br />
Figure 17. Loan to GRDP Ratio, 2010. The role of commercial banks in Jakarta areas is still<br />
dominating the economic development in <strong>Indonesia</strong>. Commercial banking in this provinces is able to<br />
achieve the ratio of loan to GRDP by 100.2%. Meanwhile, Commercial <strong>Bank</strong>ing in Southeast Sulawesi<br />
recorded the lowest ratio at 6.5% level. (Source: <strong>Bank</strong> <strong>Indonesia</strong>, Central Bureau of Statistics)<br />
© Office of Chief Economist
Jakarta has become a<br />
province that is able to<br />
collect the largest TPFs<br />
with a share of 51% of<br />
total national TPFs<br />
1,417<br />
DKI Jakarta<br />
41%<br />
Gorontalo<br />
Factsheet of Commercial <strong>Bank</strong>ing by Region in <strong>Indonesia</strong><br />
Commercial <strong>Bank</strong>s TPFs<br />
In 2011, Jakarta has become a province that is able to collect<br />
the largest TPFs with a share of 51% of total national TPFs.<br />
East Java becomes the province with the second largest TPFs<br />
collection with a share of 9% of total national TPFs. In terms of<br />
TPFs, North Sumatera is able to increase the collection of TPFs<br />
from the top five ranking in 2005 to the top four ranking in<br />
2011 by shifting the position of Central Java.<br />
10 Provinces with the Highest TPF Distribution in <strong>Indonesia</strong>, 2011<br />
(IDR tn)<br />
251 219<br />
Jawa Timur<br />
Malut<br />
Jawa Barat<br />
Kalteng<br />
127 125<br />
Sumatera<br />
Utara<br />
Kaltim<br />
Jawa<br />
Tengah<br />
Bengkulu<br />
70 67 51 46 46<br />
© Office of Chief Economist Page 27 of 68<br />
© Office of Chief Economist Page 27 of 68<br />
Banten<br />
Kalsel<br />
Kalimantan<br />
Timur<br />
NTB<br />
Kepulauan<br />
Riau<br />
Kepri<br />
Sulawesi<br />
Selatan<br />
10 Provinces with the Highest TPF Growth in <strong>Indonesia</strong>, 2011<br />
(%)<br />
37%<br />
34% 34%<br />
32% 31%<br />
28%<br />
26%<br />
25% 24%<br />
Figure 18. Share and Growth of TPFs in <strong>Indonesia</strong>, 2011. The largest TPFs are in Jakarta, reaching<br />
IDR1,147 tn. North Sumatra managed to increase the collection of TPFs from the fifth rank in 2005 to<br />
the fourth rank in 2011. Meanwhile, there are six provinces that are able to grow the TPFs more than<br />
30% in 2011. (Source: <strong>Bank</strong> <strong>Indonesia</strong>)<br />
NTT<br />
Bali<br />
Banten<br />
National<br />
19.1%
A province that has the<br />
highest loan growth in<br />
2011 is North Maluku,<br />
which reached 35%<br />
(YoY).<br />
© Office of Chief Economist Page 28 of 68<br />
Page 28 of 68<br />
1,080<br />
DKI<br />
Jakarta<br />
Commercial <strong>Bank</strong>s Lending<br />
The highest lending in <strong>Indonesia</strong> is also in Jakarta of IDR1,080<br />
tn, followed by East Java of IDR190 tn. Both provinces have a<br />
share of 57.7% of total loans in <strong>Indonesia</strong> in 2011. In terms of<br />
loan, South Sumatra could shift the Riau lending rank from the<br />
top seven ranking in 2005 to the top six ranking in 2011.<br />
Meanwhile, the Riau lending rank fell from the sixth position<br />
in 2005 to the ninth position in 2011. In the meantime, a<br />
province that has the highest loan growth in 2011 is North<br />
Maluku, which reached 35% (YoY).<br />
35% 34% 34%<br />
Malut<br />
190 173<br />
Jatim<br />
10 Provinces with the Highest Lending in <strong>Indonesia</strong>, 2011<br />
(IDR tn)<br />
Gorontalo<br />
Jabar<br />
Babel<br />
121 106<br />
Jateng<br />
31% 30% 30% 29% 29% 29% 29%<br />
Papua<br />
Sumut<br />
Kalteng<br />
53 52 42 36 35<br />
10 Provinces with the Highest Loan Growth in <strong>Indonesia</strong>, 2011<br />
(%)<br />
Sumsel<br />
Jambi<br />
Banten<br />
NTT<br />
Kaltim<br />
Kaltim<br />
Riau<br />
Bengkulu<br />
Kepri<br />
Papua<br />
Barat<br />
National<br />
24.6%<br />
Figure 19. Share and Growth of Lending in <strong>Indonesia</strong>, 2011. The highest lending is also in Jakarta,<br />
reaching IDR 1,080 tn. South Sumatera managed to increase the loan Rank from the seventh position<br />
in 2005 to the sixth position in 2011. Meanwhile, there are six provinces that are able to have loan<br />
growth of more than 30% in 2011. (Source: <strong>Bank</strong> <strong>Indonesia</strong>)<br />
© Office of Chief Economist
In 2011, the highest<br />
loan based on the use<br />
in <strong>Indonesia</strong> is used for<br />
working capital loans<br />
which reaching 48.6%<br />
of total lending<br />
disbursed by<br />
commercial banks<br />
Commercial <strong>Bank</strong>s Lending Based on Type of Use<br />
In 2011, the highest loan based on the use in <strong>Indonesia</strong> is used<br />
for working capital loans which reaching 48.6% of total lending<br />
disbursed by commercial banks. If seen by the largest<br />
percentage in the lending, working capital loans in Java get the<br />
highest share, reaching 55.5%. Meanwhile, investment and<br />
consumption loans gained the highest share compared to<br />
other regions, respectively in Kalimantan (22.9%) and Maluku-<br />
Papua (53.1%).<br />
The development of lending based on the type of use in<br />
<strong>Indonesia</strong> experienced the share transfer. In 2011, the share<br />
of working capital lending of 48.6% decreased in share<br />
compared to 2007, reaching more than 50% or 53% of total<br />
loans provided. The share of consumer loans in 2011 also<br />
declined from 30.3% in 2007 to 28.4% in 2011. Meanwhile, the<br />
share of investment loans increased from 18.5% in 2007 to<br />
21.1% in 2011.<br />
When viewed from the loan growth by the type of use per<br />
region in <strong>Indonesia</strong>, in 2011 investment loans had the highest<br />
growth in Maluku-Papua, amounting to 63.1% (YoY). Working<br />
capital loans and consumer loans in the regions also<br />
experienced the highest growth, reaching 23.5% (YoY) and<br />
28.1% (YoY), respectively.<br />
Loan of Commercial <strong>Bank</strong>s Based on Type of Use By Region, 2011 (IDR bn)<br />
Area Working Capital Investment Consumption<br />
Java 835,283 351,445 444,523<br />
Sumatera 127,205 58,454 104,761<br />
Kalimantan 31,763 27,352 34,721<br />
Sulawesi 35,598 14,820 45,265<br />
Bali-NT 18,165 7,465 26,469<br />
Maluku-Papua 9,316 2,604 10,949<br />
Others 11,345 2,123 464<br />
Total 1,068,676 464,262 667,155<br />
Figure 20. Commercial <strong>Bank</strong>s Lending Based on Type of Use in <strong>Indonesia</strong>, 2011. Lending based on<br />
the use in <strong>Indonesia</strong> is most widely distributed for working capital loans. However, the share of<br />
working capital loans was 48.6% in 2011, which decreased compared to 2007 reaching 53% of total<br />
loans distributed. (Source: <strong>Bank</strong> <strong>Indonesia</strong>)<br />
© Office of Chief Economist Page 29 of 68<br />
© Office of Chief Economist Page 29 of 68
Area<br />
Commercial banks<br />
lending by economic<br />
sector in 2011 were<br />
mostly given to the<br />
trade sector, reaching<br />
18.4% of total lending.<br />
© Office of Chief Economist Page 30 of 68<br />
Page 30 of 68<br />
Agri<br />
culture<br />
Commercial <strong>Bank</strong>s Lending by Economic Sector<br />
Commercial banks lending by economic sector in 2011 were<br />
mostly given to the trade sector, reaching 18.4% of total<br />
lending. The share of loan by economic sector in 2011 also<br />
experienced a change in the lending than in 2007. There are<br />
four economic sectors that have increased in the loan share,<br />
including the Mining Sector (from 2.6% to 4.0%), Utility Sector<br />
(from 0.8% to 2.1%), Transport and Communication Sector<br />
(from 3.7% to 4.3%), and Social Service Sector (from 1.4% to<br />
2.6%). Meanwhile, some economic sectors also experienced a<br />
decline in the loan share, such as Manufacturing Sector (from<br />
20.5% to 15.7%), Trade Sector (from 21.6% to 18.4%),<br />
Agriculture Sector (from 5.7% to 5.2%), Construction Sector<br />
(from 4.4% to 3.4%), and Business Service Sector (from 11% to<br />
10.2%).<br />
From loan growth by economic sector in each region, several<br />
regions in <strong>Indonesia</strong> experienced loan growth of over 100% in<br />
2011. Some fast-growing economic sectors in Sulawesi include<br />
the loans of Mining Sector (115.2%, YoY), Utility Sector<br />
(120.2%, YoY), and Transport and Communication Sector<br />
(113.7%, YoY). Other regions that experienced significant<br />
growth in sectoral loan are Maluku-Papua that experienced<br />
growth in Business Services Sector of 107.7% (YoY) in 2011.<br />
Loan of Commercial <strong>Bank</strong>s Based on Sectors By Region, 2011 (IDR bn)<br />
Mining Manufa<br />
cturing<br />
Utility Const. Trade<br />
Trans.<br />
and<br />
comm.<br />
Business<br />
Service<br />
© Office of Chief Economist<br />
Social<br />
Service<br />
Java 63,301 79,496 297,159 43,330 54,284 268,510 80,019 196,688 42,712<br />
Sumatera 35,353 2,246 36,061 1,470 9,569 66,715 6,799 11,661 5,384<br />
Kalimantan 11,392 3,110 3,355 433 4,580 18,337 5,186 7,326 3,048<br />
Sulawesi 2,062 482 4,174 196 3,381 27,537 1,968 4,080 2,447<br />
Bali-NT 839 116 1,284 52 1,386 15,438 327 2,003 1,797<br />
Maluku-Papua 228 51 511 33 1,873 6,033 238 646 1,038<br />
Others 1,546 2,277 2,051 329 323 2,871 672 1,744 1,552<br />
Total 114,721 87,778 344,595 45,843 75,396 405,441 95,209 224,148 57,978<br />
Figure 21. Loan of Commercial <strong>Bank</strong>s by Economic Sector in <strong>Indonesia</strong>, 2011. Lending of Commercial<br />
<strong>Bank</strong>s by Economic Sector in 2011 was mostly given to the trade sector, reaching 18.4% of total loans<br />
or for IDR 405 tn. (Source: <strong>Bank</strong> <strong>Indonesia</strong>)
The high lending in<br />
several regions in<br />
<strong>Indonesia</strong> is also in line<br />
with the high prices of<br />
some commodities in<br />
international markets<br />
350<br />
300<br />
250<br />
200<br />
150<br />
100<br />
50<br />
0<br />
Correlation of Commercial <strong>Bank</strong>s Loan and Regional Economy<br />
<strong>Bank</strong>ing lending in <strong>Indonesia</strong> has a correlation with the major<br />
natural resources and regional potentials in <strong>Indonesia</strong>. The<br />
high lending in several regions in <strong>Indonesia</strong> is also in line with<br />
the high prices of some commodities in international markets.<br />
In this regard, lending in Sumatra and Kalimantan is fairly<br />
affected by the world commodity price movements.<br />
In Sumatra, lending is heavily influenced by plantation<br />
commodity price movements, such as Crude Palm Oil (CPO)<br />
and Rubber. In 2007 and 2008, along with the increase in CPO<br />
and rubber prices in international markets, the lending rose<br />
respectively to 28.8% (YoY) and 27.1% (YoY) (Figure 6). The<br />
loan growth has increased significantly compared to 2006,<br />
which amounted to 20.2% (YoY) only.<br />
Meanwhile, in Kalimantan, lending is highly related to global<br />
coal price. When the coal price rose to the highest position at<br />
USD133.5 / metric ton in 2008, lending in the year had<br />
increased to 31.3% (YoY) (Figure 8). Thus, further loan growth<br />
in some areas of <strong>Indonesia</strong> is in line with the world’s<br />
forecasted commodity prices becoming the main natural<br />
resources of each region.<br />
COAL, USD/metric ton (LHS)<br />
Rubber, USD cents/pound(LHS)<br />
CPO, USD/ton (RHS)<br />
Jan-02 Sep-03 May-05 Jan-07 Sep-08 May-10 Jan-12<br />
Figure 22. World Commodity Prices. Lending in some areas of <strong>Indonesia</strong> is strongly correlated with<br />
world commodity prices as a result of the major natural resources in the region. For example, lending<br />
in Sumatra is influenced by the development of CPO and rubber prices. Meanwhile, the lending in<br />
Kalimantan region is highly influenced by the world’s coal prices. (Source: Bloomberg)<br />
© Office of Chief Economist Page 31 of 68<br />
© Office of Chief Economist Page 31 of 68<br />
1500<br />
1300<br />
1100<br />
900<br />
700<br />
500<br />
300
The TPF and loan<br />
growth in Sumatra in<br />
2011 increased<br />
respectively to 19%<br />
(YoY) and 24% (YoY)<br />
© Office of Chief Economist Page 32 of 68<br />
Page 32 of 68<br />
Commercial <strong>Bank</strong>ing Development by Region<br />
Sumatra<br />
<strong>Bank</strong>ing performance of banks in Sumatra shows a positive<br />
development. The TPF and loan growth in Sumatra in 2011<br />
increased respectively to 19% (YoY) and 24% (YoY) compared<br />
to 2010, which grew 16% (YoY) and 23% (YoY). Lower growth<br />
in TPFs compared to loans caused the Loan-to-Deposit Ratio<br />
(LDR) of banking in Sumatra rose slow from 81% in 2010 to<br />
85% in 2011. This condition indicates that the fulfillment of<br />
lending by banks in Sumatra area is highly done by the flow of<br />
funds from banks or other financial institutions outside the<br />
banking operations in Sumatra.<br />
If seen by the provinces in Sumatra, North Sumatra became<br />
the largest lender and the largest TPF collector, which reached<br />
IDR127 tn and IDR106 tn, respectively, by 2011. When viewed<br />
from the growth of TPFs and loans, a province that<br />
experienced the highest increase in TPF growth in 2011 was<br />
Bengkulu by 32% (YoY), to IDR6.2 tn. Meanwhile, a province in<br />
Sumatra that had the highest lending growth was Bangka<br />
Belitung by 33.6% (YoY), to IDR5 tn.<br />
Indicators 2006 2007 2008 2009 2010 2011<br />
TPF (IDR bn) 179,233 205,921 240,512 250,615 289,559 343,544<br />
TPF Growth (%) 29 15 17 4 16 19<br />
Loan (IDR bn) 101,290 130,509 165,884 191,272 234,860 290,421<br />
Loan Growth (%) 20 29 27 15 23 24<br />
LDR (%) 57 63 69 76 81 85<br />
NPL Nominal (IDR bn) 6,015 5,206 3,990 5,623 6,443 6,476<br />
NPL (%) 5.9 4.0 2.4 2.9 2.7 2.2<br />
Figure 23. Commercial <strong>Bank</strong>ing Indicators in Sumatra. Lending and TPFs growth in Sumatra is in line<br />
with the national territory. Meanwhile, the commercial banking LDR in 2011 reached 85% or higher<br />
than LDR level in 2011, amounting to 81%. (Source: <strong>Bank</strong> <strong>Indonesia</strong>)<br />
© Office of Chief Economist
Development of<br />
commercial bank<br />
performance in Java<br />
from the lending side<br />
had increased by 24%<br />
(YoY) to IDR1,631 tn in<br />
2011<br />
Java<br />
Development of commercial bank performance in Java from<br />
the lending side had increased by 24% (YoY) to IDR1,631 tn in<br />
2011, an increase compared with the annual growth in 2010.<br />
The increased lending was followed by an increase in loan<br />
quality, which could be determined from the percentage of<br />
Non-Performing Loan (NPL) in 2011 that decreased to 2.2%<br />
from 2.5% in 2010. However, the TPF collection growth slowed<br />
compared to TPF collection growth in 2010, which reached<br />
19% (YoY) to 18% (YoY) or at IDR2,109 tn in 2011. LDR of<br />
commercial banks in Java increased significantly in 2011, to<br />
77% compared to 2010 amounting to 74%.<br />
From the performance of commercial banks by province,<br />
Jakarta was a province that is able to collect the highest TPFs<br />
and make the highest lending compared to other provinces in<br />
<strong>Indonesia</strong>. In 2011, Jakarta was able to collect IDR1.417 tn<br />
TPFs, up 18.3% (YoY) and the loans that were successfully<br />
disbursed were IDR1.080 tn, up 25% (YoY). However, Banten<br />
was a province in Java that was capable of experiencing the<br />
highest loan growth of 25.7% (YoY), to IDR52 tn and also<br />
became a province with the highest growth in the TPF<br />
collection in Java, amounting to 24.2% (YoY) to IDR70 tn in<br />
2011.<br />
Indicators 2006 2007 2008 2009 2010 2011<br />
TPF (IDR bn) 957,127 1,128,520 1,306,436 1,493,354 1,784,020 2,108,993<br />
TPF Growth (%) 10 18 16 14 19 18<br />
Loan (IDR bn) 605,901 762,106 998,545 1,075,963 1,311,267 1,631,253<br />
Loan Growth (%) 13 26 31 8 22 24<br />
LDR (%) 63 68 76 72 74 77<br />
NPL Nominal (IDR bn) 37,152 30,456 34,417 37,515 33,385 35,805<br />
NPL (%) 6.1 4.0 3.4 3.5 2.5 2.2<br />
Figure 24. Indicators of Commercial <strong>Bank</strong>ing in Java Region. Performance of banks in Java from the<br />
lending side increased by 24% (YoY), becoming IDR1.631 tn in 2011. The increased lending was<br />
followed by a decline in NPLs to 2.2% in 2011 from 2.5% in 2010. (Source: <strong>Bank</strong> <strong>Indonesia</strong>)<br />
© Office of Chief Economist Page 33 of 68<br />
© Office of Chief Economist Page 33 of 68
TPF collection and loan<br />
growth in Kalimantan<br />
region in 2011 were<br />
higher than the<br />
national growth<br />
© Office of Chief Economist Page 34 of 68<br />
Page 34 of 68<br />
Kalimantan<br />
Commercial banking activities in Kalimantan in 2011 showed a<br />
fairly good progress. TPF and loan growth in Kalimantan in<br />
2011 were higher than the national growth. TPF grew by 30%<br />
(YoY) to IDR135 tn, while loan growth reached 27% (YoY),<br />
which increased to IDR94 tn. TPF collection growth in<br />
Kalimantan in the Compound Annual Growth Rate (CAGR)<br />
over the period of 2005-2011 managed to have the fastest<br />
growth than other regions in <strong>Indonesia</strong> because it managed to<br />
reach 19.7%. Improved performance of banking was also<br />
followed the NPL improvement in 2011 fell to 1.6%.<br />
The highest fund collection and lending by province in<br />
Kalimantan was in East Kalimantan, which reached IDR66 tn<br />
and IDR42 tn, respectively. Meanwhile, the fastest TPF growth<br />
in 2011 by province was experienced by Central Kalimantan by<br />
34.1% (YoY), to IDR12 tn. Similarly, in terms of lending growth,<br />
the highest growth in 2011 was experienced by Central<br />
Kalimantan by 30% (YoY), to IDR11 tn.<br />
Indicators 2006 2007 2008 2009 2010 2011<br />
TPF (IDR bn) 59,712 68,609 82,023 88,586 103,443 134,966<br />
TPF Growth (%) 30 15 20 8 17 30<br />
Loan (IDR bn) 27,381 34,874 45,778 55,871 73,818 93,838<br />
Loan Growth (%) 15 27 31 22 32 27<br />
LDR (%) 46 51 56 63 71 70<br />
NPL Nominal (IDR bn) 1,147 1,119 1,132 1,123 1,356 1,523<br />
NPL (%) 4.2 3.2 2.5 2.0 1.8 1.6<br />
Figure 25. Indicators of Commercial <strong>Bank</strong>ing in Kalimantan. TPF and loan growth in Kalimantan in<br />
2011 were higher than the national growth. The TPF collection grew by 30% (YoY), to IDR135 tn,<br />
while the lending growth reached 27% (YoY), to IDR 94 tn. The improved performance of banks was<br />
also followed by the NPL improvement in 2011, which fell to 1.6%. (Source: <strong>Bank</strong> <strong>Indonesia</strong>)<br />
Sulawesi recorded the<br />
highest LDR and NPL<br />
rates compared to<br />
other regions in<br />
<strong>Indonesia</strong><br />
Sulawesi<br />
Development of commercial banking in Sulawesi in 2011 was<br />
still improved. It can be seen in lending and TPF growth above<br />
20%. The high lending rate was also seen from the Loan to<br />
© Office of Chief Economist
Deposit Ratio (LDR), which reached 116% or the highest rate<br />
compared to LDR of other regions in <strong>Indonesia</strong>.<br />
However, for the future, commercial banks in Sulawesi need<br />
to be more careful to approve lending because of the level of<br />
Non Performing Loan (NPL) is recorded at a relatively highest<br />
level compared to other regions in <strong>Indonesia</strong>. The level of NPL<br />
in Sulawesi reached 2.7%. Although it is the higest level<br />
compare to other regions in <strong>Indonesia</strong>, the NPL level was still<br />
below the NPL maximum limit stipulated by <strong>Bank</strong> <strong>Indonesia</strong>,<br />
i.e. at a maximum of 5%.<br />
When viewed by province, South Sulawesi is a province that is<br />
able to make the highest lending and collect the highest TPFs<br />
in Sulawesi, which amounted to IDR53 tn and IDR46 tn.<br />
Meanwhile, a province that managed to experience the<br />
highest loan and TPF growth was Gorontalo. In 2011, the<br />
Gorontalo loans grew by 33.8% (YoY), to IDR8.2 tn, while the<br />
TPFs grew by 41% (YoY), to IDR8.4 tn.<br />
Indicators 2006 2007 2008 2009 2010 2011<br />
TPF (IDR bn) 37,067 43,792 51,522 59,210 66,837 82,541<br />
TPF Growth (%) 29 18 18 15 13 23<br />
Loan (IDR bn) 29,574 38,024 49,735 59,751 75,708 95,682<br />
Loan Growth (%) 20 29 31 20 27 26<br />
LDR (%) 80 87 97 101 113 116<br />
NPL Nominal (IDR bn) 2,447 2,494 1,478 2,022 2,323 2,600<br />
NPL (%) 8.3 6.6 3.0 3.4 3.1 2.7<br />
Figure 26. Indicators of Commercial <strong>Bank</strong>ing Sulawesi. Performance of commercial banks in<br />
Sulawesi was improved when seen from the TPFs and loans that grew over 20%. However, the NPL<br />
level in Sulawesi region was the highest compared to other regions in <strong>Indonesia</strong>. In 2011, NPL in<br />
Sulawesi reached 2.7%. (Source: <strong>Bank</strong> <strong>Indonesia</strong>)<br />
The development of<br />
commercial banking<br />
from TPF and loan<br />
sides in Bali in 2011<br />
was still superior<br />
compared to NTT and<br />
NTB<br />
Bali - Nusa Tenggara (NT)<br />
The development of commercial banking from TPF and loan<br />
sides in Bali in 2011 was still superior compared to West Nusa<br />
Tenggara (NTB) and East Nusa Tenggara (NTT). TPFs and loans<br />
in Bali in 2011 reached IDR45.6 tn and IDR29.8 tn,<br />
respectively. However, TPFs in NTB grew higher than in Bali<br />
© Office of Chief Economist Page 35 of 68<br />
© Office of Chief Economist Page 35 of 68
© Office of Chief Economist Page 36 of 68<br />
Page 36 of 68<br />
and NTT, amounting to 28.3% (YoY), to IDR11 tn in 2011.<br />
Meanwhile, NTT had the highest loan growth compared to Bali<br />
and NTB. NTT loans grew 29.3% (YoY), to IDR10 tn in 2011.<br />
When viewed from bank lending by the type of use, Middle<br />
and Eastern regions of <strong>Indonesia</strong> primarily distributed them<br />
for consumer loans. In this case, consumer lending in Bali-NT<br />
in 2011 was relatively better than other regions in <strong>Indonesia</strong>.<br />
It can be seen from the NPL percentage of consumer loans in<br />
Bali-NT, which was the lowest compared to any other regions,<br />
at only 0.7%.<br />
Furthermore, Bali-NT offers the highest loan to the Trade,<br />
Hotel and Restaurant Sectors than any other regions in<br />
<strong>Indonesia</strong>. This is triggered by the rapid retail trade business in<br />
Bali, especially in Denpasar City and Tabanan District, which is<br />
affected by the development of new business areas and<br />
residential areas. It is also supported by the high tourism<br />
activities in Bali and the high growth in the construction of<br />
accommodation facilities, especially villa, as well as the<br />
business of food and beverage sectors.<br />
Indicators 2006 2007 2008 2009 2010 2011<br />
TPF (IDR bn) 30,099 36,220 42,892 48,467 56,529 69,231<br />
TPF Growth (%) 16 20 18 13 17 22<br />
Loan (IDR bn) 17,479 21,541 27,678 33,433 41,709 52,099<br />
Loan Growth (%) 15 23 28 21 25 25<br />
LDR (%) 58 59 65 69 74 75<br />
NPL Nominal (IDR bn) 595 613 461 831 795 811<br />
NPL (%) 3.4 2.8 1.7 2.5 1.9 1.6<br />
Figure 27. Indicators of Commercial <strong>Bank</strong>s in Bali-Nusa Tenggara. Development of commercial<br />
banking in this region was strongly influenced by the economic development in Bali. Meanwhile, the<br />
NPL rate of comercial banks in Bali-NT was relatively good and under 2%. (Source: <strong>Bank</strong> <strong>Indonesia</strong>)<br />
Credit growth in<br />
Maluku-Papua was at<br />
the highest level of<br />
29% (YoY)<br />
Maluku-Papua<br />
Development of commercial banking in Maluku-Papua in 2011<br />
was very fast compared to other regions in <strong>Indonesia</strong>. This was<br />
evident from the high loan growth in the region, reaching 29%<br />
(YoY), which is highest growth compared to other regions. In<br />
© Office of Chief Economist
the CAGR (2005-2011 period), the loan growth of this region<br />
was also at the highest level, reaching 35%. However, the<br />
nominal amount of loans and TPFs in this region was still the<br />
smallest compared to other regions, amounting to IDR23 tn<br />
and IDR42 tn.<br />
Lending by sector in this region was primarily for the Trade,<br />
Hotel and Restaurant Sectors, amounting to 26.4% of total<br />
lending. Meanwhile, the highest percentage of loans per<br />
sector compared to other regions was loans to the<br />
Construction Sector by 8% of total lending in 2011.<br />
In line with this, the TPF growth was also more than 20% (YoY)<br />
in 2011, reaching 24% (YoY), to IDR42 tn. However, the LDR<br />
level of Maluku-Papua was the lowest compared to other<br />
areas, i.e. only 55%. The LDR figure has increased significantly<br />
compared to 2006, which was only 26%. With the low LDR<br />
level, the number of NPL in the region was also at the smallest<br />
level, i.e. at 1.5% level.<br />
Indicators 2006 2007 2008 2009 2010 2011<br />
TPF (IDR bn) 21,273 24,771 26,782 29,452 33,741 41,801<br />
TPF Growth (%) 62 16 8 10 15 24<br />
Loan (IDR bn) 5,132 6,996 10,105 13,395 17,687 22,870<br />
Loan Growth (%) 36 36 44 33 32 29<br />
LDR (%) 24 28 38 45 52 55<br />
NPL Nominal (IDR bn) 105 136 188 235 264 353<br />
NPL (%) 2.0 1.9 1.9 1.8 1.5 1.5<br />
Figure 28. Indicators of Commercial <strong>Bank</strong>ing in Maluku-Papua. In nominal, the amount of loans and<br />
TPFs in Maluku-Papua was still at the smallest level compared to other regions, amounting to IDR23<br />
tn and IDR42 tn. LDR and NPL figures of the region were also at the smallest level, i.e. 55% and 1.5%,<br />
respectively, in 2011. (Source: <strong>Bank</strong> <strong>Indonesia</strong>)<br />
Conclusion<br />
From the discussion related to the development on the<br />
banking industry per region in <strong>Indonesia</strong>, conclusions can be<br />
drawn, among others:<br />
© Office of Chief Economist Page 37 of 68<br />
© Office of Chief Economist Page 37 of 68
Page 38 of 68<br />
1. Development of <strong>Indonesia</strong>’s banking system remained<br />
strong throughout the year 2011, despite of amidst the<br />
financial market turmoil due to the influence of the global<br />
economic downturn. It can be seen from the commercial<br />
bank loan growth in <strong>Indonesia</strong> regions, which was more<br />
than 20% (YoY) with a low NPL rate (2.17%).<br />
2. The increase in the banking industry was also evident from<br />
the improved loan to GDP ratio of national banks. If<br />
related to the role of banks in each province, the higher<br />
ratio of loan to GDRP could also show a rise for the better<br />
bank intermediary function. However, lending in a<br />
province is expected not only from the province itself, but<br />
also from the lending in other provinces.<br />
3. Concentration of the banking industry until 2011 was still<br />
in Java and Sumatra. Lending and TPF collection about 75%<br />
were in Java. <strong>Bank</strong>s are expected to take part in other<br />
regions by improving entrepreneurship programs in<br />
regions in order to improve the economy, especially in<br />
eastern <strong>Indonesia</strong>.<br />
4. <strong>Bank</strong>ing lending in <strong>Indonesia</strong> has a correlation with the<br />
major natural resources and regional potentials in<br />
<strong>Indonesia</strong>. The lending in several regions in <strong>Indonesia</strong> is<br />
also in line with the prices volatility of some commodities<br />
in international markets.<br />
5. Lending based on type of use in <strong>Indonesia</strong> was most widely<br />
distributed for working capital loans. However, the share<br />
of working capital loans was 48.6% in 2011, which<br />
decreased when compared to 2007, reaching 53% of total<br />
loans provided.<br />
6. The highest share of commercial bank lending by<br />
economic sector in 2011 was given to the Trade Sector of<br />
IDR405 tn. However, the share of loans to commercial<br />
sector decreased to 18.4% in 2011 from 21.6% in 2007 of<br />
the total loans.<br />
7. In Sumatra, North Sumatra became the largest lender and<br />
the largest TPF collector, which respectively reached<br />
IDR127 tn (36.5%) and IDR106 tn (37%) in 2011.<br />
8. In Java, Jakarta became the largest lender and the largest<br />
TPF collector, which respectively reached IDR1,080 tn<br />
(66.2%) and IDR1,417 tn (67.2%) in 2011.<br />
9. In Kalimantan, East Kalimantan became the largest lender<br />
and TPF collector, which respectively reached IDR41.9 tn<br />
(44.7%) and IDR66.9 tn (49.6%) in 2011.<br />
© Office of Chief Economist Page 38 of 68<br />
© Office of Chief Economist
10. In Sulawesi, South Sulawesi became the largest lender and<br />
TPF collector, which respectively reached IDR53.0 tn<br />
(55.5%) and IDR46.2 tn (56%) in 2011.<br />
11. In Bali-Nusa Tenggara, Bali became the largest lender and<br />
TPF collector, which respectively reached IDR29.7 tn<br />
(57.2%) and IDR45, 6 tn (65.9%) in 2011.<br />
12. In Maluku-Papua, Papua became the largest lender and<br />
TPF collector, which respectively reached IDR11 tn (48.2%)<br />
and IDR23.9 tn (57.3%) in 2011.<br />
© Office of Chief Economist Page 39 of 68<br />
© Office of Chief Economist Page 39 of 68
US EPA Statement About CPO “Failure”: Should We Worry?<br />
M. Ajie Maulendra (ajie.maulendra@bankmandiri.co.id)<br />
EPA studies show<br />
that biodiesel<br />
produced from<br />
palm oil cannot<br />
reduce greenhouse<br />
gas emissions in a<br />
minimum amount<br />
of 20% as required<br />
in the U.S.<br />
During the last 10<br />
years, <strong>Indonesia</strong>’s<br />
CPO export market<br />
share to the United<br />
States never<br />
exceeded 1%.<br />
EPA announcement<br />
In early 2012, the national oil palm industry had another less<br />
pleasant news to hear regarding impact of CPO (Crude Palm<br />
Oil) to environment. Although the national oil palm sector was<br />
several times battered by bad news related to environment,<br />
this case was a bit different because it came from the land of<br />
Uncle Sam. An agency in the United States (U.S.) engaged in<br />
the environment sector, namely EPA (Environmental<br />
Protection Agency) had issued an announcement related to its<br />
studies that biodiesel and renewable diesel produced from<br />
crude palm oil do not meet the environmentally friendly<br />
requirements. The EPA studies show that biodiesel produced<br />
from crude palm oil cannot reduce greenhouse gas emissions<br />
in a minimum amount of 20% as required in the U.S.<br />
These study findings have not become a trade regulation of<br />
the U.S. government and are still open in receiving any input<br />
from various parties, indeed. Even when the EPA study<br />
findings are approved as a regulation that limits the crude<br />
palm oil imports from <strong>Indonesia</strong>, we really do not need to<br />
worry. The U.S. is not an important market for <strong>Indonesia</strong>’s<br />
CPO exports, because during the last 10 years, <strong>Indonesia</strong>’s<br />
CPO export market share to the United States never exceeded<br />
1%. Compare to the CPO export market shares to India,<br />
amounting to 30%, to China amounting to 15% and to<br />
Netherlands amounting to 8%. These three countries have<br />
long been noted as main destinations of <strong>Indonesia</strong>’s CPO<br />
exports.<br />
In addition, if the findings of such studies are passed as a trade<br />
regulation of <strong>Indonesia</strong>’s CPO imports to the United States, all<br />
of imports will not be completely stopped because the U.S.<br />
still requires <strong>Indonesia</strong>’s CPO for food and household needs,<br />
because the EPA’s studies are limited to crude palm oil uses<br />
for biodiesel and fuel alternative energy.<br />
© Office of Chief Economist Page 40 of 68<br />
Page 40 of 68<br />
© Office of Chief Economist
10 16 14 27<br />
Reasons behind the action<br />
Afterwards, what is the United States’ background in issuing<br />
the announcement regarding the environmental impact of<br />
crude palm oil? The author assumes two things, namely it is<br />
purely due to environmental factors or is as a form of a<br />
regulation on the trade protection from the U.S. government.<br />
We begin with the environmentally friendly issues through a<br />
trend of biodiesel uses in the U.S. Biodiesel is seen as one<br />
alternative energy that is more environmentally friendly than<br />
petroleum so that modern countries begin to campaign<br />
biodiesel uses to reduce pollution and negative impacts to the<br />
environment. The U.S. itself through EPA has its own<br />
measures concerning biodiesel that can be used for fuel,<br />
which can reduce greenhouse gas emissions at a minimum of<br />
20%. When the studies conducted by EPA found that biodiesel<br />
produced from crude palm oil has failed to meet its<br />
requirements, CPO cannot be accepted in the United States to<br />
be produced as biodiesel.<br />
91<br />
261<br />
© Office of Chief Economist Page 41 of 68<br />
© Office of Chief Economist Page 41 of 68<br />
358<br />
316 317<br />
2001 2002 2003 2004 2005 2006 2007 2008 2009 2010 2011*<br />
Figure 29. Biodiesel Consumption in the US. At the beginning of 2005, the consumption of biodiesel<br />
began to increase dramatically and peaked at 358 million gallons in 2007. The consumption slowed<br />
down in 2010 due to the U.S. economic slowdown and the discontinuation of a Federal biodiesel<br />
producer tax credit. The credit, which expired in December 2009, was reinstated in December 2010<br />
and therefore with the recovering economy spurring back biodiesel consumption in the U.S. (Source:<br />
EIA, US Department Energy)<br />
229<br />
665
As a comparison, in<br />
a year, 3.7 tons / ha<br />
of CPO can be<br />
produced, while<br />
soybean oil’s<br />
production is only<br />
0.4 tons / ha (a<br />
study of the Oil<br />
World).<br />
Others/Anim<br />
al Fats<br />
39%<br />
PKO&CNO<br />
6%<br />
© Office of Chief Economist Page 42 of 68<br />
Page 42 of 68<br />
Soya Oil<br />
20%<br />
Sun Oil<br />
10% Rape Oil<br />
11%<br />
The second issue is about international trade protection<br />
policies. Biodiesel uses in the U.S. will continue to increase in<br />
the future, meaning the need for vegetable oil as a raw<br />
material for biodiesel would be even higher. Vegetable oil in<br />
the U.S. that is currently used to make biodiesel is soybean oil<br />
because the U.S. is known as the world’s largest soybean<br />
producing countries.<br />
However, the presence of soybean oil as a raw material for<br />
biodiesel is potentially replaced by CPO because CPO price is<br />
cheaper than soybean oil. The historical data (during 2005-<br />
2011) show that the CPO price in average is lower about 20%<br />
than soybean oil price. This condition, is caused by the CPO’s<br />
productivity that is much higher than the soybean oil’s. As a<br />
comparison, in a year, 3.7 tons / ha of CPO can be produced,<br />
while soybean oil’s production is only 0.4 tons / ha (a study of<br />
the Oil World). Based on these facts, it seems reasonable for<br />
the U.S. if it tends to begin to make soybean farming<br />
protection in its country because of fear in competing with<br />
CPO.<br />
Palm Oil<br />
14%<br />
World Vegetable Oil Consumption<br />
PKO&CNO<br />
5%<br />
Sun Oil<br />
7%<br />
Others/Anim<br />
al Fats<br />
24%<br />
Rape Oil<br />
13%<br />
Soya Oil<br />
24%<br />
Palm Oil<br />
27%<br />
Figure 30. Palm Oil as the most competitive vegetable oil. Cheaper price and more productive plant<br />
compared to other oilseeds make CPO become the most consumed vegetable oil in the world today.<br />
(Source: Oil World)<br />
The U.S. is currently importing crude palm oil from Malaysia<br />
and <strong>Indonesia</strong>, although the crude palm oil consumption share<br />
in the U.S. is still small compared to soybean oil but it is<br />
expected to continue to increase in the future in line with the<br />
biodiesel needs.<br />
© Office of Chief Economist
<strong>Indonesia</strong> and<br />
Malaysia should be<br />
able to make<br />
counter arguments<br />
by other studies that<br />
are more<br />
comprehensive and<br />
support that<br />
biodiesel production<br />
from crude palm oil<br />
does not relevant<br />
with those proposed<br />
by EPA.<br />
1.5<br />
Millions<br />
0.4<br />
1.8<br />
Export CPO to India<br />
Export CPO to China<br />
0.5<br />
2.3<br />
Indeed, the reasons underlying the EPA announcement is still<br />
ambiguous, if it is purely related to the environment,<br />
<strong>Indonesia</strong> and Malaysia should be able to make counter<br />
arguments by other studies that are more comprehensive and<br />
support that biodiesel production from crude palm oil does<br />
not relevant with those proposed by EPA. When the findings<br />
of the counter study are contrary to the EPA announcement,<br />
the problem maybe settled at that point. Nevertheless, if in<br />
fact the reason is for trade protection, the discussion can be<br />
difficult because there will be some of non-economic factors<br />
and non-environmental factors playing there. However, if<br />
trade protection is the background, <strong>Indonesia</strong> would not need<br />
to worry thinking about the economic impacts.<br />
0.8<br />
2.8<br />
1.1<br />
2.6<br />
1.4<br />
2001 2002 2003 2004 2005 2006 2007 2008 2009 2010<br />
Figure 31. <strong>Indonesia</strong>’s CPO exports to China and India. CPO exports to China and India, i.e. the<br />
biggest markets of <strong>Indonesia</strong>’s CPO, have shown an increasing trend for 10 years. Since 2001,<br />
<strong>Indonesia</strong>’s CPO Export to China has grown by 22% in average, while to India by 15% in average.<br />
(Source: International Trade Statistics)<br />
Don’t worry, be confident<br />
Some say that the government worries that the U.S. trade<br />
protection efforts can be extended to other countries<br />
(including <strong>Indonesia</strong> CPO’s biggest markets, i.e. China and<br />
India), meaning other countries will also limit the crude palm<br />
oil imports from <strong>Indonesia</strong> due to environmental issues. It<br />
© Office of Chief Economist Page 43 of 68<br />
© Office of Chief Economist Page 43 of 68<br />
2.5<br />
1.8<br />
3.3<br />
1.4<br />
4.8<br />
1.8<br />
5.5<br />
2.6<br />
5.3<br />
2.2
So far, India and<br />
China seem to<br />
ignore the CPO<br />
negative issues<br />
against<br />
environment; it is<br />
evidenced by the<br />
volume of their<br />
crude palm oil<br />
imports from<br />
<strong>Indonesia</strong>, which<br />
continue to grow.<br />
The studies<br />
conducted by EPA<br />
would seem fairer if<br />
a comprehensive<br />
comparison against<br />
all vegetable oils<br />
(including soybean<br />
oil) is made, in order<br />
not to seem to<br />
marginalize CPO<br />
producing countries.<br />
© Office of Chief Economist Page 44 of 68<br />
Page 44 of 68<br />
seems that the same unlikely happens. So far, India and China<br />
seem to ignore the CPO negative issues against environment;<br />
it is evidenced by the volume of their crude palm oil imports<br />
from <strong>Indonesia</strong>, which continue to grow. It is only Europe that<br />
has made the similar issue, but in fact the CPO trade with<br />
them continues to run normally until now.<br />
In addition, the government is currently prepared to prove<br />
that CPO is environmentally friendly through the <strong>Indonesia</strong>n<br />
Sustainable Palm Oil (ISPO), which is a certification that must<br />
be acquired by national plantation and palm oil processing<br />
companies. The set of facts should not necessarily make<br />
<strong>Indonesia</strong> desperate by the U.S. trade protection possibility.<br />
For the author, a thing to be considered from the EPA<br />
announcement is a matter of fairness related to the research<br />
findings that seem to marginalize CPO producing countries.<br />
The studies conducted by EPA would seem fairer if a<br />
comprehensive comparison against all vegetable oils<br />
(including soybean oil) is made, in order not to seem to<br />
marginalize CPO producing countries. A valuable lesson to<br />
learn from this incident is the government and the related<br />
parties should continue to socialize at the international level<br />
and the fact implementation as well as the international<br />
standard regulation that the CPO production practices do not<br />
conflict with the environmentally friendly principles. Thus, we<br />
have a counter attack against negative issues on trade political<br />
atmosphere. Another valuable lesson is quite related to the<br />
author’s assumption to the U.S. government’s attitude to do<br />
protection amidst the free trade era. The protectionism is<br />
exemplary because it reflects high nationalism and it is not<br />
eroded by trade liberalization jargons.<br />
© Office of Chief Economist
Coal Market 2012: Future Remains Bright<br />
Ahmad Subhan (ahmad.subhan@bankmandiri.co.id)<br />
The global demand<br />
for coal is marked<br />
by uncertainty. The<br />
coal demand will<br />
be in line with GDP<br />
growth<br />
The global outlook for coal demand and supply in 2012 is marked by<br />
uncertainty. From the demand side, recovery from financial crisis<br />
has been fragile in many countries, casting doubt on future growth<br />
rates. The economic uncertainty in some region such as US and<br />
Europe make it difficult to predict coal demand over the shortmedium<br />
term but is certain that the growth in developing countries<br />
– lead by China and India – will lead demand growth in recent years.<br />
Power generation for electricity is the largest end user of coal, as<br />
electricity demand is closely correlated with economic growth, so, is<br />
coal demand will be in line with GDP growth. The economic<br />
recession in 2009 affected electricity demand all over the world,<br />
which led to a stagnation in global coal consumption for the first<br />
time in the past decade. Nevertheless, the concentration of coal<br />
demand in 10 ten importers developing countries and its<br />
importance in fast growing emerging markets was helped the global<br />
demand: while global oil and gas consumption fell measurably in<br />
2009, the consumption of coal only stagnated.<br />
Coal is the second most important primary energy source behind oil.<br />
Throughout the past decade hard coal consumption increased by<br />
more than 70% from 3 700 mn ton (Mt) in 2000 to an estimated 6.3<br />
bn ton in 2010. This boost in coal demand corresponds to rising coal<br />
usage, which currently amounts to approximately 720 000 ton every<br />
day. Despite strong growth from renewable energy, coal will<br />
continue dominate the market for next decades.<br />
© Office of Chief Economist Page 45 of 68<br />
© Office of Chief Economist Page 45 of 68
Figure 32. Developing Countries Will Lead The Global Demand ; The GDP growth in the top 10 coal<br />
importers will be stabilize in 6-8% pa for next decades. Now coal is the second most important<br />
primary energy source, but in the next 5 year coal will be replaced oil position to be the first one.<br />
(Source: Wood Mackenzie Coal Market Service – Jan 2012)<br />
The global demand<br />
for coal is forecast<br />
to slow 4.2% pa in<br />
2012-13. The<br />
worsened outlook<br />
for the EU and the<br />
US has not had a<br />
substantial impact<br />
on forecasts for<br />
China and India<br />
China imported 182<br />
million ton of coal in<br />
the whole of 2011<br />
and for 2012 china<br />
coal import will be<br />
flat in 9.8% or 200<br />
million ton of coal<br />
EIU’s monthly coal outlook (Jan 2012) said, the global demand for<br />
coal is forecast to slow to an average of 4.2% pa in 2012-13, down<br />
from an estimated 5.4% in 2011. Demand growth will ease in 2012<br />
as the global economy slows, before picking up moderately in 2013.<br />
The worsened outlook for the EU and the US has not had a<br />
substantial impact on forecasts for China and India. China will<br />
continue to provide by far the largest spur to coal demand during<br />
the period (although efforts to curtail emissions are likely to have<br />
some impact). India will be another important driver of demand, as<br />
it continues to pursue its rural electrification plans. Demand in the<br />
EU is forecast to ease in 2012, owing to a sharp deterioration in<br />
economic performance in the euro zone, meanwhile the US<br />
consumption is also forecast to drop in 2012, owing to the<br />
increasing use of natural gas in electricity generation and as the<br />
economy slows in that year.<br />
China Coal Market: Key Driver for the Next 5 Years<br />
The moderate projection of coal demand will be impact the global<br />
coal market, China imported 182 mn ton of coal in the whole of<br />
2011, up 10.8% from the previous year, according to sources from<br />
the National Development and Reform Commission. And for 2012<br />
many players believe the china coal import will be flat in 9.8% or<br />
200 mn ton of coal.<br />
© Office of Chief Economist Page 46 of 68<br />
Page 46 of 68<br />
© Office of Chief Economist
The demand for coal<br />
in China in 2011 was<br />
boosted by the<br />
decline in<br />
hydropower<br />
generation. In 2012<br />
the increase in<br />
thermal power<br />
generation for 2012<br />
will be growth at a<br />
6.9% YoY<br />
In the supply side, the China’s minor imbalance in domestic market<br />
would impact the rest of global supply side. China’s share in global<br />
coal production is almost 44.8% or four times that of Saudi Arabia’s<br />
production of oil. Its, the China’s domestic coal market is more than<br />
three times the entire international coal trade. Therefore, any<br />
imbalance between Chinese production and demand has the ability<br />
to have a large impact on global coal trade and price.<br />
If we took a look closer what happen the coal market in China we<br />
will find the fact after a strong year in 2011, China’s coal demand to<br />
see slower growth in 2012 and 2013. China’s exports are slowing<br />
down given the problems in other economies, such as the debt crisis<br />
in Europe and slow recovery of the US. The demand for coal in<br />
China in 2011 was boosted by the decline in hydropower generation<br />
(down 7.8% YoY in 11M11) given the draught in major hydropower<br />
provinces. More thermal power has been generated to make up the<br />
shortfall, resulting in a 14.7% YoY increase in thermal power<br />
generation in 11M11. It remains to be seen whether the abnormally<br />
dry weather will recur in 2012.<br />
The slower projection of economic growth in 2012 and assuming a<br />
12% increase in the utilization of hydropower generation capacity,<br />
the increase in thermal power generation for 2012 will be growth at<br />
a 6.9% YoY, down from 9.6% YoY increase from last record.<br />
Together with other minor changes in the output growth forecasts<br />
of its key downstream industries, the demand growth for coal in<br />
China will be correction from 7.6% YoY in 2011 to 6.0% for 2012 and<br />
expect the demand growth to further slow to 5.8% YoY in 2013.<br />
Annual Power Generation 2009 2010 2011e 2012e 2013e<br />
Total PowerGeneration(bn kWH) 3.497,8 4.206,5 4.701,1 5.114,3 5.553,1<br />
YoY (%) 7,1% 20,3% 11,8% 8,8% 8,6%<br />
Thermal (bn kWH) 2.981,4 3.330,1 3.790,1 4.051,7 4.345,6<br />
YoY (%) 7,2% 11,7% 13,8% 6,9% 7,3%<br />
Hydro (bn kWH) 554,5 721,0 712,4 797,9 860,1<br />
YoY (%) 4,4% 30,0% -1,2% 12,0% 7,8%<br />
Nuclear(bn kWH) 69,3 73,9 86,8 103,5 140,0<br />
YoY (%) 1,3% 6,6% 17,5% 19,2% 35,3%<br />
Wind(bn kWH) 26,9 51,0 75,4 101,8 122,2<br />
YoY (%) 105,9% 89,6% 47,8% 35,0% 20,0%<br />
Biomass & Solar(bn kWH) 30,5 42,4 61,0 85,2<br />
YoY(%) 39,0% 43,9% 39,7%<br />
Figure 33. China’s Source of Power Generation. The growth in China’s coal demand will be decrease<br />
from 9.4% YoY in 2011 to 6.0% YoY in 2012 and further to 5.8% YoY in 2013 amid slower thermal<br />
power generation growth. But in term of volume thermal coal still dominate with portion more than<br />
80%. (Source: NBS, BOCI Research estimates)<br />
© Office of Chief Economist Page 47 of 68<br />
© Office of Chief Economist Page 47 of 68
In the supply side,<br />
China’s raw coal output<br />
increase 6.7% YoY in<br />
2012 and then 8.4% YoY<br />
in 2013, about 47% and<br />
37% of additional<br />
output in 2012 and<br />
2013 come from Shanxi<br />
Province, Shaanxi<br />
Province and Western<br />
Inner Mongolia<br />
Growth in China’s Coal Demand and<br />
Output<br />
© Office of Chief Economist Page 48 of 68<br />
Page 48 of 68<br />
In the supply side, China’s raw coal output grew 10.7% YoY to<br />
3.78bn tonnes in 2011, and it will be expect to increase 6.7% YoY in<br />
2012 and then 8.4% YoY in 2013. The projections are based mainly<br />
on new capacity to be completed based on the information<br />
collected from various companies and sources. With the based on<br />
forecasts, China’s coal output will still fall short of demand in 2012,<br />
but the deficit will narrow. However, there have always been delays<br />
about 60% of the new capacity that originally expected to be<br />
completed in 2012.<br />
<strong>Bank</strong> of China Investment Group, estimate about 47% and 37% of<br />
additional output in 2012 and 2013 to come from Shanxi Province,<br />
Shaanxi Province and Western Inner Mongolia, the key production<br />
bases of higher quality thermal coal in China. The others 19% and<br />
23% of additional coal production in 2012 and 2013 to come from<br />
eastern Inner Mongolia, the key production base of lignite. The coal<br />
produced there cannot be used in most power plants. About 12%<br />
and 15% of new coal production capacity to be completed in 2012<br />
and 2013 should come from Xinjiang Autonomous Region, which is<br />
too far from the main market in coastal areas. Hence, the domestic<br />
supply of quality thermal coal should remain relatively short.<br />
2012e 2013e<br />
Increase in coal demand (m tonnes) 231 237<br />
Capacity of mines (m tpa)<br />
in which :<br />
354 397<br />
in eastern Inner Mongolia 114 119<br />
in Xinjiang Autonomous Region 44 58<br />
Increase in coal output (m tonnes)<br />
in which<br />
in Shanxi, Shaanxi and western Inner<br />
255 338<br />
Mongolia 119 338<br />
Total coal demand (m tonnes) 4069 4307<br />
Total coal output (m tonnes) 4035 4373<br />
Growth in China’s Coal Import<br />
Figure 34. China Coal Balance and Imports. 47% and 37% of additional output in 2012 and 2013 to<br />
come from Shanxi Province, Shaanxi Province and Western Inner Mongolia. China will be dominate<br />
the pacific market accounting nearly 50% of the Pacific total 2030. (Source: BOCI Research estimates<br />
and Wood Mackenzie Coal Market Service – Jan 2012)<br />
© Office of Chief Economist
The progress in<br />
upgrading small<br />
mines in Shanxi<br />
Province face many<br />
problem: lack of<br />
funding, problems<br />
with consolidated<br />
mines, higher<br />
priority on safety<br />
and troublesome<br />
procedure<br />
The others issue<br />
related output gap in<br />
domestic coal<br />
market is the<br />
bottleneck in railway<br />
capacity for<br />
domestic coal supply<br />
until the completion<br />
of Central Southern<br />
Shanxi Railway in<br />
2014<br />
However, the progress in upgrading small mines in Shanxi Province<br />
as crucial part of the coal industry consolidation launched in mid-<br />
2009, has been far slower than expected. For instance, the technical<br />
upgrades of six mines with total capacity of 3.9m tpa of Lu’an<br />
Environmental Energy have been delayed by at least one year to<br />
2013 at the earliest. There are a few key problems:<br />
Lack of funding. Most of the consolidated mines are not whollyowned<br />
by the state-owned big coal mining groups. The cost of<br />
loans of these mines is usually 20% above the benchmark rates and<br />
these loans require guarantees. As the big coal mining groups<br />
reckon the cost of debt is too high and they are not willing to<br />
guarantee the loans as guaranteeing too much will jeopardize their<br />
own credit ratings.<br />
Problems with consolidated mines. Typical problems include overstatement<br />
of reserves or coal quality of the consolidated mines.<br />
Some sellers of small mines even made up false financial<br />
statements to hide liabilities. They then escaped after receiving<br />
money by selling some of the stakes in the mines. The big coal<br />
mining groups not only have to pay the hidden debts, the absence<br />
of a stakeholder makes it difficult to go ahead with the required<br />
legal procedure.<br />
Higher priority on safety. After the coal mine accident at a mine of<br />
China National Coal Group in September 2011, Shanxi provincial<br />
government has given higher priority to safety. The construction of<br />
some mines has slowed down for safety reasons.<br />
Troublesome procedure. It takes 36 approvals from various<br />
government departments for a mine expanded from consolidated<br />
small mines through technical upgrade to start production. The<br />
lengthy approval process has slowed down the overall process.<br />
The others issue related with output gap in domestic coal market is<br />
the bottleneck in railway capacity for domestic coal supply. The<br />
capacity of coal-carrying railways has been tight in recent years, and<br />
this should persist in 2012. Among the major coal-carrying railways<br />
from key production bases to the main market along the coast,<br />
total increase of capacity only 64m tonnes. This includes a 20m<br />
tonnes increase for both Daqin Railway and Shenshuohuang<br />
Railway, 14m tonnes for Taiyuan-Shijiazhuang Railway and 10m<br />
tonnes for Houma-Yueshan Railway. The railway bottleneck will<br />
remain until the completion of Central Southern Shanxi Railway in<br />
2014. The recent scaling back of railway investment will only result<br />
in possible delays in completion. The railway capacity constraints<br />
© Office of Chief Economist Page 49 of 68<br />
© Office of Chief Economist Page 49 of 68
Page 50 of 68<br />
will continue to limit effective domestic coal supply, thus supporting<br />
the domestic coal price.<br />
China’s Major Coal-Carrying Railways<br />
Expected Increase in Capacity of Major Coal-Carrying Railways<br />
Figure 35. China Coal Carrying Railways. The railway bottleneck will be constraint until the<br />
completion of Central Southern Shanxi Railway in 2014. The railway capacity will continue to limit<br />
effective domestic coal supply, thus supporting the domestic coal price. (Source: BOCI Research<br />
estimates)<br />
EIA calculated in the coming years, the Chinese coal industry will<br />
face several major challenges in meeting its growing demand for<br />
coal. First, new mines will need to be developed and production<br />
increased in existing collieries (coal mines, including all buildings<br />
and equipment). Second, congested domestic transport<br />
infrastructure will require expansion and improvements to ship<br />
additional coal from production centres to demand hubs. Some new<br />
mines are located very far from major industrial cities, which will<br />
inevitably lead to transportation challenges. Third, productivity and<br />
efficiency gains must be achieved to keep coal affordable for<br />
consumers. Finally, as China aims to reduce the environmental<br />
impact of its coal consumption, significant investments will be<br />
needed for upgrading power plants. Chinese authorities are<br />
© Office of Chief Economist Page 50 of 68<br />
© Office of Chief Economist
In the LPS, Chinese<br />
hard coal imports<br />
to almost double<br />
from 92 Mtce in<br />
2010 to 180 Mtce<br />
in 2016. In the HPS,<br />
hard coal imports<br />
to drop by 58%<br />
from 92 Mtce in<br />
2010 to 39 Mtce in<br />
2016.<br />
currently in the process of restructuring and consolidating the coal<br />
mining industry and have ambitious plans to ramp-up nuclear and<br />
renewable electricity production. The development of coal<br />
production, and hence the future level of Chinese imports, is<br />
dependent on how fast this reorganization takes place and when<br />
investments are made.<br />
Due to these unknowns, EIA have made two possible scenarios, One<br />
scenario assumes that Chinese coal production and infrastructure<br />
expansion can’t keep up with domestic coal demand. This scenario<br />
referred to as the low Chinese production scenario (LPS-low<br />
production scenario), assumes a continued strong demand for<br />
imported hard coal. The other scenario, referred to as the high<br />
Chinese production scenario (HPS-high production scenario),<br />
assumes that Chinese coal production increases at higher rates<br />
during the outlook period. As a consequence, Chinese imports<br />
demand will be lower.<br />
Figure 36. LPS and HPS Scenario. In the LPS, Chinese hard coal imports almost double from 92 Mtce<br />
in 2010 to 180 Mtce in 2016. In the HPS, Chinese hard coal imports to drop by 58% from 92 Mtce in<br />
2010 to 39 Mtce in 2016. (Source: EIA, Medium-Term Coal Market Report 2011)<br />
In the LPS, Chinese hard coal production grows from 2,399 Mtce in<br />
2010 to 2,913 Mtce in 2016. This production level causes Chinese<br />
hard coal imports to almost double from 92 Mtce in 2010 to 180<br />
Mtce in 2016. In the HPS, Chinese production grows to 3,054 Mtce<br />
in 2016. This production level causes Chinese hard coal imports to<br />
drop by 58% from 92 Mtce in 2010 to 39 Mtce in 2016.<br />
The difference in Chinese seaborne imports, which reaches its<br />
maximum of 141 Mtce in 2016, has various implications for<br />
© Office of Chief Economist Page 51 of 68<br />
© Office of Chief Economist Page 51 of 68
As power plants<br />
commencing this<br />
year are expected<br />
to operate fully by<br />
next year,<br />
<strong>Indonesia</strong>’s<br />
domestic coal<br />
consumption could<br />
grow by 12% to<br />
83Mt in 2012<br />
© Office of Chief Economist Page 52 of 68<br />
Page 52 of 68<br />
seaborne hard coal trade. High imports (LPS) tighten the seaborne<br />
hard coal market and call for suppliers world-wide. Compared to<br />
the HPS, which results in lower imports, the utilization of export<br />
mining and infrastructure capacity is higher on a global scale. Given<br />
a tight market situation with high Chinese imports, several suppliers<br />
provide higher volumes than they would with lower Chinese<br />
imports.<br />
<strong>Indonesia</strong> Coal Market: Still Waiting Use of Coal Power<br />
In early 2006, PT Perusahaan Listrik Negara (Persero) (PLN) had<br />
assignment to build coal-fired power plants in 35 locations in<br />
<strong>Indonesia</strong>. They include 10 power plants (7,360MW) on the islands<br />
of Java and Bali, and the others (2,502MW) are constructed on<br />
outside Java and Bali. In first plan completion of the project, which<br />
is known as the first-generation 10,000MW project, was scheduled<br />
for 2010-12. But until the end of 2011 only four projects on Java<br />
Island and one project in southwest Sulawesi, with a total capacity<br />
of 2,895MW, have been fully operated. Another on Java has been<br />
partially commissioned. Delays in financing as well as constructionrelated<br />
problems (such as land acquisition) have been the main<br />
problem. Power projects in Java and Bali are, on average, 8 months<br />
behind schedule, while the delays on the other islands are even<br />
more severe is around 12-18 month. Despite the initial setback, 10<br />
power plant projects to be ready this year. All will be located in Java<br />
and Bali. These will have total electricity output of 2,347MW.<br />
Progress on the 10,000MW first phase of generation, as of 30 Sept<br />
2011:<br />
• 2,245 MW is already in operation, with an additional 1,260 MW<br />
coming by the end of year. This will translate to about 12.3mn<br />
metric tonnes of coal that will be kept domestically in FY12E.<br />
• 2,305 MW will come on stream in FY12E; additional 8mn metric<br />
tonnes in FY13E<br />
• 1,710 MW coming in FY13E-FY14E; additional 6mn metric<br />
tonnes in FY14E –FY15E.<br />
• Including phase 2 – 12,600 MW of coal -generating capacity –<br />
44.1mn metric tonnes of domestic demand.<br />
With the power plant projects coming online and additional<br />
demand from others sector, domestic coal consumption to grow by<br />
10.4% YoY in 2011 to 74Mt (from around 67Mt in 2010). As power<br />
plants commencing this year are expected to operate fully by next<br />
year, <strong>Indonesia</strong>’s domestic coal consumption could grow by 12% to<br />
83Mt in 2012, about in line with DMO figure of 82Mt.<br />
© Office of Chief Economist
Figure 37. Progress of Fast Track I 10000 MW. As 2,875MW of power generation capacity comes on<br />
stream in FY11E, the increase in power generating capacity could translate into additional 10mn<br />
metric tonnes of coal demand; plus additional 2mn metric tonnes of demand from new power plants<br />
coming on stream in FY12E. (Source: JP Morgan - PLN)<br />
Newly developed<br />
deposits are often<br />
located farther away<br />
from existing<br />
infrastructure<br />
require substantial<br />
complementary<br />
investments into<br />
port and railway<br />
capacities<br />
Ramped up <strong>Indonesia</strong>n coal production has accounted for much of<br />
the growth in global coal supplies in recent years. However, there is<br />
persistent uncertainty about the operating environment,<br />
particularly in term of infrastructure availability.<br />
Newly developed deposits are often located farther away from<br />
existing infrastructure and thus require substantial complementary<br />
investments into port and railway capacities. Projects in mature<br />
mining regions often experience deterioration of product qualities<br />
or mining conditions. These factors put fundamental upward<br />
pressure on future infrastructure availability. A major problem in<br />
coal supply chain investment is the involvement of various<br />
stakeholders with differing objectives. In the past, this has caused<br />
situations where supporting or complementing investments, e.g.<br />
into railway lines or port capacities were not synchronized and<br />
coordinated with mining investments, resulting in temporary<br />
overcapacities or bottlenecks along the supply chain.<br />
© Office of Chief Economist Page 53 of 68<br />
© Office of Chief Economist Page 53 of 68
<strong>Indonesia</strong> coal<br />
production may<br />
reach 380 million<br />
tonnes in 2012 or<br />
14.4% higher than<br />
the Energy and<br />
Mineral Resources<br />
Ministry production<br />
target of 332 million<br />
tonnes<br />
183.9<br />
196.0<br />
© Office of Chief Economist Page 54 of 68<br />
Page 54 of 68<br />
201.1<br />
234.3<br />
According to the <strong>Indonesia</strong>n Coal Mining Association, <strong>Indonesia</strong> coal<br />
production may reach 380 mn tonnes in 2012 or 14.4% higher than<br />
the Energy and Mineral Resources Ministry production target of 332<br />
mn tonnes. They believe the estimate production was reasonable<br />
since last year's production had already reached almost 360 mn<br />
tonnes. The government's target was lower than the association's<br />
estimates because the government did not take into account small<br />
mining companies. For 2012 The Ministry of Energy and Mineral<br />
Resources only targeted 332 mn tonnes of national coal production,<br />
a 1.52% increase from last year’s 327 mn ton target. The targeted<br />
increase is small, due to domestic coal supply problems caused by<br />
delays in power plant constructions this year. Director General of<br />
Mineral and Coal at the Ministry of Energy, summoned all domestic<br />
coal users to know the volume of their coal needs. In the near<br />
future, the Ministry will also summon coal producers to urge them<br />
to fulfill domestic coal demand. For this year they expect domestic<br />
demand to reach about 82 mn tonnes and export at 250 mn tonnes.<br />
291.2<br />
312.1<br />
367.7<br />
2006 2007 2008 2009 2010 2011 2012E<br />
Figure 38. <strong>Indonesia</strong> Coal Exports and DMO Alocation. The growth of coal exports in 2012 will be<br />
reach 367.68 million tones or up by 17.8% from 312,13 million tonnes in 2011. Electricity demand<br />
still dominated DMO allocation for 2012 (Source: Director General of Mineral and Coal at the<br />
Ministry of Energy)<br />
Although domestic coal demand continues to grow, we believe the<br />
consumption still below the allocation of DMO (domestic market<br />
obligation) this year which reach 82.07 mn tonnes. This condition is<br />
based on several factors first: The achievement of domestic coal<br />
consumption in 2011 only 67 mn tonnes (85% of the DMO allocation<br />
78.9 mn tones), which means a surplus of 12 mn tonnes. Second:<br />
additional targets PLN coal usage- as the largest consumer<br />
© Office of Chief Economist
Assuming the<br />
proportion of<br />
domestic demand<br />
still 85% from<br />
DMO allocation<br />
the volume for<br />
export market will<br />
be reach 367.68<br />
million tonnes.<br />
Since Nov-11 coal<br />
market finally hits by<br />
economic slowdown.<br />
For 2012 the price<br />
will be 118/tonnes.<br />
The price will be<br />
recover to USD<br />
127.5/tonnes in 2013<br />
dosmestik - is expected to rise only 8-10 mn tonnes to 39.6 mn<br />
tonnes while the DMO allocation to PLN reaches more than 57.2 mn<br />
tonnes. Third: from the supply side; the company must face the<br />
problem spread of the mine site, the quality and volume of coal is<br />
less as needed, until the domestic pricing.<br />
To date only 63 mining companies are required to supply coal to<br />
domestic consumers. DMO's largest quota this year assigned to PT<br />
Bumi Resources Tbk (Bumi), the nation's largest coal producer,<br />
which is 19.27 mn tonnes, or approximately 23.47% of total DMO.<br />
PT Adaro <strong>Indonesia</strong>, a subsidiary of PT Adaro Energy Tbk (ADRO),<br />
are required to supply 11.74 mn tonnes for domestic and PT Kideco<br />
Jaya Agung, a subsidiary of PT Indika Energy Tbk (INDY) to supply<br />
8.03 mn tonnes. Assuming the proportion of domestic demand still<br />
same with last year (85% from DMO allocation) the volume for<br />
export market will be reach 367.68 mn tones or up by 17.8% from<br />
312,13 mn tonnes in 2011.<br />
As the one world’s prime exporter of thermal coal, <strong>Indonesia</strong> needs<br />
to further study a plan to ban the sale of lower-quality coal from<br />
2014. Until now the government hasn’t set a target for when the<br />
ban will be applied or which type of coal it will affect because it is<br />
seeking feedback from miners. The ministry has drafted a decree to<br />
prohibit the sale of coal with a heating value of less than 5,700 kilo<br />
calories a kilogram to overseas markets, where miners will have to<br />
upgrade the heating value of the fuel if they want to ship it. The<br />
government may wait until technology for upgrading low-rank coal<br />
into higher-grade fuel is widely available before applying the ban.<br />
<strong>Indonesia</strong> has an estimated 61.3 bn tonnes of coal reserves, of<br />
which 65 percent is low-rank, according to the <strong>Indonesia</strong>n Coal<br />
Mining Association.<br />
The Price: Short Term Correction<br />
Thermal coal prices rose sharply in the first quarter of 2011, to an<br />
average of USD129/tonnes (their highest level since the third<br />
quarter of 2008), owing to concerns about supply from Australia<br />
following severe flooding in Queensland and sustained strength in<br />
consumption. The early and severe start to winter in the northern<br />
hemisphere offered further support to prices, as did the prospect of<br />
reduced nuclear power in Japan and a switch to coal-fired<br />
electricity. Prices eased somewhat in the second quarter, to<br />
USD120/tonnes, as coal participated in the sell-off in commodities<br />
in May. Despite the deteriorating global economic picture and falls<br />
in other commodity prices, coal prices held up, averaging<br />
USD120.6/tonnes in the third quarter of 2011. However, after<br />
holding up well at USD120 per ton levels in 3Q11, the spot coal<br />
© Office of Chief Economist Page 55 of 68<br />
© Office of Chief Economist Page 55 of 68
Page 56 of 68<br />
prices in November have started to reflect market weakness, falling<br />
to USD113-114/tonnes. The forward curve for future prices has also<br />
shifted to reflect negative market expectations for 2012. Recent<br />
price movements show the economic slowdown finally hits the coal<br />
market. For 2012 consensus price for thermal coal will be<br />
weakening down 3.1% from contract average price 2011’s of<br />
USD121.8/tonnes, the price level for 2012 to be around<br />
USD118/tonnes. The price will be recover to USD127.5/tonnes in<br />
2013 as affected that demand from key importers such as China and<br />
India should remain robust while import from North Asia (Japan,<br />
South Korea, Taiwan) should remain steady.<br />
Figure 39. Coal Price Outlook 2012. Coal price will be relatively softening landing in 2012 (3.1%) and<br />
a recovery in 2013 (8.0%). In medium term IEA coal price in Asia will rise from USD127 a ton in 2011<br />
to USD138 a ton by 2016. (Source: Bloomberg)<br />
In the medium term the IEA forecast average thermal coal price in<br />
Asia will rise from USD127 a ton in 2011 to USD138 a ton by 2016.<br />
This is well above the USD40-USD80 level of the early 2000s, but is<br />
below the record USD200 a ton level hit in 2008. The International<br />
Energy Agency said the general positive trend for thermal coal<br />
prices over the next five years will be supported by mining<br />
companies struggling hard to expand their output quickly enough to<br />
meet the demand, particularly from Asia.<br />
© Office of Chief Economist Page 56 of 68<br />
© Office of Chief Economist
Property Sector (Apartment) Outlook in 2012<br />
Sindi Paramita (sindi.paramita@bankmandiri.co.id)<br />
Positive<br />
development of<br />
the property<br />
sector is expected<br />
to continue in<br />
2012.<br />
<strong>Indonesia</strong> property sector in 2011 showed a positive trend. This is<br />
supported by solid domestic economic fundamentals, continuously<br />
increasing demand, supported by growing sources of financing.<br />
Development of the property sector is expected to continue in<br />
2012. In 2012 the developers are starting to add the property<br />
projects, including residential such as apartments along with better<br />
economic conditions and increasing purchasing power.<br />
Based on the selling price, apartment can be divided into five<br />
segments, namely lower, middle, upper-middle, upper, and luxury.<br />
Meanwhile, based on the purposes, apartment can be categorized<br />
into two sub-sectors, namely strata title apartment or condominium<br />
and rental apartment.<br />
Strata Title Apartment<br />
Increasing Demand Continues<br />
BI rate trends that tend to decline in 2011 are expected to continue<br />
through 2012. We forecasted BI rate to be stable at 5.75% until the<br />
end of the year even with the assumption that government will<br />
increase subsidized fuel price by 33%. The government has lowered<br />
the BI Rate at the lowest level to 5.75% since 2005 in order to<br />
accelerate loans to the real sectors, such as manufacturing and<br />
production, and also to increase the level of consumption. This<br />
condition will certainly drive the demand for condominiums in the<br />
future. It is seen from the condominium sale growth for 2011 of<br />
7,987 units. The figure grew 84.7% (YoY) compared to the sales in<br />
2010 of 4,325 units.<br />
However, there will be a regulatory risk to consider this year. BI<br />
recently released a new regulation on Loan to Value (LTV) for<br />
property mortgage loan. In the regulation, LTV is now restricted to<br />
maximum 70%, applicable to all property type mortgage of a size<br />
above 70 m2, including landed-houses, strata residential and<br />
apartments. The implementation started on 15 March, with 3<br />
month socialization period until 15 June. Impact of the regulations<br />
will be mainly seen in the upper-middle class in the short term. The<br />
sale of the segment will likely to delay because the buyer needs to<br />
generate more down payments. In the long run, this regulation<br />
could create strong fundamental for property sector.<br />
© Office of Chief Economist Page 57 of 68<br />
© Office of Chief Economist Page 57 of 68
From the supply<br />
side, an addition<br />
of 18,140<br />
condominium<br />
units is expected<br />
to occur in<br />
2012….<br />
© Office of Chief Economist Page 58 of 68<br />
Page 58 of 68<br />
Large Sum of Supply in 2012<br />
From the supply side, an addition of 18,140 condominium units is<br />
expected to occur in 2012, assuming no delay in the projects. This of<br />
course will enhance the market competition that will impact on the<br />
level of sales.<br />
There are 12 new condominium projects that were launched in the<br />
late 2011, including Nifarro, Sea View Condominium Green Bay<br />
Pluit, Ciputra World Jakarta and Woodland Park Residence.<br />
From a location perspective, condominiums in Jakarta are mostly<br />
located in the CBD area (26.1% of the total). CBD is the business<br />
district located on Jalan Sudirman, Kuningan, Thamrin, Gatot<br />
Subroto and Satrio. Outside the CBD, the greatest supply is located<br />
in North Jakarta and West Jakarta at 23.0% and 21.0%.<br />
In 2011, around 8,000 condominium units within 28 proposed<br />
projects were launched in Jakarta. The majority is the middle<br />
segment (62.5%), followed by upper-middle (23%) and upper class<br />
(14.5%).<br />
Cummulative Supply, Sales and Sales Rate of Condominium<br />
(unit)<br />
Figure 40. Condominium Supply and Sales in Jakarta. On an annual basis, the condominiums supply<br />
and sales in Jakarta increased. In 2011, condominium sales rate reached 95.2%. Condominium supply<br />
in 2011 reached 85,713 units with cumulative sales of 81,582 unit. (Source: Cushman & Wakefield)<br />
In the future, the development of apartments for sale in the primary<br />
residential areas will continue to target the upper segment as seen<br />
in previous years. Meanwhile, for the CBD area, developers will be<br />
© Office of Chief Economist
more interested to build apartments for sale that target the middle<br />
to upper segments given the limited land in the area.<br />
Figure 41. Condominium supply in Jakarta. The supply of condominiums is mostly located in the CBD<br />
by 26.1%. Outside the CBD, the greatest supply of condominiums is in North Jakarta and West Jakarta.<br />
(Source: Jones Lang Lasalle Procon)<br />
Condominiums in<br />
the CBD area<br />
have a good<br />
absorption rate<br />
and the highest<br />
price increase.<br />
East Jakarta<br />
0.9%<br />
North Jakarta<br />
23.0%<br />
Distribution of Condominiums in Jakarta by<br />
Municipality<br />
(%)<br />
West Jakarta<br />
21.0%<br />
South Jakarta<br />
13.4%<br />
Price Tends to Increase<br />
Selling price of apartments in Jakarta since 2009 tends to increase.<br />
On condominium projects, the most popular location is especially in<br />
the CBD. Condominiums in this strategic area have a good<br />
absorption rate and the highest price increase. The average selling<br />
price of condominiums in the CBD area was recorded at IDR19,9<br />
million per m2 in the fourth quarter of 2011. This figure rose by<br />
6.1% (QoQ) or 20.7% (YoY). Meanwhile, the average selling price in<br />
the residential areas that include Kebayoran Baru, Senayan,<br />
Menteng, Pondok Indah, Permata Hijau and Kemang (primary<br />
residential areas) was recorded at IDR18,7 million per m2. The<br />
figure grew by 4.4% (QoQ) or 17.7% (YoY).<br />
Selling Prices of Apartments in Jakarta<br />
(IDR million / m2)<br />
CBD<br />
26.1%<br />
Central Jakarta<br />
15.7%<br />
Location 4Q10 3Q11 4Q11<br />
Growth<br />
QoQ YoY<br />
CBD Area 16.49 18.75 19.90 6.13% 20.68%<br />
Prime Area 15.90 17.93 18.72 4.41% 17.74%<br />
Figure 42. Condominium Sales Price in Jakarta. Price of condominiums in the CBD in the fourth<br />
quarter 2011 reached IDR19,9 million / m2. The figure was up by 6.1% (QoQ) or 17.7% (YoY). (Source:<br />
Cushman & Wakefield)<br />
© Office of Chief Economist Page 59 of 68<br />
© Office of Chief Economist Page 59 of 68
© Office of Chief Economist Page 60 of 68<br />
Page 60 of 68<br />
Hong Kong<br />
In contrast to<br />
condominiums<br />
that are<br />
dominated by<br />
local buyers,<br />
rental apartments<br />
are dominated by<br />
expatriates or up<br />
to 68% of total<br />
tenants.<br />
Singapore<br />
Japan<br />
India<br />
Taiwan<br />
China<br />
Cambodia<br />
Thailand<br />
Phillipines<br />
Malaysia<br />
<strong>Indonesia</strong><br />
If seen from Asia, the price of apartments in <strong>Indonesia</strong> is still<br />
considered the lowest price by USD1,791/m2. This price is much<br />
lower than prices in Hong Kong and Singapore, which reach<br />
USD19.232/m2 and USD16.272/m2.<br />
3,300<br />
2,407<br />
2,182<br />
1,781<br />
Figure 43. Selling Prices of Apartments in Asia. Apartment prices in <strong>Indonesia</strong> are included in the<br />
lowest prices in Asia. Apartments with the highest rates in Asia include those in Hong Kong and<br />
Singapore, which reach USD19.232/m2 and USD16.272/m2. (Source: Global Property Guide)<br />
Rental Apartment<br />
Selling Prices of Apartments in Asia<br />
(USD/m2)<br />
3,750<br />
7,112<br />
6,932<br />
16,272<br />
13,855<br />
12,913<br />
19,323<br />
Rental apartment can be divided into three types based on the<br />
nature, i.e. Serviced Apartment, Purposed Built Rental Apartment<br />
and Apartment for sale to be put in lease by the owners or Condofor-lease.<br />
Demand for Rental Apartments is Dominated by Expatriates<br />
The same trend occurred in rental apartments, where an increase in<br />
rental demand occurs. In contrast to condominiums that are<br />
dominated by local buyers, rental apartments are dominated by<br />
expatriates or up to 68% of total tenants. Demand for rental<br />
apartments is generally derived from short-term business travelers<br />
and tourists.<br />
Purposed built rental apartment and serviced apartment enjoyed<br />
the highest occupancy rate in 2011 compared to condo-for-lease,<br />
standing around 80%. This figure grew 0.7% (QoQ) or 10.1% (YoY).<br />
Short-lease accommodation demand coming from sports events,<br />
© Office of Chief Economist
…..rental<br />
apartments will<br />
be increasingly<br />
under pressure<br />
from apartments<br />
for sale to be put<br />
on lease by the<br />
owners or the<br />
condo-for-lease<br />
government and corporate groups and local families during the<br />
holiday season, which boosted occupancy.<br />
Occupancy rate of condo-for-lease in 2011 was recorded at 65.7%<br />
or grew 4.2% (QoQ) or 1% (YoY). The majority of tenants selected<br />
accommodation based on accessibility to the main activity locations<br />
due to continuing traffic in the city.<br />
Addition of Supply from Condo-for-Lease<br />
In the future, the trend of apartment for sale development will<br />
continue. Meanwhile, rental apartments will be increasingly under<br />
pressure from apartments for sale to be put on lease by the owners<br />
or the condo-for-lease. In general, the development of the vertical<br />
residential property is more attractive to investors than end users,<br />
especially with the demand for rental at the centers of activities,<br />
such as hospitals, expatriate communities, universities, work<br />
environments.<br />
From the supply side, there are seven rental apartment projects<br />
scheduled to be completed for 2012. They include The Grand Hyatt<br />
Residence Palace and Plaza Senayan Tower C & D. Therefore, the<br />
total supply of rental apartments in 2012 is expected to grow 754<br />
units. Later in 2013 to 2014, it is estimated there will be additions of<br />
503 units coming from the Ciputra World Jakarta.<br />
Cumulative Supply of Rental Apartment<br />
unit<br />
36.71 38.267 41.460 TOTAL<br />
2,465 2,449 2,335<br />
3,238 3,750 4,127 Purpose-built<br />
Rental<br />
Apartment<br />
31,092 32,068 35,228<br />
2009 2010 2011<br />
Serviced<br />
Apartment<br />
Condos-forlease<br />
Figure 44. Cumulative Supply of Rental Apartment. The supply of rental apartments mostly comes<br />
from apartments for sale put on lease or condo-for-lease, reaching 84% of the total cumulative supply<br />
of rental apartments in Jakarta. (Source: Cushman & Wakefield)<br />
© Office of Chief Economist Page 61 of 68<br />
© Office of Chief Economist Page 61 of 68
USD/m2<br />
25<br />
20<br />
15<br />
10<br />
5<br />
0<br />
© Office of Chief Economist Page 62 of 68<br />
Page 62 of 68<br />
17.78<br />
13.33<br />
Rental Rates Tends to Increase<br />
Rental rates for serviced apartments and Purposed built apartments<br />
are higher than condo-for-lease or reach USD20.82 / m2 /month in<br />
2011. The figure grew 14% (YoY) from the previous year, which<br />
amounted to USD18.32/ m2 / month. Meanwhile, for the rental<br />
rates of condo-for-lease tend to be stable at around USD13 / m2 /<br />
month to USD15 / m2 / month.<br />
In the future, the managers of rental apartments are likely to<br />
continue to provide attractive facilities for the tenants, such as<br />
flexible payment terms and varied length of rental time.<br />
Rental Rate and Yield of Rental Apartments by Type<br />
17.83<br />
14.51<br />
Figure 45. Rental Rates and Occupancy Levels of Rental Apartments. Rental rates and occupancy<br />
levels of apartments from serviced apartments and purposed built apartments are higher than those<br />
derived from condo for lease. (Source: Cushman & Wakefield)<br />
Conclusion<br />
17.93<br />
2007 2008 2009 2010 2011<br />
14.38<br />
Service Apt & PB Rental Apt Condo for Lease Rent<br />
Service Apt & PB Occupancy Rate Condo for Lease Occupancy Rent<br />
18.32<br />
In 2012, the condominium market is predicted to grow in line with<br />
the improving domestic economic conditions. In terms of supply, it<br />
will be added by units from several projects to be completed in<br />
2012. This addition will likely increase market competition, with<br />
potential impact to the overall sale rate. Despite the higher supply<br />
level and competition between projects, the outlook is for higher<br />
sales in the year ahead, stimulated by the new projects and positive<br />
buyer sentiment.<br />
13.71<br />
20.82<br />
15.03<br />
80%<br />
70%<br />
60%<br />
50%<br />
40%<br />
30%<br />
20%<br />
10%<br />
0%<br />
© Office of Chief Economist
In the year ahead, large sum condominiums units are expected to<br />
be completed in the condo-for-lease sub-sector, which will likely<br />
trigger tougher competition within the market.<br />
The continued stability of the economy is expected to further<br />
attract foreign companies to <strong>Indonesia</strong>, with a resultant increase in<br />
expatriate numbers. This will most likely impact an increase in<br />
purposed built rental and serviced apartment occupancy levels.<br />
© Office of Chief Economist Page 63 of 68<br />
© Office of Chief Economist Page 63 of 68
mandiri leading economic index (LEI)<br />
March 2012<br />
<strong>Mandiri</strong> LEI fluctuated in the range of 99.2 to 100.5 during the<br />
period of January to December 2011. In November 2011, there was<br />
an increase to 99.8 (+0.3%MoM), while in December 2011, the<br />
index fell conversely to 99.2 (-0.6%MoM). From several constituent<br />
indicators of <strong>Mandiri</strong> LEI, export indices, Rupiah exchange rates and<br />
the volume of savings showed a decline in December 2011. It is<br />
estimated the growth in the domestic economy will still experience<br />
a slowdown in 2Q12.<br />
<strong>Indonesia</strong>’s economic performance will still be influenced by<br />
external factors, such as China’s potential economic slowdown that<br />
will affect <strong>Indonesia</strong>’s export performance. China’s coal imports<br />
from <strong>Indonesia</strong> were recorded down by 8.27% MoM in February<br />
2012. Based on the recent developments, the <strong>Indonesia</strong>’s export<br />
value in January 2012 was USD15.49 bn, or declining by 9.28%<br />
MoM. The government of <strong>Indonesia</strong> revised the export growth<br />
target of 15.1% to 9.9% in the Draft of the Revised 2012 State<br />
Revenue and Expenditure Budget. This is done considering the slow<br />
world trade growth and the impacts of the Europe debt crisis. The<br />
IMF also expects the economic slowdown will occur in developing<br />
countries, such as Brazil and India.<br />
Pressure on the Rupiah exchange rate occurred due to the<br />
strengthening of USD as the improvement in some economic<br />
indicators in United States. Service and manufacturing sectors as<br />
well as the United States’ finance showed improvements. The<br />
unemployment rate fell and the unemployment level remained at<br />
8.3% level, which is the lowest level since February 2009.<br />
© Office of Chief Economist Page 64 of 68<br />
Page 64 of 68<br />
© Office of Chief Economist
102.0<br />
101.5<br />
101.0<br />
100.5<br />
100.0<br />
99.5<br />
99.0<br />
98.5<br />
98.0<br />
Feb-10 Apr-10 Jun-10 Aug-10 Oct-10 Dec-10 Feb-11 Apr-11 Jun-11 Aug-11 Oct-11 Dec-11*<br />
2010 2011<br />
Nov Dec Mar Apr May Jun Jul Aug Sep Oct Nov Dec*<br />
LEI 101.2 100.3 100.2 100.5 100.2 100.3 100.2 99.9 100.1 99.5 99.8 99.2<br />
Change (% MoM) 0.5 (0.9) 0.2 0.3 (0.2) 0.0 (0.1) (0.3) 0.2 (0.6) 0.3 (0.6)<br />
CEI 99.8 99.6 100.5 100.2 100.3 99.9 100.2 98.2 100.5 101.2 101.0 100.9<br />
Change (% MoM) (0.1) (0.2) 0.2 (0.3) 0.1 (0.3) 0.2 (2.0) 2.4 0.6 (0.2) (0.1)<br />
note : *) preliminary<br />
Index > 100 indicates optimal economic growth<br />
Index < 100 indicates less optimal economic growth<br />
Changes in parentheses indicate negative numbers<br />
LEI (lhs) CEI (rhs)<br />
LEI and CEI are composite indices for predicting the movement of GDP (Gross Domestic Product) so they can be<br />
useful as an early warning on the movement of <strong>Indonesia</strong>n economy. LEI is used to predict the movement of<br />
GDP in the next 6 months, while CEI is used to predict the movement of GDP in the same month. LEI and CEI<br />
composite indices are formed from several indicators deemed important in studying the movement of<br />
<strong>Indonesia</strong>n economy.<br />
© Office of Chief Economist Page 65 of 68<br />
© Office of Chief Economist Page 65 of 68<br />
105.0<br />
104.0<br />
103.0<br />
102.0<br />
101.0<br />
100.0<br />
99.0<br />
98.0<br />
97.0<br />
96.0
MACRO ECONOMIC INDICATORS AND FORECAST<br />
2009 2010 2011F 2012F 2013F<br />
National Account<br />
Real GDP (% yoy) 4.6 6.1 6.5 6.2 6.5<br />
Domestic Demand (% yoy) 5.5 5.2 5.4 6.1 7.0<br />
Real Consumption: Private (% yoy) 4.9 4.6 4.6 4.6 4.7<br />
Real Gross Fixed Capital Formation (% yoy) 3.3 8.5 8.0 9.0 11.9<br />
GDP (US$ bn) - nominal 539 707 835 933 1,092<br />
GDP per capita (US$) - nominal 2,337 2,975 3,464 3,809 4,393<br />
External Sector<br />
Exports (%yoy,US$) - Merchandise (15.0)<br />
Imports (%yoy,US$) - Merchandise (25.0)<br />
Trade Balance (US$ bn) 35.2<br />
Current Account (% of GDP) 1.9<br />
Current Account (US$ bn) 10.7<br />
External Debt (% of GDP) 32.1<br />
International Reserves (US$ bn) 66.1<br />
Import cover (months) 8.1<br />
Rp/US$ (period average) 10,409<br />
Rp/US$ (year end) 9,470<br />
© Office of Chief Economist Page 66 of 68<br />
Page 66 of 68<br />
32.2<br />
42.0<br />
31.1<br />
0.9<br />
6.3<br />
27.5<br />
96.2<br />
8.5<br />
9,086<br />
8,963<br />
29.2<br />
31.2<br />
37.7<br />
0.3<br />
2.9<br />
25.6<br />
110.1<br />
7.6<br />
8,841<br />
9,091<br />
9.9<br />
12.1<br />
37.7<br />
(0.1)<br />
(0.7)<br />
25.2<br />
130.0<br />
8.0<br />
9,108<br />
9,124<br />
© Office of Chief Economist<br />
15.6<br />
17.5<br />
38.9<br />
(0.4)<br />
(4.2)<br />
23.7<br />
150.2<br />
8.0<br />
8,949<br />
8,931<br />
Other<br />
BI rate (% period average) 6.9 6.5 6.6 6.0 5.5<br />
BI rate (% year end) 6.5 6.5 6.0 6.0 5.5<br />
Headline Inflation (% yoy, year end) 2.8 7.0 3.8 5.5 5.0<br />
Headline Inflation (% yoy, period average) 4.3 5.3 5.1 4.7 5.1<br />
Fiscal Balance (% of GDP) (1.6) (0.6) (1.5) (1.1) (1.1)<br />
S&P's Rating - FCY BB- BB BB+ BBB- BBB-<br />
S&P's Rating - LCY BB+ BB+ BBB- BBB BBB
INDONESIA CURRENT DATA<br />
Indicators Unit<br />
2007 2008 2009<br />
2010<br />
Jul Aug Sep Oct Nov Dec Jan Feb<br />
Exchange Rate<br />
End of Period IDR/USD 9393 10900 9390 8978 8507 8534 8813 8855 9200 9068 8975 9074<br />
Average IDR/USD 9354 1167 9462 9021 8533 8541 8791 8886 9040 9096 9081 9036<br />
Monetary Sector<br />
Base money M0, eop IDRtn 379.58 344.69 402.12 518.45 555.01 625.44 565.15 566.28 568.78 613.49 594.08 578.96<br />
Narrow money M1 IDRtn 450.06 456.79 515.82 605.38 639.69 662.81 656.10 665.00 667.61 733.99 694.59<br />
Broad Money M2 IDRtn 1,649.66 1,883.85 2,141.38 2,469.40 2,564.56 2,621.35 2,643.33 2,677.79 2,728.74 2,877.22 282.75<br />
Outstanding Loan IDRtn 995.11 1,313.87 1,446.81 1,783.60 1,995.84 2,054.08 2,100.81 2,128.72 2,169.61 2,223.69 218.34<br />
Outstanding Deposit IDRtn 1,459.44 1,673.82 1,914.11 2,208.72 2,288.67 2,296.18 2,363.63 2,396.28 2,450.33 2,596.33 2,540.24<br />
Lending rate (working capital) % p.a 13.00 15.22 13.69 12.83 12.55 12.50 12.39 12.36 12.31 12.16 12.09<br />
3-month deposit rate, eop % p.a 7.42 11.97 6.85 7.06 6.88 6.90 7.05 7.11 6.99 6.81 6.68<br />
Overnight rate, eop % p.a 4.50 9.40 6.24 5.72 5.82 5.88 5.31 5.05 4.55 4.55 4.02 3.75<br />
Prices<br />
Headline CPI (2007=100) Index 155.5 113.86 117.03 125.17 127.35 128.54 128.89 128.74 129.18 129.91 130.9 130.96<br />
Year on year inflation rate % 6.59 11.06 2.78 6.96 4.61 4.79 4.61 4.42 4.15 3.79 3.65 3.56<br />
Month on month inflation rate % 1.1 -0.04 0.33 0.92 0.67 0.93 0.27 -0.12 0.34 0.57 0.76 0.05<br />
Year to date inflation rate % N/A 11.06 2.78 6.96 1.74 2.69 2.97 2.85 3.20 3.79 0.76 0.81<br />
Wholesale Price Index (2000=100) Index 217 238.0 167.35 177.87 182.30 183.45 184.27 184.64 184.94 185.76 187.11 187.77<br />
Trade<br />
Export USDbn 10.86 8.69 13.35 16.83 17.43 18.65 17.54 16.96 17.24 17.20 15.49<br />
Oil USDbn 2.51 1.24 2.50 3.26 3.80 4.09 3.93 3.06 3.52 3.60 2.97<br />
Non oil USDbn 8.36 7.45 10.85 13.57 13.62 14.56 13.61 13.90 13.71 13.60 12.51<br />
Import USDbn 6.81 6.29 10.33 13.15 16.21 15.08 15.17 15.53 15.39 16.34 14.57<br />
Oil USDbn 2.39 0.98 2.10 2.64 3.80 3.81 3.42 3.28 3.45 3.63 2.98<br />
Non oil USDbn 4.42 5.31 8.22 10.50 12.41 11.27 11.69 12.25 11.94 12.71 11.58<br />
Trade Balance USDbn 4.06 2.40 3.02 3.68 1.22 3.57 2.37 1.42 1.84 0.86 0.92<br />
Output<br />
GDP (current price) IDRtn 1034.86 1274.29 1450.82 1670.52 1923.57 1921.56<br />
GDP (constant price at 2000) IDRtn 493.37 518.94 547.54 585.10 632.43 623.96<br />
Real Growth % YoY 5.88 5.20 5.43 6.89 6.46 6.49<br />
Capital Market<br />
JCI Index, eop Index 2745.83 1355.41 2534.36 3703.51 4130.80 3841.73 3549.03 3790.85 3715.08 3821.99 3941.69 3985.21<br />
Volume, avg shares mn 3155.65 1743.25 3422.10 3965.38 5336.18 6121.77 3886.25 4905.28 3098.96 3496.38 4045.49 3482.60<br />
Value, avg IDRbn 4340.55 1454.61 2332.42 3959.30 4225.88 5623.02 4280.52 3885.67 2870.38 2684.29 3269.50 4161.39<br />
Consumer Confidence Index 99.10 90.60 108.70 109.30 111.80 110.60 115.00 116.20 114.30 116.60 119.20 111.70<br />
Disclaimer: This material is for information only, and we are not soliciting any action based upon it. This report is not to be<br />
construed as an offer to sell or the solicitation of an offer to buy any security in any jurisdiction where such an offer or<br />
solicitation would be illegal. The information herein has been obtained from sources believed to be reliable, but we do not<br />
warrant that it is accurate or complete, and it should not be relied upon as such. Opinion expressed is our current opinion as of<br />
the date appearing on this material only, and subject to change without notice. It is intended for the use by recipient only and<br />
may not be reproduced or copied/photocopied or duplicated or made available in any form, by any means, or redistributed to<br />
others without written permission of PT <strong>Bank</strong> <strong>Mandiri</strong> Tbk. Additional information is available upon request. For further<br />
information please contact: Office of Chief Economist, Ph. (021) 524 5516/5272 or Facs. (021) 521 0430.<br />
© Office of Chief Economist Page 67 of 68<br />
© Office of Chief Economist Page 67 of 68<br />
2011<br />
2012
Head Office<br />
Plaza <strong>Mandiri</strong><br />
Jl. Jend. Gatot Subroto Kav. 36-38<br />
Jakarta 12190, <strong>Indonesia</strong><br />
Tel: (62-21) 526 5045 – 526 5095<br />
Fax: (62-21) 526 8372 – 526 5008<br />
Website: www.bankmandiri.co.id<br />
Zulkifli Zaini<br />
President Director & CEO<br />
Tel: (62-21) 3002 3067, Fax: (62-21) 526 3459<br />
Riswinandi<br />
Deputy President Director<br />
Tel: (62-21) 3002 3028, Fax: (62-21) 526 3408<br />
Abdul Rachman<br />
Director Institutional <strong>Bank</strong>ing<br />
Tel: (62-21) 3002 3839, Fax: (62-21) 526 3671<br />
Sentot A. Sentausa<br />
Director Risk Management<br />
Tel: (62-21) 3002 3454, Fax: (62-21) 526 8213<br />
Budi Gunadi Sadikin<br />
Director Micro & Retail <strong>Bank</strong>ing<br />
Tel: (62-21) 3002 3079, Fax: (62-21) 252 1585<br />
Ogi Prastomiyono<br />
Director Compliance & Human Capital<br />
Tel: (62-21) 3002 3666, Fax: (62-21) 252 1585<br />
Pahala N. Mansury<br />
Director Finance & Strategy<br />
Tel: (62-21) 3002 3089, Fax: (62-21) 526 8213<br />
Fransisca N. Mok<br />
Director Corporate <strong>Bank</strong>ing<br />
Tel: (62-21) 3002 3847, Fax: (62-21) 252 1585<br />
Sunarso<br />
Director Commercial & Business <strong>Bank</strong>ing<br />
Tel: (62-21) 3002 3087, Fax: (62-21) 252 1585<br />
Kresno Sediarsi<br />
Director Technology & Operation<br />
Tel: (62-21) 524 3092, Fax: (62-21) 526 3617<br />
Royke Tumilaar<br />
Director Treasury, FI & Special Asset Management<br />
Tel: (62-21) 3002 3057, Fax: (62-21) 5296 4053<br />
Mansyur S. Nasution<br />
EVP Coordinator Consumer Finance<br />
Tel: (62-21) 3002 3075, Fax: (62-21) 5296 4116<br />
Riyani T. Bondan<br />
EVP Coordinator Internal Audit<br />
Tel: (62-21) 3002 3722, Fax: (62-21) 5296 4116<br />
Ventje Raharjo<br />
EVP Coordinator Change Management Office<br />
Tel: (62-21) 3002 3076, Fax: (62-21) 526 8213<br />
Overseas Offices<br />
Hongkong Branch<br />
7 th Floor, Far East Finance Centre<br />
16 Harcourt Road, Hongkong<br />
Tel: 852-2527-6611<br />
Fax: 852-2529-8131<br />
Singapore Branch<br />
3 Anson Road #12-01/02, Springleaf Tower<br />
Singapore 079909<br />
Tel: 65-6213-5688<br />
Fax: 65-6438-3363<br />
Cayman Islands Branch<br />
Cardinal Plaza 3 rd Floor<br />
30 Cardinal Avenue, PO Box 10198,<br />
Grand Cayman, KY1-1002, Cayman Islands<br />
Tel: 1-345-945-8891<br />
Fax: 1-345-945-8892<br />
<strong>Bank</strong> <strong>Mandiri</strong> (Europe) Limited, London<br />
Cardinal Court (2 nd Floor),<br />
23 Thomas More Street<br />
London EIW IYY, United Kingdom<br />
Tel: 44-207-553-8688<br />
Fax: 44-207-553-8699<br />
Shanghai Representative Office<br />
3401, <strong>Bank</strong> of China Tower<br />
200 Yin Cheng (M) Road,<br />
Pudong New Area, Shanghai, 200120<br />
People’s Republic of China<br />
Tel: 86-21-5037-2509<br />
Fax: 86-21-5037-2507<br />
Dilli Branch – Timor Leste<br />
Avenida Presidente Nicolao Lobato<br />
No.12, Colmera<br />
Dilli – Timor Leste<br />
Tel: +670-331-7777<br />
Fax: +670-331-7190/74444<br />
<strong>Mandiri</strong> International Remittance Sdn.Bhd.<br />
Wisma Mepro, 29 & 31 Jalan Ipoh 51200 Kuala<br />
Lumpur, Malaysia<br />
Telp : +60-3-4045-988<br />
© Office of Chief Economist Page 68 of 68<br />
© Office of Chief Economist<br />
Printed by DKUprint www.dkuprinting.com