final Sedimentation Report - City and Borough of Sitka
final Sedimentation Report - City and Borough of Sitka
final Sedimentation Report - City and Borough of Sitka

You also want an ePaper? Increase the reach of your titles
YUMPU automatically turns print PDFs into web optimized ePapers that Google loves.
FINAL RESERVOIR SEDIMENTATION STUDY REPORT<br />
BLUE LAKE PROJECT (FERC NO. 2230) EXPANSION<br />
Prepared By:<br />
Kathy Dubé<br />
Prepared For:<br />
<strong>City</strong> <strong>and</strong> <strong>Borough</strong> <strong>of</strong> <strong>Sitka</strong> Electric Department<br />
December 2009
TABLE OF CONTENTS<br />
TABLE OF CONTENTS.................................................................................................................I<br />
LIST OF FIGURES .........................................................................................................................I<br />
LIST OF TABLES..........................................................................................................................II<br />
APPENDICES ................................................................................................................................II<br />
INTRODUCTION AND BACKGROUND ................................................................................... 1<br />
STUDY OBJECTIVES................................................................................................................... 1<br />
METHODS ..................................................................................................................................... 4<br />
Study Area <strong>and</strong> Features ............................................................................................................. 4<br />
Streamflow <strong>and</strong> Lake Level Analysis......................................................................................... 4<br />
Extent <strong>and</strong> Depth <strong>of</strong> Delta Deposits............................................................................................ 5<br />
Stream Channel Cross Sections <strong>and</strong> Grain Size Data................................................................. 6<br />
Hydraulic <strong>and</strong> Sediment Transport Calculations ........................................................................ 7<br />
RESULTS ....................................................................................................................................... 7<br />
Streamflow <strong>and</strong> Lake Levels ...................................................................................................... 7<br />
Delta Deposits........................................................................................................................... 10<br />
Existing Blue Lake Creek Delta ........................................................................................... 10<br />
Expansion-related Blue Lake Creek Delta (Potentially Inundated Area)............................. 13<br />
Fish Use In Blue Lake Creek.................................................................................................... 17<br />
Length <strong>of</strong> Accessible Stream ................................................................................................ 17<br />
Channel Width <strong>and</strong> Substrate Conditions............................................................................. 19<br />
Becky, Brad <strong>and</strong> Sheldon Creeks.............................................................................................. 23<br />
Becky Creek.......................................................................................................................... 24<br />
Brad Creek ............................................................................................................................ 26<br />
Sheldon Creek....................................................................................................................... 28<br />
SUMMARY.................................................................................................................................. 29<br />
CONSULTATION........................................................................................................................ 31<br />
LITERATURE CITED ................................................................................................................. 33<br />
LIST OF FIGURES<br />
Figure 1. Proposed Exp<strong>and</strong>ed Blue Lake Shoreline. ..................................................................... 2<br />
Figure 2. Blue Lake Creek Orthophoto showing Expansion Shoreline <strong>and</strong> Stream Miles............ 3<br />
Figure 3. Estimated Blue Lake Creek Inflow Exceedence Values. ............................................... 8<br />
Figure 4. Blue Lake Surface Elevation Exceedence Values under Existing Conditions............... 9<br />
Figure 5. Modeled Blue Lake Surface Elevation Exceedence Values under Expansion<br />
Conditions. ..................................................................................................................... 9<br />
Figure 6. Blue Lake Creek Delta Aerial View............................................................................. 10<br />
Figure 7. Existing <strong>and</strong> Estimated Future Delta Deposits............................................................. 11<br />
Figure 8. Surveyed Longitudinal Pr<strong>of</strong>ile <strong>of</strong> Blue Lake Creek <strong>and</strong> Adjacent Delta Deposits within<br />
the Current Reservoir. .................................................................................................. 12<br />
Figure 9. Grain Size Distribution in Existing Delta Deposits...................................................... 13<br />
Figure 10. Longitudinal Pr<strong>of</strong>ile <strong>of</strong> Lake Creek Showing Existing <strong>and</strong> Estimated Expansionrelated<br />
Delta Deposits. ................................................................................................. 15<br />
Blue Lake Reservoir <strong>Sedimentation</strong> <strong>Report</strong> i Blue Lake Project Expansion<br />
Watershed GeoDynamics FERC No. 2230<br />
December 2009
Figure 11. Cross Sectional Pr<strong>of</strong>iles Across Existing Delta.......................................................... 16<br />
Figure 12. Cross Sectional Pr<strong>of</strong>iles Across Expansion-related Delta.......................................... 16<br />
Figure 13. Accessible Length <strong>of</strong> Blue Lake Creek during Spawning Periods under Existing <strong>and</strong><br />
Expansion Conditions. ................................................................................................. 18<br />
Figure 14. Existing Blue Lake Creek Channel Cross Sections Upstream <strong>of</strong> Lake...................... 20<br />
Figure 15. Blue Lake Creek Channel Cross Sections in Current Fluctuation Zone. ................... 21<br />
Figure 16. Armor Layer Grain Size Distribution in Existing Blue Lake Creek Upstream <strong>of</strong> Lake.<br />
...................................................................................................................................... 22<br />
Figure 17. Armor Layer Grain Size Distribution in Existing Delta Active Channel Deposits.... 22<br />
Figure 18. Sub-armor Layer Grain Size Distribution in Existing Delta Active Channel Deposits.<br />
...................................................................................................................................... 22<br />
Figure 19. Photo <strong>of</strong> Becky Creek Delta in Confined Canyon Area............................................. 24<br />
Figure 20. Photo <strong>of</strong> Existing Becky Creek Delta......................................................................... 25<br />
Figure 21. Estimated Existing <strong>and</strong> Expansion Becky Creek Delta.............................................. 26<br />
Figure 22. Photo <strong>of</strong> Existing Brad Creek Delta. .......................................................................... 27<br />
Figure 23. Estimated Existing <strong>and</strong> Expansion Brad Creek Delta. ............................................... 28<br />
Figure 24. Photo <strong>of</strong> Existing Sheldon Creek Delta...................................................................... 28<br />
Figure 25. Estimated Existing <strong>and</strong> Expansion Sheldon Creek Delta........................................... 29<br />
LIST OF TABLES<br />
Table 1. Estimated Area, Depth, <strong>and</strong> Volume <strong>of</strong> Existing Lake Creek Delta Deposits .............. 13<br />
Table 2. Estimated Area, Depth, <strong>and</strong> Volume <strong>of</strong> Future Lake Creek Delta Deposits 50 Years<br />
after Expansion ................................................................................................................. 17<br />
Table 3. Comparison <strong>of</strong> Blue Lake Creek Channel Characteristics in the Exiting Delta <strong>and</strong><br />
Upstream <strong>of</strong> the Lake........................................................................................................ 19<br />
Table 4. Estimated Flow, Water Depth, <strong>and</strong> Width in Low Gradient Delta Channel. ................ 23<br />
Table 5. Estimated Median Monthly <strong>and</strong> Peak Flows in Becky, Brad, <strong>and</strong> Sheldon Creeks...... 24<br />
Table 6. Reviewer Comments on Draft Reservoir <strong>Sedimentation</strong> <strong>Report</strong>................................... 31<br />
Appendix A. Grain Size Data<br />
APPENDICES<br />
Blue Lake Reservoir <strong>Sedimentation</strong> <strong>Report</strong> ii Blue Lake Project Expansion<br />
Watershed GeoDynamics FERC No. 2230<br />
December 2009
INTRODUCTION AND BACKGROUND<br />
The <strong>City</strong> <strong>and</strong> <strong>Borough</strong> <strong>of</strong> <strong>Sitka</strong> Electric Department (“<strong>City</strong>”) recently received a new license for<br />
the Blue Lake Hydroelectric Project (FERC No. 2230, “Project”) from the Federal Energy<br />
Regulatory Commission (FERC). During the relicensing process, the <strong>City</strong>’s ongoing energy<br />
forecasts indicated that, in order to assure continued delivery <strong>of</strong> low cost electrical power in the<br />
face <strong>of</strong> rising energy needs in <strong>Sitka</strong>, it must exp<strong>and</strong> its electrical generating base.<br />
The <strong>City</strong> is in the process <strong>of</strong> applying for an amendment to the Project’s existing FERC license<br />
to reflect two significant changes in Project design: 1) addition <strong>of</strong> a new generating turbine at or<br />
near the existing powerhouse; <strong>and</strong> 2) raising the Project dam as much as 83 above the existing<br />
spillway level. The <strong>City</strong> is exploring feasibility <strong>of</strong> these changes because <strong>of</strong> recent electric load<br />
forecasts in the face <strong>of</strong> increasing diesel fuel costs. Details <strong>of</strong> elements <strong>of</strong> the proposed<br />
expansion are described in the Scoping Document II which was distributed in June 2009.<br />
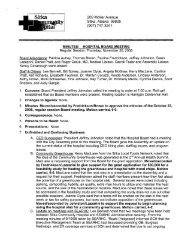
Raising the Blue Lake dam will increase the Blue Lake surface area from 1,225 acres to 1,655<br />
acres, a total increase <strong>of</strong> 430 acres. The majority <strong>of</strong> this increase will take place in the valley <strong>of</strong><br />
Blue Lake Creek, the lake’s primary inlet tributary (Figure 1). After the reservoir reaches the<br />
new full pool level, there will be a change in the sediment deposition <strong>and</strong> erosion patterns in the<br />
Blue Lake Creek valley.<br />
During FERC-required consultation, the USDA Forest Service (USFS) <strong>and</strong> the <strong>Sitka</strong><br />
Conservation Society (SCS) requested evaluation <strong>of</strong> the effects <strong>of</strong> the raised pool level on<br />
sediment deposition patterns in the potentially-inundated areas <strong>of</strong> the Blue Lake Creek valley. It<br />
is known that Blue Lake Creek is an important spawning area for Blue Lake’s rainbow trout<br />
population, <strong>and</strong> that it is accessed for various forms <strong>of</strong> outdoor recreation. This study describes<br />
the effect <strong>of</strong> deposition <strong>and</strong> lake level changes under the proposed exp<strong>and</strong>ed project<br />
configuration on fish habitat <strong>and</strong> fish passage in Blue Lake <strong>and</strong> Blue Lake Creek with the new<br />
reservoir operating levels.<br />
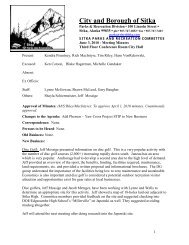
In this study report, l<strong>and</strong> <strong>and</strong> water elevations are referenced in feet to mean low sea level <strong>and</strong><br />
denoted “El”, as in El 342, El 425, etc. Also, Blue Lake Creek locations are noted by Stream<br />
Mile (SM) or distance in miles upstream from Blue Lake Creek’s existing confluence with Blue<br />
Lake (Stream Miles are shown on Figure 2). Revisions were made in this <strong>final</strong> December<br />
2009 report in response to resource agency comments. Revised text is marked in bold<br />
typeface <strong>and</strong> referenced in the Consultation section at the end <strong>of</strong> the report.<br />
STUDY OBJECTIVES<br />
The objectives <strong>of</strong> this Reservoir <strong>Sedimentation</strong> Study are to:<br />
1. Determine the extent <strong>and</strong> estimated volume <strong>of</strong> sediment deposition <strong>and</strong> erosion in Blue<br />
Lake <strong>and</strong> the reach <strong>of</strong> Blue Lake Creek between El 342 (current maximum water level)<br />
<strong>and</strong> 425 (maximum Expansion-related water level), under Expansion-related reservoir<br />
operations; <strong>and</strong><br />
Blue Lake Reservoir <strong>Sedimentation</strong> <strong>Report</strong> 1 Blue Lake Project Expansion<br />
Watershed GeoDynamics FERC No. 2230<br />
December 2009
Brad Creek<br />
Figure 1. Proposed Exp<strong>and</strong>ed Blue Lake Shoreline.<br />
Becky Creek<br />
Sheldon Creek<br />
Blue Lake Creek<br />
Blue Lake Reservoir <strong>Sedimentation</strong> <strong>Report</strong> 2 Blue Lake Project Expansion<br />
Watershed GeoDynamics FERC No. 2230<br />
December 2009
Figure 2. Blue Lake Creek Orthophoto showing Expansion Shoreline <strong>and</strong> Stream Miles<br />
Blue Lake Reservoir <strong>Sedimentation</strong> <strong>Report</strong> 3 Blue Lake Project Expansion<br />
Watershed GeoDynamics FERC No. 2230<br />
December 2009
2. Evaluate probable future fish habitat <strong>and</strong> accessibility in the future inundation zone <strong>of</strong><br />
Blue Lake Creek based on projected stream gradient/width/depth <strong>and</strong> substrate<br />
characteristics.<br />
METHODS<br />
STUDY AREA AND FEATURES<br />
The reservoir sedimentation study area includes 1) the eastern end <strong>of</strong> Blue Lake, down to<br />
approximately El 180; <strong>and</strong> 2) Blue Lake Creek within the area <strong>of</strong> inundation defined by an<br />
Expansion-related maximum water surface elevation <strong>of</strong> El 425. The study area does not include<br />
other, smaller tributaries. In this report, the term “potentially-inundated area(s)” will refer to<br />
stream <strong>and</strong> l<strong>and</strong> features between El 342 <strong>and</strong> 425.<br />
Within the study area are certain features which are important to the evaluation <strong>of</strong> sedimentation<br />
effects on fish passage <strong>and</strong> habitat, including the “Lower Barrier Falls”, a steep cascade at SM<br />
0.12 which impedes upstream migration <strong>of</strong> rainbow trout at all reservoir levels below<br />
approximately El 322, <strong>and</strong> the “Upper Barrier Falls”, a similar cascade at El 430/SM 2.1 which<br />
impedes fish migration at all existing <strong>and</strong> Expansion-related reservoir elevations.<br />
STREAMFLOW AND LAKE LEVEL ANALYSIS<br />
Streamflow <strong>and</strong> lake level data available for Blue Lake <strong>and</strong> streams in the vicinity include:<br />
• mean daily <strong>and</strong> peak annual flows at the USGS gage on Sawmill Creek (USGS<br />
15088000)<br />
• Daily lake levels from Project operations records for 1992-2008<br />
There are no systematic records <strong>of</strong> daily flows in Blue Lake Creek upstream <strong>of</strong> Blue Lake.<br />
Adjusted mean daily flow data for the USGS Sawmill Creek near <strong>Sitka</strong>, AK gage (USGS<br />
15088000) during the pre-Project period (September 1920 to January 1923; February 1928 to<br />
September 1942; October 1945 to September 1957) were used to represent the range in flow<br />
magnitude <strong>and</strong> timing in Blue Lake Creek. The daily Sawmill Creek flows were adjusted by the<br />
ratio in drainage areas between the gage site (39.0 sq mi) <strong>and</strong> the drainage area <strong>of</strong> Blue Lake<br />
Creek upstream <strong>of</strong> Blue Lake (19.9 sq mi). This simplified adjustment was felt to be adequate to<br />
represent the range <strong>of</strong> Blue Lake Creek flows given the level <strong>of</strong> precision <strong>of</strong> the rest <strong>of</strong> the<br />
analysis. The resulting adjusted daily flows were entered into a spreadsheet for analysis. Flow<br />
exceedence values were calculated based on the daily values for each month over the 28 year<br />
pre-Project period <strong>of</strong> record. Mean daily flows in Becky, Brad, <strong>and</strong> Sheldon creeks were<br />
calculated in the same manner.<br />
The Pacific decadal oscillation has been reported to affect the timing <strong>and</strong> magnitude <strong>of</strong><br />
streamflows in Southeast Alaska (Neal et al. 2002). Neal found that winter flows were higher<br />
<strong>and</strong> summer flows were lower during warm Pacific decadal oscillation periods compared to cool<br />
oscillation periods. The Sawmill Creek data used in the streamflow analysis included 16 years<br />
during warm Pacific decadal oscillation periods <strong>and</strong> 12 years during cool periods, <strong>and</strong> so<br />
represents both oscillation periods.<br />
Blue Lake Reservoir <strong>Sedimentation</strong> <strong>Report</strong> 4 Blue Lake Project Expansion<br />
Watershed GeoDynamics FERC No. 2230<br />
December 2009
Peak flows in Blue Lake Creek were estimated based on the methodology in Curran et al. 2003,<br />
using Method 4 for ungaged sites on gaged streams. Blue Lake Creek is in Region 1, so the<br />
Region 1 regression variables <strong>and</strong> the Sawmill Creek near <strong>Sitka</strong>, AK data were used for the<br />
analysis.<br />
Existing daily Blue Lake elevation data were available from Project operators for the period<br />
1992-2008. Lake levels under Expansion conditions were represented by daily lake elevation<br />
output from the <strong>Sitka</strong> Generation Model. The model was run using flow conditions for the<br />
period 1929-1956 to correspond to the period when daily inflow values were available for<br />
comparison. The model used a constant annual generation load <strong>of</strong> 154,000 MWh which is the<br />
average maximum annual load that the <strong>Sitka</strong> hydro system is capable <strong>of</strong> generating without<br />
excessive supplementation with diesel generation. Daily lake elevation data for both existing<br />
conditions (actual 1992-2008 elevations) <strong>and</strong> Expansion conditions (modeled elevations) were<br />
entered into a spreadsheet for analysis. Lake surface elevation values were calculated based on<br />
the daily values for each month for the existing <strong>and</strong> Expansion conditions.<br />
The Blue Lake elevation data used in the Expansion lake level analysis included 16 years during<br />
warm Pacific decadal oscillation periods <strong>and</strong> 11 years during cool periods, <strong>and</strong> so represents both<br />
oscillation periods.<br />
EXTENT AND DEPTH OF DELTA DEPOSITS<br />
Topographic data available for the study area include:<br />
• 1957 contours between elevation 220 <strong>and</strong> 360 (pre-Project stream valley);<br />
• 2007 Light Detection <strong>and</strong> Ranging (LiDAR) survey data used to make a map with 5 foot<br />
contours above elevation 342 (current Blue Creek stream valley); <strong>and</strong><br />
• 2008 l<strong>and</strong> survey data <strong>of</strong> the exposed Blue Lake Creek channel <strong>and</strong> closely adjacent delta<br />
area between elevation 257 <strong>and</strong> 342 (existing Blue Lake Creek delta) used to make<br />
pr<strong>of</strong>iles <strong>of</strong> Blue Lake Creek <strong>and</strong> the adjacent delta.<br />
The approximate extent <strong>of</strong> current delta deposits, representing 52 years <strong>of</strong> deposition, was<br />
mapped during the May 19, 2009 site visit. Mapping was conducted based on the following data<br />
sources:<br />
• An aerial oblique photograph <strong>of</strong> the delta taken May 18, 2008 showing the delta above<br />
elevation 260. This photograph shows areas <strong>and</strong> patterns <strong>of</strong> deposition <strong>and</strong> the active<br />
channel zone.<br />
• The depth <strong>of</strong> delta deposits was measured at several locations in the delta. Depth in finegrained<br />
(s<strong>and</strong>/silt) deposits was measured by probing with a piece <strong>of</strong> metal rebar to<br />
refusal. Depth in coarse-grained deposits (cobble/gravel) was estimated as measured<br />
bank height along the existing incised channel.<br />
• The boundaries <strong>of</strong> the current active channel <strong>and</strong> several distinct cobble/gravel,<br />
gravel/s<strong>and</strong>, <strong>and</strong> s<strong>and</strong>/silt deposits were mapped using a h<strong>and</strong>-held GPS receiver during<br />
the 2009 field visit.<br />
• Comparison <strong>of</strong> the 2008 l<strong>and</strong> survey <strong>of</strong> the exposed portions <strong>of</strong> Blue Lake Creek with<br />
pre-Project (1957) elevations was used to estimate depth <strong>of</strong> channel deposits.<br />
Blue Lake Reservoir <strong>Sedimentation</strong> <strong>Report</strong> 5 Blue Lake Project Expansion<br />
Watershed GeoDynamics FERC No. 2230<br />
December 2009
The mapping units were transferred to GIS to determine the area (acres) <strong>of</strong> each <strong>of</strong> the map units.<br />
An average depth was assigned to each map unit <strong>and</strong> multiplied by the map unit area to estimate<br />
the volume.<br />
The extent <strong>and</strong> depth <strong>of</strong> delta deposits after 50 years <strong>of</strong> proposed expansion operations was<br />
estimated. The following assumptions were made:<br />
• The same rate <strong>of</strong> sediment input from Blue Lake Creek will occur in the future, so the<br />
volume <strong>and</strong> grain size composition <strong>of</strong> delta deposits after 50 years will be approximately<br />
the same as in the current delta.<br />
• The stream gradients in the expansion delta will be similar to the gradient in the existing<br />
delta <strong>and</strong>/or the existing Blue Lake stream channel in the area <strong>of</strong> the expansion delta<br />
(0.01-0.005). This assumption is valid because Blue Lake will continue to fluctuate<br />
annually, so during low lake levels Blue Lake Creek will cut down through the<br />
unconsolidated sediment deposited at higher lake levels, resulting in an active stream<br />
channel graded to the fluctuating lake levels.<br />
• There will be areas outside the active channel in the expansion delta with deeper deposits<br />
<strong>of</strong> cobble <strong>and</strong> gravel, similar to those deposits in the existing delta. These will be located<br />
close to where Blue Lake Creek enters the exp<strong>and</strong>ed lake under near full pool conditions.<br />
A map showing the estimated location <strong>and</strong> extent <strong>of</strong> the expansion delta was made in GIS<br />
depicting the predicted areas <strong>of</strong> active channel, cobble/gravel deposits, <strong>and</strong> s<strong>and</strong>/silt deposits.<br />
The extent <strong>of</strong> each area (acres) was measured <strong>and</strong> multiplied by the estimated average depth to<br />
provide a volume estimate.<br />
STREAM CHANNEL CROSS SECTIONS AND GRAIN SIZE DATA<br />
Stream channel cross sections were surveyed at three locations in upper Blue Lake Creek as part<br />
<strong>of</strong> the 2008 fisheries studies (see data in Wolfe 2009). Cross sections were surveyed at SM 1.34<br />
(Stream Transect 1), 1.49 (Stream Transect 2), <strong>and</strong> 1.95 (Stream Transect 3). During the May<br />
2009 field visit, three additional cross sections <strong>of</strong> Blue Lake Creek were surveyed using a tape,<br />
stadia rod, <strong>and</strong> h<strong>and</strong> level within the existing delta at SM -0.15 (Delta Transect 1), SM -0.18<br />
(Delta Transect 2) <strong>and</strong> SM -0.35 (Delta Transect 3). Cross section data was entered into Excel<br />
for analysis <strong>and</strong> plotting.<br />
At each <strong>of</strong> the six cross section locations, a pebble count was made across the entire width <strong>of</strong> the<br />
wetted channel to provide information on channel substrate. The pebble count was made by<br />
walking heel-to-toe across the wetted channel <strong>and</strong> selecting the particle at the toe <strong>of</strong> the field<br />
crew’s boot. Grain size <strong>of</strong> each particle was measured using a gravelometer. A minimum <strong>of</strong> 100<br />
particles was measured along each transect.<br />
A grab sample <strong>of</strong> sub-armor material was taken close to the water’s edge from a bar at each <strong>of</strong><br />
the three delta cross section locations. In addition, grab samples <strong>of</strong> delta surface material were<br />
taken at three locations on the delta outside <strong>of</strong> the active channel, representing the cobble/gravel,<br />
gravel/s<strong>and</strong>, <strong>and</strong> s<strong>and</strong>/silt map units. All grab samples were air dried <strong>and</strong> sieved using st<strong>and</strong>ard<br />
8-inch sieves <strong>and</strong> a shaker. Material retained on each sieve was weighed to the nearest gram.<br />
Particle size data was entered into Excel for analysis <strong>and</strong> plotting.<br />
Blue Lake Reservoir <strong>Sedimentation</strong> <strong>Report</strong> 6 Blue Lake Project Expansion<br />
Watershed GeoDynamics FERC No. 2230<br />
December 2009
HYDRAULIC AND SEDIMENT TRANSPORT CALCULATIONS<br />
Hydraulic analysis at each <strong>of</strong> the six stream cross sections (three in the existing delta area <strong>and</strong><br />
three in the expansion delta area) was performed using the WINXSPRO s<strong>of</strong>tware (Hardy et al.<br />
2005). The analysis was performed using the existing stream gradient at all cross sections to<br />
calculate water depth, velocity, <strong>and</strong> shear stress from low water to bankfull conditions.<br />
Hydraulic analysis was also performed on Delta Transect 3 using the lowest measured slope<br />
gradient (0.005) to provide data on differences in hydraulics <strong>and</strong> shear stress at a very low<br />
gradient, simulating deposition conditions in the Expansion delta.<br />
Discharge versus stage at each <strong>of</strong> the measured cross sections was computed using the<br />
WinXSPRO s<strong>of</strong>tware (Hardy et al. 2005). Channel elevation <strong>and</strong> position (xy) coordinates were<br />
entered for each cross section, along with measured water slope at low flow <strong>and</strong> estimated reachaverage<br />
high flow water gradient. The Jarrett equation for Manning’s roughness coefficient<br />
option was chosen to estimate the stage:discharge relationship, <strong>and</strong> was checked against the<br />
estimated bankfull stage for each <strong>of</strong> the three stream transects. The Jarrett equation for<br />
Manning’s roughness coefficient is internal to WinXSPRO <strong>and</strong> does not require any input on<br />
roughness elements; roughness is calculated based on water surface slope <strong>and</strong> hydraulic radius.<br />
The WINXSPRO model output was used to determine water depth <strong>and</strong> shear stress (τ) in the<br />
channel at each <strong>of</strong> the six transects for a range <strong>of</strong> flows. Shear stress at each cross-section was<br />
compared to critical shear stress (τ*c) for each flow to determine the particle size that could be<br />
entrained by the flow.<br />
The Shields’ Criterion was used to determine the critical shear stress for initiation <strong>of</strong> substrate<br />
movement:<br />
τ*c = a(γs/γw)d50<br />
where: τ*c = critical Shields stress for mobility <strong>of</strong> particle size d50<br />
a = constant, 0.039 for this analysis due to type <strong>of</strong> river <strong>and</strong> sediment<br />
γs <strong>and</strong> γw are the specific weights <strong>of</strong> sediment <strong>and</strong> water, respectively<br />
d50 = median particle size at threshold <strong>of</strong> mobility<br />
RESULTS<br />
STREAMFLOW AND LAKE LEVELS<br />
Estimated Blue Lake Creek daily flows were calculated from the pre-1957 flow records taken at<br />
the Sawmill Creek gage (USGS 15088000). To examine the magnitude <strong>and</strong> seasonal variations<br />
in Blue Lake Creek inflow, the 10, 50, <strong>and</strong> 90 percent exceedence elevations were plotted for<br />
each month from mean daily estimated stream flow data (Figure 3). The exceedence values refer<br />
to the value that is exceeded for the specified percent <strong>of</strong> the time. For example, in June the 50<br />
percent exceedence flow is 380 cfs, which means that during 50 percent <strong>of</strong> the days in June,<br />
mean daily inflow was estimated to be greater than 380 cfs <strong>and</strong> half <strong>of</strong> the day inflow was less<br />
than 380 cfs. The 10 percent exceedence inflow value for June is 541 cfs; 10 percent <strong>of</strong> the days<br />
Blue Lake Reservoir <strong>Sedimentation</strong> <strong>Report</strong> 7 Blue Lake Project Expansion<br />
Watershed GeoDynamics FERC No. 2230<br />
December 2009
in June flows were greater than 541 cfs, <strong>and</strong> 90 percent <strong>of</strong> the days flows were lower. Note that<br />
the 50 percent exceedence value is also referred to as the median value.<br />
Flows in Blue Lake Creek vary seasonally, with lowest flows during the months <strong>of</strong> December-<br />
April <strong>and</strong> highest median flows in June in response to snowmelt. While median flows are lower<br />
than the snowmelt peak in September-November, peak flows can occur during the fall as a result<br />
<strong>of</strong> large storms that bring heavy rains. Spawning <strong>and</strong> incubation periods for resident rainbow<br />
trout are shown on Figure 3 <strong>and</strong> will be discussed in more detail in the Fish Use in Blue Lake<br />
Creek section <strong>of</strong> this report.<br />
Flow (cfs)<br />
800<br />
700<br />
600<br />
500<br />
400<br />
300<br />
200<br />
100<br />
0<br />
incubation<br />
Oct Nov Dec Jan Feb Mar Apr May Jun Jul Aug Sep<br />
Figure 3. Estimated Blue Lake Creek Inflow Exceedence Values.<br />
spawning incubation<br />
Daily water surface elevation data for Blue Lake (1992-2008) were also analyzed to provide<br />
exceedence values by month (Figure 4). Lake levels are lowest in April, with a median value <strong>of</strong><br />
292 feet, rising through the spring with near full pool (342 feet) conditions between August <strong>and</strong><br />
November. Lake levels fall during the winter as the pool is drawn down to enable storage <strong>of</strong><br />
snowmelt run<strong>of</strong>f.<br />
Water surface elevation exceedence values were also plotted for modeled Blue Lake levels under<br />
expansion conditions (Figure 5). Lake levels under expansion conditions follow a similar<br />
pattern, with the lowest median level in April (368 feet), rising levels during the spring, <strong>and</strong><br />
falling levels during the fall <strong>and</strong> winter. However, the operations model output suggests that<br />
lake levels would not reach near full pool (425 feet) until October/November before dropping<br />
again. Part <strong>of</strong> the reason for the lower pool under expansion is that the model was run with a<br />
higher load than current conditions to show the effects <strong>of</strong> future energy needs.<br />
Blue Lake Reservoir <strong>Sedimentation</strong> <strong>Report</strong> 8 Blue Lake Project Expansion<br />
Watershed GeoDynamics FERC No. 2230<br />
December 2009<br />
10%<br />
25%<br />
50%<br />
75%<br />
90%<br />
100%
Lake Surface Elevation (ft msl).<br />
350<br />
340<br />
330<br />
320<br />
310<br />
300<br />
290<br />
280<br />
270<br />
260<br />
250<br />
incubation<br />
Oct Nov Dec Jan Feb Mar Apr May Jun Jul Aug Sep<br />
10%<br />
25%<br />
50%<br />
spawning incubation<br />
Figure 4. Blue Lake Surface Elevation Exceedence Values under Existing Conditions.<br />
Lake Surface Elevation (ft msl).<br />
430<br />
420<br />
410<br />
400<br />
390<br />
380<br />
370<br />
360<br />
incubation<br />
spawning incubation<br />
75%<br />
90%<br />
100%<br />
Oct Nov Dec Jan Feb Mar Apr May Jun Jul Aug Sep<br />
Figure 5. Modeled Blue Lake Surface Elevation Exceedence Values under Expansion<br />
Conditions.<br />
Blue Lake Reservoir <strong>Sedimentation</strong> <strong>Report</strong> 9 Blue Lake Project Expansion<br />
Watershed GeoDynamics FERC No. 2230<br />
December 2009<br />
10%<br />
25%<br />
50%<br />
75%<br />
90%<br />
100%
Peak flows in Blue Lake Creek were estimated using regional regression equations to be<br />
3,044 cfs (2-year return interval); 4,077 (5-year return interval); 4,765 (10-year return<br />
interval) <strong>and</strong> 6,828 (100-year return interval).<br />
DELTA DEPOSITS<br />
Sediment deposition takes place on deltas as flowing water slows <strong>and</strong> is no longer able to<br />
transport entrained material. Larger material is deposited first, with progressively finer material<br />
being deposited farther out on the delta <strong>and</strong> in the lake.<br />
Existing Blue Lake Creek Delta<br />
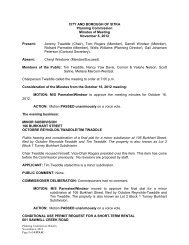
The existing Blue Lake Creek delta deposits can be seen on an aerial oblique photo <strong>of</strong> the delta<br />
taken in May 2008 when Blue Lake was near elevation 260 ft (Figure 6). The delta deposits<br />
within Blue Lake were mapped based on dominant surficial grain size as either active channel<br />
(cobble/gravel/s<strong>and</strong>), cobble/gravel/s<strong>and</strong> deposits, cobble/gravel deposits, gravel/s<strong>and</strong> deposits,<br />
or s<strong>and</strong>/silt deposits as shown on Figure 7. Note that the Blue Lake Creek <strong>and</strong> Becky Creek<br />
delta deposits overlap on the map.<br />
Figure 6. Blue Lake Creek Delta Aerial View.<br />
Blue Lake Reservoir <strong>Sedimentation</strong> <strong>Report</strong> 10 Blue Lake Project Expansion<br />
Watershed GeoDynamics FERC No. 2230<br />
December 2009
B<br />
A C<br />
Figure 7. Existing <strong>and</strong> Estimated Future Delta Deposits.<br />
A’<br />
B’<br />
Blue Lake Reservoir <strong>Sedimentation</strong> <strong>Report</strong> 11 Blue Lake Project Expansion<br />
Watershed GeoDynamics FERC No. 2230<br />
December 2009<br />
C’<br />
D’<br />
D
In lakes <strong>and</strong> reservoirs with fluctuating water levels, some material that was deposited at higher<br />
lake levels is entrained <strong>and</strong> moved out along the delta within the re-established stream channel,<br />
creating a complex <strong>and</strong> dynamic pattern <strong>of</strong> sediment deposits within the active channel portion <strong>of</strong><br />
the fluctuation zone. The lake level at the time <strong>of</strong> sediment inflow controls the elevation at<br />
which the deposits occur. This pattern can be seen in the existing Lake Creek delta deposits on a<br />
pr<strong>of</strong>ile <strong>of</strong> the stream channel <strong>and</strong> adjacent delta surface measured during low lake levels in 2008<br />
(Figure 8). Note that while the active stream channel is graded to the lake level at the time <strong>of</strong> the<br />
survey, there are several remnant mini-delta features evident on the adjacent delta surface, small<br />
delta-shaped lobes <strong>of</strong> cobble, gravel, <strong>and</strong> s<strong>and</strong> that were deposited when the lake level was at<br />
specific elevations when large amounts <strong>of</strong> cobble/gravel bedload entered the lake or was reentrained.<br />
The top <strong>of</strong> each <strong>of</strong> these deposits represents the approximate lake surface elevation<br />
when the deposition occurred.<br />
Elevation (ft)<br />
300<br />
295<br />
290<br />
285<br />
280<br />
275<br />
270<br />
265<br />
260<br />
255<br />
Remnant mini-deltas<br />
250<br />
11,000 11,500 12,000 12,500 13,000 13,500 14,000<br />
Distance from Upper Barrier Falls (ft)<br />
Remnant mini-deltas<br />
Blue Lake Streambed Delta Surface adjacent to Streambed<br />
Figure 8. Surveyed Longitudinal Pr<strong>of</strong>ile <strong>of</strong> Blue Lake Creek <strong>and</strong> Adjacent Delta Deposits<br />
within the Current Reservoir.<br />
The area <strong>and</strong> volume <strong>of</strong> each <strong>of</strong> the existing Blue Lake Creek delta map units was estimated to<br />
provide an idea <strong>of</strong> sediment input rates. Table 1 shows the area, average depth, <strong>and</strong> volume <strong>of</strong><br />
the current Blue Lake Creek delta. Areas/volumes <strong>of</strong> the Becky Creek delta are not included in<br />
the table.<br />
Blue Lake Reservoir <strong>Sedimentation</strong> <strong>Report</strong> 12 Blue Lake Project Expansion<br />
Watershed GeoDynamics FERC No. 2230<br />
December 2009
Table 1. Estimated Area, Depth, <strong>and</strong> Volume <strong>of</strong> Existing Lake Creek Delta Deposits<br />
Map unit Area (acres) Average depth (ft)<br />
Estimated volume<br />
(cu yd)<br />
Active channel<br />
(cobble/gravel/s<strong>and</strong>)<br />
40 5 323,000<br />
Cobble/gravel/s<strong>and</strong> 3 15 73,000<br />
Gravel/s<strong>and</strong> 4 5-8 40,000<br />
S<strong>and</strong>/silt 57 2.5 231,000<br />
Total 104 -- 667,000<br />
The grain size distribution across <strong>and</strong> within the delta varies greatly, but grab samples <strong>of</strong><br />
representative surficial material were taken in the cobble/gravel/s<strong>and</strong>, gravel/s<strong>and</strong>, <strong>and</strong> s<strong>and</strong>/silt<br />
map units to provide some information on the particle size distribution (Figure 9, Appendix A).<br />
The cobble/gravel/s<strong>and</strong> <strong>and</strong> gravel/s<strong>and</strong> samples were dominated by gravel size material (70-80<br />
percent) with the remainder <strong>of</strong> the samples s<strong>and</strong> <strong>and</strong> fines. The s<strong>and</strong>/silt sample was dominantly<br />
s<strong>and</strong> <strong>and</strong> fines.<br />
100%<br />
90%<br />
80%<br />
70%<br />
60%<br />
50%<br />
40%<br />
30%<br />
20%<br />
10%<br />
0%<br />
Delta cobble/gravel/s<strong>and</strong><br />
Fines<br />
(64mm)<br />
100%<br />
90%<br />
80%<br />
70%<br />
60%<br />
50%<br />
40%<br />
30%<br />
20%<br />
10%<br />
0%<br />
Fines<br />
(64mm)<br />
Figure 9. Grain Size Distribution in Existing Delta Deposits.<br />
100%<br />
90%<br />
80%<br />
70%<br />
60%<br />
50%<br />
40%<br />
30%<br />
20%<br />
10%<br />
0%<br />
Fines<br />
(64mm)<br />
Expansion-related Blue Lake Creek Delta (Potentially Inundated Area)<br />
The proposed change in dam height <strong>and</strong> reservoir operations will inundate areas up to elevation<br />
425 feet. As a result, Blue Lake Creek will enter Blue Lake approximately 1.9 miles upstream <strong>of</strong><br />
the current location. It is anticipated that Blue Lake will fluctuate between El 365 <strong>and</strong> 425 under<br />
the proposed Expansion (Figure 5, above). The distribution <strong>and</strong> depth <strong>of</strong> the Blue Lake Creek<br />
Expansion delta deposits 50 years after the change in operations were estimated based on the<br />
following assumptions:<br />
1. The rate <strong>of</strong> sediment input will remain constant, so the volume <strong>and</strong> grain size <strong>of</strong> sediment<br />
in the Expansion delta after 50 years will be approximately equal to sediments in the<br />
existing Blue Lake Creek delta (52 years <strong>of</strong> accumulation).<br />
Blue Lake Reservoir <strong>Sedimentation</strong> <strong>Report</strong> 13 Blue Lake Project Expansion<br />
Watershed GeoDynamics FERC No. 2230<br />
December 2009
2. The operations model provides a reasonable estimate <strong>of</strong> the altered timing <strong>and</strong> magnitude<br />
<strong>of</strong> reservoir fluctuations.<br />
3. The stream pr<strong>of</strong>ile in the new delta will be graded to the new minimum pool level in a<br />
similar manner as the existing delta, with stream gradients between 0.01 <strong>and</strong> 0.005<br />
(similar to the gradients in the existing delta <strong>and</strong> stream channel).<br />
4. The delta deposits in the new delta will begin close to the full pool elevation (in the<br />
existing delta the main depositional area is approximately 700 feet downstream <strong>of</strong> full<br />
pool due to the confined bedrock nature <strong>of</strong> the channel near full pool).<br />
The estimated extent <strong>of</strong> the new Blue Lake Creek delta deposit after 50 years is shown on<br />
Figure 7 (map, above). The future active channel is anticipated to extend from full pool at El<br />
425 (approx. SM 1.9) to maximum drawdown at El 365 (approx. SM 0.65) <strong>and</strong> contain a mix <strong>of</strong><br />
cobble, gravel, <strong>and</strong> s<strong>and</strong>. The cobble <strong>and</strong> gravel would primarily be deposited in the upstream<br />
end <strong>of</strong> the active channel, with the percent <strong>of</strong> s<strong>and</strong> <strong>and</strong> fines increasing downstream in a manner<br />
similar to the existing active channel. Due to the relatively low gradient <strong>of</strong> the stream <strong>and</strong> valley<br />
in this reach, the active channel is anticipated to be relatively wide throughout the new<br />
fluctuation zone <strong>and</strong> would likely have multiple channel threads in some locations. Areas <strong>of</strong><br />
cobble/gravel deposits on both sides <strong>of</strong> the active channel are anticipated to extend<br />
approximately 1,000 feet downstream from full pool <strong>and</strong> average 5 feet thick.<br />
Figure 10 shows the original, current, <strong>and</strong> estimated Expansion-related stream pr<strong>of</strong>ile from the<br />
Upper Barrier Falls down to elevation 200 feet. Note that the length <strong>of</strong> active channel in the<br />
Expansion delta is substantially longer than the existing delta due to the lower gradient in the<br />
Expansion fluctuation zone.<br />
Blue Lake Reservoir <strong>Sedimentation</strong> <strong>Report</strong> 14 Blue Lake Project Expansion<br />
Watershed GeoDynamics FERC No. 2230<br />
December 2009
Elevation (ft)<br />
500<br />
450<br />
400<br />
350<br />
300<br />
250<br />
200<br />
Upper Barrier Falls<br />
150<br />
-100 1,900 3,900 5,900 7,900 9,900 11,900 13,900 15,900 17,900 19,900<br />
Distance from Upper Barrier Falls (ft)<br />
Existing Delta Existing Max Drawdown Existing Spill Pre-Project Pr<strong>of</strong>ile<br />
Expansion Delta Expansion Max Drawdown Expansion Spill<br />
Figure 10. Longitudinal Pr<strong>of</strong>ile <strong>of</strong> Lake Creek Showing Existing <strong>and</strong> Estimated<br />
Expansion-related Delta Deposits.<br />
Two cross sections across the existing delta were measured at locations marked on Figure 7<br />
(map) as section lines A-A’ <strong>and</strong> B-B’ (Figure 11). Two cross sections across the Expansion<br />
delta were estimated at locations marked on Figure 7 (map) as section lines C-C’ <strong>and</strong> D-D’<br />
(Figure 12). Note that the delta surface elevations on both the existing <strong>and</strong> expansion delta are<br />
estimated based on depth <strong>of</strong> deposits; there are very limited current elevation measurements on<br />
these surfaces. Additionally note that the valley is much narrower in the Expansion fluctuation<br />
zone compared to the existing fluctuation zone which will affect delta development (see also<br />
Figure 7).<br />
Blue Lake Reservoir <strong>Sedimentation</strong> <strong>Report</strong> 15 Blue Lake Project Expansion<br />
Watershed GeoDynamics FERC No. 2230<br />
December 2009<br />
Lower Barrier Falls
Elevation (ft)<br />
Elevation (ft)<br />
370<br />
350<br />
330<br />
310<br />
290<br />
270<br />
250<br />
0 500 1000 1500 2000 2500 3000 3500 4000<br />
370<br />
350<br />
330<br />
310<br />
290<br />
270<br />
250<br />
A A'<br />
Distance along Section (ft)<br />
B B'<br />
Current Elev Orig Elev<br />
0 500 1000 1500 2000 2500 3000 3500 4000<br />
Distance along Section (ft)<br />
Figure 11. Cross Sectional Pr<strong>of</strong>iles Across Existing Delta.<br />
Elevation (ft)<br />
Elevation (ft)<br />
490<br />
470<br />
450<br />
430<br />
410<br />
390<br />
370<br />
490<br />
470<br />
450<br />
430<br />
410<br />
390<br />
370<br />
C C'<br />
Current Elev Orig Elev<br />
0 500 1000 1500 2000 2500 3000 3500 4000<br />
D D'<br />
Distance along Section (ft)<br />
Current Elev Orig Elev<br />
0 500 1000 1500 2000 2500 3000 3500 4000<br />
Distance along Section (ft)<br />
Figure 12. Cross Sectional Pr<strong>of</strong>iles Across Expansion-related Delta.<br />
Current Elev Orig Elev<br />
Blue Lake Reservoir <strong>Sedimentation</strong> <strong>Report</strong> 16 Blue Lake Project Expansion<br />
Watershed GeoDynamics FERC No. 2230<br />
December 2009
The area, estimated average depth, <strong>and</strong> estimated volume <strong>of</strong> the Expansion delta map units are<br />
shown in Table 2.<br />
Table 2. Estimated Area, Depth, <strong>and</strong> Volume <strong>of</strong> Future Lake Creek Delta Deposits 50<br />
Years after Expansion<br />
Estimated volume<br />
Map unit Area (acres) Average depth (ft) (cu yd)<br />
Active channel<br />
47 4 304,000<br />
(cobble/gravel/s<strong>and</strong>)<br />
Cobble/gravel/s<strong>and</strong> 7 5 60,000<br />
Gravel/s<strong>and</strong> 10 5 81,000<br />
S<strong>and</strong>/silt 48 2.5 194,000<br />
Total 113 -- 639,000<br />
Immediately following the expansion <strong>of</strong> Blue Lake, the newly inundated Blue Lake Creek<br />
channel will have substrate characteristics similar to those in the current stream channel.<br />
The new delta will form as sediment is carried down the stream <strong>and</strong> is deposited at the new<br />
lake interface. The rate <strong>of</strong> delta growth will depend upon flows; cobble <strong>and</strong> gravel material<br />
is moved during high flows in the stream. It is expected that some sediment will move into<br />
the delta each year, with more sediment transported to the delta during the largest peak<br />
flows. As the delta is building, the substrate in the exposed channel will become gradually<br />
finer over the first few years as gravel, s<strong>and</strong>, <strong>and</strong> fines are deposited over the existing<br />
cobble materials. A detailed analysis <strong>of</strong> delta growth through time was not made due to<br />
insufficient data, however notes from a fisheries biologist trip to Becky Creek following<br />
construction <strong>of</strong> the original dam noted that “approximately 200 feet <strong>of</strong> gravel is now<br />
available” five years following dam closure (trip notes from a Fisheries Aid, SERBS,<br />
Juneau, Blue Lake Trip June 24-27, 1963).<br />
FISH USE IN BLUE LAKE CREEK<br />
Blue Lake <strong>and</strong> its tributaries, including Blue Lake Creek are used by resident rainbow trout. A<br />
detailed discussion <strong>of</strong> fish use is included in the Draft Fisheries <strong>Report</strong> (Wolfe 2009). This<br />
Reservoir <strong>Sedimentation</strong> Study <strong>Report</strong> includes an analysis <strong>of</strong> potential changes to rainbow trout<br />
spawning habitat <strong>and</strong> migration corridors in Blue Lake Creek.<br />
Length <strong>of</strong> Accessible Stream<br />
Under the existing conditions, the Lower Barrier Falls precludes upstream migration <strong>of</strong> fish from<br />
the lake into Blue Lake Creek when lake levels are below approximately 322 feet. Rainbow<br />
trout in the Blue Lake system have been found to spawn between mid-May <strong>and</strong> mid July, with<br />
the peak <strong>of</strong> spawning during June (Wolfe 2009). During this time period, lake levels are below<br />
322 feet during May <strong>and</strong> June in the majority <strong>of</strong> years (Figure 4, in previous section). As a<br />
result, fish in Blue Lake are not able to access upper Blue Lake Creek, so they spawn in the<br />
exposed portion <strong>of</strong> Blue Lake Creek between the falls <strong>and</strong> the lake level at the time <strong>of</strong> spawning.<br />
Incubation occurs between spawning <strong>and</strong> late August to November, depending up on water<br />
temperatures.<br />
Blue Lake Reservoir <strong>Sedimentation</strong> <strong>Report</strong> 17 Blue Lake Project Expansion<br />
Watershed GeoDynamics FERC No. 2230<br />
December 2009
Under expansion operation conditions, Blue Lake is expected to vary between elevation 365 <strong>and</strong><br />
425 feet. These lake levels will cover the Lower Barrier Falls, so resident fish will have access<br />
to exposed areas <strong>of</strong> Blue Lake Creek upstream <strong>of</strong> the lower falls, <strong>and</strong> can migrate up to the<br />
Upper Barrier Falls (SM 2.0).<br />
An analysis <strong>of</strong> the length <strong>of</strong> Blue Lake Creek accessible to fish was made using both existing <strong>and</strong><br />
modeled expansion conditions based on lake levels <strong>and</strong> topographic mapping. Figure 13 shows<br />
accessible stream length during the months <strong>of</strong> May, June, <strong>and</strong> July under existing <strong>and</strong> expansion<br />
conditions for the 10, 25, 50, 75, <strong>and</strong> 90 percent exceedence levels.<br />
Estimated Length Accessible (ft).<br />
10,000<br />
9,000<br />
8,000<br />
7,000<br />
6,000<br />
5,000<br />
4,000<br />
3,000<br />
2,000<br />
1,000<br />
0<br />
90 75 50 25 10<br />
Percent <strong>of</strong> Days Exceeded during Month<br />
May - Existing June - Existing July - Existing<br />
May - Expansion June - Expansion July - Expansion<br />
Figure 13. Accessible Length <strong>of</strong> Blue Lake Creek during Spawning Periods under Existing<br />
<strong>and</strong> Expansion Conditions.<br />
Under existing conditions, the median (50 percent exceedence value) length <strong>of</strong> exposed Blue<br />
Lake Creek bed is 200 feet in May <strong>and</strong> June <strong>and</strong> increases to 10,100 in July as the reservoir<br />
levels rise. The Lower Barrier Falls are covered 10 percent <strong>of</strong> the days in May, 25 percent <strong>of</strong> the<br />
days in June, <strong>and</strong> 50 percent <strong>of</strong> the days in July under existing conditions, allowing fish to<br />
migrate from the lake into approximately 2 miles <strong>of</strong> upper Blue Lake Creek.<br />
Under modeled expansion conditions, the lower Barrier Falls are covered, so fish have access to<br />
the entire exposed length <strong>of</strong> Blue Lake Creek up to the Upper Barrier Falls. Under these<br />
conditions, the accessible length at 50 percent exceedence values decreases from 7,200 feet in<br />
May to 5,200 feet in July. This analysis suggests that a longer length <strong>of</strong> Blue Lake Creek will be<br />
accessible to rainbow trout in Blue Lake during the majority <strong>of</strong> the spawning season under<br />
expansion conditions than under existing conditions.<br />
Blue Lake Reservoir <strong>Sedimentation</strong> <strong>Report</strong> 18 Blue Lake Project Expansion<br />
Watershed GeoDynamics FERC No. 2230<br />
December 2009
Channel Width <strong>and</strong> Substrate Conditions<br />
In addition to the length <strong>of</strong> stream accessible during the spawning season, the channel <strong>and</strong><br />
substrate conditions also affect the amount <strong>of</strong> useable spawning habitat. Wolfe (2009) found that<br />
rainbow trout in the Blue Lake system preferentially spawn in areas where at least 20 percent <strong>of</strong><br />
the substrate is in the 4-32 mm size range. Substrate dominated by small particles (less than 4<br />
mm in size) or particles over 32 mm were not utilized. Due to the dominance <strong>of</strong> coarse substrate<br />
in many <strong>of</strong> the riffle areas in Blue Lake tributaries, spawning <strong>of</strong>ten took place in patches <strong>of</strong><br />
suitable substrate surrounded by areas <strong>of</strong> less suitable substrate. This opportunistic habitat<br />
utilization behavior is common in areas where suitable habitat is limited.<br />
Table 3 shows a comparison <strong>of</strong> the three cross sections measured in the Blue Lake Creek channel<br />
within the existing delta <strong>and</strong> three stream channel transects within the Expansion fluctuation<br />
zone (upstream <strong>of</strong> the current Blue Lake). Stream gradients at transects within the existing delta<br />
ranged from 0.016 to 0.02, higher than gradients in the reach in the Expansion delta area (0.005<br />
to 0.01). Channel widths <strong>and</strong> bankfull depths were larger within the current delta (see also<br />
Figures 14 <strong>and</strong> 15). The substrate size within the existing delta was much finer than in the<br />
current stream channels, <strong>and</strong> provided substrate within the 4-32 mm size range preferred by<br />
spawning rainbow trout (see also Figures 16, 17, <strong>and</strong> 18 <strong>and</strong> Appendix A).<br />
Table 3. Comparison <strong>of</strong> Blue Lake Creek Channel Characteristics in the Exiting Delta <strong>and</strong><br />
Upstream <strong>of</strong> the Lake<br />
Channel Bankfull width Bankfull depth Armor layer D50<br />
Location<br />
Gradient<br />
(ft)<br />
(ft)<br />
(mm)<br />
Channel within existing delta<br />
Delta 3, SM -0.35 0.016 240 1.38 1.0<br />
Delta 2, SM -0.18 0.020 124 2.24 18.4<br />
Delta 1, SM -0.15 0.020 63 3.07 34.1<br />
Existing channel conditions upstream <strong>of</strong> Blue Lake (in area that will become delta)<br />
Stream 1, SM 1.34 0.010 28 0.78 73.5<br />
Stream 2, SM 1.49 0.005 42 0.82 88.0<br />
Stream 3, SM 1.94 0.008 25 1.02 62.9<br />
Blue Lake Reservoir <strong>Sedimentation</strong> <strong>Report</strong> 19 Blue Lake Project Expansion<br />
Watershed GeoDynamics FERC No. 2230<br />
December 2009
Relative Elevation (ft)<br />
Relative Elevation (ft)<br />
Relative Elevation (ft)<br />
12<br />
10<br />
8<br />
6<br />
4<br />
2<br />
0<br />
18<br />
16<br />
14<br />
12<br />
10<br />
8<br />
6<br />
20<br />
18<br />
16<br />
14<br />
12<br />
10<br />
8<br />
Stream 1, SM 1.33<br />
0 50 100 150 200 250<br />
Station (ft)<br />
Stream 2, SM 1.49<br />
0 50 100 150 200 250<br />
Station (ft)<br />
Stream 3, SM 1.94<br />
0 50 100 150 200 250<br />
Station (ft)<br />
Figure 14. Existing Blue Lake Creek Channel Cross Sections Upstream <strong>of</strong> Lake<br />
Blue Lake Reservoir <strong>Sedimentation</strong> <strong>Report</strong> 20 Blue Lake Project Expansion<br />
Watershed GeoDynamics FERC No. 2230<br />
December 2009
Relative Elevation (ft)<br />
Relative Elevation (ft)<br />
Relative Elevation (ft)<br />
102<br />
100<br />
98<br />
96<br />
94<br />
92<br />
90<br />
102<br />
100<br />
98<br />
96<br />
94<br />
92<br />
90<br />
100<br />
98<br />
96<br />
94<br />
92<br />
90<br />
88<br />
Delta 3, SM -0.15<br />
0 50 100 150 200 250 300<br />
Station (ft)<br />
Delta 2, SM -0.18<br />
0 50 100 150 200 250 300<br />
Station (ft)<br />
Delta 1, SM -0.35<br />
0 50 100 150 200 250 300<br />
Station (ft)<br />
Figure 15. Blue Lake Creek Channel Cross Sections in Current Fluctuation Zone.<br />
Blue Lake Reservoir <strong>Sedimentation</strong> <strong>Report</strong> 21 Blue Lake Project Expansion<br />
Watershed GeoDynamics FERC No. 2230<br />
December 2009
100%<br />
90%<br />
80%<br />
70%<br />
60%<br />
50%<br />
40%<br />
30%<br />
20%<br />
10%<br />
0%<br />
Fines<br />
(64mm)<br />
100%<br />
90%<br />
80%<br />
70%<br />
60%<br />
50%<br />
40%<br />
30%<br />
20%<br />
10%<br />
0%<br />
Fines<br />
(64mm)<br />
100%<br />
90%<br />
80%<br />
70%<br />
60%<br />
50%<br />
40%<br />
30%<br />
20%<br />
10%<br />
0%<br />
Fines<br />
(64mm)<br />
Figure 16. Armor Layer Grain Size Distribution in Existing Blue Lake Creek Upstream <strong>of</strong><br />
Lake.<br />
100%<br />
90%<br />
80%<br />
70%<br />
60%<br />
50%<br />
40%<br />
30%<br />
20%<br />
10%<br />
0%<br />
Fines<br />
(64mm)<br />
100%<br />
90%<br />
80%<br />
70%<br />
60%<br />
50%<br />
40%<br />
30%<br />
20%<br />
10%<br />
0%<br />
Fines<br />
(64mm)<br />
100%<br />
90%<br />
80%<br />
70%<br />
60%<br />
50%<br />
40%<br />
30%<br />
20%<br />
10%<br />
0%<br />
Fines<br />
(64mm)<br />
Under proposed Expansion-related operations, Blue Lake Creek would form a new delta within<br />
the El 425-365 foot fluctuation zone. Under current conditions the Blue Lake Creek channel in<br />
this zone is lower gradient, narrower <strong>and</strong> deeper, <strong>and</strong> has larger substrate than the existing delta<br />
Blue Lake Reservoir <strong>Sedimentation</strong> <strong>Report</strong> 22 Blue Lake Project Expansion<br />
Watershed GeoDynamics FERC No. 2230<br />
December 2009
channel. In order to assess the potential channel width, depth, <strong>and</strong> substrate conditions within<br />
this fluctuation zone, it was assumed that the deposition <strong>of</strong> sediment on top <strong>of</strong> the existing<br />
channel substrate would result in channel within the new delta that was wide <strong>and</strong> low gradient<br />
(more similar to the channel at the downstream end <strong>of</strong> the current delta).<br />
Assuming that at least some portions <strong>of</strong> the Blue Lake Creek channel in the new delta would be<br />
as wide as the widest measured current delta channel, the cross section <strong>of</strong> Delta Transect 3 was<br />
input into WINXSPRO with a slope <strong>of</strong> 0.005 to estimate channel hydraulics in a scenario <strong>of</strong> a<br />
wide, very low gradient channel. The 0.005 slope is the lowest slope measured in the existing<br />
delta <strong>and</strong> in the existing Blue Lake Creek channel within the area <strong>of</strong> the expansion scenario<br />
delta. Under the 50% exceedence flow values for the spawning period (May-July), flows <strong>of</strong> 280-<br />
353 cfs would result in an average water depth <strong>of</strong> 1.0-1.2 feet <strong>and</strong> a 125-130 foot wide channel<br />
(Table 4). Under 25% exceedence conditions, flows <strong>of</strong> 184-306 cfs would result in water depths<br />
<strong>of</strong> 0.8-1.1 feet <strong>and</strong> wetted widths <strong>of</strong> 120-127 feet. These water depths are not anticipated to<br />
preclude upstream migration or spawning <strong>of</strong> rainbow trout in the reach.<br />
Table 4. Estimated Flow, Water Depth, <strong>and</strong> Width in Low Gradient Delta Channel.<br />
Month Flow (cfs)<br />
50% Exceedence Values 25% Exceedence Values<br />
Average<br />
Water<br />
Depth (ft)<br />
Wetted<br />
Width<br />
(ft) Flow (cfs)<br />
Average<br />
Water<br />
Depth (ft)<br />
Wetted<br />
Width (ft)<br />
May 283 1.0 125 184 0.8 120<br />
June 280 1.0 125 306 1.1 127<br />
July 353 1.2 130 293 1.1 125<br />
Calculation <strong>of</strong> the size <strong>of</strong> particles that could be entrained by flows within this low slope, wide<br />
channel shows that at 25-50 percent exceedence flows within the spawning period (184-353 cfs),<br />
particles in the 8-16 mm size class would be entrained at the average water depths. It is expected<br />
that, similar to the existing delta channel conditions, substrate within the deepest portion <strong>of</strong> the<br />
channel would be larger than that on the margins <strong>of</strong> the channels <strong>and</strong> would provide a mix <strong>of</strong><br />
substrate across the channel. These size classes are within the range preferred by spawning<br />
rainbow trout, suggesting that there would be spawning habitat available within the Expansion<br />
delta stream channel.<br />
BECKY, BRAD AND SHELDON CREEKS<br />
Fish use has been documented in three other small tributaries to Blue Lake: Becky, Brad,<br />
<strong>and</strong> Sheldon creeks (see locations in Figure 1, above). There are limited flow, channel, <strong>and</strong><br />
delta dimension data available for these three tributaries. A qualitative analysis <strong>of</strong> delta<br />
<strong>and</strong> substrate development in these three streams under expansion conditions is included<br />
below based on comments by the U.S. Forest Service <strong>and</strong> the Alaska Department <strong>of</strong> Fish<br />
<strong>and</strong> Game.<br />
Characteristics <strong>of</strong> Becky, Brad <strong>and</strong> Sheldon creeks in comparison to Blue Lake Creek are<br />
shown in Table 5.<br />
Blue Lake Reservoir <strong>Sedimentation</strong> <strong>Report</strong> 23 Blue Lake Project Expansion<br />
Watershed GeoDynamics FERC No. 2230<br />
December 2009
Table 5. Estimated Spawning Use, Median Monthly Flows, <strong>and</strong> Peak Flows in Blue Lake,<br />
Becky, Brad, <strong>and</strong> Sheldon Creeks.<br />
Blue Lake Becky<br />
Sheldon<br />
Parameter<br />
Creek Creek Brad Creek Creek<br />
Drainage Area (sq mi) 19.9 4.9 3.7 4.0<br />
Number <strong>of</strong> Redds in Delta/Stream<br />
during Spawner Surveys<br />
100/0 85/0 0/0 11/0<br />
May Median Daily Flow (cfs) 283 70 53 57<br />
June Median Daily Flow (cfs) 380 94 71 76<br />
July Median Daily Flow (cfs) 353 87 66 71<br />
Peak 2-year Return Flow (cfs) 3,044 943 746 796<br />
Peak 5-year Return Flow (cfs) 4,077 1,270 1,005 1,073<br />
Peak 10-year Return Flow (cfs) 4,765 1,488 1,178 1,257<br />
Peak 100-year Return Flow (cfs) 6,828 2,139 1,695 1,808<br />
Becky Creek<br />
Becky Creek has a drainage area <strong>of</strong> 4.9 square miles. The existing delta starts in the<br />
confined canyon <strong>and</strong> flows out onto the wide Blue Lake Creek valley <strong>and</strong> merges with the<br />
Blue Lake Creek delta (see Figure 7). Figure 19 shows the Becky Creek delta in the<br />
confined, canyon reach <strong>and</strong> Figure 20 shows the middle portion <strong>of</strong> the Becky Creek delta as<br />
it leaves the canyon <strong>and</strong> flows onto the broad valley.<br />
Figure 19. Photo <strong>of</strong> Becky Creek Delta in Confined Canyon Area.<br />
Blue Lake Reservoir <strong>Sedimentation</strong> <strong>Report</strong> 24 Blue Lake Project Expansion<br />
Watershed GeoDynamics FERC No. 2230<br />
December 2009
Figure 20. Photo <strong>of</strong> Existing Becky Creek Delta.<br />
In the photo <strong>of</strong> the confined canyon portion <strong>of</strong> the Becky Creek delta (Figure 19), several<br />
delta surfaces can be seen. These surfaces form as the lake level fluctuates <strong>and</strong><br />
gravel/cobble material is deposited during high flows. As the lake level drops, the material<br />
in these deltas is re-worked <strong>and</strong> moved downstream resulting in a channel cut through the<br />
gravel/cobble deposits. When the lake level rises again, new delta surfaces are formed <strong>and</strong><br />
the cycle continues.<br />
Several longitudinal pr<strong>of</strong>iles <strong>of</strong> Becky Creek were plotted from existing data, including a<br />
base pr<strong>of</strong>ile from the 1957 topographic mapping <strong>and</strong> 2007 LiDAR data (bold black line in<br />
Figure 21) <strong>and</strong> the 2008 channel pr<strong>of</strong>ile based on a ground survey (brown line). The 2008<br />
survey was extended (dotted brown line) based on the 2008 pr<strong>of</strong>ile, original topography,<br />
<strong>and</strong> photographs <strong>of</strong> the delta. This extension, <strong>and</strong> the Expansion delta surface (green line)<br />
are estimates based on how we envision the Expansion delta surface will appear after 50<br />
years. The Expansion delta will form in a high gradient, confined canyon reach, so the<br />
delta deposits will be quite mobile <strong>and</strong> will likely look similar to those in Figure 19, but<br />
shorter. As such, the length <strong>of</strong> spawning habitat available at the interface <strong>of</strong> Becky Creek<br />
will be less than in the existing project. Gravel <strong>and</strong> cobble will be deposited during high<br />
flow events at the current lake level, <strong>and</strong> then will be re-worked <strong>and</strong> transported<br />
downstream as the lake level drops.<br />
Blue Lake Reservoir <strong>Sedimentation</strong> <strong>Report</strong> 25 Blue Lake Project Expansion<br />
Watershed GeoDynamics FERC No. 2230<br />
December 2009
3500<br />
3000<br />
2500<br />
2000<br />
1500<br />
Distance along creek (ft)<br />
1000<br />
1957 Topo/2007 LiDAR 2008 Survey 2008 Survey Extended<br />
500<br />
450<br />
430<br />
410<br />
390<br />
370<br />
350<br />
330<br />
310<br />
290<br />
270<br />
250<br />
0<br />
Existing Spill Existing Max Drawdown Estimated Expansion Delta<br />
Expansion Spill Expansion Max Drawdown<br />
Figure 21. Estimated Existing <strong>and</strong> Expansion Becky Creek Delta.<br />
Brad Creek<br />
Brad Creek has a drainage area <strong>of</strong> approximately 3.7 square miles. Photos <strong>of</strong> the existing<br />
Brad Creek delta (Figure 22) show several delta surfaces formed at the mouth <strong>of</strong> the<br />
canyon where Brad Creek enters the wider valley floor. It appears that moderate Brad<br />
Creek flows may not be sufficient to transport the cobble <strong>and</strong> gravel material in the delta;<br />
the existing delta is not graded to low lake levels like the Blue Lake or Becky creek deltas.<br />
Blue Lake Reservoir <strong>Sedimentation</strong> <strong>Report</strong> 26 Blue Lake Project Expansion<br />
Watershed GeoDynamics FERC No. 2230<br />
December 2009<br />
Elevation (ft)
Figure 22. Photo <strong>of</strong> Existing Brad Creek Delta.<br />
A longitudinal pr<strong>of</strong>ile <strong>of</strong> Brad Creek was plotted from the 1957/2007 data (Figure 23).<br />
There are no data on the existing delta pr<strong>of</strong>ile, but an estimated delta pr<strong>of</strong>ile was plotted<br />
based on the photograph in Figure 22. The Expansion delta will be formed in a higher<br />
gradient, confined section <strong>of</strong> Brad Creek <strong>and</strong> will likely have similar characteristics to the<br />
mobile delta deposits in the canyon section <strong>of</strong> the current Becky Creek delta (described in<br />
the previous section). A lower gradient section <strong>of</strong> Brad Creek (at approximately elevation<br />
400) may retain some <strong>of</strong> the gravel <strong>and</strong> cobble materials through the fluctuating lake levels.<br />
The stream length <strong>of</strong> spawning habitat available at the interface <strong>of</strong> Brad Creek will be<br />
approximately equal to the existing project.<br />
Blue Lake Reservoir <strong>Sedimentation</strong> <strong>Report</strong> 27 Blue Lake Project Expansion<br />
Watershed GeoDynamics FERC No. 2230<br />
December 2009
3500<br />
3000<br />
2500<br />
2000<br />
1500<br />
Distance along creek (ft)<br />
1000<br />
500<br />
1957 Topo/2007 LiDAR Estimated Existing Delta Existing Spill<br />
Existing Max Drawdown Estimated Expansion Delta Expansion Spill<br />
Expansion Max Drawdown<br />
Figure 23. Estimated Existing <strong>and</strong> Expansion Brad Creek Delta.<br />
500<br />
450<br />
400<br />
350<br />
300<br />
250<br />
0<br />
Sheldon Creek<br />
Sheldon Creek has a drainage area <strong>of</strong> approximately 4 square miles. The existing delta<br />
deposits are quite thin <strong>and</strong> spread across the broad valley floor (Figure 24).<br />
Figure 24. Photo <strong>of</strong> Existing Sheldon Creek Delta.<br />
Blue Lake Reservoir <strong>Sedimentation</strong> <strong>Report</strong> 28 Blue Lake Project Expansion<br />
Watershed GeoDynamics<br />
December 2009<br />
FERC No. 2230<br />
Elevation (ft)
A longitudinal pr<strong>of</strong>ile <strong>of</strong> Sheldon Creek was plotted from the 1957/2007 topographic data<br />
(Figure 25). No data on the Sheldon Creek delta are available; an estimated existing delta<br />
surface was plotted based on photographs. The Expansion delta will be formed in a<br />
confined, higher gradient section <strong>of</strong> Sheldon Creek <strong>and</strong> will likely have similar<br />
characteristics to the current Becky Creek delta in the canyon reach. The Expansion delta<br />
in Sheldon Creek will be mobile; the substrate will be re-worked as the lake level<br />
fluctuates. The stream length <strong>of</strong> spawning habitat available at the interface <strong>of</strong> Sheldon<br />
Creek will be less than is available in the existing project.<br />
3000<br />
2500<br />
2000<br />
1500<br />
Distance along creek (ft)<br />
1000<br />
500<br />
1957 Topo/2007 LiDAR Estimated Existing Delta Existing Spill<br />
Existing Max Drawdown Estimated Expansion Delta Expansion Spill<br />
Expansion Max Drawdown<br />
Figure 25. Estimated Existing <strong>and</strong> Expansion Sheldon Creek Delta.<br />
SUMMARY<br />
The <strong>City</strong> <strong>and</strong> <strong>Borough</strong> <strong>of</strong> <strong>Sitka</strong> Electric Department is evaluating raising the dam at the Blue<br />
Lake Hydroelectric Project as much as 83 feet above the current dam height to provide additional<br />
generation capacity. Operation <strong>of</strong> the Blue Lake Project under proposed Expansion conditions<br />
would inundate approximately 1.9 miles <strong>of</strong> the current Blue Lake Creek bed upstream <strong>of</strong> the<br />
existing Blue Lake <strong>and</strong> change the location <strong>of</strong> reservoir sedimentation <strong>and</strong> delta development.<br />
Rainbow trout use the current Blue Lake Creek delta for spawning <strong>and</strong> incubation. The<br />
objectives <strong>of</strong> this Reservoir <strong>Sedimentation</strong> Study are to determine the extent <strong>and</strong> estimated<br />
Blue Lake Reservoir <strong>Sedimentation</strong> <strong>Report</strong> 29 Blue Lake Project Expansion<br />
Watershed GeoDynamics FERC No. 2230<br />
December 2009<br />
0<br />
500<br />
450<br />
400<br />
350<br />
300<br />
250<br />
Elevation (ft)
volume <strong>of</strong> sediment deposition <strong>and</strong> erosion in the Expansion-related Blue Lake Creek delta; <strong>and</strong><br />
evaluate probable fish habitat <strong>and</strong> accessibility in the future Blue Lake Creek fluctuation zone.<br />
An estimated 667,000 cubic yards <strong>of</strong> cobble/gravel/s<strong>and</strong>/fines has been deposited in the current<br />
Blue Lake Creek delta over the 52 years since current Project operations began. Delta deposits<br />
were estimated to range from at least 15 feet deep near the head <strong>of</strong> the delta to 2-3 feet deep<br />
deposits <strong>of</strong> fines along the margins <strong>of</strong> the active channel area. The median length <strong>of</strong> exposed<br />
channel under current operations during the May-July spawning season is 200 feet in May <strong>and</strong><br />
June <strong>and</strong> 10,100 feet in July as reservoir level rise through this time period. Stream gradients at<br />
three measured transects ranged from 0.016 to 0.020, with bankfull widths <strong>of</strong> 63-240 feet, depths<br />
<strong>of</strong> 1.38 to 3.07 feet <strong>and</strong> armor layer D50 ranging from 1-34 mm.<br />
The extent <strong>and</strong> depth <strong>of</strong> delta deposits following 50 years <strong>of</strong> proposed Expansion-related<br />
operations was estimated based on valley width <strong>and</strong> gradient conditions in the current vs.<br />
proposed fluctuation zone assuming a similar rate <strong>of</strong> sediment input. It was assumed that the<br />
active channel in the Expansion delta would be similar to the widest measured transect in the<br />
existing delta, with stream gradients ranging from 0.005 to 0.01, similar to the existing delta <strong>and</strong><br />
stream channel. Delta deposits were estimated to be 2-10 feet deep across the new delta.<br />
Under modeled expansion conditions, the median length <strong>of</strong> exposed Blue Lake Creek bed<br />
decreases from 7,200 feet in May to 5,200 feet in July. This suggests that a longer length <strong>of</strong> Blue<br />
Lake Creek would be accessible to rainbow trout in Blue Lake during the spawning season under<br />
Expansion operations than under existing conditions. Assuming a wide (240 ft bankfull width)<br />
low gradient (0.005) channel would exist in the Expansion delta, water depths during migration<br />
<strong>and</strong> spawning were computed to range from 0.8-1.2 feet under 25-50% exceedence flows during<br />
the May-June-July spawning period which should not inhibit upstream migration <strong>of</strong> rainbow<br />
trout. It is possible that some areas <strong>of</strong> the new channel may be wider <strong>and</strong> braided than the<br />
modeled cross section, but there are wider, low gradient, braided areas within the downstreammost<br />
portions <strong>of</strong> the existing delta stream channel that do not appear to impede migration under<br />
existing conditions.<br />
Estimated shear stress under the modeled Expansion-related channel hydraulic <strong>and</strong> flow<br />
conditions during May-June would result in entrainment <strong>of</strong> particles in the 8-16 mm size class at<br />
the average water depths. It is expected that, similar to the existing delta channel conditions,<br />
substrate within the deepest portion <strong>of</strong> the new delta channel would be larger than that on the<br />
margins <strong>of</strong> the channel <strong>and</strong> would provide a mix <strong>of</strong> substrate across the channel. These size<br />
classes are within the range preferred by spawning rainbow trout, suggesting that there would be<br />
spawning habitat available within the Expansion delta stream channel.<br />
Future sediment deposition <strong>and</strong> spawning habitat were considered for Becky, Brad <strong>and</strong><br />
Sheldon Creek with the limited data available. Expansion related spawning conditions will<br />
be similar to those encountered during 2005 relicensing studies (CBS 2005, Wolfe 2009).<br />
During this time spawning was concentrated along shorter lengths <strong>and</strong> in the case <strong>of</strong> Brad<br />
Creek along a steeper gradient. With the exception <strong>of</strong> Becky Creek, all future spawning<br />
will take place at a gradient that was initially less then that where spawning occurred at<br />
Brad Creek in 2005.<br />
Blue Lake Reservoir <strong>Sedimentation</strong> <strong>Report</strong> 30 Blue Lake Project Expansion<br />
Watershed GeoDynamics FERC No. 2230<br />
December 2009
CONSULTATION<br />
Comments on this report were received from Alaska Department <strong>of</strong> Fish <strong>and</strong> Game<br />
(ADF&G) dated September 30, 2009 <strong>and</strong> from USDA Forest Service (USFS) on October 2,<br />
2009. Comments are listed in Table 6 with notations <strong>of</strong> how they were addressed in<br />
preparation <strong>of</strong> this <strong>final</strong> report.<br />
Table 6. Reviewer Comments on Draft Reservoir <strong>Sedimentation</strong> <strong>Report</strong><br />
Comment<br />
Number Comment Summary Response <strong>and</strong> <strong>Report</strong> Location<br />
ADF&G 1 Discuss sedimentation <strong>and</strong> A discussion <strong>of</strong> Becky, Brad, <strong>and</strong> Sheldon<br />
habitat effects <strong>of</strong> dam raise in creeks has been added to the report on pages<br />
Becky, Brad, <strong>and</strong> Sheldon<br />
creeks.<br />
23 through 29.<br />
ADF&G 2 Statement on greater length <strong>of</strong><br />
Blue Lake Creek habitat after<br />
dam raise.<br />
Agreed.<br />
ADF&G 3 Discuss how Blue Lake Creek A discussion <strong>of</strong> delta formation over time<br />
habitat may change over the next<br />
50 years, using information from<br />
original Project time frame.<br />
has been included on page17.<br />
USFS 1 Address extent <strong>of</strong> erosion on The erosion within the fluctuation zone<br />
entire reservoir perimeter. around the reservoir perimeter is estimated<br />
to cover 184 acres. The effects <strong>of</strong> this<br />
erosion is discussed in the Boundary Rim<br />
Stability Survey conducted by R&M<br />
Consultants, Inc. Oct 2009. This report is<br />
included in the Geotechnical investigation.<br />
USFS 2 Statement about discrepancies in The peak flow analysis used regional<br />
peak flows in Blue Lake Creek regression equations to predict peak flows<br />
in the streams, so the reduction in flow by<br />
Blue Lake should not affect the peak flow<br />
analysis.<br />
Estimated peak flows/discussion in Blue<br />
Lake Creek <strong>and</strong> tributaries are included on<br />
page 10 <strong>and</strong> 24.<br />
Peak flows do indeed shape the channel<br />
configuration. It is assumed that the cross<br />
sections measured in the existing delta (<strong>and</strong><br />
used in the hydraulic analysis) are<br />
representative <strong>of</strong> a future delta channel<br />
formed under a range <strong>of</strong> low, median, <strong>and</strong><br />
peak flows.<br />
Blue Lake Reservoir <strong>Sedimentation</strong> <strong>Report</strong> 31 Blue Lake Project Expansion<br />
Watershed GeoDynamics FERC No. 2230<br />
December 2009
Comment<br />
Number Comment Summary Response <strong>and</strong> <strong>Report</strong> Location<br />
USFS 3 Comment on use <strong>of</strong> daily The hydraulic <strong>and</strong> sediment transport<br />
average flows <strong>and</strong> need to use calculations were made for median daily<br />
peak flows.<br />
flows during the spawning periods to<br />
provide information about water width <strong>and</strong><br />
depth during normal spawning conditions.<br />
Peak flows do indeed shape the channel<br />
configuration. It is assumed that the cross<br />
sections measured in the existing delta (<strong>and</strong><br />
used in the hydraulic analysis) are<br />
representative <strong>of</strong> a future delta channel<br />
formed under a range <strong>of</strong> low, median, <strong>and</strong><br />
peak flows.<br />
USFS 4 Stream gradient contradictions. The delta channel gradients listed in Table 3<br />
(page 19) is the local gradient surveyed at<br />
those three particular delta cross sections<br />
which are located on the steeper part <strong>of</strong> the<br />
existing delta (see Figure 10). The<br />
Assumption 3 range <strong>of</strong> delta gradients (page<br />
14) was used in the XSPRO analysis to<br />
represent the gradient <strong>of</strong> the future<br />
(expansion) delta since the expansion delta<br />
will be constructed in a lower-gradient<br />
valley than the existing delta (again see<br />
Figure 10). [The gradient for Reach 3 in<br />
Table 11 <strong>of</strong> the Fisheries <strong>Report</strong> was<br />
incorrectly listed as 0.1 percent – this has<br />
been corrected in that report.]<br />
USFS 5 Comment on Figure 7 <strong>and</strong> The predicted lower end <strong>of</strong> the delta was<br />
predicted extent <strong>of</strong> new (post- graded to the maximum drawdown<br />
Expansion) delta.<br />
elevation under expansion conditions which<br />
is above the lower barrier falls (similar to<br />
how the existing delta is graded to the<br />
current maximum drawdown elevation<br />
based on the topographic surveys – See<br />
Figure 10). There would be some<br />
deposition below the maximum drawdown<br />
elevation, but we do not have any<br />
information on the current extent <strong>of</strong> these<br />
deposits (either volume or extent), so they<br />
were not included in either the current or<br />
future analysis.<br />
Blue Lake Reservoir <strong>Sedimentation</strong> <strong>Report</strong> 32 Blue Lake Project Expansion<br />
Watershed GeoDynamics FERC No. 2230<br />
December 2009
Comment<br />
Number Comment Summary Response <strong>and</strong> <strong>Report</strong> Location<br />
USFS 6 Effects <strong>of</strong> fish egg desiccation as It is possible that some redds may desiccate<br />
flows recede.<br />
if flows drop before the reservoir rises.<br />
However, the warming air <strong>and</strong> water<br />
temperatures that initiate the trout spawning<br />
in the reservoir also cause an increase<br />
inflow to the reservoir causing it to rise <strong>and</strong><br />
cover the redds, similar to the existing<br />
conditions.<br />
USFS 7 Comment on exposed channel The accessible length increases when the<br />
length as reservoir rises. reservoir rises enough to inundate the lower<br />
falls, allowing fish access to upstream areas.<br />
LITERATURE CITED<br />
Curran, J.H., D. F. Meyer, <strong>and</strong> G.D. Tasker, 2003. Estimating the magnitude <strong>and</strong> frequency <strong>of</strong><br />
peak streamflows for ungaged sites on streams in Alaska <strong>and</strong> conterminous basins in<br />
Canada. U.S. Geological Survey Water-Resources Investigations <strong>Report</strong> 03-4188.<br />
Hardy, T., P. Panja, <strong>and</strong> D. Mathias, 2005. WinXSPRO, A channel cross section analyzer, user’s<br />
manual, Version 3.0. USDA Forest Service, Rocky Mountain Research Station, General<br />
Technical <strong>Report</strong> RMRS-GTR-147. January 2005.<br />
Neal, EG., M.T. Walter, <strong>and</strong> C. C<strong>of</strong>feen, 2002. Linking the Pacific decadal oscillation to<br />
seasonal stream discharge patterns in Southeast Alaska. Journal <strong>of</strong> Hydrology vol. 263,<br />
pp. 188-197.<br />
Wolfe, K., 2009. Draft 2008 Fisheries Studies <strong>Report</strong>, Blue Lake Project (FERC No. 2230)<br />
Expansion. <strong>Report</strong> prepared for <strong>City</strong> <strong>and</strong> <strong>Borough</strong> <strong>of</strong> <strong>Sitka</strong> Electric Department, May,<br />
2009.<br />
Blue Lake Reservoir <strong>Sedimentation</strong> <strong>Report</strong> 33 Blue Lake Project Expansion<br />
Watershed GeoDynamics FERC No. 2230<br />
December 2009
Blue Lake Creek Delta Sediment Samples<br />
Station Blue Lake Delta Transect 1, SM-0.15<br />
D65= 54.9 mm<br />
Armor Layer D50= 34.1 mm<br />
Size (mm) Percent Cum % Avg size No.<br />
1 1% 1% 0.01 1<br />
2 0% 1% 0.00 0<br />
4 2% 3% 0.10 2<br />
5.7 1% 4% 0.07 1<br />
8 6% 10% 0.57 6<br />
11 6% 16% 0.81 6<br />
16 5% 21% 0.97 5<br />
22.6 7% 28% 1.91 7<br />
32 18% 46% 6.93 18<br />
45 25% 71% 13.63 25<br />
64 13% 84% 10.01 13<br />
90 7% 91% 7.63 7<br />
128 4% 95% 6.16 4<br />
180 5% 100% 10.90 5<br />
256 0% 100% 0.00 0<br />
59.69 mm 100<br />
0.1958 ft<br />
Percent Passing<br />
Blue Lake Delta Transect 1, SM-<br />
0.15<br />
December 2009<br />
D65= 21.7 mm<br />
Sub-Armor Layer D50= 12.4 mm<br />
Weight<br />
Avg<br />
Size (mm) (g) Percent Cum % size<br />
128 0 0% 100% 0<br />
64 1,020 25% 100% 23.8829<br />
37.5 563 14% 75% 6.96884<br />
16 1,052 26% 61% 6.86366<br />
8 535 13% 36% 1.56585<br />
4 325 8% 23% 0.47561<br />
2 234 6% 15% 0.17122<br />
1 200 5% 9% 0.07317<br />
0.5 121 3% 4% 0.02213<br />
0.25 37 1% 1% 0.00338<br />
0.125 7 0% 0% 0.00032<br />
0.063 2 0% 0% 4.6E-05<br />
0.003 4 0% 0% 3.2E-05<br />
pan 4,100<br />
Blue Lake Creek Reservoir <strong>Sedimentation</strong> <strong>Report</strong><br />
40.03 mm<br />
Page A-1 Appendix A. Grain Size Data<br />
100%<br />
80%<br />
60%<br />
40%<br />
20%<br />
0%<br />
0.1 1 10 100 1000<br />
Size (mm)<br />
Armor Layer<br />
Sub-Armor Layer
0.1313 ft<br />
Blue Lake Creek Delta Sediment Samples<br />
Station Blue Lake Delta Transect 2, SM-0.18<br />
D65= 29.3 mm<br />
Armor Layer D50= 18.4 mm<br />
Size (mm) Percent Cum % Avg size No.<br />
1 31% 31% 0.31 34<br />
2 0% 31% 0.00 0<br />
4 1% 32% 0.04 1<br />
5.7 0% 32% 0.00 0<br />
8 4% 36% 0.35 4<br />
11 6% 42% 0.75 6<br />
16 5% 46% 0.89 5<br />
22.6 10% 56% 2.78 11<br />
32 12% 69% 4.63 13<br />
45 14% 82% 7.57 15<br />
64 8% 91% 6.42 9<br />
90 4% 94% 4.04 4<br />
128 5% 99% 7.13 5<br />
180 1% 100% 2.02 1<br />
256 0% 100% 0.00 0<br />
36.94 mm 108<br />
0.1212 ft<br />
Percent Passing<br />
Blue Lake Delta Transect 2, SM-<br />
0.18<br />
December 2009<br />
D65= 9.3 mm<br />
Sub-Armor Layer D50= 6.0 mm<br />
Weight<br />
Avg<br />
Size (mm) (g) Percent Cum % size<br />
128 0 0% 100% 0<br />
64 0 0% 100% 0<br />
37.5 0 0% 100% 0<br />
16 1,610 42% 100% 11.1113<br />
8 654 17% 58% 2.02477<br />
4 459 12% 42% 0.71053<br />
2 410 11% 30% 0.31734<br />
1 375 10% 19% 0.14512<br />
0.5 216 6% 9% 0.0418<br />
0.25 83 2% 4% 0.00803<br />
0.125 41 1% 2% 0.00198<br />
0.063 11 0% 1% 0.00027<br />
0.003 17 0% 0% 0.00014<br />
Blue Lake Creek Reservoir <strong>Sedimentation</strong> <strong>Report</strong> Page A-2 Appendix A. Grain Size Data<br />
100%<br />
90%<br />
80%<br />
70%<br />
60%<br />
50%<br />
40%<br />
30%<br />
20%<br />
10%<br />
0%<br />
0.1 1 10 100 1000<br />
Armor<br />
Size (mm)<br />
Layer<br />
Sub-Armor Layer
pan 3,876 14.36 mm<br />
0.0471 ft<br />
Blue Lake Creek Delta Sediment Samples<br />
Station Blue Lake Delta Transect 3, SM -0.35<br />
D65= 14.8 mm<br />
Armor Layer D50= 1.0 mm<br />
Size (mm) Percent Cum % Avg size No.<br />
1 56% 56% 0.56 100<br />
2 0% 56% 0.00 0<br />
4 1% 56% 0.03 1<br />
5.7 1% 57% 0.08 2<br />
8 2% 59% 0.16 3<br />
11 3% 62% 0.38 5<br />
16 4% 66% 0.86 8<br />
22.6 4% 71% 1.21 8<br />
32 10% 81% 3.85 18<br />
45 10% 91% 5.45 18<br />
64 3% 94% 2.57 6<br />
90 3% 97% 3.63 6<br />
128 2% 99% 2.57 3<br />
180 1% 100% 2.42 2<br />
256 0% 100% 0.00 0<br />
23.75 mm 180<br />
0.0779 ft<br />
Percent Passing<br />
Blue Lake Delta Transect 3, SM<br />
-0.35<br />
December 2009<br />
D65= 8.8 mm<br />
Sub-Armor Layer D50= 5.0 mm<br />
Weight<br />
Avg<br />
Size (mm) (g) Percent Cum % size<br />
128 0 0% 100% 0<br />
64 0 0% 100% 0<br />
37.5 39 1% 100% 0.68947<br />
16 1,068 38% 99% 10.0551<br />
8 415 15% 61% 1.75276<br />
4 275 10% 46% 0.58073<br />
2 241 8% 37% 0.25447<br />
1 266 9% 28% 0.14059<br />
0.5 285 10% 19% 0.07517<br />
0.25 159 6% 9% 0.02101<br />
0.125 55 2% 3% 0.00361<br />
0.063 16 1% 1% 0.00053<br />
Blue Lake Creek Reservoir <strong>Sedimentation</strong> <strong>Report</strong> Page A-3 Appendix A. Grain Size Data<br />
100%<br />
90%<br />
80%<br />
70%<br />
60%<br />
50%<br />
40%<br />
30%<br />
20%<br />
10%<br />
0%<br />
0.1 1 10 100 1000<br />
Armor Size (mm) Layer<br />
Sub-Armor Layer
0.003 23 1% 1% 0.00026<br />
2,841 13.57 mm<br />
0.0445 ft<br />
Blue Lake Creek Delta Sediment Samples<br />
Station Delta Material - coble/gravel<br />
December 2009<br />
D65= mm<br />
Delta Material - coble/gravel<br />
Armor Layer D50= mm<br />
Size (mm) Percent Cum % Avg size No.<br />
100%<br />
1<br />
2 not taken<br />
80%<br />
4<br />
60%<br />
8<br />
16<br />
40%<br />
32<br />
20%<br />
64<br />
0%<br />
128<br />
0.1 1 10 100 1000<br />
256<br />
mm<br />
ft<br />
0<br />
Size (mm)<br />
Armor Layer<br />
Sub-Armor Layer<br />
D65= 11.4 mm<br />
Sub-Armor Layer D50= 7.8 mm<br />
Weight<br />
Avg<br />
Size (mm) (g) Percent Cum % size<br />
128 0 0% 100% 0<br />
64 0 0% 100% 0<br />
37.5 519 15% 100% 7.82745<br />
16 1,144 34% 85% 9.09817<br />
8 467 14% 51% 1.66583<br />
4 319 9% 37% 0.56903<br />
2 220 7% 27% 0.19651<br />
1 220 7% 21% 0.09794<br />
0.5 185 6% 14% 0.04126<br />
0.25 78 2% 9% 0.00868<br />
0.125 38 1% 6% 0.0021<br />
0.063 50 1% 5% 0.00139<br />
0.003 125 4% 4% 0.00122<br />
pan 3,363 19.51 mm<br />
Blue Lake Creek Reservoir <strong>Sedimentation</strong> <strong>Report</strong><br />
0.0640 ft<br />
Page A-4 Appendix A. Grain Size Data<br />
Percent Passing
December 2009<br />
Blue Lake Creek Reservoir <strong>Sedimentation</strong> <strong>Report</strong> Page A-5 Appendix A. Grain Size Data
Blue Lake Creek Delta Sediment Samples<br />
Station Delta Material - gravel/s<strong>and</strong><br />
D65= mm<br />
Armor Layer D50= mm<br />
Size (mm) Percent Cum % Avg size No.<br />
1<br />
2<br />
4 not taken<br />
8<br />
16<br />
32<br />
64<br />
128<br />
256<br />
mm 0<br />
ft<br />
D65= 11.6 mm<br />
Sub-Armor Layer D50= 8.0 mm<br />
Weight<br />
Avg<br />
Size (mm) (g) Percent Cum % size<br />
128 0 0% 100% 0<br />
64 0 0% 100% 0<br />
37.5 434 17% 100% 8.54665<br />
16 850 33% 83% 8.82876<br />
8 423 16% 50% 1.97283<br />
4 68 3% 34% 0.15836<br />
2 24 1% 31% 0.02763<br />
1 63 2% 30% 0.03677<br />
0.5 104 4% 28% 0.03032<br />
0.25 242 9% 24% 0.03529<br />
0.125 153 6% 14% 0.01113<br />
0.063 67 3% 8% 0.00245<br />
0.003 147 6% 6% 0.00188<br />
pan 2,574 19.65 mm<br />
0.0645 ft<br />
Percent Passing<br />
Delta Material - gravel/s<strong>and</strong><br />
100%<br />
90%<br />
80%<br />
70%<br />
60%<br />
50%<br />
40%<br />
30%<br />
20%<br />
10%<br />
0%<br />
0.1 1 10 100 1000<br />
Size (mm)<br />
Armor Layer<br />
Sub-Armor Layer<br />
December 2009<br />
Blue Lake Creek Reservoir <strong>Sedimentation</strong> <strong>Report</strong> Page A-6 Appendix A. Grain Size Data
Blue Lake Creek Delta Sediment Samples<br />
Station Delta Material - gravel/s<strong>and</strong><br />
D65= mm<br />
Armor Layer D50= mm<br />
Size (mm) Percent Cum % Avg size No.<br />
1<br />
2<br />
4 not taken<br />
8<br />
16<br />
32<br />
64<br />
128<br />
256<br />
512<br />
mm 0<br />
ft<br />
D65= 0.1 mm<br />
Sub-Armor Layer D50= 0.03 mm<br />
Weight<br />
Avg<br />
Size (mm) (g) Percent Cum % size<br />
128 0 0% 100% 0<br />
64 0 0% 100% 0<br />
37.5 0 0% 100% 0<br />
16 0 0% 100% 0<br />
8 0 0% 100% 0<br />
4 3 0% 100% 0.0238<br />
2 5 1% 100% 0.02239<br />
1 12 2% 99% 0.0289<br />
0.5 7 1% 97% 0.00823<br />
0.25 12 2% 96% 0.00706<br />
0.125 125 20% 94% 0.03683<br />
0.063 217 34% 74% 0.03198<br />
0.003 257 40% 40% 0.0133<br />
pan 638 0.17 mm<br />
0.0006 ft<br />
Percent Passing<br />
Delta Material - gravel/s<strong>and</strong><br />
100%<br />
80%<br />
60%<br />
40%<br />
20%<br />
0%<br />
0.001 0.01 0.1 1 10<br />
Size (mm)<br />
Armor Layer<br />
Sub-Armor Layer<br />
December 2009<br />
Blue Lake Creek Reservoir <strong>Sedimentation</strong> <strong>Report</strong> Page A-7 Appendix A. Grain Size Data