Porirua Harbour: Intertidal Sediment Monitoring 2011/12 - Greater ...
Porirua Harbour: Intertidal Sediment Monitoring 2011/12 - Greater ...
Porirua Harbour: Intertidal Sediment Monitoring 2011/12 - Greater ...

You also want an ePaper? Increase the reach of your titles
YUMPU automatically turns print PDFs into web optimized ePapers that Google loves.
Wriggle<br />
<strong>Porirua</strong> <strong>Harbour</strong><br />
<strong>Intertidal</strong> <strong>Sediment</strong> <strong>Monitoring</strong> <strong>2011</strong>/<strong>12</strong><br />
Prepared<br />
for<br />
<strong>Greater</strong><br />
Wellington<br />
Regional<br />
Council<br />
July<br />
20<strong>12</strong><br />
coastalmanagement
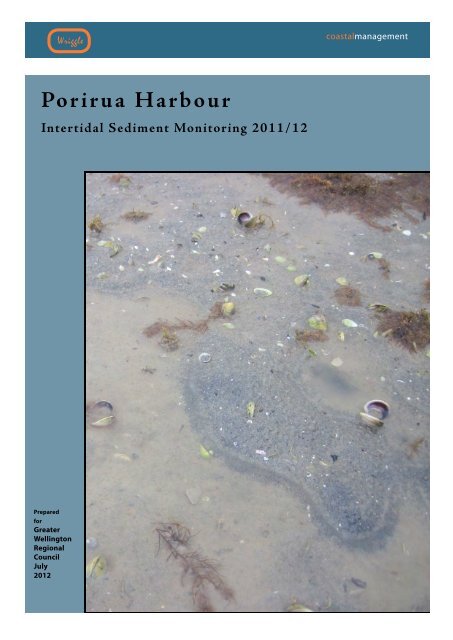
Cover Photo: Pauatahanui Inlet - Fine surface sediment deposits near the Horokiri Stream mouth.
<strong>Porirua</strong> <strong>Harbour</strong> Estuary<br />
<strong>Intertidal</strong> <strong>Sediment</strong> <strong>Monitoring</strong> <strong>2011</strong>/<strong>12</strong><br />
Prepared for<br />
<strong>Greater</strong> Wellington Regional Council<br />
By<br />
Leigh Stevens and Barry Robertson<br />
<strong>Porirua</strong> <strong>Harbour</strong> Estuary, Onepoto Arm - lower estuary.<br />
Wriggle Limited, PO Box 1622, Nelson 7040, NZ. Ph 03 545 6315, 021 417 936; 0275 417 935, www.wriggle.co.nz<br />
Wriggle<br />
coastalmanagement iii
Contents<br />
1. Introduction and methods . . . . . . . . . . . . . . . . . . . . . . . . . . . . . . . . . . . . . . . 1<br />
2. Results, Rating and Management . . . . . . . . . . . . . . . . . . . . . . . . . . . . . . . . . . . . 5<br />
List of Figures<br />
Figure 1. Location of fine scale sites and sediment plates established in 2007/8, and 20<strong>12</strong> in <strong>Porirua</strong> Estuary. . 3<br />
Figure 2. <strong>Sediment</strong>ation rate (mean and range) from plate data, <strong>Porirua</strong> <strong>Harbour</strong> Estuary (2007/8-20<strong>12</strong>). . . . 5<br />
Figure 3. Mean change in sediment showing trends over buried plates from 2007/8-20<strong>12</strong>. . . . . . . . . . . . . . 5<br />
Figure 4. RPD depth (mean and range), <strong>Porirua</strong> <strong>Harbour</strong> Estuary fine scale sites, (2008-20<strong>12</strong>). . . . . . . . . . . 5<br />
Figure 5. Grain size, <strong>Porirua</strong> <strong>Harbour</strong> Estuary fine scale and sediment plate monitoring sites (2008-20<strong>12</strong>). . . . . 6<br />
List of Tables<br />
Table 1. Location of buried sediment plates, <strong>Porirua</strong> <strong>Harbour</strong> Estuary (No. refers to sites shown in Figure 1).. . . 2<br />
Table 2. <strong>Intertidal</strong> sediment plate data, <strong>Porirua</strong> <strong>Harbour</strong> Estuary (2007-20<strong>12</strong>). . . . . . . . . . . . . . . . . . . 6<br />
Table 3. RPD depth and grain size results, <strong>Porirua</strong> <strong>Harbour</strong> Estuary (21-24 Feb. 20<strong>12</strong>). . . . . . . . . . . . . . . 6<br />
Table 4. Inaugural baseline depths of sedimentation plates established in early 20<strong>12</strong>, <strong>Porirua</strong> <strong>Harbour</strong> Estuary. . 6<br />
Wriggle<br />
coastalmanagement iv
1. IntRoduCtIon and MEtHodS<br />
<strong>Porirua</strong> <strong>Harbour</strong> Estuary<br />
Vulnerability Assessment<br />
Identifies issues and recommends<br />
monitoring and management.<br />
Completed in 2007 (Robertson and<br />
Stevens 2007)<br />
<strong>Porirua</strong> Estuary Issues<br />
Moderate eutrophication<br />
Excessive sedimentation<br />
Habitat Loss (saltmarsh, dune and<br />
terrestrial margin)<br />
Broad Scale<br />
Mapping<br />
<strong>Sediment</strong> type<br />
Saltmarsh<br />
Seagrass<br />
Macroalgae<br />
Land margin<br />
5 -10 yearly<br />
First undertaken<br />
in 2008.<br />
Next survey 2013.<br />
<strong>Monitoring</strong><br />
Fine Scale<br />
<strong>Monitoring</strong><br />
Grain size, RPD,<br />
Organic Content<br />
Nutrients, Metals,<br />
Invertebrates,<br />
Macroalgae,<br />
<strong>Sediment</strong>ation,<br />
4yr Baseline then<br />
5 yearly<br />
3 year baseline<br />
completed 2009/10.<br />
Next survey 2015.<br />
Sedimetation, 2013.<br />
Condition Ratings<br />
Area soft mud, Area saltmarsh, Area<br />
seagrass, Area terrestrial margin, RPD<br />
depth, Benthic Community, Organic<br />
content, N and P, Toxicity,<br />
<strong>Sediment</strong>ation rate.<br />
Other Information<br />
Previous reports, Observations,<br />
Expert opinion<br />
ESTUARY CONDITION<br />
Moderate Eutrophication<br />
Excessive <strong>Sediment</strong>ation<br />
Low Toxicity<br />
Habitat Degraded (saltmarsh, terrestrial<br />
margin)<br />
Recommended Management<br />
• Limit intensive landuse.<br />
• Set nutrient, sediment guidelines.<br />
• Margin vegetation enhancement.<br />
• Manage for sea level rise.<br />
• Enhance saltmarsh.<br />
• Manage weeds and pests.<br />
Soil erosion is a major issue in New Zealand and the resulting suspended sediment<br />
impacts are of particular concern in estuaries because they act as a sink for fine<br />
sediments or muds. The main intertidal flats of developed estuaries (e.g. <strong>Porirua</strong><br />
<strong>Harbour</strong>) are usually characterised by sandy sediments reflecting their exposure to<br />
wind-wave disturbance, and are hence relatively low in mud content (2-10% mud).<br />
Recent monitoring (Robertson and Stevens 2008, 2009, 2010) showed <strong>Porirua</strong><br />
<strong>Harbour</strong> Estuary had low-moderate intertidal sedimentation rates and a benthic<br />
invertebrate community dominated by species that prefer sand or a little mud.<br />
However, the sand dominated sediments had an elevated mud content, showed a<br />
general trend of increasing muddiness, and sediments were not very well oxygenated.<br />
Based on these findings, in <strong>2011</strong> <strong>Greater</strong> Wellington Regional Council (GWRC)<br />
decided to continue annual monitoring of sedimentation rates, grain size, and RPD<br />
depth at existing intertidal sites in the estuary (e.g. Stevens and Robertson <strong>2011</strong>).<br />
In addition to intertidal areas, <strong>Porirua</strong> <strong>Harbour</strong> has also been identified as being<br />
particularly at risk from subtidal sedimentation because the main subtidal basins are<br />
rapidly infilling (Gibb and Cox 2009). Gibb and Cox predict that both estuary arms<br />
are highly likely to rapidly infill and change from tidal estuaries to brackish swamps<br />
within 145-195 years. The dominant sources contributing to increasing sedimentation<br />
rates in the estuary were identified as discharges of both bedload and suspended<br />
load from the various input streams (most notably Pauatahanui, Horokiri<br />
and <strong>Porirua</strong> Streams). Elevated inputs of nutrients from the same streams are also<br />
causing symptoms of moderate eutrophication (i.e. poor sediment oxygenation and<br />
moderate nuisance macroalgal cover) in the estuary (Stevens and Robertson 2009,<br />
2010, <strong>2011</strong>, Robertson and Stevens 2009, 2010, <strong>2011</strong>).<br />
In response to these concerns, GWRC convened a technical workshop in April <strong>2011</strong><br />
which drew on expert scientific advice, combined with existing catchment and estuary<br />
models, to highlight the areas of greatest predicted deposition. A key output<br />
was the recommendation to increase the number of intertidal plates within areas<br />
influenced by priority catchments, and to determine suitable methods and locations<br />
for the establishment of subtidal sediment plates which is where the greatest sediment<br />
deposition in the estuary is expected to occur. Work into catchment sources<br />
and loads is ongoing, particularly in relation to likely increased sedimentation to the<br />
estuary as a result of the construction of Transmission Gully motorway.<br />
The current report presents the 20<strong>12</strong> monitoring results of intertidal sedimentation<br />
rates, grain size, and RPD indicators monitored at established sites in <strong>Porirua</strong><br />
<strong>Harbour</strong> Estuary in February 20<strong>12</strong>. Condition ratings, developed for Wellington’s<br />
estuaries, are used to rate the condition of the estuary, and recommend monitoring<br />
and management actions.<br />
This report also describes the establishment of four additional intertidal sites (3 in<br />
Pauatahanui Arm and 1 in the Onepoto Arm - Figure 1), and identifies a series of sites<br />
recommended for the establishment of shallow subtidal plates (e.g. photo below).<br />
Pauatahanui Arm - wading into deep soft muds in the shallow subtidal basin near Duck Creek.<br />
Wriggle<br />
coastalmanagement 1
1. Introduction and Methods (Continued)<br />
Detailed descriptions of existing sampling sites and methods are provided in Robertson<br />
and Stevens (2008, 2009, 2010), Stevens and Robertson (<strong>2011</strong>a), and are briefly<br />
summarised below.<br />
<strong>Sediment</strong>ation Rate<br />
To measure the sedimentation rate from now and into the future, concrete plates<br />
were buried at 4 intertidal sites and 1 subtidal site in the estuary in 2007, with an<br />
additional 4 sites (16 plates) added in 20<strong>12</strong> (Figure 1, Table 1). Each plate, marked by<br />
wooden pegs and GPS referenced, was relocated and the depth of sediment over the<br />
plate measured by pushing a probe into the sediment until it hit the plate. A number<br />
of measurements on each plate were averaged to account for irregular sediment<br />
surfaces and to determine the mean annual rate of sedimentation at each site.<br />
Grain Size<br />
To monitor changes in the mud content of sediments, a single composite sample (10<br />
combined sub-samples) of the top 20mm of sediment was collected from each fine<br />
scale site (sites A and B in each arm - see Figure 1), and from all previously and newly<br />
established sediment plate sites. All samples were analysed by Hill Laboratories for<br />
grain size (% mud, sand, gravel).<br />
In 20<strong>12</strong>, a single composite sample was collected from each site instead of the replicated<br />
triplicate sampling undertaken in previous years. This was to enable a greater<br />
spatial spread of samples to be collected from throughout the estuary within the<br />
existing budget. The decision was based on the very low within-site sample variability<br />
shown during previous monitoring. It is recommended that triplicate sampling<br />
be undertaken whenever 5 yearly fine scale monitoring is undertaken to provide a<br />
regular check on within-site sample variability.<br />
Redox Potential Discontinuity (RPD) depth<br />
To assess sediment oxygenation, the mean depth to the RPD was calculated in 10<br />
plots at each site by digging down from the surface with a hand trowel until the RPD<br />
transition level was located.<br />
Table 1. Location of buried sediment plates, <strong>Porirua</strong> <strong>Harbour</strong> Estuary (No. refers to sites shown<br />
in Figure 1).<br />
Onepoto Arm Pauatahanui Arm<br />
No. Site PLATE NZTM NORTH NZTM EAST No. Site PLATE NZTM NORTH NZTM EAST<br />
1<br />
Por A Railway<br />
(fine scale site)<br />
1<br />
2<br />
3<br />
4<br />
5447787<br />
5447783<br />
5447761<br />
5447754<br />
1756508<br />
1756479<br />
1756480<br />
1756509<br />
6<br />
Boatsheds<br />
(adjacent to 5. Paua A<br />
fine scale site)<br />
1<br />
2<br />
3<br />
4<br />
5448786<br />
5448786<br />
5448786<br />
5448787<br />
1757269<br />
1757267<br />
1757265<br />
1757263<br />
1 5445521 1754774<br />
1 5449750 1758887<br />
2 Aotea<br />
2<br />
3<br />
5445522<br />
5445524<br />
1754773<br />
1754771<br />
7 Kakaho<br />
2<br />
3<br />
5449748<br />
5449746<br />
1758887<br />
1758887<br />
4 5445525 1754770 4 5449744 1758886<br />
1 5445431 1754566<br />
1 5448830 1760042<br />
3<br />
Por B Polytech<br />
(fine scale site)<br />
2<br />
3<br />
5445407<br />
5445529<br />
1754580<br />
1754561<br />
8 Horokiri<br />
2<br />
3<br />
5448828<br />
5448826<br />
1760042<br />
1760041<br />
4 5445531 1754562 4 5448824 1760041<br />
4 Por C Western subtidal 1 5447105 1755552<br />
9<br />
Paua B<br />
(fine scale site)<br />
1<br />
2<br />
3<br />
5448377<br />
5448356<br />
5448366<br />
1760334<br />
1760354<br />
1760376<br />
4 5448392 1760365<br />
1 5447947 1759831<br />
10 Duck Creek<br />
2<br />
3<br />
5447949<br />
5447951<br />
1759831<br />
1759830<br />
4 5447953 1759830<br />
Wriggle<br />
coastalmanagement 2
1. Introduction and Methods (Continued)<br />
<strong>Sediment</strong>ation sites established 2007/8<br />
<strong>Sediment</strong>ation sites established <strong>2011</strong>/<strong>12</strong><br />
Proposed subtidal sedimentation sites<br />
Fine scale monitoring sites<br />
3<br />
Polytech<br />
Por B<br />
2<br />
Photo GWRC 2010.<br />
Western subtidal<br />
Por C<br />
4<br />
Onepoto<br />
Arm<br />
Aotea<br />
Boatsheds<br />
1<br />
Kakaho<br />
Pauatahanui<br />
Inlet<br />
Figure 1. Location of fine scale sites and buried sediment plates established in 2007/8, and 20<strong>12</strong> in <strong>Porirua</strong> Estuary.<br />
6<br />
5<br />
Railway<br />
Por A<br />
Paua A<br />
7<br />
Wriggle<br />
Horokiri<br />
10<br />
Upper East<br />
Paua B<br />
8<br />
Duck Creek<br />
9<br />
coastalmanagement 3
1. Introduction and Methods (Continued)<br />
WELLINGTON ESTUARIES:<br />
CONDITION RATINGS<br />
<strong>Sediment</strong>ation<br />
Rate<br />
Redox<br />
Potential<br />
Discontinuity<br />
A series of interim fine scale estuary “condition ratings” (presented<br />
below) have been proposed for <strong>Porirua</strong> <strong>Harbour</strong> Estuary<br />
(based on the ratings developed for New Zealand estuaries - e.g.<br />
Robertson & Stevens 2006, 2007, 2008, 2009). The ratings are<br />
based on a review of monitoring data, guideline criteria, and<br />
expert opinion. They are designed to be used in combination<br />
with each other, and with other fine and broad scale indicators<br />
(usually involving expert input) when evaluating overall estuary<br />
condition and deciding on appropriate management. The<br />
condition ratings include an “early warning trigger” to highlight<br />
rapid or unexpected change, and each rating has a recommended<br />
monitoring and management response. In most cases initial<br />
management is to further assess an issue and consider what<br />
response actions may be appropriate (e.g. develop an Evaluation<br />
and Response Plan - ERP).<br />
Elevated sedimentation rates are likely to lead to major and detrimental ecological changes within estuary areas that could be<br />
very difficult to reverse, and indicate where changes in land use management may be needed.<br />
SEDIMENTATION RATE CONDITION RATING<br />
RATING DEFINITION RECOMMENDED RESPONSE<br />
Very Low 0-1mm/yr (typical pre-European rate) Monitor at 5 year intervals after baseline established<br />
Low 1-2mm/yr Monitor at 5 year intervals after baseline established<br />
Moderate 2-5mm/yr Monitor at 5 year intervals after baseline established<br />
High 5-10mm/yr Monitor yearly. Initiate ERP<br />
Very High >10mm/yr Monitor yearly. Manage source<br />
Early Warning Trigger Rate increasing Initiate Evaluation and Response Plan<br />
The RPD is the grey layer between the oxygenated yellow-brown sediments near the surface and the deeper anoxic black<br />
sediments. It is an effective ecological barrier for most but not all sediment-dwelling species. A rising RPD will force most<br />
macrofauna towards the sediment surface to where oxygen is available. The depth of the RPD layer is a critical estuary condition<br />
indicator in that it provides a measure of whether nutrient enrichment in the estuary exceeds levels causing nuisance<br />
anoxic conditions in the surface sediments. The majority of the other indicators (e.g. macroalgal blooms, soft muds, sediment<br />
organic carbon, TP, and TN) are less critical, in that they can be elevated, but not necessarily causing sediment anoxia and<br />
adverse impacts on aquatic life. Knowing if the surface sediments are moving towards anoxia (i.e. RPD close to the surface) is<br />
important for two main reasons:<br />
1. As the RPD layer gets close to the surface, a “tipping point” is reached where the pool of sediment nutrients (which can<br />
be large), suddenly becomes available to fuel algal blooms and to worsen sediment conditions.<br />
2. Anoxic sediments contain toxic sulphides and very little aquatic life.<br />
The tendency for sediments to become anoxic is much greater if the sediments are muddy. In sandy porous sediments, the RPD<br />
layer is usually relatively deep (>3cm) and is maintained primarily by current or wave action that pumps oxygenated water<br />
into the sediments. In finer silt/clay sediments, physical diffusion limits oxygen penetration to 10cm depth below surface Monitor at 5 year intervals after baseline established<br />
Good 3-10cm depth below sediment surface Monitor at 5 year intervals after baseline established<br />
Fair 1-3cm depth below sediment surface Monitor at 5 year intervals. Initiate ERP<br />
Poor 1.3 x Mean of highest baseline year Initiate Evaluation and Response Plan<br />
Wriggle<br />
coastalmanagement 4
2. RESuLtS, RatInG and ManaGEMEnt<br />
Mean <strong>Sediment</strong>ation Rate (mm/yr)<br />
30<br />
25<br />
20<br />
15<br />
10<br />
5<br />
0<br />
-5<br />
-10<br />
Paua A Boatshed<br />
<strong>Sediment</strong> Plates<br />
2007/8-20<strong>12</strong><br />
Paua B Upper<br />
Pori A Railway<br />
<strong>Sediment</strong>ation Rating<br />
Very Low<br />
Low<br />
Pori B Polytech<br />
Pori C West<br />
Hydrographic Surveys<br />
1974-2009<br />
Paua Boatsheds<br />
Paua Upper<br />
Moderate<br />
High<br />
Pori Railway<br />
Pori Polytech<br />
Very High<br />
Figure 2. <strong>Sediment</strong>ation rate (mean and range) from<br />
plate data, <strong>Porirua</strong> <strong>Harbour</strong> Estuary (2007/8-20<strong>12</strong>).<br />
Cumulative change in sediment<br />
level since baseline (mm)<br />
Figure 3. Mean change in sediment showing trends over<br />
buried plates from 2007/8-20<strong>12</strong>.<br />
Redox potential discontinuity depth (cm)<br />
15<br />
10<br />
5<br />
<strong>12</strong><br />
10<br />
8<br />
6<br />
4<br />
2<br />
0<br />
-2<br />
-4<br />
-6<br />
-8<br />
-10<br />
2007<br />
2008<br />
2009<br />
<strong>2011</strong><br />
20<strong>12</strong><br />
Por B<br />
Paua B<br />
Paua A<br />
Por A<br />
Por C<br />
Onepoto Arm Pauatahanui Arm<br />
Site A Site B Site A Site B<br />
0<br />
08 09 10 11 <strong>12</strong> 08 09 10 11 <strong>12</strong> 08 09 10 11 <strong>12</strong> 08 09 10 11 <strong>12</strong> Year<br />
Pori west<br />
Figure 4. RPD depth (mean and range), <strong>Porirua</strong> <strong>Harbour</strong><br />
Estuary fine scale sites, (2008-20<strong>12</strong>).<br />
Very<br />
Good<br />
Good<br />
Fair<br />
Poor<br />
Three indicators were used to assess sedimentation at the<br />
fine scale monitoring sites in 20<strong>12</strong>: sedimentation rate, RPD<br />
depth, and grain size.<br />
Rate of <strong>Sediment</strong>ation. The depths to 17 sedimentation<br />
plates buried at 5 sites in <strong>Porirua</strong> <strong>Harbour</strong> in 2007 (see Robertson<br />
and Stevens 2008) were measured in February 20<strong>12</strong> as<br />
part of annual long term sedimentation rate monitoring in<br />
the estuary (Table 2, Figure 2).<br />
Mean annual sedimentation rates for the estuary since<br />
2007/8 range from -0.5 to +2.8mm/yr. Such rates fit within<br />
the “very low” to “moderate” categories (Table 2). The upper<br />
estuary sites in each arm were the only ones showing an<br />
increase in sedimentation, the greatest intertidal deposition<br />
currently occurring in the Onepoto Arm (Site Por B - Figures 2<br />
and 3). Additional plates installed at 4 sites in February 20<strong>12</strong><br />
to monitor intertidal sedimentation rates over a wider spatial<br />
area in both arms will be reported on following establishment<br />
of a baseline (see Table 4 for inaugural data).<br />
Although the average measured intertidal rates remain<br />
below those predicted by Gibb and Cox (2009) (Figure 2),<br />
the ranges indicate short-term variability can be high and<br />
large inputs over short time intervals following catchment<br />
disturbance could account for the higher averages reported<br />
by Gibb and Cox (2009). Ongoing monitoring of intertidal<br />
plates, and the establishment of plates within the main<br />
subtidal basins in both arms of the estuary is recommended.<br />
Redox Potential Discontinuity (RPD). The depth to the<br />
RPD boundary is a critical estuary condition indicator in<br />
that it provides a direct measure of sediment oxygenation.<br />
This commonly shows whether nutrient enrichment in the<br />
estuary exceeds levels causing nuisance anoxic conditions in<br />
the surface sediments, and also reflects the capacity of tidal<br />
flows to maintain and replenish sediment oxygen levels.<br />
In well flushed sandy intertidal sediments, tidal flows typically<br />
oxygenate the top 10cm of sediment. However, when<br />
fine muds fill the interstitial pore spaces, less re-oxygenation<br />
occurs and the RPD moves closer to the surface.<br />
In response to the presence of both fine muds and nutrient<br />
enrichment, the RPD depth has decreased at all fine<br />
scale sites in <strong>Porirua</strong> <strong>Harbour</strong> since 2008 (Figure 4, Table<br />
3). In 20<strong>12</strong>, the measured RPD remained relatively shallow<br />
(1-1.5cm) indicating relatively poorly oxygenated sediments<br />
that fall within the “fair-poor” condition rating.<br />
Grain Size. Grain size (% mud, sand, gravel) is a key indicator<br />
of both eutrophication and sediment changes. Increasing<br />
mud content signals a deterioration in estuary condition<br />
and can exacerbate eutrophication symptoms.<br />
Grain size monitoring at fine scale sites (Figure 5, Table 3)<br />
shows that although sandy sediments dominate the sites,<br />
mud was also a significant component (7-15% mud). The<br />
highest mud contents were in the lower estuary (‘A’ sites).<br />
While the mud content has been relatively consistent at Por<br />
A and Paua B, it is more variable at Por B and Paua A.<br />
Baseline grain size measures were made at sediment plate sites<br />
PorC and Boatsheds for the first time in <strong>2011</strong>. Four additional<br />
sediment plate sites (three in Pauatahanui and one in Onepoto)<br />
were established in 20<strong>12</strong>. Site locations are presented in Figure<br />
1, and results in Table 3 show the new sites generally have a<br />
mud content similar to the upper fine scale ‘B” sites (1.5-8%).<br />
Wriggle<br />
coastalmanagement 5
2. Results, Rating and Management (Continued)<br />
Grain Size (%)<br />
100<br />
80<br />
60<br />
40<br />
20<br />
0<br />
Onepoto Arm<br />
08 09 10 11 <strong>12</strong> 08 09 10 11 <strong>12</strong> <strong>12</strong> 11 <strong>12</strong><br />
Grain Size (%)<br />
100<br />
80<br />
60<br />
40<br />
20<br />
0<br />
Pauatahanui Arm<br />
08 09 10 11 <strong>12</strong> 08 09 10 11 <strong>12</strong> 11 <strong>12</strong> <strong>12</strong> <strong>12</strong> <strong>12</strong><br />
Por A Por B Aotea Por C<br />
Paua A Paua B Boatsheds Kakaho Horokiri Duck<br />
Figure 5. Grain size, <strong>Porirua</strong> <strong>Harbour</strong> Estuary fine scale and sediment plate monitoring sites (2008-20<strong>12</strong>).<br />
Table 2. <strong>Intertidal</strong> sediment plate data, <strong>Porirua</strong> <strong>Harbour</strong> Estuary (2007-20<strong>12</strong>).<br />
Site<br />
Onepoto Arm<br />
Pauatahanui Arm<br />
13/<strong>12</strong>/07<br />
<strong>Sediment</strong> Depth (mm) Change (mm) Site Mean (mm/yr)<br />
15/1/09<br />
20/1/10<br />
18/1/11<br />
21-24/2/<strong>12</strong><br />
2007-<br />
2009<br />
2009-<br />
2010<br />
2010-<br />
<strong>2011</strong><br />
<strong>2011</strong>-<br />
20<strong>12</strong><br />
2007-<br />
2009<br />
2009-<br />
2010<br />
2010-<br />
<strong>2011</strong><br />
<strong>2011</strong>-<br />
20<strong>12</strong><br />
2007-20<strong>12</strong><br />
Overall<br />
Rate<br />
(mm/yr)<br />
% Mud<br />
2007-20<strong>12</strong><br />
Rating<br />
1 168 164 159 155 160 -4 -5 -4 5<br />
A. Lower (Railway)<br />
2<br />
3<br />
150<br />
152<br />
152<br />
155<br />
158<br />
163<br />
156<br />
150<br />
151<br />
145<br />
2<br />
3<br />
6<br />
8<br />
-2<br />
-13<br />
-5<br />
-5<br />
0.8 2.3 -4.5 -0.3 -0.4 VERY LOW<br />
4 93 95 95 96 100 2 0 1 4<br />
B. Upper (Polytech)<br />
1<br />
2<br />
3<br />
4<br />
237<br />
230<br />
237<br />
244<br />
240<br />
242<br />
242<br />
244<br />
110<br />
75<br />
245<br />
244<br />
110<br />
73<br />
0<br />
14<br />
-<br />
-<br />
3<br />
-2<br />
-<br />
-<br />
2<br />
2<br />
-<br />
-<br />
3<br />
0<br />
0<br />
-2<br />
7 0.5 2 1.5<br />
-1.0<br />
2.8<br />
-<br />
MODERATE<br />
VERY LOW<br />
C. Western Subtidal 1 <strong>12</strong>0 - 115 115 118 -5 0 3 -5 0 3.0 -0.5 VERY LOW<br />
1<br />
171 172 165 166 - 1 -7 1<br />
A. Lower (Boatsheds)<br />
2<br />
3<br />
213<br />
232<br />
213<br />
232<br />
215<br />
233<br />
216<br />
234<br />
-<br />
-<br />
0<br />
0<br />
2<br />
1<br />
1<br />
1<br />
- 0.5 -0.8 0.3 0.0 VERY LOW<br />
4 234 235 236 234 - 1 1 -2<br />
1 181 182 186 186 181 1 4 0 -5<br />
B. Upper (East Arm)<br />
2<br />
3<br />
215<br />
182<br />
218<br />
186<br />
228<br />
183<br />
233<br />
183<br />
228<br />
181<br />
3<br />
4<br />
10<br />
-3<br />
5<br />
0<br />
-5<br />
-2<br />
2.3 3.8 0.3 -5.3 0.3 VERY LOW<br />
4 176 177 181 177 168 1 4 -4 -9<br />
Baseline<br />
Table 3. RPD depth and grain size results, <strong>Porirua</strong> <strong>Harbour</strong><br />
Estuary (21-24 Feb. 20<strong>12</strong>).<br />
Estuary Arm Site<br />
RPD<br />
cm<br />
Mud Sand<br />
%<br />
Gravel<br />
Por A. Lower (Railway) 1.5 5.9 86.6 7.5<br />
Onepoto<br />
Por B. Upper (Polytech)<br />
Por C. Western Subtidal<br />
1<br />
5<br />
4.7<br />
6.5<br />
93.2<br />
88.4<br />
2.1<br />
5.1<br />
Aotea (24/3/<strong>12</strong>) 3 4.0 95.8 0.3<br />
Paua A. Lower (Boatsheds) 1.5 13.2 74.1 <strong>12</strong>.8<br />
Boatsheds (Sed Plates) 1 8.6 81.3 10.1<br />
Pauatahanui<br />
Kakaho<br />
Horokiri<br />
3<br />
2<br />
8.0<br />
5.1<br />
84.1<br />
91.4<br />
7.8<br />
3.5<br />
Paua B. Upper (East Arm) 1 5.3 92.4 2.3<br />
Duck Creek 2 1.5 98.5 0.0<br />
% Sand<br />
% Gravel<br />
Table 4. Inaugural baseline depths of sedimentation plates<br />
established in early 20<strong>12</strong>, <strong>Porirua</strong> <strong>Harbour</strong> Estuary.<br />
Estuary Arm Site<br />
Date<br />
established<br />
Onepoto Aotea 24/3/20<strong>12</strong><br />
Pauatahanui<br />
Kakaho 22/2/20<strong>12</strong><br />
Horokiri 22/2/20<strong>12</strong><br />
Duck Creek 22/2/20<strong>12</strong><br />
Plate <strong>Sediment</strong> Depth (mm)<br />
1 138<br />
2 108<br />
3 103<br />
4 100<br />
1 73<br />
2 100<br />
3 90<br />
4 92<br />
1 106<br />
2 108<br />
3 118<br />
4 98<br />
1 134<br />
2 108<br />
3 <strong>12</strong>2<br />
4 88<br />
Wriggle<br />
coastalmanagement 6
2. Results, Rating and Management (Continued)<br />
It was noted that when sampling on the intertidal flats near the Pauatahanui and<br />
Horokiri Streams, a thin layer of recently deposited fine mud was evident on the surface<br />
(see cover photo). This mud was readily resuspended by wave action and appeared<br />
likely to be quickly remobilised and deposited elsewhere. Such sediments are most<br />
likely to accumulate in natural settling basins in the shallow subtidal parts of <strong>Porirua</strong><br />
<strong>Harbour</strong> Estuary.<br />
Exploratory wading into such shallow subtidal areas found they are dominated by deep<br />
soft muds. Consequently, to better assess sedimentation in <strong>Porirua</strong> <strong>Harbour</strong> Estuary, it<br />
is proposed that several subtidal monitoring sites be established within the estuary in<br />
such areas. Proposed locations are shown on Figure 1.<br />
GWRC and PCC are also undertaking desktop assessments to determine the likely sediment<br />
input loads from different landuses, including the Transmission Gully motorway<br />
development, and modelling the zones of deposition within the estuary, to determine<br />
strategies for best managing sediment within the catchment.<br />
CONCLUSION <strong>Sediment</strong> plate monitoring since 2007 at strategic intertidal sites within the <strong>Porirua</strong><br />
Estuary indicate elevated rates of sedimentation at the upper Onepoto Arm site, but<br />
relatively low mean rates at other sites.<br />
However, these results are not expected to adequately represent mean sedimentation<br />
rates throughout the estuary. This is because the greatest rates of sedimentation are<br />
expected to be in certain shallow subtidal areas where accumulation is favoured. It is<br />
therefore recommended that future monitoring include these areas of excessive mud<br />
deposition.<br />
The results also indicated a declining RPD and elevated sediment mud contents at<br />
many of the sites, both of which identify mud deposition as a continuing concern<br />
within the estuary.<br />
RECOMMENDED<br />
MONITORING<br />
RECOMMENDED<br />
MANAGEMENT<br />
It is recommended that monitoring continue as outlined below:<br />
Annual <strong>Sediment</strong> <strong>Monitoring</strong>. To address problems associated with increasing muddiness<br />
and a “poor-fair” RPD rating, monitor sedimentation rate, RPD depth and grain size<br />
at the existing intertidal sites annually until the situation improves (next monitoring<br />
due in Jan-Feb 2013).<br />
Establish additional sedimentation rate monitoring sites in subtidal areas in Oct-Dec,<br />
20<strong>12</strong>.<br />
Fine Scale <strong>Monitoring</strong>. It is recommended that a “complete” fine scale monitoring<br />
assessment (including sedimentation rate and macroalgal mapping) be undertaken at 5<br />
yearly intervals (next scheduled for Jan-Feb 2015).<br />
Broad Scale Habitat Mapping. It is recommended that broad scale habitat mapping<br />
be repeated in summer 20<strong>12</strong>/2013.<br />
The sediment indicators monitored in 20<strong>12</strong> reinforce the 2008 to 2010 fine scale monitoring<br />
results about the need to manage fine sediment inputs to the estuary.<br />
In particular the following specific management actions are recommended:<br />
• Limit catchment suspended sediment inputs to levels that will not cause excessive<br />
estuary infilling i.e. limit sedimentation rates to an estuary average of 1mm/yr. It is<br />
expected that there will be areas of very high and very low sedimentation throughout<br />
the estuary, which together will average 1mm/yr. Such an approach will allow<br />
the development of input load guidelines for suspended sediment and targeted<br />
management of problem areas.<br />
<strong>Greater</strong> Wellington’s ongoing catchment and sediment transport modelling will help<br />
determine the catchment suspended sediment load inputs and the target reductions<br />
required to reduce in-estuary sedimentation rates.<br />
Wriggle<br />
coastalmanagement 7
2. Results, Rating and Management (Continued)<br />
ACKNOWLEDGEMENT Many thanks to Juliet Milne and Megan Oliver (GWRC) for their support and feedback<br />
on the draft report.<br />
REFERENCES Gibb, J.G. and Cox, G.J. 2009. Patterns & Rates of <strong>Sediment</strong>ation within <strong>Porirua</strong> <strong>Harbour</strong>.<br />
Consultancy Report (CR 2009/1) prepared for <strong>Porirua</strong> City Council. 38p plus appendices.<br />
Jørgensen, N. and Revsbech, N.P. 1985. Diffusive boundary layers and the oxygen uptake of<br />
sediments and detritus. Limnology and Oceanography 30:111-<strong>12</strong>2.<br />
Robertson, B.M. and Stevens, L. 2006. Southland Estuaries State of Environment Report<br />
2001-2006. Prepared for Environment Southland. 45p plus appendices.<br />
Robertson, B.M. and Stevens, L. 2008. <strong>Porirua</strong> <strong>Harbour</strong>: Fine Scale <strong>Monitoring</strong> 2007/08. Prepared<br />
for <strong>Greater</strong> Wellington Regional Council. 32p.<br />
Robertson, B.M. and Stevens, L. 2009. <strong>Porirua</strong> <strong>Harbour</strong>: Fine Scale <strong>Monitoring</strong> 2008/09. Prepared<br />
for <strong>Greater</strong> Wellington Regional Council. 26p.<br />
Robertson, B.M. and Stevens, L. 2010. <strong>Porirua</strong> <strong>Harbour</strong>: Fine Scale <strong>Monitoring</strong> 2009/10. Prepared<br />
for <strong>Greater</strong> Wellington Regional Council. 39p.<br />
Stevens, L. and Robertson, B.M. 2009. <strong>Porirua</strong> <strong>Harbour</strong>: <strong>Intertidal</strong> Macroalgal <strong>Monitoring</strong><br />
2008/09. Prepared for <strong>Greater</strong> Wellington Regional Council. 3p.<br />
Stevens, L. and Robertson, B.M. 2010. <strong>Porirua</strong> <strong>Harbour</strong>: <strong>Intertidal</strong> Macroalgal <strong>Monitoring</strong><br />
2009/10. Prepared for <strong>Greater</strong> Wellington Regional Council. 3p.<br />
Stevens, L. and Robertson, B.M. <strong>2011</strong>. <strong>Porirua</strong> <strong>Harbour</strong>: <strong>Intertidal</strong> Macroalgal <strong>Monitoring</strong><br />
2010/11. Prepared for <strong>Greater</strong> Wellington Regional Council. 4p.<br />
Stevens, L. and Robertson, B.M. <strong>2011</strong>a. <strong>Porirua</strong> <strong>Harbour</strong>: <strong>Intertidal</strong> <strong>Sediment</strong> <strong>Monitoring</strong><br />
2010/11. Prepared for <strong>Greater</strong> Wellington Regional Council. 6p.<br />
Wriggle<br />
coastalmanagement 8