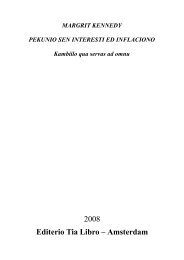
Fig. 11: University of Marburg site plan Fig. 13: Marburg University Ekistics 210, May 1973 Fig. 12: Part of Natural Sciences Building at Marburg 293
Table 2 ACCELERATED BUILDING PROJECTS, ACCORDING TO UNIVERSITY DEPARTMENTS, 1970, WITH AVERAGE UNIT COSTS PER M 2 & PER WORK SPACE Number of Projects 30 4 10 2 31 6 1 8 1 1 5 1 92 1 2 3 4 5 6 7 8 Department Maths. & Natural Sciences Engineering Sciences Medicine & Pharmacy Veterinary Surgery Arts & Sciences Law, Economics & Social Sciences Agriculture, Forestry & Ecology Common/Central Facilities 8.1 Computer Centers 8.2 Canteen 8.3 Multipurpose Buildings 8.4 Other Total Additional m 2 area 96,610 12,490 20,267 5,900 59,713 17,716 1,056 29,203 6,500 600 22,103 — 242,955 was started in November 1963, and the first prototype was ready for use in 1964. Since then, the basic system has not changed, but has been refined over the years. The development of the system was done under the supervision of the design office of the Marburg university architectural and building team (all civil servants). However, after the first few buildings had been erected the construction firm MAN took over the overall production and put the Marburg system on the general market. Schools, offices, workshops, etc. have been built in locations other than the Marburg campus, which has considerably helped reduce the unit cost. The common facilities building for the natural sciences (upper black building on the site plan — Fig. 11 and photo detail Fig. 12) was originally scheduled for a later building phase, but was brought forward to March 1970 through the Accelerated Building Program. It was finished by May 1971, with a unit cost figure of c. $540 per m 2 . Evaluation of ABP One disadvantage to the quick decision and allocation within the ABP is the one-sidedness of the program towards 'teaching' facilities. Research and Adminis Space work spaces 10,745 850 2,212 196 11,027 2,794 40 4,550 1,500 — 2,700 350 32,414 Total costs $ mill. approx. 73.9 11.9 25.0 3.0 35.9 8.9 1.2 30.0 12.7 0.4 16.1 0.8 189.8 $/m 2 717.83 896.77 1158.12 476.69 563.63 468.85 1035.75 964.63 1826.92 726.56 683.02 732.86 $/w.s. 6454.13 13166.73 10611.58 14349.49 3052.17 2972.89 27343.75 6191.24 7916.67 5591.38 2178.57 5493.10 tration buildings are played down and the latter is conspicuous by its absence in Table 2. Another disadvantage is that although the Federal 50% seems high (for countries where universities are not all publicly owned), the States or Lander must bear the costs of land acquisition, infrastructure and maintenance costs. With the preparation of funding possibilities and the erection of the building, all is not accomplished. Landscaping, integration into the community, and programming learning for new environments need to be carried out simultaneously. The main problem for the universities of the Federal Republic of Germany is whether they can keep abreast of the students, academically and organizationally, as well as their increase in number. References Ministry for Education and Science, Bonn, 1971. Heidemarie Parpart, "Bestandsaufnahme des Hochschul- Schnellbauprogramms", Bauwelt, Vol. 62, No. 18, May 3, 1971. Staatliches Universitats-Neubauamt, "Das Marburger Bausystem," Marburger Universitatsbund e.V., Status Report — Alma Mater Philippina, Philipps-University, Marburg/ Lahn, 1966. 294 Ekistics 210, May 1973