Inflation: Sustained Upward Pressure on the Price Level.
Inflation: Sustained Upward Pressure on the Price Level.
Inflation: Sustained Upward Pressure on the Price Level.

You also want an ePaper? Increase the reach of your titles
YUMPU automatically turns print PDFs into web optimized ePapers that Google loves.
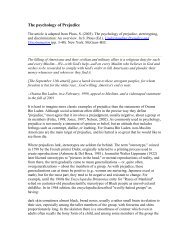
Harvey Rosenblum<br />
Dallas Federal Reserve Bank<br />
Senior Vice President and Director of Research<br />
<str<strong>on</strong>g>Inflati<strong>on</strong></str<strong>on</strong>g>: <str<strong>on</strong>g>Sustained</str<strong>on</strong>g> <str<strong>on</strong>g>Upward</str<strong>on</strong>g><br />
<str<strong>on</strong>g>Pressure</str<strong>on</strong>g> <strong>on</strong> <strong>the</strong> <strong>Price</strong> <strong>Level</strong>.
1. The Phillip’s Curve is not a reliable<br />
relati<strong>on</strong>ship. There is no c<strong>on</strong>sistent<br />
relati<strong>on</strong>ship between inflati<strong>on</strong> and<br />
unemployment.<br />
2. Strict m<strong>on</strong>etarism no l<strong>on</strong>ger works in our<br />
modern financial system.<br />
3. <str<strong>on</strong>g>Inflati<strong>on</strong></str<strong>on</strong>g> is an evolving and very complex<br />
phenomen<strong>on</strong> that embodies a combinati<strong>on</strong><br />
of macro and micro ec<strong>on</strong>omic factors.
4. When <strong>the</strong> anecdotes and ec<strong>on</strong>omic data do<br />
not corroborate, <strong>on</strong>e of <strong>the</strong>m is wr<strong>on</strong>g.<br />
More often than not, it’s <strong>the</strong> data.<br />
5. Macroec<strong>on</strong>omic models do not deal well<br />
with a changing ec<strong>on</strong>omic structure, let<br />
al<strong>on</strong>e paradigm shifts. Policymakers<br />
mush make decisi<strong>on</strong>s in real time and<br />
cannot wait for <strong>the</strong> parameters in <strong>the</strong>ir<br />
ec<strong>on</strong>omic models to catch up and<br />
stabilize.
6. The inflati<strong>on</strong> experience of <strong>the</strong> 1970’s was<br />
a statistical aberrati<strong>on</strong>.<br />
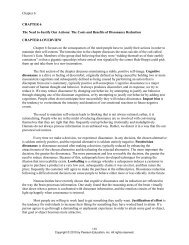
<str<strong>on</strong>g>Inflati<strong>on</strong></str<strong>on</strong>g><br />
Rate =<br />
Calculating <str<strong>on</strong>g>Inflati<strong>on</strong></str<strong>on</strong>g><br />
NewPr<br />
ice <strong>Level</strong> − Old Pr ice <strong>Level</strong><br />
Old Pr ice <strong>Level</strong>
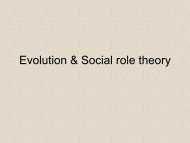
Example of Calculating <str<strong>on</strong>g>Inflati<strong>on</strong></str<strong>on</strong>g><br />
Questi<strong>on</strong>: What was <strong>the</strong> inflati<strong>on</strong> rate<br />
between 1988 and 1999?<br />
<strong>Price</strong> Index, 1988=118.3<br />
<strong>Price</strong> Index, 1999=166.6<br />
<str<strong>on</strong>g>Inflati<strong>on</strong></str<strong>on</strong>g><br />
=<br />
48<br />
118<br />
. 3<br />
. 3<br />
=<br />
Rate<br />
40<br />
. 8<br />
=<br />
%<br />
166<br />
. 6 −<br />
118<br />
118<br />
. 3<br />
. 3
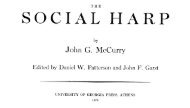
Costs of <str<strong>on</strong>g>Inflati<strong>on</strong></str<strong>on</strong>g><br />
i.e. Who loses from inflati<strong>on</strong>?<br />
1. Decline in Purchasing Power<br />
2. Redistributi<strong>on</strong> of Wealth from Lenders to<br />
Borrowers<br />
3. C<strong>on</strong>tract instability that takes time to work<br />
through <strong>the</strong> ec<strong>on</strong>omic system
Who is hurt from inflati<strong>on</strong>?<br />
1. People <strong>on</strong> fixed incomes<br />
2. Savers<br />
3. Creditors