09The Fac Report - Aon
09The Fac Report - Aon
09The Fac Report - Aon

You also want an ePaper? Increase the reach of your titles
YUMPU automatically turns print PDFs into web optimized ePapers that Google loves.
CREATING A CLEARER PICTURE<br />
FOR UNDERWRITERS<br />
Following its success with US underwriters,<br />
Benfield has now started to roll out<br />
ExposureView, to a more international<br />
audience. As the first stage in this process,<br />
Benfield has established a London-based<br />
hub for the product which is working with<br />
a number of London Market companies<br />
on initiatives to enhance the depth of their<br />
US underwriting data.<br />
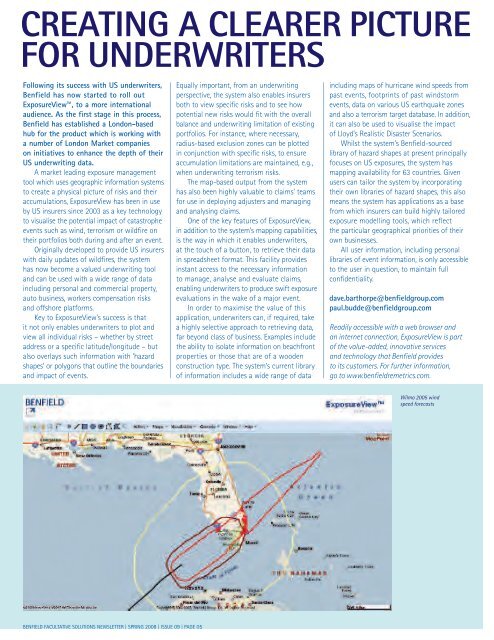
A market leading exposure management<br />
tool which uses geographic information systems<br />
to create a physical picture of risks and their<br />
accumulations, ExposureView has been in use<br />
by US insurers since 2003 as a key technology<br />
to visualise the potential impact of catastrophe<br />
events such as wind, terrorism or wildfire on<br />
their portfolios both during and after an event.<br />
Originally developed to provide US insurers<br />
with daily updates of wildfires, the system<br />
has now become a valued underwriting tool<br />
and can be used with a wide range of data<br />
including personal and commercial property,<br />
auto business, workers compensation risks<br />
and offshore platforms.<br />
Key to ExposureView’s success is that<br />
it not only enables underwriters to plot and<br />
view all individual risks – whether by street<br />
address or a specific latitude/longitude – but<br />
also overlays such information with ‘hazard<br />
shapes’ or polygons that outline the boundaries<br />
and impact of events.<br />
BENFIELD FACULTATIVE SOLUTIONS NEWSLETTER | SPRING 2008 | ISSUE 09 | PAGE 05<br />
Equally important, from an underwriting<br />
perspective, the system also enables insurers<br />
both to view specific risks and to see how<br />
potential new risks would fit with the overall<br />
balance and underwriting limitation of existing<br />
portfolios. For instance, where necessary,<br />
radius-based exclusion zones can be plotted<br />
in conjunction with specific risks, to ensure<br />
accumulation limitations are maintained, e.g.,<br />
when underwriting terrorism risks.<br />
The map-based output from the system<br />
has also been highly valuable to claims’ teams<br />
for use in deploying adjusters and managing<br />
and analysing claims.<br />
One of the key features of ExposureView,<br />
in addition to the system’s mapping capabilities,<br />
is the way in which it enables underwriters,<br />
at the touch of a button, to retrieve their data<br />
in spreadsheet format. This facility provides<br />
instant access to the necessary information<br />
to manage, analyse and evaluate claims,<br />
enabling underwriters to produce swift exposure<br />
evaluations in the wake of a major event.<br />
In order to maximise the value of this<br />
application, underwriters can, if required, take<br />
a highly selective approach to retrieving data,<br />
far beyond class of business. Examples include<br />
the ability to isolate information on beachfront<br />
properties or those that are of a wooden<br />
construction type. The system’s current library<br />
of information includes a wide range of data<br />
including maps of hurricane wind speeds from<br />
past events, footprints of past windstorm<br />
events, data on various US earthquake zones<br />
and also a terrorism target database. In addition,<br />
it can also be used to visualise the impact<br />
of Lloyd’s Realistic Disaster Scenarios.<br />
Whilst the system’s Benfield-sourced<br />
library of hazard shapes at present principally<br />
focuses on US exposures, the system has<br />
mapping availability for 63 countries. Given<br />
users can tailor the system by incorporating<br />
their own libraries of hazard shapes, this also<br />
means the system has applications as a base<br />
from which insurers can build highly tailored<br />
exposure modelling tools, which reflect<br />
the particular geographical priorities of their<br />
own businesses.<br />
All user information, including personal<br />
libraries of event information, is only accessible<br />
to the user in question, to maintain full<br />
confidentiality.<br />
dave.barthorpe@benfieldgroup.com<br />
paul.budde@benfieldgroup.com<br />
Readily accessible with a web browser and<br />
an internet connection, ExposureView is part<br />
of the value-added, innovative services<br />
and technology that Benfield provides<br />
to its customers. For further information,<br />
go to www.benfieldremetrics.com.<br />
Wilma 2005 wind<br />
speed forecasts