Winter Wheat in Summer-Fallow - Oregon State Library: State ...
Winter Wheat in Summer-Fallow - Oregon State Library: State ...
Winter Wheat in Summer-Fallow - Oregon State Library: State ...

You also want an ePaper? Increase the reach of your titles
YUMPU automatically turns print PDFs into web optimized ePapers that Google loves.
FG 80<br />
Revised November 2006<br />
$1.50<br />
<strong>W<strong>in</strong>ter</strong> <strong>Wheat</strong> <strong>in</strong><br />
<strong>Summer</strong>-<strong>Fallow</strong> Systems<br />
(Low precipitation zone)<br />
L.K. Lutcher, D.A. Horneck, D.J. Wysocki, J.M. Hart, S.E. Petrie, and N.W. Christensen<br />
Recommendations <strong>in</strong> this fertilizer guide<br />
apply to tillage fallow-w<strong>in</strong>ter wheat and<br />
chemical fallow-w<strong>in</strong>ter wheat cropp<strong>in</strong>g<br />
systems. This guide is one of a set of<br />
publications that address the nutritional requirements<br />
of nonirrigated cereal crops <strong>in</strong> north-central<br />
and eastern <strong>Oregon</strong> (Table 1).<br />
Recommendations for nitrogen, phosphorus,<br />
potassium, sulfur, chloride, and z<strong>in</strong>c are covered<br />
<strong>in</strong> this guide. Soils <strong>in</strong> the region supply sufficient<br />
amounts of other nutrients for optimum production<br />
of high-quality gra<strong>in</strong>.<br />
Nitrogen<br />
Calculate nitrogen (N) application rates by<br />
subtract<strong>in</strong>g soil test nitrogen from crop demand<br />
for nitrogen. Adjust for excessive straw and/or soil<br />
sampl<strong>in</strong>g <strong>in</strong> the spr<strong>in</strong>g of the summer-fallow year.<br />
Evaluate application rates by review<strong>in</strong>g the prote<strong>in</strong><br />
content of harvested gra<strong>in</strong>. A detailed explanation<br />
is provided on pages 2–4.<br />
Grow<strong>in</strong>g conditions<br />
Annual precipitation: Less than 12 <strong>in</strong>ches<br />
Soil: Silt loam and very f<strong>in</strong>e sandy loam<br />
Soil organic matter content: 1 to 2 percent<br />
Expected yield<br />
30 to 50 bu/acre<br />
Table 1.—Fertilizer guides for nonirrigated cereal production <strong>in</strong> low, <strong>in</strong>termediate, and high precipitation<br />
zones of <strong>Oregon</strong>.*<br />
Publication # Title Precipitation zone<br />
FG 80 <strong>W<strong>in</strong>ter</strong> <strong>Wheat</strong> <strong>in</strong> <strong>Summer</strong>-<strong>Fallow</strong> Systems Low<br />
FG 81 <strong>W<strong>in</strong>ter</strong> <strong>Wheat</strong> and Spr<strong>in</strong>g Gra<strong>in</strong>s <strong>in</strong> Cont<strong>in</strong>uous Cropp<strong>in</strong>g Systems Low<br />
FG 82 <strong>W<strong>in</strong>ter</strong> <strong>Wheat</strong> <strong>in</strong> <strong>Summer</strong>-<strong>Fallow</strong> Systems Intermediate<br />
FG 83 <strong>W<strong>in</strong>ter</strong> <strong>Wheat</strong> <strong>in</strong> Cont<strong>in</strong>uous Cropp<strong>in</strong>g Systems Intermediate<br />
FG 84 <strong>W<strong>in</strong>ter</strong> <strong>Wheat</strong> <strong>in</strong> Cont<strong>in</strong>uous Cropp<strong>in</strong>g Systems High<br />
*This set of publications replaces FG 54, <strong>W<strong>in</strong>ter</strong> <strong>Wheat</strong>, Non-irrigated, Columbia Plateau. Precipitation zones are based on average annual<br />
precipitation and are def<strong>in</strong>ed as follows: Low = less than 12 <strong>in</strong>ches; Intermediate = 12 to 18 <strong>in</strong>ches; High = more than 18 <strong>in</strong>ches.<br />
L.K. Lutcher and D.A. Horneck, area Extension agronomists;<br />
D.J. Wysocki and J.M. Hart, Extension soil scientists; S.E. Petrie,<br />
super<strong>in</strong>tendent, Columbia Bas<strong>in</strong> Agricultural Research and Extension<br />
Center; and N.W. Christensen, Extension soil scientist, retired;<br />
all of <strong>Oregon</strong> <strong>State</strong> University.
Crop demand for nitrogen<br />
Multiply expected yield by the nitrogen requirement<br />
to get crop demand for nitrogen. The nitrogen<br />
requirement, which is the amount of nitrogen<br />
required to produce 1 bushel of wheat, is based on<br />
a gra<strong>in</strong> prote<strong>in</strong> goal (Table 2).<br />
Table 2.—Gra<strong>in</strong> prote<strong>in</strong> goal and correspond<strong>in</strong>g<br />
nitrogen requirements (per bushel) for wheat.<br />
Gra<strong>in</strong> prote<strong>in</strong> Nitrogen requirement<br />
goal Average Range<br />
(%) (lb N/bu) (lb N/bu)<br />
9 2.2 2.0–2.4<br />
10 2.4 2.2–2.6<br />
11 2.7 2.4–2.9<br />
12 3.0 2.6–3.2<br />
13 3.3 2.8–3.5<br />
Nitrogen requirement<br />
Average nitrogen requirements are suitable<br />
for most situations. The ranges given <strong>in</strong><br />
Table 2 can be used to compensate for grow<strong>in</strong>g<br />
conditions or varieties that are genetically<br />
predisposed to hav<strong>in</strong>g lower or higher gra<strong>in</strong><br />
prote<strong>in</strong> content.<br />
A gra<strong>in</strong> prote<strong>in</strong> content of 10 percent is optimum<br />
for soft white wheat. Desired gra<strong>in</strong> prote<strong>in</strong> concentrations<br />
for hard wheat range from 11 to 13 percent.<br />
Nitrogen supply<br />
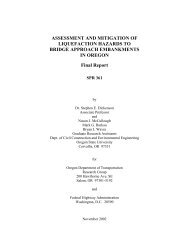
Figure 1.—Generalized relationship of wheat gra<strong>in</strong><br />
yield and gra<strong>in</strong> prote<strong>in</strong> to nitrogen supply.<br />
Nitrogen requirements for high-prote<strong>in</strong> hard wheat<br />
are greater than those for low-prote<strong>in</strong> soft wheat.<br />
The extra prote<strong>in</strong> <strong>in</strong> hard wheat accumulates <strong>in</strong><br />
gra<strong>in</strong> when plant uptake of nitrogen exceeds that<br />
required for maximum yield (Figure 1).<br />
Subtract soil test nitrogen<br />
Laboratory methods are used to test soil samples<br />
for plant-available nitrogen (soil test nitrogen).<br />
Collect samples from the effective root zone (usually<br />
4 feet) <strong>in</strong> 1-foot <strong>in</strong>crements and have them analyzed<br />
for nitrate nitrogen (NO 3-N). Samples from<br />
the surface foot also should be analyzed for ammonium<br />
nitrogen (NH 4-N). Add reported values for all<br />
depths to get total soil test nitrogen (Table 3).<br />
Table 3.—Soil test nitrogen for samples collected <strong>in</strong> 1-foot <strong>in</strong>crements. Values are used for the application<br />
rate calculations on page 3.<br />
Soil depth<br />
(<strong>in</strong>ches)<br />
Ammonium<br />
nitrogen<br />
(NH4-N)<br />
(lb/acre)<br />
Nitrate<br />
nitrogen<br />
(NO3-N)<br />
(lb/acre)<br />
Total soil<br />
test nitrogen<br />
(NH4-N + NO3-N)<br />
(lb/acre)<br />
Amount to<br />
subtract<br />
(lb/acre)<br />
0–12 5 15 20 20<br />
13–24 — 15 15 15<br />
25–36 — 10 10 10<br />
37–48 — 5 5 5<br />
Profile* 5 45 50 50<br />
49–60 ** — 12 12 —<br />
61–72 ** — 10 10 —<br />
* Calculation of the nitrogen application rate should be based on soil test results from the top 4 feet or the effective root zone.<br />
** Nitrogen <strong>in</strong> the fifth and sixth foot usually does not contribute to yield, but may <strong>in</strong>crease gra<strong>in</strong> prote<strong>in</strong>.<br />
<strong>W<strong>in</strong>ter</strong> <strong>Wheat</strong>, <strong>Summer</strong> <strong>Fallow</strong> Low Precipitation Zone<br />
<strong>Wheat</strong> yield<br />
maximum yield<br />
gra<strong>in</strong> prote<strong>in</strong><br />
Gra<strong>in</strong> prote<strong>in</strong>
Periodic assessment of nitrate concentration <strong>in</strong><br />
the fifth and sixth foot can be used to f<strong>in</strong>e-tune<br />
nitrogen management. If nitrate concentrations are<br />
high or <strong>in</strong>crease over time, consider adjust<strong>in</strong>g the<br />
application rate or the time of application. Split<br />
applications may improve nitrogen use efficiency.<br />
Example 1. A nitrogen application rate calculation<br />
for soft white common and club-type w<strong>in</strong>ter<br />
wheat (10% prote<strong>in</strong>).<br />
Assumptions <strong>in</strong>clude:<br />
• Expected yield of 40 bu/acre<br />
• Soil test nitrogen = 50 lb N/acre<br />
• Effective root<strong>in</strong>g depth of 4 feet<br />
(lb N/acre)<br />
Crop demand for nitrogen*<br />
(Expected yield) x (per-bushel N requirement)<br />
at desired prote<strong>in</strong><br />
(40 bu/acre) x (2.4 lb N/bu) @ 10% prote<strong>in</strong> ......................95<br />
Subtract soil test nitrogen<br />
0–12" ...........................................................................20<br />
13–24" ...........................................................................15<br />
25–36" ...........................................................................10<br />
37–48" .............................................................................5<br />
Total soil test nitrogen ..................................................50<br />
Nitrogen application rate.............................................45<br />
* Crop demand for nitrogen rounded to nearest 5 lb.<br />
Example . A nitrogen application rate calculation<br />
for hard red w<strong>in</strong>ter wheat (1 % prote<strong>in</strong>).<br />
Assumptions <strong>in</strong>clude:<br />
• Expected yield of 40 bu/acre<br />
• Soil test nitrogen = 50 lb N/acre<br />
• Effective root<strong>in</strong>g depth of 4 feet<br />
(lb N/acre)<br />
Crop demand for nitrogen<br />
(Expected yield) x (per-bushel N requirement)<br />
at desired prote<strong>in</strong><br />
(40 bu/acre) x (3.0 lb N/bu) @ 12% prote<strong>in</strong> ....................120<br />
Subtract soil test nitrogen<br />
0–12" ...........................................................................20<br />
13–24" ...........................................................................15<br />
25–36" ...........................................................................10<br />
37–48" .............................................................................5<br />
Total soil test nitrogen ..................................................50<br />
Nitrogen application rate.............................................70<br />
Example 3. A nitrogen application rate calculation<br />
for hard white w<strong>in</strong>ter wheat (13% prote<strong>in</strong>).<br />
Assumptions <strong>in</strong>clude:<br />
• Expected yield of 40 bu/acre<br />
• Soil test nitrogen = 50 lb N/acre<br />
• Effective root<strong>in</strong>g depth of 4 feet<br />
(lb N/acre)<br />
Crop demand for nitrogen *<br />
(Expected yield) x (per-bushel N requirement)<br />
at desired prote<strong>in</strong><br />
(40 bu/acre) x (3.3 lb N/bu) @ 13% prote<strong>in</strong> ....................130<br />
Subtract soil test nitrogen<br />
0–12" ...........................................................................20<br />
13–24" ...........................................................................15<br />
25–36" ...........................................................................10<br />
37–48" .............................................................................5<br />
Total soil test nitrogen ..................................................50<br />
Nitrogen application rate.............................................80<br />
* Crop demand for nitrogen rounded to nearest 5 lb.<br />
Adjust for excessive straw<br />
Nitrogen “tie-up” <strong>in</strong> crop residue (immobilization)<br />
temporarily reduces the amount of available<br />
nitrogen <strong>in</strong> the soil; immobilization can be a problem<br />
when greater-than-average quantities of straw<br />
are present <strong>in</strong> the field.<br />
Gra<strong>in</strong> yield can be used to estimate the quantity<br />
of straw. Straw loads <strong>in</strong>crease by about 100 lb/acre<br />
for each bushel <strong>in</strong>crease <strong>in</strong> yield. Adjust the calculated<br />
nitrogen application rate as shown <strong>in</strong><br />
Table 4 if gra<strong>in</strong> yield from the previous wheat<br />
crop exceeded the long-term field average by<br />
10 bu/acre or more.<br />
Table 4.—Nitrogen application rate adjustments for<br />
wheat yield (straw production) that is greater than<br />
the long-term field average.<br />
Greater-than-<br />
average Correspond<strong>in</strong>g Increase<br />
wheat yield <strong>in</strong>crease <strong>in</strong> application<br />
(previous crop) straw production rate by<br />
(bu/acre) (lb/acre) (lb N/acre)<br />
+10 1,000 10<br />
+20 2,000 20<br />
+30 3,000 30<br />
3<br />
<strong>W<strong>in</strong>ter</strong> <strong>Wheat</strong>, <strong>Summer</strong> <strong>Fallow</strong> Low Precipitation Zone
Adjust for soil sampl<strong>in</strong>g (spr<strong>in</strong>g of the<br />
summer-fallow year)<br />
Decrease the calculated application rate by<br />
10 to 20 lb N/acre if fields are sampled <strong>in</strong> the<br />
spr<strong>in</strong>g of the summer-fallow year. This adjustment<br />
will compensate for m<strong>in</strong>eralization. M<strong>in</strong>eralization<br />
is a biological process that <strong>in</strong>creases the supply of<br />
available nitrogen <strong>in</strong> the soil; it is favored by moist<br />
or wet soils and warm temperatures.<br />
M<strong>in</strong>eralization may <strong>in</strong>crease the supply of available<br />
nitrogen by more than 10 or 20 lb/acre when<br />
average or above-average precipitation follows a<br />
prolonged drought. Adjustment of the nitrogen<br />
application rate is not necessary if fields are<br />
sampled with<strong>in</strong> 6 weeks of fall seed<strong>in</strong>g.<br />
Review prote<strong>in</strong> content<br />
of harvested gra<strong>in</strong><br />
A postharvest review of gra<strong>in</strong> prote<strong>in</strong> can be a<br />
good way to evaluate application rates. Higherthan-desired<br />
prote<strong>in</strong> <strong>in</strong>dicates overfertilization—<br />
if grow<strong>in</strong>g conditions were normal or about average.<br />
High prote<strong>in</strong> also can be caused by unusually<br />
dry conditions or nitrogen that is positioned deep<br />
<strong>in</strong> the soil profile.<br />
Lower-than-desired prote<strong>in</strong> may be due to an<br />
<strong>in</strong>sufficient application rate. Low prote<strong>in</strong> also can<br />
be a problem when late-season ra<strong>in</strong>fall results <strong>in</strong><br />
above-average yield or when nitrogen losses occur<br />
dur<strong>in</strong>g or after application. Examples of nitrogen<br />
losses <strong>in</strong>clude “escape” of anhydrous ammonia<br />
from dry soil or an unsealed soil surface, volatilization<br />
of surface-applied urea, and nitrate leach<strong>in</strong>g<br />
below the root zone.<br />
Phosphorus<br />
Application of 20 to 30 lb P 2 O 5 /acre should<br />
<strong>in</strong>crease yield if soil test phosphorus (P) levels are<br />
5 ppm or less (Table 5). A phosphorus application<br />
is not recommended when soil test values are<br />
greater than 15 ppm.<br />
Table 5.—Recommended phosphorus fertilizer<br />
application rates for a range of soil test values.<br />
Amount of<br />
Soil test<br />
phosphorus (P)<br />
(ppm)*<br />
Plantavailable<br />
<strong>in</strong>dex<br />
phosphate<br />
(P O ) to apply<br />
5<br />
(lb/acre)**<br />
0–5 Very low 20–30<br />
6–10*** Low 10–20<br />
11–15*** Moderate 0–10<br />
Over 15 High 0<br />
* Plant-available <strong>in</strong>dex is correlated to sodium bicarbonate-<br />
extractable phosphorus only and does not apply to other test<br />
methods.<br />
** Recommended application rates apply to banded or subsurface<br />
shank applications.<br />
*** Phosphorus response <strong>in</strong> fields with soil test values between<br />
6 and 15 ppm is highly variable.<br />
Phosphorus response <strong>in</strong> fields with soil test<br />
values of 6 to 15 ppm is highly variable. Yield<br />
<strong>in</strong>creases from fertilization seem to be associated<br />
with: (1) high yield potentials, (2) late seed<strong>in</strong>g<br />
dates, or (3) root diseases that limit plant growth<br />
and development. In fields with soil test levels<br />
between 6 and 15 ppm, effects of fertilization are<br />
best evaluated through on-farm experiments.<br />
Optimum efficiency is achieved by band<strong>in</strong>g<br />
phosphorus. Placement of either liquid or dry<br />
material with the seed, below the seed, or below<br />
and to the side of seed is recommended. Sub-<br />
surface shank applications also are effective.<br />
Broadcast applications are not recommended.<br />
Soil sampl<strong>in</strong>g for phosphorus<br />
Collect soil samples for phosphorus test<strong>in</strong>g<br />
from the surface foot. Reported values are<br />
best thought of as an <strong>in</strong>dex of availability. The<br />
test cannot be used to calculate the pounds of<br />
plant-available P 2 O 5 per acre.<br />
4<br />
<strong>W<strong>in</strong>ter</strong> <strong>Wheat</strong>, <strong>Summer</strong> <strong>Fallow</strong> Low Precipitation Zone
Potassium<br />
Soil potassium (K) concentrations <strong>in</strong> the<br />
region generally are high or very high (>100 ppm<br />
extractable K). Fertilizer applications are not<br />
recommended.<br />
Sulfur<br />
Sulfur (S) is one of the most limit<strong>in</strong>g nutrients<br />
for wheat production—second only to nitrogen <strong>in</strong><br />
importance. The sulfur requirement of the wheat<br />
plant is about one-tenth the nitrogen requirement.<br />
Sulfur is necessary for optimum yield and highquality<br />
bak<strong>in</strong>g flour.<br />
Sulfur deficiencies <strong>in</strong> wheat are fairly common<br />
<strong>in</strong> the spr<strong>in</strong>g after a wet w<strong>in</strong>ter. Above-average<br />
precipitation moves sulfate-sulfur (SO 4 -S), the<br />
form of sulfur available to plants, below the root<br />
zone. Deficiency symptoms often disappear later<br />
<strong>in</strong> the season as root growth extends to deeper layers<br />
of the soil profile.<br />
The soil sulfur (SO 4 -S) test is not def<strong>in</strong>itive.<br />
Low or moderate soil test levels (Table 6) are<br />
a first <strong>in</strong>dication that fertilization might be<br />
warranted. Other factors need to be considered.<br />
Yield responses are more likely if one or more of<br />
the follow<strong>in</strong>g situations apply: (1) w<strong>in</strong>ter wheat is<br />
seeded late <strong>in</strong> the fall, (2) more than 5 years have<br />
passed s<strong>in</strong>ce the last application of sulfur, and/or<br />
(3) greater-than-average quantities of straw are<br />
present <strong>in</strong> the field. Field experience, observation,<br />
and on-farm experimentation provide valuable<br />
<strong>in</strong>formation about the need for sulfur.<br />
Soil sampl<strong>in</strong>g for sulfur<br />
Collect soil samples for sulfur (SO 4-S)<br />
test<strong>in</strong>g from the surface foot. The test is not<br />
def<strong>in</strong>itive, and reported values are best thought<br />
of as an <strong>in</strong>dex of availability. Field experience,<br />
observation, and on-farm experimentation<br />
provide valuable <strong>in</strong>formation about the need<br />
for sulfur.<br />
Table 6.—Plant-available sulfate-sulfur and<br />
recommended fertilizer application rates for a<br />
range of soil test values.<br />
Soil test Amount<br />
sulfate-sulfur Plant- of sulfur (S)<br />
(SO 4 -S) available to apply<br />
(ppm) <strong>in</strong>dex (lb/acre)*<br />
0–5 Low 10–15<br />
6–10 Moderate 10<br />
Over 10 High 0<br />
*A decision to apply sulfur should not be based on soil test results<br />
alone. Sulfur may be beneficial if SO 4 -S soil test values are low<br />
or moderate and if: (1) w<strong>in</strong>ter wheat is seeded late <strong>in</strong> the fall,<br />
(2) more than 5 years have passed s<strong>in</strong>ce the last application of<br />
sulfur, and/or (3) greater-than-average quantities of straw are present<br />
<strong>in</strong> the field.<br />
Optimum efficiency is achieved by band<strong>in</strong>g sulfur.<br />
Placement of either liquid or dry material with<br />
the seed, below the seed, or below and to the side<br />
of seed is recommended. Subsurface shank applications<br />
also are effective.<br />
Ammonium thiosulfate liquid (Thiosul,<br />
12-0-0-26) is an effective source of sulfur, but it<br />
can <strong>in</strong>jure or kill seedl<strong>in</strong>gs when placed with the<br />
seed. Avoid this problem by plac<strong>in</strong>g the product<br />
below or below and to the side of seed.<br />
Elemental sulfur should be used with caution<br />
because it is not immediately plant-available.<br />
Microorganisms oxidize elemental sulfur to plantavailable<br />
sulfate, but conversion occurs slowly and<br />
is regulated by the moisture status and temperature<br />
of the soil. Most of the elemental sulfur will not be<br />
available until 2 or 3 years after application. Rates<br />
of 100 lb elemental S/acre may be necessary to<br />
ensure that adequate sulfate is available dur<strong>in</strong>g the<br />
first grow<strong>in</strong>g season.<br />
Chloride<br />
Research shows that application of chloride (Cl)<br />
may <strong>in</strong>crease gra<strong>in</strong> yield, test weight, and/or kernel<br />
size. It is important to note, however, that these<br />
responses occur only some of the time.<br />
Chloride applications are known to <strong>in</strong>crease<br />
yield of w<strong>in</strong>ter wheat suffer<strong>in</strong>g from “Take-all”<br />
5<br />
<strong>W<strong>in</strong>ter</strong> <strong>Wheat</strong>, <strong>Summer</strong> <strong>Fallow</strong> Low Precipitation Zone
oot rot, and they reduce the severity of physiological<br />
leaf spot. Yield responses <strong>in</strong> the absence<br />
of disease also have been observed and may be a<br />
consequence of improved plant–water relations.<br />
Consider apply<strong>in</strong>g chloride if soil test concentrations<br />
<strong>in</strong> the surface foot are less than 10 ppm.<br />
The recommended application rate for chloride is<br />
10 to 30 lb/acre. Benefits from fertilization may<br />
last for several years.<br />
Yield <strong>in</strong>creases, when they occur, usually range<br />
from 2 to 5 bu/acre. Responses are most often<br />
associated with above-average yield. Growers<br />
are advised to experiment with chloride on small<br />
acreages.<br />
Do not apply chloride with the seed; it is a<br />
soluble salt that can delay germ<strong>in</strong>ation or <strong>in</strong>jure<br />
or kill germ<strong>in</strong>at<strong>in</strong>g seeds. Ra<strong>in</strong> is required after<br />
application to move surface-broadcast chloride<br />
<strong>in</strong>to the root zone.<br />
Potassium chloride (KCl) is the most readily<br />
available source of chloride.<br />
Z<strong>in</strong>c<br />
Z<strong>in</strong>c (Zn) fertilization of dryland wheat has<br />
not been economical <strong>in</strong> research trials. On-farm<br />
experiments with fertilization should be limited to<br />
small acreages. A z<strong>in</strong>c application rate of 5 lb/acre<br />
is appropriate. A 10 lb/acre application should last<br />
for several years.<br />
The potential for a gra<strong>in</strong> yield response<br />
<strong>in</strong>creases when DTPA-extractable soil test z<strong>in</strong>c<br />
values (surface foot) are less than 0.3 ppm, soil<br />
phosphorus levels are moderate to high, the soil<br />
pH is greater than 7.5, and yield potential exceeds<br />
50 bu/acre.<br />
6<br />
<strong>W<strong>in</strong>ter</strong> <strong>Wheat</strong>, <strong>Summer</strong> <strong>Fallow</strong> Low Precipitation Zone
For more <strong>in</strong>formation<br />
*Brown, B.D., M.J. Westcott, N.W. Christensen,<br />
W.L. Pan, and J.C. Stark. 2005. Nitrogen Management<br />
for Hard <strong>Wheat</strong> Prote<strong>in</strong> Enhancement,<br />
PNW 578.<br />
Christensen, N.W., R.G. Taylor, T.L. Jackson, and<br />
B.L. Mitchell. Chloride Effects on Water Potentials<br />
and Yield of <strong>W<strong>in</strong>ter</strong> <strong>Wheat</strong> Infected with<br />
Take-all Root Rot. Agron. J. 73:1053–1058.<br />
Cook, R.J. and R.J. Veseth. 1991. <strong>Wheat</strong> Health<br />
Management. The American Phytopathological<br />
Society, St. Paul, MN, APS Press.<br />
*Douglas, C.L., D.J. Wysocki, J.F. Zuzel,<br />
R.W. Rickman, and B.L. Klepper. 1990. Agronomic<br />
Zones for the Dryland Pacific Northwest,<br />
PNW 354.<br />
*Hart, J.M. 2002. Analytical Laboratories Serv<strong>in</strong>g<br />
<strong>Oregon</strong>: Soil, Water, Plant Tissue, and Feed<br />
Analysis, EM 8677.<br />
*Marx, E.S., J.M. Hart, and R.G. Stevens. 1999.<br />
Soil Test Interpretation Guide, EC 1478.<br />
Nibler, F.J. Fertilizer Requirements of <strong>Wheat</strong><br />
Grown Under Conservation Tillage. M.S.<br />
Thesis, <strong>Oregon</strong> <strong>State</strong> University, 1986.<br />
Petrie, S.E., P.M. Hayes, N.W. Blake, A.E. Corey,<br />
K.E. Rh<strong>in</strong>hart, and K.G. Campbell. 2004. Chloride<br />
Fertilization Increased <strong>W<strong>in</strong>ter</strong> <strong>Wheat</strong> and<br />
Barley Yield <strong>in</strong> Northeastern <strong>Oregon</strong>.<br />
In: Columbia Bas<strong>in</strong> Agricultural Research<br />
Center Annual Report, 2004. <strong>Oregon</strong> <strong>State</strong><br />
University.<br />
Pumphrey, F.V. and P.E. Rasmussen. 1982. <strong>W<strong>in</strong>ter</strong><br />
<strong>Wheat</strong> Fertilization <strong>in</strong> the Northeast Intermounta<strong>in</strong><br />
Region of <strong>Oregon</strong>, CI 691 (<strong>Oregon</strong> <strong>State</strong><br />
University).<br />
Rasmussen P.E. and P.O. Kresge. 1986. Plant<br />
Response to Sulfur <strong>in</strong> the Western United<br />
<strong>State</strong>s. In: Sulfur <strong>in</strong> Agriculture. M.A. Tabatabai<br />
(ed.). Agronomy Monograph (27). ASA-CSSA-<br />
SSSA. Madison, WI.<br />
Stoskopf, N.C. 1985. Cereal Gra<strong>in</strong> Crops. Reston,<br />
VA, Reston Publish<strong>in</strong>g Company, Inc.<br />
*<strong>Oregon</strong> <strong>State</strong> University and Pacific Northwest Extension publications<br />
Many OSU and PNW Extension publications, <strong>in</strong>clud<strong>in</strong>g the publications <strong>in</strong> this set of fertilizer<br />
guides, may be viewed or downloaded from the Web. Visit the onl<strong>in</strong>e Publications and Videos catalog<br />
at http://extension.oregonstate.edu/catalog/<br />
Copies of many of our publications and videos also are available from OSU Extension and Experiment<br />
Station Communications. For prices and order<strong>in</strong>g <strong>in</strong>formation, visit our onl<strong>in</strong>e catalog or contact<br />
us by fax (541-737-0817), e-mail (puborders@oregonstate.edu), or phone (541-737-2513).<br />
<strong>W<strong>in</strong>ter</strong> <strong>Wheat</strong>, <strong>Summer</strong> <strong>Fallow</strong> Low Precipitation Zone
© 2006 <strong>Oregon</strong> <strong>State</strong> University.<br />
This publication was produced and distributed <strong>in</strong> furtherance of the Acts of Congress of May 8 and June 30, 1914. Extension work is a cooperative program of<br />
<strong>Oregon</strong> <strong>State</strong> University, the U.S. Department of Agriculture, and <strong>Oregon</strong> counties. <strong>Oregon</strong> <strong>State</strong> University Extension Service offers educational programs,<br />
activities, and materials—without regard to race, color, religion, sex, sexual orientation, national orig<strong>in</strong>, age, marital status, disability, and disabled veteran or<br />
Vietnam-era veteran status. <strong>Oregon</strong> <strong>State</strong> University Extension Service is an Equal Opportunity Employer.<br />
Trade-name products and services are mentioned as illustrations only. This does not mean that the <strong>Oregon</strong> <strong>State</strong> University Extension Service either endorses<br />
these products and services or <strong>in</strong>tends to discrim<strong>in</strong>ate aga<strong>in</strong>st products and services not mentioned.<br />
Published September 2005 as FG 80-E. Revised November 2006.