Ntsb/aar-79-01 - AirDisaster.Com
Ntsb/aar-79-01 - AirDisaster.Com
Ntsb/aar-79-01 - AirDisaster.Com

You also want an ePaper? Increase the reach of your titles
YUMPU automatically turns print PDFs into web optimized ePapers that Google loves.
.ent<br />
of<br />
'.dent.<br />
.mes ,<br />
cive<br />
!h<br />
.so<br />
lngth<br />
cular<br />
.clusion<br />
ss<br />
- 17 -<br />
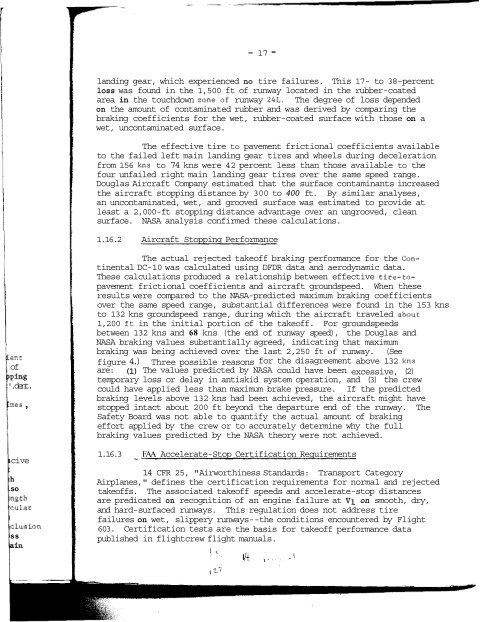
landing gear, which experienced no tire failures. This 17- to 38-percent<br />
loss was found in the 1,500 ft of runway located in the rubber-coated<br />
area in the touchdown zone'of runway 24L. The degree of loss depended<br />
on the amount of contaminated rubber and was derived by comparing the<br />
braking coefficients for the wet, rubber-coated surface with those on a<br />
wet, uncontaminated surface.<br />
The effective tire to pavement frictional coefficients available<br />
to the failed left main landing gear tires and wheels during deceleration<br />
from 156 kns to 74 kns were 42 percent less than those available to the<br />
four unfailed right main landing gear tires over the same speed range.<br />
Douglas Aircraft <strong>Com</strong>pany estimated that the surface contaminants increased<br />
the aircraft stopping distance by 300 to 400 ft. By similar analyses,<br />
an uncontaminated, wet, and grooved surface was estimated to provide at<br />
least a 2,000-ft stopping distance advantage over an ungrooved, clean<br />
surface. NASA analysis confirmed these calculations.<br />
1.16.2 Aircraft Stopping Performance<br />
The actual rejected takeoff braking performance for the Continental<br />
DC-10 was calculated using DFDR data and aerodynamic data.<br />
These calculations produced a relationship between effective tire-topavement<br />
frictional coefficients and aircraft groundspeed. When these<br />
results were compared to the NASA-predicted maximum braking coefficients<br />
over the same speed range, substantial differences were found in the 153 kns<br />
to 132 kns groundspeed range, during which the aircraft traveled about<br />
1,200 ft in the initial portion of the takeoff. For groundspeeds<br />
between 132 kns and 68 kns (the end of runway speed), the Douglas and<br />
NASA braking values substantially agreed, indicating that maximum<br />
braking was being achieved over the last 2,250 ft of runway. (See<br />
figure 4.) Three possible reasons for the disagreement above 132 kns<br />
are: (1) The values predicted by NASA could have been excessive, (2)<br />
temporary loss or delay in antiskid system operation, and (3) the crew<br />
could have applied less than maximum brake pressure. If the predicted<br />
braking levels above 132 kns had been achieved, the aircraft might have<br />
stopped intact about 200 ft beyond the departure end of the runway. The<br />
Safety Board was not able to quantify the actual amount of braking<br />
effort applied by the crew or to accurately determine why the full<br />
braking values predicted by the NASA theory were not achieved.<br />
1.16.3 FAA Accelerate-Stop Certification Requirements<br />
*<br />
14 CFR 25, "Airworthiness Standards: Transport Category<br />
Airplanes," defines the certification requirements for normal and rejected<br />
takeoffs. The associated takeoff speeds and accelerate-stop distances<br />
are predicated on recognition of an engine failure at Vi on smooth, dry,<br />
and hard-surfaced runways. This regulation does not address tire<br />
failures on wet, slippery runways--the conditions encountered by Flight<br />
603. Certification tests are the basis for takeoff performance data<br />
published in flightcrew flight manuals.