Payback and Process- Energy Monitoring Payback
This article highlights the direct and indirect payback from energy monitoring. Direct payback comes from quick change such as organizational behavior. Indirect payback comes from more calculated changes in tariff schedules and usage practices, billing and peak demand, and load profiling. Payback is directly dependent on key variables that can only be identified with intensive monitoring. Two illustrative case studies on a school and manufacturing facility are included to further prove the importance of energy monitoring. There is a great visual flow graph on the last page that illustrates the ideas expressed.
This article highlights the direct and indirect payback from energy monitoring. Direct payback comes from quick change such as organizational behavior. Indirect payback comes from more calculated changes in tariff schedules and usage practices, billing and peak demand, and load profiling. Payback is directly dependent on key variables that can only be identified with intensive monitoring. Two illustrative case studies on a school and manufacturing facility are included to further prove the importance of energy monitoring. There is a great visual flow graph on the last page that illustrates the ideas expressed.

Create successful ePaper yourself
Turn your PDF publications into a flip-book with our unique Google optimized e-Paper software.
What to Monitor<br />
<strong>Monitoring</strong> of total electrical consumption <strong>and</strong> sometimes key load centers<br />
provides important data that can be analyzed to give key cost reduction<br />
information. Guidelines from the DOE <strong>and</strong> similar sources recommend using<br />
“live” or “real-time” data for reporting <strong>and</strong> analysis. Automated alerting <strong>and</strong><br />
real-time cost analysis are extended benefits that enable decisive, cost<br />
reduction actions.<br />
<strong>Monitoring</strong> Benefits<br />
Reduced energy costs <strong>and</strong> reduced energy dem<strong>and</strong>s on the power grid are the<br />
foundational benefits. <strong>Monitoring</strong> also provides the ability to verify efficiency<br />
improvements, effectively reduce loads, calculate the ideal tariff schedule <strong>and</strong><br />
verify billing accuracy.<br />
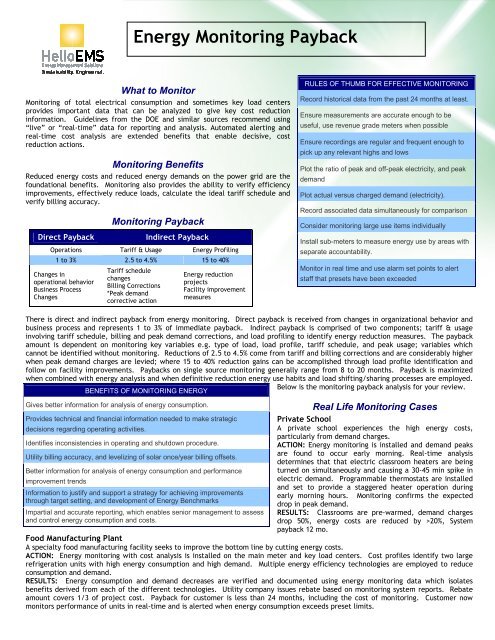
<strong>Monitoring</strong> <strong>Payback</strong><br />
Direct <strong>Payback</strong> Indirect <strong>Payback</strong><br />
Operations Tariff & Usage <strong>Energy</strong> Profiling<br />
1 to 3% 2.5 to 4.5% 15 to 40%<br />
Changes in<br />
operational behavior<br />
Business <strong>Process</strong><br />
Changes<br />
Tariff schedule<br />
changes<br />
Billing Corrections<br />
*Peak dem<strong>and</strong><br />
corrective action<br />
<strong>Energy</strong> reduction<br />
projects<br />
Facility improvement<br />
measures<br />
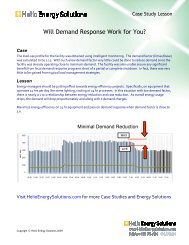
There is direct <strong>and</strong> indirect payback from energy monitoring. Direct payback is received from changes in organizational behavior <strong>and</strong><br />
business process <strong>and</strong> represents 1 to 3% of immediate payback. Indirect payback is comprised of two components; tariff & usage<br />
involving tariff schedule, billing <strong>and</strong> peak dem<strong>and</strong> corrections, <strong>and</strong> load profiling to identify energy reduction measures. The payback<br />
amount is dependent on monitoring key variables e.g. type of load, load profile, tariff schedule, <strong>and</strong> peak usage; variables which<br />
cannot be identified without monitoring. Reductions of 2.5 to 4.5% come from tariff <strong>and</strong> billing corrections <strong>and</strong> are considerably higher<br />
when peak dem<strong>and</strong> charges are levied; where 15 to 40% reduction gains can be accomplished through load profile identification <strong>and</strong><br />
follow on facility improvements. <strong>Payback</strong>s on single source monitoring generally range from 8 to 20 months. <strong>Payback</strong> is maximized<br />
when combined with energy analysis <strong>and</strong> when definitive reduction energy use habits <strong>and</strong> load shifting/sharing processes are employed.<br />
Below is the monitoring payback analysis for your review.<br />
BENEFITS OF MONITORING ENERGY<br />
Gives better information for analysis of energy consumption.<br />
Provides technical <strong>and</strong> financial information needed to make strategic<br />
decisions regarding operating activities.<br />
Identifies inconsistencies in operating <strong>and</strong> shutdown procedure.<br />
Utility billing accuracy, <strong>and</strong> levelizing of solar once/year billing offsets.<br />
Better information for analysis of energy consumption <strong>and</strong> performance<br />
improvement trends<br />
<strong>Energy</strong> <strong>Monitoring</strong> <strong>Payback</strong><br />
Information to justify <strong>and</strong> support a strategy for achieving improvements<br />
through target setting, <strong>and</strong> development of <strong>Energy</strong> Benchmarks<br />
Impartial <strong>and</strong> accurate reporting, which enables senior management to assess<br />
<strong>and</strong> control energy consumption <strong>and</strong> costs.<br />
RULES OF THUMB FOR EFFECTIVE MONITORING<br />
Record historical data from the past 24 months at least.<br />
Ensure measurements are accurate enough to be<br />
useful, use revenue grade meters when possible<br />
Ensure recordings are regular <strong>and</strong> frequent enough to<br />
pick up any relevant highs <strong>and</strong> lows<br />
Plot the ratio of peak <strong>and</strong> off-peak electricity, <strong>and</strong> peak<br />
dem<strong>and</strong><br />
Plot actual versus charged dem<strong>and</strong> (electricity).<br />
Record associated data simultaneously for comparison<br />
Consider monitoring large use items individually<br />
Install sub-meters to measure energy use by areas with<br />
separate accountability.<br />
Monitor in real time <strong>and</strong> use alarm set points to alert<br />
staff that presets have been exceeded<br />
Real Life <strong>Monitoring</strong> Cases<br />
Private School<br />
A private school experiences the high energy costs,<br />
particularly from dem<strong>and</strong> charges.<br />
ACTION: <strong>Energy</strong> monitoring is installed <strong>and</strong> dem<strong>and</strong> peaks<br />
are found to occur early morning. Real-time analysis<br />
determines that that electric classroom heaters are being<br />
turned on simultaneously <strong>and</strong> causing a 30-45 min spike in<br />
electric dem<strong>and</strong>. Programmable thermostats are installed<br />
<strong>and</strong> set to provide a staggered heater operation during<br />
early morning hours. <strong>Monitoring</strong> confirms the expected<br />
drop in peak dem<strong>and</strong>.<br />
RESULTS: Classrooms are pre-warmed, dem<strong>and</strong> charges<br />
drop 50%, energy costs are reduced by >20%, System<br />
payback 12 mo.<br />
Food Manufacturing Plant<br />
A specialty food manufacturing facility seeks to improve the bottom line by cutting energy costs.<br />
ACTION: <strong>Energy</strong> monitoring with cost analysis is installed on the main meter <strong>and</strong> key load centers. Cost profiles identify two large<br />
refrigeration units with high energy consumption <strong>and</strong> high dem<strong>and</strong>. Multiple energy efficiency technologies are employed to reduce<br />
consumption <strong>and</strong> dem<strong>and</strong>.<br />
RESULTS: <strong>Energy</strong> consumption <strong>and</strong> dem<strong>and</strong> decreases are verified <strong>and</strong> documented using energy monitoring data which isolates<br />
benefits derived from each of the different technologies. Utility company issues rebate based on monitoring system reports. Rebate<br />
amount covers 1/3 of project cost. <strong>Payback</strong> for customer is less than 24 months, including the cost of monitoring. Customer now<br />
monitors performance of units in real-time <strong>and</strong> is alerted when energy consumption exceeds preset limits.
The Cost Reduction Solution