technologies for the monitoring and prevention of driver - Driving ...
technologies for the monitoring and prevention of driver - Driving ...
technologies for the monitoring and prevention of driver - Driving ...

You also want an ePaper? Increase the reach of your titles
YUMPU automatically turns print PDFs into web optimized ePapers that Google loves.
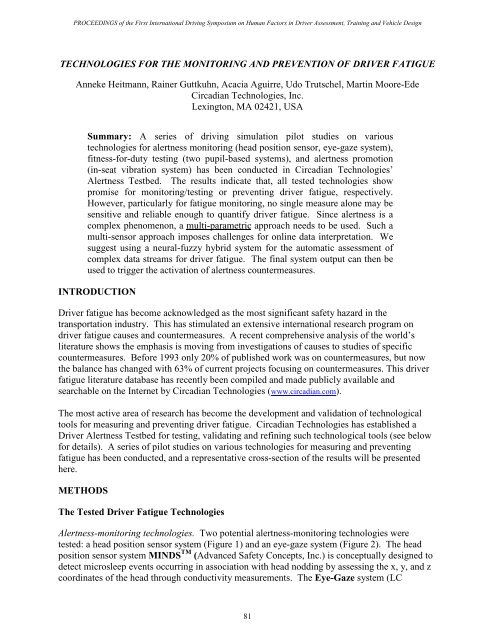
PROCEEDINGS <strong>of</strong> <strong>the</strong> First International <strong>Driving</strong> Symposium on Human Factors in Driver Assessment, Training <strong>and</strong> Vehicle Design<br />
TECHNOLOGIES FOR THE MONITORING AND PREVENTION OF DRIVER FATIGUE<br />
Anneke Heitmann, Rainer Guttkuhn, Acacia Aguirre, Udo Trutschel, Martin Moore-Ede<br />
Circadian Technologies, Inc.<br />
Lexington, MA 02421, USA<br />
Summary: A series <strong>of</strong> driving simulation pilot studies on various<br />
<strong>technologies</strong> <strong>for</strong> alertness <strong>monitoring</strong> (head position sensor, eye-gaze system),<br />
fitness-<strong>for</strong>-duty testing (two pupil-based systems), <strong>and</strong> alertness promotion<br />
(in-seat vibration system) has been conducted in Circadian Technologies’<br />
Alertness Testbed. The results indicate that, all tested <strong>technologies</strong> show<br />
promise <strong>for</strong> <strong>monitoring</strong>/testing or preventing <strong>driver</strong> fatigue, respectively.<br />
However, particularly <strong>for</strong> fatigue <strong>monitoring</strong>, no single measure alone may be<br />
sensitive <strong>and</strong> reliable enough to quantify <strong>driver</strong> fatigue. Since alertness is a<br />
complex phenomenon, a multi-parametric approach needs to be used. Such a<br />
multi-sensor approach imposes challenges <strong>for</strong> online data interpretation. We<br />
suggest using a neural-fuzzy hybrid system <strong>for</strong> <strong>the</strong> automatic assessment <strong>of</strong><br />
complex data streams <strong>for</strong> <strong>driver</strong> fatigue. The final system output can <strong>the</strong>n be<br />
used to trigger <strong>the</strong> activation <strong>of</strong> alertness countermeasures.<br />
INTRODUCTION<br />
Driver fatigue has become acknowledged as <strong>the</strong> most significant safety hazard in <strong>the</strong><br />
transportation industry. This has stimulated an extensive international research program on<br />
<strong>driver</strong> fatigue causes <strong>and</strong> countermeasures. A recent comprehensive analysis <strong>of</strong> <strong>the</strong> world’s<br />
literature shows <strong>the</strong> emphasis is moving from investigations <strong>of</strong> causes to studies <strong>of</strong> specific<br />
countermeasures. Be<strong>for</strong>e 1993 only 20% <strong>of</strong> published work was on countermeasures, but now<br />
<strong>the</strong> balance has changed with 63% <strong>of</strong> current projects focusing on countermeasures. This <strong>driver</strong><br />
fatigue literature database has recently been compiled <strong>and</strong> made publicly available <strong>and</strong><br />
searchable on <strong>the</strong> Internet by Circadian Technologies (www.circadian.com).<br />
The most active area <strong>of</strong> research has become <strong>the</strong> development <strong>and</strong> validation <strong>of</strong> technological<br />
tools <strong>for</strong> measuring <strong>and</strong> preventing <strong>driver</strong> fatigue. Circadian Technologies has established a<br />
Driver Alertness Testbed <strong>for</strong> testing, validating <strong>and</strong> refining such technological tools (see below<br />
<strong>for</strong> details). A series <strong>of</strong> pilot studies on various <strong>technologies</strong> <strong>for</strong> measuring <strong>and</strong> preventing<br />
fatigue has been conducted, <strong>and</strong> a representative cross-section <strong>of</strong> <strong>the</strong> results will be presented<br />
here.<br />
METHODS<br />
The Tested Driver Fatigue Technologies<br />
Alertness-<strong>monitoring</strong> <strong>technologies</strong>. Two potential alertness-<strong>monitoring</strong> <strong>technologies</strong> were<br />
tested: a head position sensor system (Figure 1) <strong>and</strong> an eye-gaze system (Figure 2). The head<br />
position sensor system MINDS TM (Advanced Safety Concepts, Inc.) is conceptually designed to<br />
detect microsleep events occurring in association with head nodding by assessing <strong>the</strong> x, y, <strong>and</strong> z<br />
coordinates <strong>of</strong> <strong>the</strong> head through conductivity measurements. The Eye-Gaze system (LC<br />
81
PROCEEDINGS <strong>of</strong> <strong>the</strong> First International <strong>Driving</strong> Symposium on Human Factors in Driver Assessment, Training <strong>and</strong> Vehicle Design<br />
Technologies, Inc.) originally developed <strong>for</strong> <strong>the</strong> eye-controlled operation <strong>of</strong> computer systems,<br />
uses a pupil center corneal reflection method to determine <strong>the</strong> x/y/z-direction <strong>of</strong> <strong>the</strong> eye’s gaze<br />
<strong>and</strong>, in addition, provides in<strong>for</strong>mation regarding pupil diameter, blinking, <strong>and</strong> eye fixation.<br />
Figure 1: MINDS TM Head Position System Figure 2: Eye-Gaze System. Reflection Eye<br />
Backround (1), Cornea (2) <strong>and</strong> Fovea (3)<br />
Fitness-<strong>for</strong>-duty <strong>technologies</strong>. Two potential fitness-<strong>for</strong>-duty systems were tested. Both systems<br />
use pupillometric measures (Figures 3 <strong>and</strong> 4). SafetyScope TM (Eye Dynamics, Inc.), originally<br />
designed <strong>for</strong> alcohol <strong>and</strong> drug testing, uses a 90-second test to record pupil diameter <strong>and</strong> eye<br />
movement parameters while <strong>the</strong> test person fixates on a light displayed in <strong>the</strong> device. The test<br />
results are compared to <strong>the</strong> individual’s baseline <strong>and</strong> classified into <strong>the</strong> categories passed, failed<br />
<strong>and</strong> invalid. The Mayo Pupillometry System, originally developed <strong>for</strong> <strong>the</strong> clinical assessment <strong>of</strong><br />
narcoleptic patients, uses a 15-minute pupillogram recording to compute parameters <strong>of</strong> hippus<br />
(rhythmic dilation <strong>and</strong> contraction <strong>of</strong> <strong>the</strong> pupil), miosis (pupil constriction) <strong>and</strong> blink rate.<br />
Figure 3: SafetyScope TM System Figure 4: Mayo Pupillometry System<br />
82<br />
¬<br />
-<br />
®
PROCEEDINGS <strong>of</strong> <strong>the</strong> First International <strong>Driving</strong> Symposium on Human Factors in Driver Assessment, Training <strong>and</strong> Vehicle Design<br />
Fatigue countermeasure <strong>technologies</strong>. An in-seat vibration system was tested as a potential<br />
<strong>driver</strong> fatigue countermeasure. This TACT TM technology (InSeat Solutions, LLC) was applied<br />
in two different delivery modes: r<strong>and</strong>om signal <strong>and</strong> triggered signal (initiated online by <strong>the</strong><br />
experimenter based on behavioral sleepiness signs such as prolonged eye closures).<br />
The CTI Alertness Testbed<br />
Circadian Technologies’ Alertness Testbed uses a multi-parametric approach including<br />
per<strong>for</strong>mance measures in driving simulator <strong>and</strong> o<strong>the</strong>r vigilance tasks, physiological sleepiness<br />
measures (EEG microsleep events), behavioral signs <strong>of</strong> sleepiness (e.g., prolonged eye closures,<br />
multiple blinks, head nodding, yawning etc.), <strong>and</strong> subjective sleepiness measures (e.g., Visual<br />
Analog Sleepiness Scales, Thayer Activation-Deactivation Checklist). Typically, <strong>the</strong> <strong>driver</strong><br />
alertness testbed is used to simulate <strong>driver</strong> fatigue in overnight protocols with sleep deprived<br />
volunteers motivated by payments <strong>for</strong> safe driving per<strong>for</strong>mance. Volunteers participate in a<br />
series <strong>of</strong> test sessions with each session including a 30-50 minute driving task <strong>and</strong> o<strong>the</strong>r<br />
per<strong>for</strong>mance <strong>and</strong> alertness tests. Electrophysiological signals (four EEG channels, two EOG<br />
channels, EMG, ECG) are continuously recorded throughout <strong>the</strong> experiment, <strong>and</strong> <strong>the</strong> subject’s<br />
face is video-taped during each driving session. Table 1 summarizes <strong>the</strong> test protocols <strong>and</strong><br />
subject in<strong>for</strong>mation <strong>for</strong> <strong>the</strong> pilot studies.<br />
MINDS TM<br />
Pilot Study<br />
Experimental<br />
Time Period<br />
Number <strong>of</strong><br />
Test Sessions Per Experiment<br />
83<br />
Subjects<br />
2200-0900<br />
8<br />
4 (25-32 years)<br />
Eyegaze<br />
0100-0800<br />
7<br />
11(20-34 years)<br />
SafetyScope TM 1400-0700 9 6 (22-33 years)<br />
Mayo Pupillometry System 1000-1100 13 5 (25-32 years)<br />
TACT TM - I 0100-0800 7 3 (21-28 years)<br />
3 test nights per subject<br />
TACT TM - II 2200-0900 8 4 (25-32 years)<br />
RESULTS<br />
Table 1: Test Protocols <strong>and</strong> Subject In<strong>for</strong>mation <strong>for</strong> <strong>the</strong> Pilot Studies.<br />
MINDS TM Head Position Sensor Study<br />
Comparisons between <strong>the</strong> MINDS data <strong>and</strong> simultaneous video recordings showed that head<br />
nodding is clearly visible in <strong>the</strong> MINDS data. Figure 5 illustrates a raw data example <strong>for</strong> a<br />
period including an EEG microsleep event characterized by increased activity in <strong>the</strong> EEG alpha<br />
b<strong>and</strong> 8-12.5 Hz. The microsleep was preceded by three head nod events, <strong>and</strong> followed by a<br />
crash in <strong>the</strong> driving simulation task. However, microsleeps also occurred in <strong>the</strong> absence <strong>of</strong><br />
obvious head nodding.
PROCEEDINGS <strong>of</strong> <strong>the</strong> First International <strong>Driving</strong> Symposium on Human Factors in Driver Assessment, Training <strong>and</strong> Vehicle Design<br />
Figure 5: EEG <strong>and</strong> MINDS data example <strong>of</strong> one test subject <strong>for</strong> a 30-second period at 06:42.<br />
Eye-Gaze Study<br />
Eye-gaze data appears to contain in<strong>for</strong>mation about microsleep events several seconds be<strong>for</strong>e <strong>the</strong><br />
real event takes place. Figure 6 illustrates a recording that includes a microsleep event.<br />
Approximately 10 seconds be<strong>for</strong>e <strong>the</strong> microsleep event occurs, <strong>the</strong> pupil diameter shows a<br />
slowly fluctuating pattern correlated to no change (blank stare) in <strong>the</strong> eye-gaze coordinates.<br />
Closer to <strong>the</strong> microsleep event <strong>the</strong> pupil diameter decreases <strong>and</strong> <strong>the</strong> eye-gaze coordinates are<br />
drifting until <strong>the</strong> eyes are closed. Especially interesting is <strong>the</strong> behavior <strong>of</strong> <strong>the</strong> eye after <strong>the</strong><br />
second eye closure event, which was cut short by an accident. Immediately after <strong>the</strong> accident, a<br />
sharp increase in <strong>the</strong> pupil diameter occurred in connection with rapid oscillations in <strong>the</strong> eyegaze<br />
coordinates. This is <strong>the</strong> typical pattern <strong>for</strong> a person who is suddenly aroused by <strong>the</strong><br />
accident <strong>and</strong> tries to re-orient himself.<br />
Figure 6: Eye-Gaze data <strong>for</strong> a microsleep event causing prolonged eye closure <strong>of</strong> approximately<br />
6 seconds. The thick solid line represents <strong>the</strong> pupil diameter, <strong>the</strong> thin solid lines represent<br />
horizontal <strong>and</strong> vertical eye coordinate as a function <strong>of</strong> time. The dotted line shows <strong>the</strong> response<br />
<strong>of</strong> a Neural-Fuzzy Hybrid system <strong>for</strong> <strong>the</strong> automatic detection <strong>of</strong> microsleep events.<br />
84
PROCEEDINGS <strong>of</strong> <strong>the</strong> First International <strong>Driving</strong> Symposium on Human Factors in Driver Assessment, Training <strong>and</strong> Vehicle Design<br />
SafetyScope TM Study<br />
SafetyScope TM indicated non-passed test results particularly at nighttime when <strong>the</strong> highest<br />
sleepiness levels occurred. 100% <strong>of</strong> <strong>the</strong> non-passed tests occurred ei<strong>the</strong>r at night or during <strong>the</strong><br />
mid-afternoon alertness dip. For <strong>the</strong> 2400-0700 nighttime window, <strong>the</strong> percentage <strong>of</strong> non-passed<br />
tests (relative to <strong>the</strong> total number <strong>of</strong> tests) was 25 %, which corresponds to <strong>the</strong> tests <strong>of</strong> <strong>the</strong><br />
sleepiest subjects. Results <strong>for</strong> SafetyScope <strong>and</strong> one Alertness Testbed parameter <strong>of</strong> one<br />
individual are shown in Figure 7.<br />
Figure 7: Subjective sleepiness (Visual Analog Sleepiness Scale) <strong>and</strong> SafetyScope results <strong>for</strong> one<br />
individual.<br />
Mayo Pupillometry Study<br />
Mayo pupillometric measures <strong>for</strong> miosis, hippus <strong>and</strong> blink rate reflected <strong>the</strong> circadian<br />
fluctuations (correlation analysis) found in <strong>the</strong> Alertness Testbed measures such as subjective<br />
alertness, driving per<strong>for</strong>mance, vigilance per<strong>for</strong>mance, <strong>and</strong> behavioral signs <strong>of</strong> sleepiness –<br />
showing clearly increased sleepiness levels at nighttime (see Figure 8). However, correlations<br />
between pupil parameters <strong>and</strong> microsleep events during <strong>the</strong> pupil test appeared to be ra<strong>the</strong>r weak.<br />
F F T<br />
1.8<br />
1.6<br />
1.4<br />
1.2<br />
1.0<br />
0.8<br />
0.6<br />
0.4<br />
0.2<br />
0.0<br />
Figure 8: Circadian time course <strong>for</strong> group averages <strong>of</strong> one Mayo pupillometry parameter (miosis)<br />
(left) <strong>and</strong> one driving per<strong>for</strong>mance parameter (right)<br />
TACT TM study<br />
S L E E P I N E S S L E V E L<br />
100<br />
10 12 14 16 18 20 22 0 2 4 6 8 10<br />
T I M E O F D A Y (hours)<br />
80<br />
60<br />
40<br />
20<br />
0<br />
SafetyScope<br />
Passed<br />
Invalid<br />
Failed<br />
Be<strong>for</strong>e <strong>Driving</strong><br />
After <strong>Driving</strong><br />
Reported Nodding-Off While <strong>Driving</strong><br />
*<br />
14 16 18 20 22 24 2 4 6 8<br />
T I M E O F D A Y (hours)<br />
The pilot studies suggested that vibro-tactile stimulation using <strong>the</strong> TACT system holds promise<br />
as an effective way to help <strong>driver</strong>s stay awake. This was reflected in various Alertness Testbed<br />
85<br />
R E A C T I O N T I M E (seconds)<br />
3<br />
2<br />
1<br />
0<br />
*<br />
very<br />
sleepy<br />
very<br />
alert<br />
10 12 14 16 18 20 22 0 2 4 6 8 10<br />
T I M E O F D A Y (hours)
PROCEEDINGS <strong>of</strong> <strong>the</strong> First International <strong>Driving</strong> Symposium on Human Factors in Driver Assessment, Training <strong>and</strong> Vehicle Design<br />
parameters. For example, head nodding – indicating severe sleepiness – was considerably<br />
reduced during driving sessions with TACT signal as compared to subsequent non-TACT<br />
sessions (Figure 9). The TACT<br />
system tended to be most effective at intermediate sleepiness levels. No over-reactive steering<br />
corrections were observed after TACT onset.<br />
Figure 9: Number <strong>of</strong> head nodding events during simulated driving at nighttime with (test<br />
sessions 4 <strong>and</strong> 6) <strong>and</strong> without TACT seat vibration (test sessions 1-3, 5 <strong>and</strong> 7).<br />
CONCLUSIONS<br />
N U M B E R O F E V E N T S<br />
30<br />
20<br />
10<br />
0<br />
TACT TACT<br />
1 2 3 4 5 6 7<br />
T I M E O F N I G H T<br />
The results <strong>of</strong> <strong>the</strong> various driving simulation pilot studies indicated that, all tested <strong>technologies</strong><br />
show promise <strong>for</strong> <strong>monitoring</strong>/testing or preventing <strong>driver</strong> fatigue, respectively. However,<br />
particularly <strong>for</strong> fatigue <strong>monitoring</strong>, no single measure alone may be sensitive <strong>and</strong> reliable enough<br />
to quantify <strong>driver</strong> fatigue. Since alertness is a complex phenomenon, a multi-parametric<br />
approach needs to be used. Such a multi-sensor approach imposes challenges <strong>for</strong> online data<br />
interpretation. We suggest using a neural-fuzzy hybrid system <strong>for</strong> <strong>the</strong> automatic assessment <strong>of</strong><br />
complex data streams <strong>for</strong> <strong>driver</strong> fatigue. The final system output can <strong>the</strong>n be used to trigger <strong>the</strong><br />
activation <strong>of</strong> alertness countermeasures.<br />
86