Electric Power Demand Forecasting: A Case ... - Maxwell Science
Electric Power Demand Forecasting: A Case ... - Maxwell Science
Electric Power Demand Forecasting: A Case ... - Maxwell Science

You also want an ePaper? Increase the reach of your titles
YUMPU automatically turns print PDFs into web optimized ePapers that Google loves.
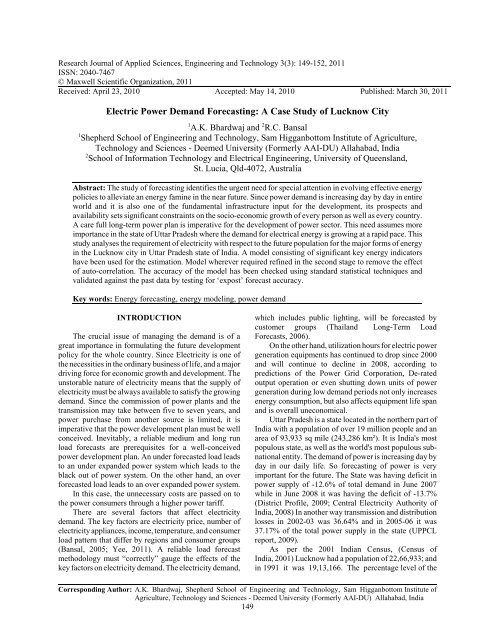
Research Journal of Applied <strong>Science</strong>s, Engineering and Technology 3(3): 149-152, 2011<br />
ISSN: 2040-7467<br />
© <strong>Maxwell</strong> Scientific Organization, 2011<br />
Received: April 23, 2010 Accepted: May 14, 2010 Published: March 30, 2011<br />
<strong>Electric</strong> <strong>Power</strong> <strong>Demand</strong> <strong>Forecasting</strong>: A <strong>Case</strong> Study of Lucknow City<br />
1 A.K. Bhardwaj and 2 R.C. Bansal<br />
1 Shepherd School of Engineering and Technology, Sam Higganbottom Institute of Agriculture,<br />
Technology and <strong>Science</strong>s - Deemed University (Formerly AAI-DU) Allahabad, India<br />
2 School of Information Technology and <strong>Electric</strong>al Engineering, University of Queensland,<br />
St. Lucia, Qld-4072, Australia<br />
Abstract: The study of forecasting identifies the urgent need for special attention in evolving effective energy<br />
policies to alleviate an energy famine in the near future. Since power demand is increasing day by day in entire<br />
world and it is also one of the fundamental infrastructure input for the development, its prospects and<br />
availability sets significant constraints on the socio-economic growth of every person as well as every country.<br />
A care full long-term power plan is imperative for the development of power sector. This need assumes more<br />
importance in the state of Uttar Pradesh where the demand for electrical energy is growing at a rapid pace. This<br />
study analyses the requirement of electricity with respect to the future population for the major forms of energy<br />
in the Lucknow city in Uttar Pradesh state of India. A model consisting of significant key energy indicators<br />
have been used for the estimation. Model wherever required refined in the second stage to remove the effect<br />
of auto-correlation. The accuracy of the model has been checked using standard statistical techniques and<br />
validated against the past data by testing for ‘expost’ forecast accuracy.<br />
Key words: Energy forecasting, energy modeling, power demand<br />
INTRODUCTION<br />
The crucial issue of managing the demand is of a<br />
great importance in formulating the future development<br />
policy for the whole country. Since <strong>Electric</strong>ity is one of<br />
the necessities in the ordinary business of life, and a major<br />
driving force for economic growth and development. The<br />
unstorable nature of electricity means that the supply of<br />
electricity must be always available to satisfy the growing<br />
demand. Since the commission of power plants and the<br />
transmission may take between five to seven years, and<br />
power purchase from another source is limited, it is<br />
imperative that the power development plan must be well<br />
conceived. Inevitably, a reliable medium and long run<br />
load forecasts are prerequisites for a well-conceived<br />
power development plan. An under forecasted load leads<br />
to an under expanded power system which leads to the<br />
black out of power system. On the other hand, an over<br />
forecasted load leads to an over expanded power system.<br />
In this case, the unnecessary costs are passed on to<br />
the power consumers through a higher power tariff.<br />
There are several factors that affect electricity<br />
demand. The key factors are electricity price, number of<br />
electricity appliances, income, temperature, and consumer<br />
load pattern that differ by regions and consumer groups<br />
(Bansal, 2005; Yee, 2011). A reliable load forecast<br />
methodology must “correctly” gauge the effects of the<br />
key factors on electricity demand. The electricity demand,<br />
which includes public lighting, will be forecasted by<br />
customer groups (Thailand Long-Term Load<br />
Forecasts, 2006).<br />
On the other hand, utilization hours for electric power<br />
generation equipments has continued to drop since 2000<br />
and will continue to decline in 2008, according to<br />
predictions of the <strong>Power</strong> Grid Corporation, De-rated<br />
output operation or even shutting down units of power<br />
generation during low demand periods not only increases<br />
energy consumption, but also affects equipment life span<br />
and is overall uneconomical.<br />
Uttar Pradesh is a state located in the northern part of<br />
India with a population of over 19 million people and an<br />
area of 93,933 sq mile (243,286 km²). It is India's most<br />
populous state, as well as the world's most populous subnational<br />
entity. The demand of power is increasing day by<br />
day in our daily life. So forecasting of power is very<br />
important for the future. The State was having deficit in<br />
power supply of -12.6% of total demand in June 2007<br />
while in June 2008 it was having the deficit of -13.7%<br />
(District Profile, 2009; Central <strong>Electric</strong>ity Authority of<br />
India, 2008) In another way transmission and distribution<br />
losses in 2002-03 was 36.64% and in 2005-06 it was<br />
37.17% of the total power supply in the state (UPPCL<br />
report, 2009).<br />
As per the 2001 Indian Census, (Census of<br />
India, 2001) Lucknow had a population of 22,66,933; and<br />
in 1991 it was 19,13,166. The percentage level of the<br />
Corresponding Author: A.K. Bhardwaj, Shepherd School of Engineering and Technology, Sam Higganbottom Institute of<br />
Agriculture, Technology and <strong>Science</strong>s - Deemed University (Formerly AAI-DU) Allahabad, India<br />
149
city with respect to the total population of U.P. was 2.22<br />
in 2001 and 2.09 in 1991 and also having 10th position<br />
rank wise in 1991. The maximum temperature during<br />
summer season is between 40 and 45ºC (District Profile,<br />
2009; Central <strong>Electric</strong>ity Authority of India, 2008).<br />
This study has studied the electric power demand<br />
forecast in 2023 corresponding to the city temperature<br />
with respect to the population in the Lucknow City which<br />
is the capital of “Uttar Pradesh” state of India (Bhardwaj,<br />
2010). Few research papers are written with respect to the<br />
population (Sharma, 2002) as well as temperature of the<br />
particular areas individually (Barakat, 1992).<br />
MATERIALS AND METHODS<br />
A power load survey was carried out from “ETI<br />
Transmission Sub-station” situated in west side of the<br />
Lucknow City, which is having in coming from the Grid.<br />
The survey was carried out in the month of June 2008.<br />
Estimate of population is based on the based data<br />
available as per the 2001 Indian Census also data<br />
available from the survey was taken as material of the<br />
forecasting.<br />
Single exponential smoothing technique is used in the<br />
process of forecasting because the error found in this<br />
process was under the acceptable limit of accuracy.<br />
Population calculation and load survey of Lucknow<br />
city:<br />
Population calculation: Growth rate is essential value to<br />
find the population in a specified year based on a<br />
particular time. The time frame can be defined between<br />
the standard base year and final year with respect to the<br />
time span of 9 months. Following formula can be<br />
suggested for growth rate calculation (Bhardwaj, 2009).<br />
N = B[{(100+G)/100} T -1] (1)<br />
where,<br />
N = Net increase in population between 2001 and 1991<br />
B = Base year value of 1991<br />
G = Growth rate<br />
T = Total period between 2001 and 1991<br />
So, growth rate = 1.28 %<br />
Since the correct data of 2008 is not available, so in<br />
this particular calculation we will take 2001 value as base<br />
year value and time span between 2001 and 2008 i.e.,<br />
9.34. The population in 2008 will be 25, 52,877 using the<br />
relation = B{(100+G)/100} T .<br />
In the similar calculation 32, 91,914 will be the<br />
population in 2023. In the case of 2023 we have also<br />
taken the base year value of 2001 and time periods<br />
between 2001 and 2023.<br />
Load survey: The Loads are taken from 220 kV sides of<br />
the transformers. As per the practical survey of Lucknow<br />
Res. J. Appl. Sci. Eng. Technol., 3(3): 149-152, 2011<br />
150<br />
Load (MVA)<br />
840<br />
800<br />
760<br />
720<br />
680<br />
640<br />
600<br />
560<br />
520<br />
2001 2002 2003 2004 2005 2006 2007 2008<br />
Year<br />
Fig. 1: Lucknow total load 2001-2008<br />
Load (MVA)<br />
2120<br />
2020<br />
1920<br />
1820<br />
1720<br />
1620<br />
1520<br />
1420<br />
1320<br />
1220<br />
1120<br />
1020<br />
920<br />
820<br />
720<br />
620<br />
Y=486.09e0.0645x 2<br />
R =0.9903<br />
520<br />
2001 2004 2007 2010 2013 2016 2019 2022<br />
Year<br />
Fig. 2: Lucknow forecast trend for 2023<br />
in the month of June 2008 following results are presented<br />
in Fig. 1.
Table 1: Total load and per capita demand of Lucknow<br />
Year Total load(MVA) Per capita demand(MVA)<br />
2001 524.7 2.31×10G 4<br />
2008 831.6 3.26×10G 4<br />
2023 2143 6.51×10G 4<br />
K<br />
3.5<br />
3<br />
2.5<br />
2<br />
1.5<br />
1<br />
0.5<br />
0<br />
-0.5<br />
Res. J. Appl. Sci. Eng. Technol., 3(3): 149-152, 2011<br />
2002<br />
2005<br />
2008<br />
2011<br />
2014<br />
2017<br />
2020<br />
2023<br />
Year<br />
Fig. 3: The values of K for Lucknow City<br />
As per the trend the net power demand in the year 2023<br />
will be 2143 MVA (Fig. 2). Table 1 shows the per capita<br />
demand for the Lucknow city.<br />
The model: The final modified model proposed<br />
(Bhardwaj, 2009) for consumption of electricity is of the<br />
following functional form<br />
ln ( Ei / Pi ) = K ln ( Eb / Pb ) – 3.48881 ln (T/10)<br />
–10.99549 ln {1/(Yi-Yb)} (2)<br />
where, ‘i’ and ‘b’ represents the values of corresponding<br />
subscripts to the ith year and that of the base year (2001)<br />
and E, P, Y and T are electricity demand, population,<br />
year, and absolute temperature of the city in ºC,<br />
respectively. The value of constant K can be obtained<br />
from Fig. 3.<br />
Analysis of model accuracy: In order to ascertain the<br />
accuracy of the above model, the plots comparing the<br />
actual consumption with the model estimation have been<br />
verified (Fig. 4). The plots illustrate acceptable level of<br />
accuracy of the model.<br />
151<br />
Load (MVA)<br />
850<br />
800<br />
750<br />
700<br />
650<br />
600<br />
550<br />
ACTUAL LOAD<br />
FORECAST LOAD<br />
500<br />
2001 2003 2005<br />
Year<br />
2007<br />
Fig. 4: Lucknow load comparison<br />
RESULTS AND DISCUSSION<br />
As per the analysis and forecasting of this long term<br />
planning, the net electric power demand estimation is<br />
2143 MVA. The results project the enormous capacity<br />
requirement for realizing the power demand by the year<br />
2023. The analysis gives result that the Lucknow has an<br />
increase of per capita demand approximate three times<br />
when compare with a constant maximum temperature,<br />
which we have taken i.e., 45ºC. However as per the<br />
Global warming report temperature will rise up to 3ºC till<br />
the year 2050.<br />
Long term planning is of a vital significance for the<br />
growth of power sector. The study emphasizes the urgent<br />
need for an effective long term planning for generation<br />
expansion to meet the state’s rapidly growing demand.<br />
The study indicates various options available nowadays to<br />
meet the power demand by 2023 i.e., increase additional<br />
generation capacity, reducing the present level of<br />
transmission and distribution losses, etc.<br />
In this study, a model has been verified which<br />
explains the demand of electrical energy till the year 2023<br />
in the Lucknow City. The model has been refined and<br />
validated to ensure consistency. Error of the forecast<br />
model has also been checked and that is found to be in the<br />
range with an average error of +0.08%. The model has<br />
been employed for forecasting the future energy<br />
requirement until 2023. The policy implications of the<br />
forecast results have been critically analyzed. The results<br />
identify the basis on which electricity energy planning can<br />
be carried out and emphasize the need for evolving<br />
effective strategies.
ACKNOWLEDGMENT<br />
The authors gratefully acknowledge the advice and<br />
help rendered by Shri B.P. Sharma (Retired) Dy. Director,<br />
Central <strong>Electric</strong>ity Authority, New Delhi, India in<br />
carrying out this study.<br />
REFERENCES<br />
Bansal, R.C. and J.C. Pandey, 2005. Load forecasting<br />
using artificial intelligence techniques: A literature<br />
survey. Int. J. Comput. Appl. T., 22(2-3): 109-119.<br />
Bhardwaj, A.K., 2010. <strong>Electric</strong> <strong>Power</strong> <strong>Demand</strong><br />
<strong>Forecasting</strong>: A <strong>Case</strong> Study of Kanpur City. National<br />
Seminar on Utilisation and reliability of power<br />
system: An Indian scenario organized by S I E T<br />
Allahabad (India). Retrieved from: http://www.<br />
dsal.uchicago.edu/reference/gazetteer<br />
/paper.html?objectid=DS405.1.134_V05_092.gif<br />
(Accessed date: January 16, 2010).<br />
Bhardwaj, A.K., A.K. Srivastava and R.C. Bansal, 2009.<br />
<strong>Electric</strong> power demand forecasting: A case study of<br />
agra and allahabad cities. <strong>Electric</strong>al India Magazine,<br />
49(10): 40-44.<br />
Barakat, E.H. and S.A. Al-Rashed, 1992. Long range<br />
peak demand forecasting under conditions of high<br />
growth. IEEE Trans. <strong>Power</strong> Sys., 7(4): 1483-1486.<br />
Res. J. Appl. Sci. Eng. Technol., 3(3): 149-152, 2011<br />
152<br />
Central <strong>Electric</strong>ity Authority of India, 2008. Government<br />
Website [Online]. Retrieved from: http://www.<br />
cea.nic.in/power_sec_reports/executive_summary/<br />
2008_07/25-26.pdf.<br />
District Profile, 2009. Government Website [Online]<br />
Available: Lucknow. Retrieved from: http://agra.<br />
nic.in/hist.htm.<br />
Census of India, 2001: Data from the 2001 Census,<br />
including cities, villages and towns. Census<br />
Commission of India. Government of India Website<br />
[Online] Available. Retrieved from: http://web.<br />
archive.org/web/20040616075334/www.censusindi<br />
a.net/results/town.php?stad=A&state5=999.<br />
(Accessed date: September 03, 2007).<br />
Sharma, D.P., P.S.C. Nair and R. Balasubramanian, 2002.<br />
<strong>Demand</strong> for commercial energy in the State of<br />
Kerala, India: An econometric analysis with mediumrange<br />
projection. Energ. Policy, 30: 781-791.<br />
Thailand Long-Term Load Forecasts, 2006. NIDA<br />
Consulting Center, National Institute of Development<br />
Administration Thailand, 08: 109-124.<br />
UPPCL report, 2009. Transmission and Distribution<br />
Losses during 10th five year Plan.<br />
Yee, S., R.C. Bansal, A.K. Bhardwaj and<br />
A.K. Srivastava. 2011. <strong>Electric</strong>ity market price<br />
forecasting using vector support machines. Int. J.<br />
Comput. Aided Eng. Technol., 3(1): 1-18.